
Fluorophores-Assisted Excitation Emission Matrix Fluorescence Method for the Origin Traceability of Lily
State Key Laboratory of Chemo/Biosensing and Chemometrics, College of Chemistry and Chemical Engineering, Hunan University, Changsha 410082, China
*
Authors to whom correspondence should be addressed.
Chemosensors 2023, 11(8), 426; https://doi.org/10.3390/chemosensors11080426
Submission received: 29 June 2023
/
Revised: 25 July 2023
/
Accepted: 30 July 2023
/
Published: 1 August 2023
(This article belongs to the Special Issue Bionic Recognition and Biosensors: A Theme Issue in Honor of Professor Hong-Yuan Chen)
Abstract
:In this work, a fluorophores-assisted excitation/emission matrix (EEM) fluorescence method was proposed to trace the origin of lily in the Chinese market. There are few active components in lilies that have fluorescent signals, and too few characteristic variables may lead to unsatisfactory accuracy in the subsequent classification. Therefore, three fluorophores, 2-Aminoethyl diphenylborinate (DPBA), o-Phthalaldehyde (OPA) and Rhodamine B (RB), were used to enrich the information of the fluorescent fingerprint of lily, which can improve the classification accuracy. The lily samples were characterized by using EEM fluorescence coupled with the alternating trilinear decomposition (ATLD) algorithm, which was able to extract information of various fluorophores in lily samples. Two chemical pattern recognition methods, principal component analysis-linear discriminant analysis (PCA-LDA) and partial least squares-discrimination analysis (PLS-DA), were used to model and trace the origin of different lilies. When the fluorophores were added, the accuracy of the test set and prediction set obtained by the classification model increased from 71.4% to 92.9% and 66.7% to 100%, respectively. The proposed method combined fluorophores-assisted EEM fluorescence with multi-way chemometric methods to extract comprehensive information on the samples, which provided a potential method for the origin traceability of traditional Chinese medicine.
1. Introduction
Lily, the dry fleshy scales of Lilium lamcifolium Thunb, Lilium broumii F.E. Brown var. viridulum Bake or Lilium pumilum DC., is a traditional Chinese medicine used for both medicine and food [1]. In recent years, the lily has received more and more attention in the fields of clinical medicine and health food. Its main active ingredients are steroidal saponins, phenolic acids, polysaccharides and so on [2,3,4]. It has anti-inflammatory, anti-tumor, anti-depression and anti-bacterial biological activity [5,6,7,8,9], among others. Therefore, the lily is widely used in clinical Chinese medicine formula and Chinese patent medicine. In China, lilies are grown in a wide range of areas, mainly in Hebei, Shanxi, Henan, Shaanxi, Hubei, Hunan, Jiangxi, Anhui and Zhejiang. The quality of the lily is affected by the growth environment, such as soil quality and climate, and there are large regional differences [10]. Qin et al. [11] have proved that the chemical components of lily grow in different regions and therefore result in there being huge differences between the lilies studied and collected from different origins. There are huge differences in the prices of lilies from different production areas, which has led to some unscrupulous traders making profits by pretending to have high quality lilies. However, in Hunan province and the surrounding area, lilies from different production areas are often sold together. The Longshan lily, as a geographical protection product, is usually counterfeited by lilies taken from other neighboring regions. Therefore, the traceability of lilies in a certain production area has significance, but their similarities will pose greater challenges to classification.
Traditional identification always relies on sensory indicators, such as appearance, color and smell, to realize the identification and analysis of origin and quality. As a result, a sensory evaluation that is based on manual experience cannot achieve fast and accurate detection. In addition to the traditional manual identification methods, a large number of strategies combining modern analytical instruments and chemometric methods have also been reported for the origin traceability and quality evaluation of the lily, such as high-performance capillary electrophoresis (HPCE) [12], near-infrared spectroscopy (NIR) [13], ultra-high performance liquid chromatography coupled with hybrid quadrupole time-of-flight mass spectrometry (UHPLC-QTOF-MS) [14], liquid chromatography-mass spectrometry-mass spectrometry (LC-MS-MS) [15], gas chromatography(GC) [16,17], etc.
Compared to other modern instruments, fluorescence has the advantages of a fast analysis speed, simple operation, low cost and high sensitivity. At the same time, the EEM fluorescence data generated by it contain more information than traditional fluorescence spectra, and it can be decomposed by multi-way analysis algorithms to obtain detailed qualitative and quantitative spectral information of analytes in complex systems [18]. The combination of EEM spectroscopy and chemometrics can give the component information of the samples and improve classification accuracy. However, the fluorescent composition of lilies has few fluorescent components, which presents a difficulty in fluorescent classification methods.
In this work, the ATLD algorithm was used to decompose the EEM fluorescence data of pure lilies. Then, PLS-DA and PCA-LDA were chosen to build classification models based on the proposed features, respectively. Due to the few extracted features, the built models may not trace the origin of lilies accurately. Thus, three fluorophores, 2-aminoethyl diphenylborinate (DPBA), o-Phthalaldehyde (OPA) and Rhodamine B (RB), were added to react with the lily samples to increase the qualitative information of the lily samples, so as to improve the classification accuracy of origin traceability. ATLD was used to decompose the obtained EEM fluorescent data of the lilies added with fluorophores. Then, PLS-DA and PCA-LDA were used to build classification models based on the extracted features, and the built models were also used to trace the origin of other lily samples. Finally, the origin traceability results obtained by the pure lilies and the lilies added with three fluorophores were compared to choose the best strategy. The specific workflow is shown in Figure 1.
2. Materials and Methods
2.1. Sample Collection and Preparation
Sixty lily samples from four different origins were collected, and the detailed information is summarized in Table 1. Firstly, the surface soil of the fresh lily bulb samples was washed with running water, then the lily scales were split into pieces, placed in 100 °C water for 5 min, removed and the water drained, before being dried with hot air at 60 °C, crushed, and then passed through an 80-mesh sieve to obtain lily powder.
Among the total of 60 lily samples, 9 samples were collected additionally as the prediction set to prove the practicality of the classification models. The remaining 51 samples were split into two parts by a random sampling method: 37 samples were selected as the training set to build models and optimize model parameters; and 14 samples were selected as the test set to test the classification performance of the established models.
An extract was prepared for each lily sample using the following method: 50 mg of the lily powder sample was placed in 2 mL of methanol aqueous solution (CH3OH:H2O = 6:4), ultrasonicated for 30 min, and then centrifuged at 4000 r/min for 10 min. Subsequently, 200 μL of the supernatant was placed into a 10 mL volumetric flask, which was then diluted to 10 mL with methanol aqueous solution (CH3OH:H2O = 6:4). For the lily supernatant with fluorophores, appropriate amounts of fluorophores were also added.
2.2. Chemicals and Reagents
L-Lysine, DL-Homocysteine, Chlorogenic acid, Kaempferol, 2-Aminoethyl diphenylborinate (DPBA), o-phthalaldehyde (OPA) and rhodamine B (RB) were purchased from Sigma-Aldrich. The methanol was chromatographic grade and purchased from OCEANPAK Company (Germany). Nitrogen standard solutions of Cu and Ca were purchased from the National Nonferrous Metals and Electronic Materials Analysis and Testing Center. Ultrapure water was produced by a Milli-Q instrument.
Firstly, 2.3 mg of DPBA, 5.8 mg of OPA and 4.6 mg of RB were weighed in 10 mL volumetric flasks and diluted with ultrapure water, respectively. After that, 40 μL of DPBA, 15 μL of OPA and 3 μL of RB solutions were added into each lily supernatant and diluted to 10 mL.
2.3. Instrument, Software and Their Parameters
The fluorescence detector used in this experiment is the Hitachi F-7000 fluorescence spectrophotometer. All samples were assayed using a 1.00 cm quartz cell. The instrument parameters are as follows: a test voltage of 700 V, scanning speed of 30,000 nm per minute and step size of 5 nm to obtain fluorescence signals in the excitation wavelength region of 200–600 nm and emission wavelength region of 250–650 nm; and the excitation and emission slit width is 5 nm.
All experimental data were processed in a MATLAB environment. PCA-LDA [19], PLS-DA [20,21], ATLD and other codes of this study were written by our group based on the original literature.. Data and other homemade codes pertaining to this study are available from the corresponding authors upon reasonable request.
2.4. Theory
2.4.1. Trilinear Component Model
The size of the EEM fluorescence data array generated by each sample is I × J, where I is the number of excitation wavelengths and J is the number of emission wavelengths. The stacking of K samples can obtain a three-way data matrix X(I × J × K), according to the theory of the trilinear component model, and the three-way array X (I × J × K) can be expressed as:
where i, j and k represent the excitation wavelength point, the emission wavelength point and the sample number, respectively; xijk is the element in X, which represents the fluorescence intensity under the corresponding i, j and k; N is the number of components in the system; and ain, bjn and ckn are the elements of three profile matrices (A, B and C), which record the excitation spectrum profile information, emission spectrum profile information and relative concentration information of each component, respectively.
2.4.2. Alternating Quadrilinear Decomposition
Wu et al. firstly proposed the Alternating Trilinear Decomposition (ATLD) algorithm [22]. The ATLD algorithm updates three profile matrices (A, B and C) by alternately minimizing the following three objective functions using the Moore–Penrose generalized inverse based on singular value decomposition:
The reason why ATLD is widely used is that it converges quickly and can still give accurate analytical results when the component numbers are overestimated. More detailed information and applications can be found in related references [22,23] and will not be repeated here. In this work, ATLD is used for the decomposition of the three-way EEM data array, thereby providing the qualitative and relative concentration information of all fluorophores with physical/chemical significance. Matrix A corresponds to the normalized excitation spectrum, matrix B corresponds to the normalized emission spectrum and matrix C corresponds to the relative concentration.
Partial least squares-discrimination analysis (PLS-DA) is a classical supervised classification method. When the number of variables is large and the number of samples is small, it is often a preferred option. Ten-fold cross-validation is often used to determine its model complexity, i.e., the number of latent variables. Its main modeling and prediction steps are as follows: (1) modeling process: set the Y-block as a dummy matrix with one-hot encoding, in which 1 means the sample belongs to the designated class and 0 means the opposite. Then, the PLS model for classification purposes can be built. (2) Prediction process: the test data matrix is used as the input, and then the attribution of the sample can be determined according to the return values based on the principle of maximum value.
PCA is an important method used for data dimensionality reduction and feature extraction. It applies the principle of variance maximization to project high-dimensional data into a low-dimensional data space to achieve the purpose of dimensionality reduction. LDA achieves sample classification by minimizing the intra-class variance and maximizing the inter-class variance after projection. When the above two methods are combined, then supervised classification-based principal components can be achieved.
To further evaluate the overall performance of the proposed classification models, the correct classification rate (CCR) was described as follows:
where each element ngg represents the number of samples belonging to class g and assigned to class g, G represents the number of classes and N represents the total number of samples.
For each class, Ture positive (TP) means positive samples were predicted to be positive by the model, Ture negative (TN) means negative samples were predicted to be negative by the model, False positive (FP) means negative samples were predicted to be positive by the model and False negative (FP) means positive samples were predicted to be negative by the model.
3. Results and Discussion
3.1. Experiment Principle
In order to improve the selectivity of the classification model for lilies from various origins, it is necessary to increase the fluorescence spectral information required for classification. Lilies contain many chemical active ingredients, such as steroidal saponins, phenolic acids, alkaloids, polysaccharides, amino acids and so on. Some active components have fluorescent signals while others have no fluorescent signals, and their EEM fluorescence spectroscopy is shown in Figure 2a. It can be seen from the figure that the endogenous fluorescent components in lilies are indeed relatively small, and it is difficult to provide sufficient information. Therefore, three fluorophores, DPBA, OPA and RB, were chosen to solve this problem. Their EEM fluorescence spectrum is shown in Figure 2b–d. DPBA is often used as a receptor to recognize sugar molecules. It can combine with some sugar molecules in lilies to form five-membered or six-membered rings, which leads to a shift in fluorescence peaks and a decrease in fluorescence intensity [24]. OPA is a common amino acid derivatization reagent which can react with the amino group on the amino acid in lilies to form a condensation product with strong fluorescence [25]. RB is a common fluorescent probe with a strong fluorescent signal. When it reacts with some anions and cations in the solution, the fluorescence intensity will change [26]. Many components in lilies do not have endogenous fluorescence, but they will interact with RB, such as L-Lysine, DL-Homocysteine, Cu2+, Ca2+, Chlorogenic acid and Kaempferol. Their effect on the fluorescence intensity of RB was also tested and the detailed information is shown in the Supplementary Material, Figure S1 and Table S1. On the basis of the fluorescence spectrum of pure lily, three fluorophores were combined to form a sensor array to obtain a fluorescent fingerprint with richer classification information of the lily, as shown in Figure 2e. Moreover, the peak intensities of pure lily (a), DPBA (b), OPA (c), RB (d) and fluorophores-lily (e) at different excitation/emission wavelengths were also listed in Table 2. It can be seen from the table that when three fluorescent probes reacted with lily, its peak intensities were not the linear sum of the four substances’ peak intensities, and some of the peak intensities (e.g., 225/330 nm and 260/565 nm) were also reduced. Meanwhile, the spectral changes of adding fluorophores and reactions were also analyzed, and the results are shown in the Supplementary Material, Figure S2. Those data results showed that three fluorophores interacted with substances in the lily, thus changing and enriching the fluorescence spectral signal of the lily.
3.2. Component Analysis and Origin Traceability of Lily
It can be seen from Figure 2a that the fluorescence signals of components in the lily overlapped significantly, and the direct modeling and classification based on the EEM fluorescence cannot accomplish the characterization and feature extraction of the fluorescent components in lily at the same time. In addition, Rayleigh scattering and Raman scattering in the spectrum will affect the trilinear structure of the EEM data. Firstly, the effect of Raman scattering was eliminated by subtracting the average value of three blank sample data, and then the interpolation method [27] was used to eliminate Rayleigh scattering. The whole process is shown in the Supplementary Material, Figure S3. Finally, ATLD was used to decompose the three-way fluorescence data array generated by the lily samples. The size of the three-way data array generated by 60 lily samples is 81 × 81 × 60. The Core Consistency Diagnostic (CORCONDIA) was used to estimate the number of components in the lily samples before ATLD decomposition. After calculation, the number of components in the lily is two, and the components here represent one or more real fluorescent molecules, which have similar structures and fluorescent properties. In addition, non-negative constraints are applied to all data in the calculation process to ensure reasonable results.
After ATLD decomposition, (a) the normalized excitation spectrum, (b) normalized emission spectrum and (c) relative concentration diagram of each component in the lily were shown in Figure 3. Component 1 presents its fluorescence peak at the excitation/emission wavelength of 335 (290)/425 nm. At the same time, the excitation spectrum has many shoulder peaks, which may be estimated to be ferulic acid and caffeic acid [28,29]. Component 2 presents its fluorescence peak at the excitation/emission wavelength of 280 (225)/330 nm, and the peak is relatively broad, which may be estimated to be catechin and epicatechin [30]. It can be seen that the decomposition of excitation and emission spectra by ATLD is useful for the characterization of active components in the lily. In addition, the relative concentration of each component reflects the concentration difference of this component among different lilies, which is an important basis for completing the origin traceability of lilies.
The lily EEM fluorescence data were obtained based on the pure lilies’ extract. After ATLD decomposition, the relative concentration information of two components (ATLD scores) was extracted for subsequent lily classification. Based on this, two classic chemometric classification algorithms, PLS-DA and PCA-LDA, were used to build classification models and realize the origin traceability of different lilies. Firstly, the parameters of the two models are optimized. The number of latent variables (LVs) for PLS-DA and the number of principal components (PCs) for PCA-LDA were optimized according to the best correct classification rates (CCRs) obtained by 10-fold cross-validation. The optimization process of LVs for PLS-DA and PCs for PCA-LDA has been shown in the Supplementary Material, Figure S4. When LVs = 1 and PCs = 1, PLS-DA and PCA-LDA models are the best, respectively. After that, the CCR of cross-validation for PLS-DA was 59.5%, and that of PCA-LDA was 48.7%. In addition, these models were used to validate the categories of training set samples and prediction set samples, and the results are summarized in Table 3. According to the results, the two models built by EEM for lily origin traceability could not meet expectations, which may be due to the fact that there are few fluorescent components in the lily. Figure 4a is the scores plot of PLS-DA. The corresponding scatter diagram is drawn by using the scores of the first two latent variables (LVs) of PLS-DA. From the figure, all kinds of lilies are mixed together and cannot be distinguished, which also proves that the model built by EEM cannot complete the classification task.
In order to solve the problem of insufficient fluorescence information in EEM, three fluorophores that can react with fluorescent substances in lilies are used. Firstly, a certain concentration of the three fluorophores was mixed with the pure lily sample solution, and then the EEM fluorescence data were obtained by the F-7000 fluorescence instrument, and the obtained EEM fluorescence spectrum was shown in the Figure 2e. Likewise, the Core Consistency Diagnostic (CORCONDIA) was used to estimate the number of components in the lily samples before the ATLD decomposition of the data. After calculation, when three fluorophores react with the lily, the number of components increased to five, which is just equal to three fluorophores plus two components in the pure lily. In addition, non-negativity constraints are also placed on all data during calculations to ensure reasonable results. Then, the ATLD algorithm is used to decompose the three-way fluorescence data, and the detailed decomposition results are shown in Figure 3d–f. In order to qualitatively analyze the decomposed components, they were compared with the fluorescence spectra of pure DPBA, pure OPA, pure RB and pure lily. The results show that when DPBA, OPA and RB reacted with lilies, the generated three-way fluorescence data array can be decomposed by ATLD to obtain five components, which correspond to the two components obtained from the pure lily samples and three fluorophores. Their spectra are almost in perfect agreement. At the same time, after the reaction of fluorophores with pure lily samples, the concentration information for some components without fluorescent response is also displayed in Figure 3f.
In F-EEM, DPBA-OPA-RB-Lily EEM fluorescence was obtained based on the lilies’ extract added with three fluorophores. After ATLD decomposition, the relative concentration information of all five components (ATLD scores) for the subsequent lily classification was extracted. Immediately after, PLS-DA and PCA-LDA were used to build classification models based on the obtained ATLD scores. Firstly, the parameters of the two models were optimized. The number of latent variables (LVs) for PLS-DA and the number of principal components (PCs) for PCA-LDA were optimized according to the best correct classification rate (CCR) obtained by 10-fold cross-validation. When LVs = 4 and PCs = 4, PLS-DA and PCA-LDA can achieve the best results, respectively. The cross-validation CCR of PLS-DA is 94.6%, and the cross-validation CCR of PCA-LDA is 89.2%. In addition, these models were also used to validate the classes of training set samples and test set samples, and the results are summarized in Table 3. The CCRs of the training set and test set obtained by the PLS-DA model are 94.6% and 97.3%, respectively. The CCRs of the training set and test set obtained by the PCA-LDA model are 89.2% and 94.6%, respectively. This shows that the proposed methods can realize the origin traceability of different types of lilies based on the fluorophores-assisted EEM fluorescence, and the obtained results are satisfactory. In order to externally validate the model, an additional 9 lily samples that were not involved in the modeling were collected as the prediction set, and the obtained CCRs were also satisfactory; the CCR of PLS-DA was 100.0% and the CCR of PCA-LDA was 88.9%. This also shows that the adaptability of the above models is satisfactory. In contrast, the model built by PLS-DA can trace the origin of lilies more accurately. In order to further understand the classification performance of the model built by PLS-DA, its detailed classification performance parameters, including the sensitivity and specificity of cross-validation and the training set and test set, are summarized in Table 4, and Table 5 lists the confusion matrix of the train set and test set. This is helpful for us to explore the main categories of misclassification. Figure 4b provides the scores plot of PLS-DA. The sample data can be visible based on the scores of the first two LVs of PLS-DA, which shows the distribution of different samples in a two-dimensional space. Figure 4 demonstrates that there is almost no overlap between different types of lilies, and lilies of the same type are basically clustered together, which also means that the classification model has good classification performance.
4. Conclusions
In this work, the combination of fluorophores-assisted EEM fluorescence and multi-way chemometrics was successfully applied to the characterization and origin traceability of lilies from different origins. The EEM fingerprint of pure lily contains less fluorescent information, and after ATLD decomposition, only two components with clear chemical meaning can be obtained. Too little classification information made the established classification model unable to complete the accurate origin traceability of the lily, and the CCRs were all lower than 71.4%. In order to solve this problem, three fluorophores which can react with lilies were chosen to enrich its EEM fingerprint. After decomposition by ATLD, the number of chemically meaningful components obtained increased to five. Compared to the classification models based on the EEM fluorescence data of pure lily extract, the classification accuracy of the classification model established by PLS-DA based on fluorophores-assisted EEM fluorescence data was greatly improved. The classification accuracies of cross-validation and the training set, test set and prediction set are all above 92.9%. The experimental results prove that when the studied sample contains endogenous fluorescence components, the qualitative information can be enriched by EEM scanning and adding appropriate fluorophores, thereby improving the accuracy of the built classification model. This F-EEM is expected to be more widely used in the rapid classification and authenticity identification of weakly fluorescent or even non-fluorescent systems.
Supplementary Materials
The following supporting information can be downloaded at: https://www.mdpi.com/article/10.3390/chemosensors11080426/s1, Figure S1: EEM fluorescence after removing scattering: (a) RB-L-Lysine; (b) RB-DL-Homocysteine; (c) RB-Cu2+; (d) RB-Ca2+; (e) RB-Chlorogenic acid; (f) RB-Kaempferol; (g) RB; Figure S2: EEM fluorescence after removing scattering: (a) DPBA; (b) OPA; (c) RB; (d) DPBA-lily; (e) OPA-lily; (f) RB-lily; (g) pure lily; Figure S3: The elimination of non-bilinear factor (Rayleigh scattering) for the EEM fluorescence data of fluorophores-lily: (a) raw data with visible Rayleigh scattering; (b) gapped data with scattering being removed in the regions; (c) repaired data fitted by an interpolation method; Figure S4: The number of latent variables (LVs) for PLS-DA and the number of principal components (PCs) for PCA-LDA were optimized according to the best correct classification rates (CCRs) obtained by 10-fold cross-validation: (a) Fluorophore-lily-PLS-DA; (b) Fluorophore-lily -PCA-LDA; (c) Lily-PLS-DA; (d) Lily-PCA-LDA; Table S1: The intensities of pure RB and RB added with different chemical components at different excitation/emission wavelength.
Author Contributions
H.F.: Investigation, writing—original draft preparation, writing—review and editing. H.W.: conceptualization, methodology, funding acquisition. T.W.: Methodology, validation, funding acquisition. Y.C.: Investigation, conceptualization, validation. R.Y.: Methodology, supervision. All authors have read and agreed to the published version of the manuscript.
Funding
This research was funded by the National Natural Science Foundation of China under Grant (No. 22174036, No. 21775039 and No. 22204049).
Institutional Review Board Statement
Not applicable.
Informed Consent Statement
Not applicable.
Data Availability Statement
Not applicable.
Conflicts of Interest
The authors declare no conflict of interest.
References
- Pharmacopoeia, C. Commission. In Pharmacopoeia of the People’s Republic of China; China Medical Science Press: Beijing, China, 2010. [Google Scholar]
- Chau, C.F.; Wu, S.H. The development of regulations of Chinese herbal medicines for both medicinal and food uses. Trends Food Sci. Technol. 2006, 17, 313–323. [Google Scholar] [CrossRef]
- Hou, Y.; Jiang, J.G. Origin and concept of medicine food homology and its application in modern functional foods. Food Funct. 2013, 4, 1727–1741. [Google Scholar] [CrossRef]
- Wang, P.; Li, J.; Attia, F.A.K.; Kang, W.; Wei, J.; Liu, Z.; Li, C. A critical review on chemical constituents and pharmacological effects of Lilium. Food Sci. Hum. Wellness 2019, 8, 330–336. [Google Scholar] [CrossRef]
- Mimaki, Y.; Nakamura, O.; Sashida, Y.; Satomi, Y.; Nishino, A.; Nishino, H. Steroidal saponins from the bulbs of Lilium longiflorum and their antitumour-promoter activity. Phytochemistry 1994, 37, 227–232. [Google Scholar] [CrossRef] [PubMed]
- Nakamura, O.; Mimaki, Y.; Nishino, H.; Sashida, Y. Steroidal saponins from the bulbs of Lilium speciosum x L. nobilissimum ‘Star Gazer’and their antitumour-promoter activity. Phytochemistry 1994, 36, 463–467. [Google Scholar] [CrossRef]
- Zhou, J.; An, R.; Huang, X. Genus Lilium: A review on traditional uses, phytochemistry and pharmacology. J. Ethnopharmacol. 2021, 270, 113852. [Google Scholar] [CrossRef]
- Wang, H.Q.; Liu, H.T.; Wang, L.; Min, L.; Chen, B.; Li, H. Uncovering the active components, prospective targets, and molecular mechanism of Baihe Zhimu decoction for treating depression using network pharmacology-based analysis. J. Ethnopharmacol. 2021, 281, 114586. [Google Scholar] [CrossRef]
- Hui, H.; Li, X.; Jin, H.; Yang, X.; Xin, A.; Zhao, R.; Qin, B. Structural characterization, antioxidant and antibacterial activities of two heteropolysaccharides purified from the bulbs of Lilium davidii var. unicolor Cotton. Int. J. Biol. Macromol. 2019, 133, 306–315. [Google Scholar] [CrossRef]
- Rong, L.; Lei, J.; Wang, C. Collection and evaluation of the genus Lilium resources in Northeast China. Genet. Resour. Crop Evol. 2011, 58, 115–123. [Google Scholar] [CrossRef]
- Qin, K.; Fang, Q.; Cai, H.; Chen, Z.; Yang, G.; Cai, B. Analysis of chemical components in Baihe Zhimu Tang and its single herbs by high performance liquid chromatography-electrospray ionization-mass spectrometry. Chin. J. Anal. Chem. 2009, 37, 1759–1764. [Google Scholar]
- Restaino, O.F.; De Rosa, M.; Schiraldi, C. High-performance capillary electrophoresis to determine intact keratan sulfate and hyaluronic acid in animal origin chondroitin sulfate samples and food supplements. Electrophoresis 2020, 41, 1740–1748. [Google Scholar]
- Long, W.J.; Hu, Z.; Wei, L.; Chen, H.; Liu, T.; Wang, S.; Guan, Y.; Yang, X.; Yang, J.; Fu, H.Y. Accurate identification of the geographical origins of lily using near-infrared spectroscopy combined with carbon dot-tetramethoxyporphyrin nanocomposite and chemometrics. Spectrochim. Acta A 2022, 271, 120932. [Google Scholar] [CrossRef]
- Long, W.J.; Wang, S.; Hai, C.; Chen, H.; Gu, H.W.; Yin, X.L.; Yang, J.; Fu, H.Y. UHPLC-QTOF-MS-based untargeted metabolomics revealing the differential chemical constituents and its application on the geographical origins traceability of lily bulbs. J. Food Compos. Anal. 2023, 118, 105194. [Google Scholar] [CrossRef]
- Bian, Y.; Zheng, R.; Bayer, F.P.; Wong, C.; Chang, Y.C.; Meng, C.; Zolg, D.P.; Reinecke, M.; Zecha, J.; Wiechmann, S. Robust, reproducible and quantitative analysis of thousands of proteomes by micro-flow LC–MS/MS. Nat. Commun. 2020, 11, 157. [Google Scholar] [CrossRef] [PubMed] [Green Version]
- Ferreira, D.C.; Hernandes, K.C.; Nicolli, K.P.; Souza-Silva, É.A.; Manfroi, V.; Zini, C.A.; Welke, J.E. Development of a method for determination of target toxic carbonyl compounds in must and wine using HS-SPME-GC/MS-SIM after preliminary GC× GC/TOFMS analyses. Food Anal. Method. 2019, 12, 108–120. [Google Scholar] [CrossRef]
- Zhang, S.; Wang, H.; Zhu, M.J. A sensitive GC/MS detection method for analyzing microbial metabolites short chain fatty acids in fecal and serum samples. Talanta 2019, 196, 249–254. [Google Scholar] [CrossRef]
- Fang, H.; Wu, H.L.; Wang, T.; Long, W.J.; Chen, A.Q.; Ding, Y.J.; Yu, R.Q. Excitation-emission matrix fluorescence spectroscopy coupled with multi-way chemometric techniques for characterization and classification of Chinese lager beers. Food Chem. 2021, 342, 128235. [Google Scholar]
- Lenhardt, L.; Bro, R.; Zeković, I.; Dramićanin, T.; Dramićanin, M.D. Fluorescence spectroscopy coupled with PARAFAC and PLS DA for characterization and classification of honey. Food Chem. 2015, 175, 284–291. [Google Scholar] [CrossRef] [PubMed]
- Oh, S.K.; Yoo, S.H.; Pedrycz, W. Design of face recognition algorithm using PCA-LDA combined for hybrid data pre-processing and polynomial-based RBF neural networks: Design and its application. Expert Syst. Appl. 2013, 40, 1451–1466. [Google Scholar] [CrossRef]
- Fisher, R.A. The use of multiple measurements in taxonomic problems. Ann. Hum. Genet. 1936, 7, 179–188. [Google Scholar] [CrossRef]
- Wu, H.L.; Shibukawa, M.; Oguma, K. An alternating trilinear decomposition algorithm with application to calibration of HPLC–DAD for simultaneous determination of overlapped chlorinated aromatic hydrocarbons. J. Chemom. 1998, 12, 1–26. [Google Scholar] [CrossRef]
- Qing, X.D.; Zhou, H.B.; Zhang, X.H.; Wu, H.L.; Chen, C.Y.; Xu, S.W.; Li, S.S. Alternating trilinear decomposition of highly overlapped chromatograms for simultaneously targeted quantification of 15 PAHs in samples of pollution source. Microchem. J. 2019, 146, 742–752. [Google Scholar] [CrossRef]
- Arimori, S.; Bosch, L.I.; Ward, C.J.; James, T.D. A D-glucose selective fluorescent internal charge transfer (ICT) sensor. Tetrahedron Lett. 2002, 43, 911–913. [Google Scholar] [CrossRef]
- Wagner, B.D.; McManus, G.J. Enhancement of the fluorescence and stability of o-phthalaldehyde-derived isoindoles of amino acids using hydroxypropyl-β-cyclodextrin. Anal. Biochem. 2003, 317, 233–239. [Google Scholar]
- Elcoroaristizabal, S.; Callejón, R.M.; Amigo, J.M.; Ocaña-González, J.A.; Morales, M.L.; Ubeda, C. Fluorescence excitation–emission matrix spectroscopy as a tool for determining quality of sparkling wines. Food Chem. 2016, 206, 284–290. [Google Scholar] [CrossRef] [PubMed]
- Bahram, M.; Bro, R.; Stedmon, C.; Afkhami, A. Handling of Rayleigh and Raman scatter for PARAFAC modeling of fluorescence data using interpolation. J. Chemom. 2006, 20, 99–105. [Google Scholar] [CrossRef]
- del Ácido Protocatéquico, E.A.; y el Ácido Caféico, Á.F. Antioxidant effects of protocatechuic acid, ferulic acid, and caffeic acid in human neutrophils using a fluorescent substance. Int. J. Morphol. 2010, 28, 911–920. [Google Scholar]
- Wang, L.; Wu, H.L.; Yin, X.L.; Hu, Y.; Gu, H.W.; Yu, R.Q. Simultaneous determination of umbelliferone and scopoletin in Tibetan medicine Saussurea laniceps and traditional Chinese medicine Radix angelicae pubescentis using excitation-emission matrix fluorescence coupled with second-order calibration method. Spectrochim. Acta A 2017, 170, 104–110. [Google Scholar]
- Senanayake, S.N. Green tea extract: Chemistry, antioxidant properties and food applications—A review. J. Funct. Foods 2013, 5, 1529–1541. [Google Scholar] [CrossRef]
Figure 1.
The workflow of experiment.
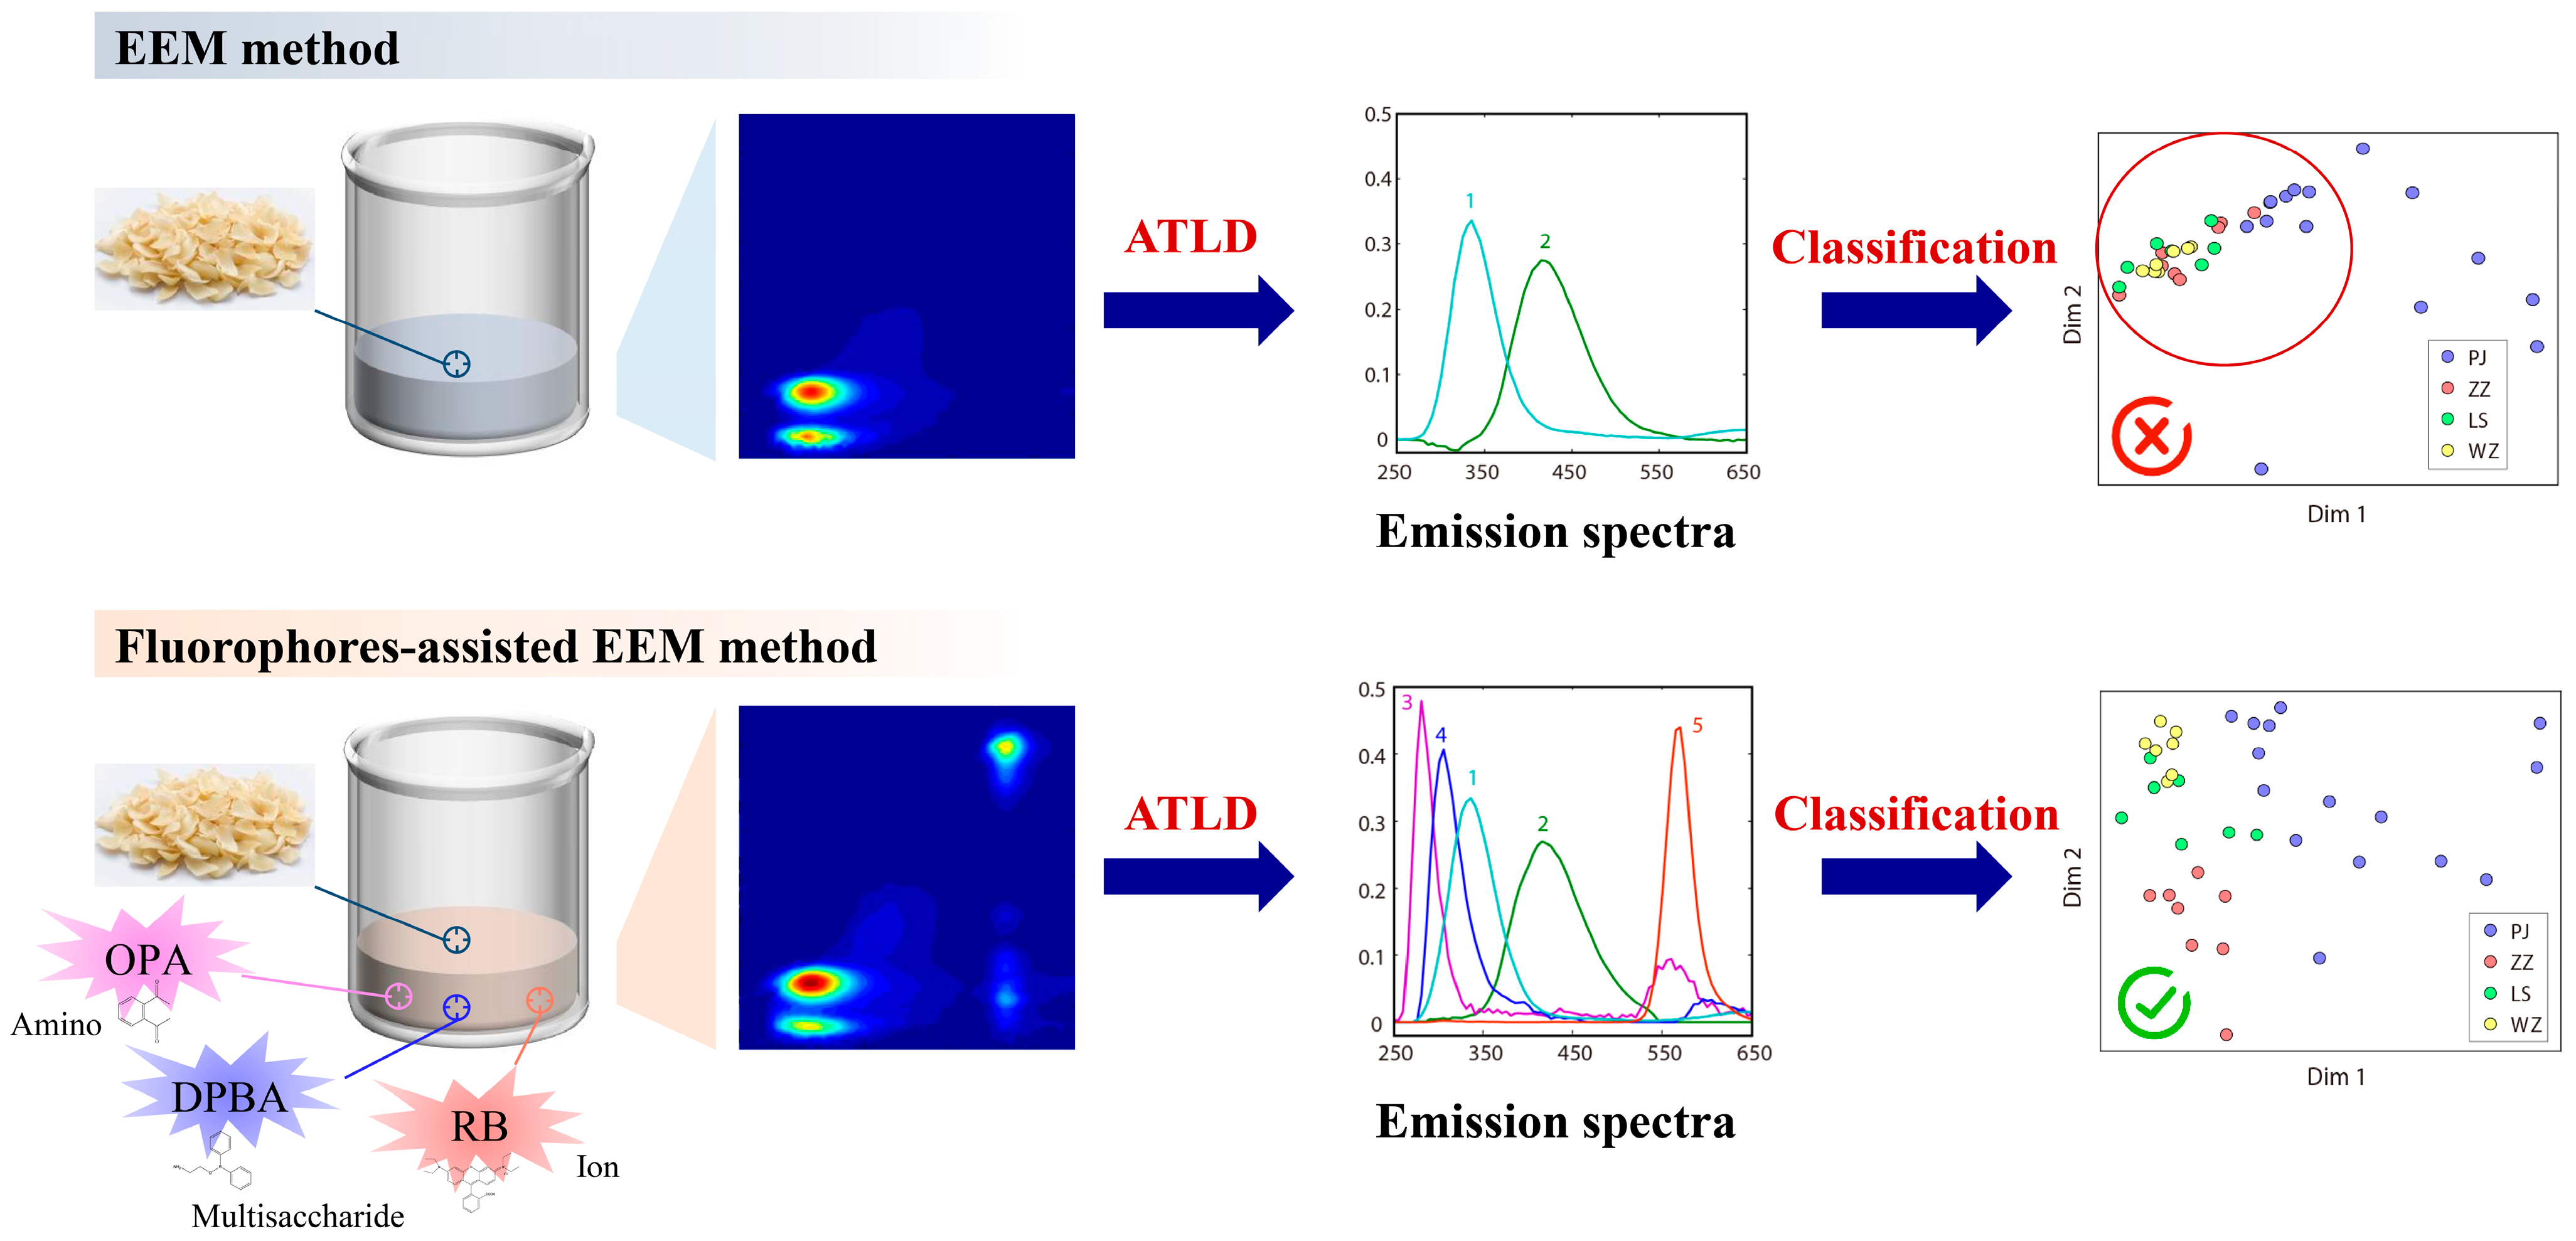
Figure 2.
EEM fluorescence after removing scattering: (a) pure lily; (b) DPBA; (c) OPA; (d) RB; (e) fluorophores-lily.
Figure 2.
EEM fluorescence after removing scattering: (a) pure lily; (b) DPBA; (c) OPA; (d) RB; (e) fluorophores-lily.

Figure 3.
The resolved (a) normalized excitation profiles of pure lily; (b) normalized emission profiles of pure lily; (c) relative concentration profiles of pure lily; (d) normalized excitation profiles of fluorophores-lily; (e) normalized emission profiles of fluorophores-lily; (f) relative concentration profiles of fluorophores-lily by ATLD algorithm.
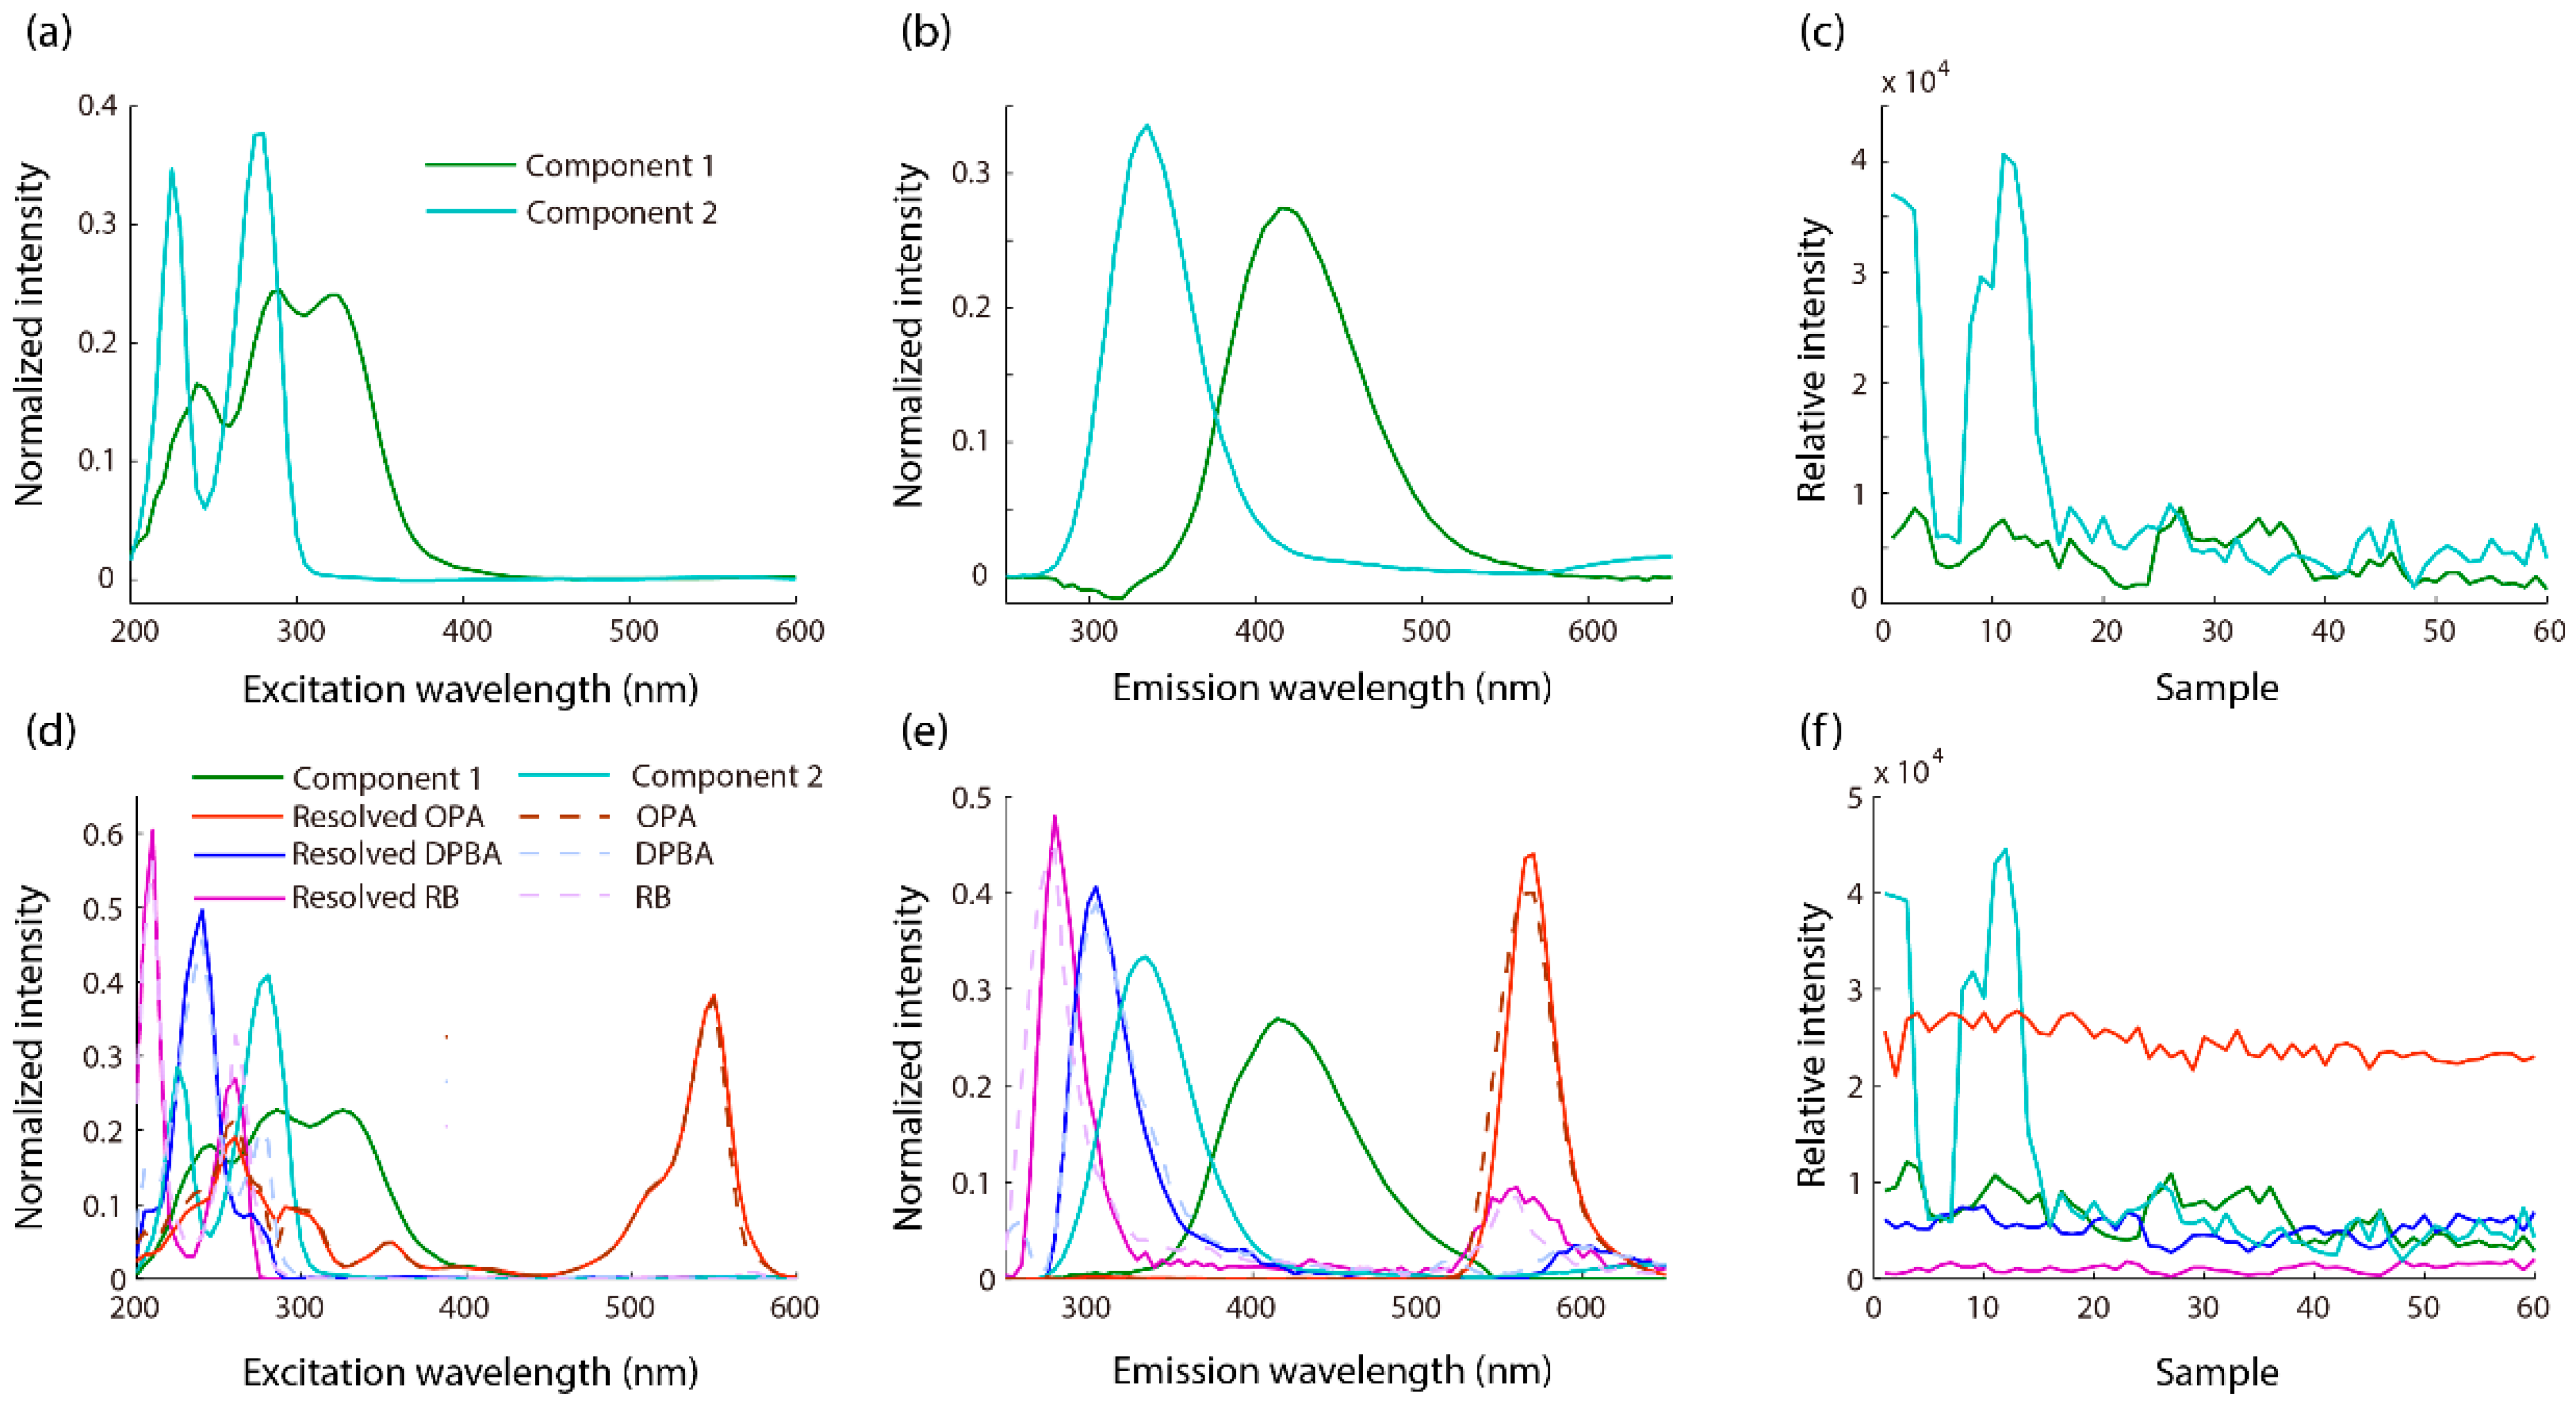
Figure 4.
The plots of the scores based on the first two latent variables (LVs) of PLS-DA in EEM (a) and F-EEM (b).
Figure 4.
The plots of the scores based on the first two latent variables (LVs) of PLS-DA in EEM (a) and F-EEM (b).


Table 1.
Information of lily samples.
| Place of Origin | Variety | Sample Size |
|---|---|---|
| Pingjiang, Hunan province (PJ) a | Long Ya lily (annual) | 24 |
| Zhuzhou, Hunan Province. (ZZ) | Unknown | 13 |
| Longshan, Hunan Province. (LS) | Long Yu lily | 12 |
| Wanzai, Jiangxi Province. (WZ) | long Ya lily | 11 |
a Abbreviations of places of origin are presented in the parentheses. Pingjiang: PJ, Zhuzhou: ZZ, Longshan: LS, Wanzai: WZ.
Table 2.
The peak intensities of pure lily, DPBA, OPA and RB at different excitation/emission wavelengths.
Table 2.
The peak intensities of pure lily, DPBA, OPA and RB at different excitation/emission wavelengths.
| Subgraph in Figure 2 | 280/330 nm | 225/330 nm | 335/425 nm | 260/565 nm | 550/565 nm |
|---|---|---|---|---|---|
| a | 4604 | 4503 | 364.2 | 113.1 | 3.055 |
| b | 311.9 | 572.4 | 33.72 | 79.44 | 3.850 |
| c | 99.97 | 187.8 | 56.85 | 157.2 | 3.202 |
| d | 97.41 | 155.1 | 37.99 | 1970 | 3475 |
| e | 5450 | 3810 | 564.6 | 2079 | 4192 |
Table 3.
CCR (%) of cross-validation and each dataset, parameters (LVs for PLS-DA, PCs for PCA-LDA) of each classification model.
Table 3.
CCR (%) of cross-validation and each dataset, parameters (LVs for PLS-DA, PCs for PCA-LDA) of each classification model.
| Method | PLS-DA | PCA-LDA | ||||||||
|---|---|---|---|---|---|---|---|---|---|---|
| LVs | CV | Training | Test | Pre | PCs | CV | Training | Test | Pre | |
| EEM | 1 | 59.5 | 67.6 | 71.4 | 66.7 | 1 | 48.7 | 56.8 | 50.0 | 66.7 |
| F-EEM | 4 | 94.6 | 97.3 | 92.9 | 100.0 | 4 | 89.2 | 94.6 | 92.9 | 88.9 |
Table 4.
Sensitivity and specificity of cross-validation and each dataset obtained by PLS-DA based on F-EEM.
Table 4.
Sensitivity and specificity of cross-validation and each dataset obtained by PLS-DA based on F-EEM.
| Model Validation | CCR (%) | Sensitivity a | Specificity b | ||||||
|---|---|---|---|---|---|---|---|---|---|
| PJ | ZZ | LS | WZ | PJ | ZZ | LS | WZ | ||
| Cross-validation | 94.6 | 93.3 | 100.0 | 85.7 | 100.0 | 100.0 | 96.6 | 100.0 | 96.7 |
| Training set | 97.3 | 100.0 | 100.0 | 85.7 | 100.0 | 100.0 | 100.0 | 100.0 | 96.7 |
| Test set | 92.9 | 100.0 | 100.0 | 66.7 | 100.0 | 100.0 | 100.0 | 100.0 | 90.9 |
a The sensitivity is equal to TP/(TP + FN), TP means true positives and FN means false negatives. b The specificity is equal to TN/(TN + FP), TN means true negatives and FP means false positives.
Table 5.
Confusion matrix of train set and test set obtained by PLS-DA based on F-EEM.
| Train Set | TEST SET | ||||||||
|---|---|---|---|---|---|---|---|---|---|
| Predicted | Predicted | ||||||||
| PJ | ZZ | LS | WZ | PJ | ZZ | LS | WZ | ||
| Actual | PJ | 15 | 0 | 0 | 0 | 5 | 0 | 0 | 0 |
| ZZ | 0 | 8 | 0 | 0 | 0 | 3 | 0 | 0 | |
| LS | 0 | 0 | 6 | 1 | 0 | 0 | 2 | 1 | |
| WZ | 0 | 0 | 0 | 7 | 0 | 0 | 0 | 3 | |
Disclaimer/Publisher’s Note: The statements, opinions and data contained in all publications are solely those of the individual author(s) and contributor(s) and not of MDPI and/or the editor(s). MDPI and/or the editor(s) disclaim responsibility for any injury to people or property resulting from any ideas, methods, instructions or products referred to in the content. |
© 2023 by the authors. Licensee MDPI, Basel, Switzerland. This article is an open access article distributed under the terms and conditions of the Creative Commons Attribution (CC BY) license (https://creativecommons.org/licenses/by/4.0/).
Share and Cite
MDPI and ACS Style
Fang, H.; Wu, H.; Wang, T.; Chen, Y.; Yu, R. Fluorophores-Assisted Excitation Emission Matrix Fluorescence Method for the Origin Traceability of Lily. Chemosensors 2023, 11, 426. https://doi.org/10.3390/chemosensors11080426
AMA Style
Fang H, Wu H, Wang T, Chen Y, Yu R. Fluorophores-Assisted Excitation Emission Matrix Fluorescence Method for the Origin Traceability of Lily. Chemosensors. 2023; 11(8):426. https://doi.org/10.3390/chemosensors11080426
Chicago/Turabian StyleFang, Huan, Hailong Wu, Tong Wang, Yao Chen, and Ruqin Yu. 2023. "Fluorophores-Assisted Excitation Emission Matrix Fluorescence Method for the Origin Traceability of Lily" Chemosensors 11, no. 8: 426. https://doi.org/10.3390/chemosensors11080426
Note that from the first issue of 2016, this journal uses article numbers instead of page numbers. See further details here.