
Improved Microelectrode Array Electrode Design for Heavy Metal Detection

State Key Laboratory of Fluid Power & Mechatronic Systems, Zhejiang University, Hangzhou 310027, China
*
Author to whom correspondence should be addressed.
Chemosensors 2024, 12(4), 51; https://doi.org/10.3390/chemosensors12040051
Submission received: 26 January 2024
/
Revised: 19 March 2024
/
Accepted: 26 March 2024
/
Published: 28 March 2024
(This article belongs to the Special Issue Advances in Electrochemical Sensing and Analysis)
Abstract
:Traditional working electrodes are not sufficient to realize the low detection limit and wide detection range necessary for the detection of heavy metals. In this study, a microelectrode array electrode was proposed using a design scheme based on microelectromechanical systems that was optimized with finite element software. The working electrode adopted an innovative composite structure to realize the integrated design of the working and counter electrodes, which improved the system integration. Performance tests showed that the electrode realized the quantitative analysis of Cd(II), Pb(II), and Cu(II) with a low detection limit (0.1 μg/L) and a wide detection range (0.1–3000 μg/L). The electrode successfully measured the lead and copper ion concentrations in the Sanya River, including both seawater and freshwater environments. The experimental results demonstrate that the electrode exhibits excellent adaptability to environmental conditions and can be potentially applied for technical support in environmental monitoring and sewage treatment.
1. Introduction
Heavy metal pollution is a global environmental problem that poses a major threat to human health and the safety and stability of marine ecosystems [1,2,3]. Heavy metals readily accumulate in particulate matter and sediments through processes such as adsorption, complexation, ion exchange, and precipitation. These heavy metal ions are released when the water body is disturbed and can enter the food chain through bioconcentration and biomagnification by phytoplankton and animals, ultimately posing a threat to human health [4,5,6]. In recent years, with the rapid development of a modernized economy and society, industrial wastewater and domestic sewage have been discharged directly or through rivers into the sea, posing a great threat to the safety and stability of ecosystems. These heavy metals are highly toxic and resistant to reduction and degradation, thus becoming a major contributor to global environmental crises [7,8,9,10].
Dissolved voltammetry is currently the most widely used technique for the electrochemical analysis of trace metals and trace metal monitoring. The method can directly measure the metal content of water samples in the presence of dissolved oxygen [11,12]. Electrode design is essential in improving the stability and accuracy of dissolved voltammetry detection. In recent years, many scholars have focused on the design and investigation of new electrodes [13,14]. With the development of micromachining, microelectrodes have become indispensable as working electrodes in electrochemical analysis [15,16]. Compared with traditional large electrodes, microelectrodes have many advantages, including a relatively high current density, fast mass transfer rate, low time constant, high signal-to-noise ratio, and low IR drop [17,18,19]. In addition, due to the smaller size of microelectrodes, a smaller sample volume is required, eliminating the need for bulky or complex pretreatment and injection systems for actual detection [20].
Although microelectrodes have many advantages, the current value of a single microelectrode is small, which necessitates a detection system with high accuracy. When the detection accuracy is insufficient, multiple microelectrodes can usually be connected in parallel or formed into arrays to increase the current strength and improve the detection accuracy [21]. By connecting multiple microelectrodes in parallel, the current values can be superimposed, increasing the total current strength and improving the stability and reliability of the signal. This method addresses the higher detection accuracy needed while expanding the application range of the microelectrodes [22].
However, most currently available electrode designs suffer from a narrow detection range or low sensitivity. For use in the detection of complex and variable environmental samples, the electrode would need to provide high sensitivity over a wide detection range.
By designing microelectrodes with innovative structures, the detection range and sensitivity of dissolution voltammetry tests can be simultaneously improved, providing a new option for the monitoring and control of heavy metal pollution. Performance tests showed that the developed electrode realized the quantitative analysis of Pb(II), and Cu(II) with a low detection limit (0.1 μg/L) and a wide detection range (0.1–3000 μg/L). The electrode successfully measured the lead and copper ion concentrations in the Sanya River, including both seawater and freshwater environments. The experimental results demonstrate that the electrode exhibits excellent adaptability to environmental conditions and can potentially be applied for technical support in environmental monitoring and sewage treatment.
2. Materials and Methods
2.1. Design Calculations for Electrodes
The measurement loop mainly focused on the polarization currents of the working and counter electrode loops [23,24]. Thus, a composite electrode structure consisting of working and counter electrodes was used in this study to investigate the electric field and current density distributions of the electrodes [25].
The electrode consisted of a microporous array working electrode, a counter electrode, a working electrode junction pad, and a counter electrode junction pad (Figure 1a,b). The two junction pads were connected by a wire to the control circuit board. As shown in Figure 1, the microelectrode array electrode was designed in square (a) and circular (b) arrangements.
For the square electrode (Figure 1a), the working and counter electrodes of the microporous arrays were rectangular. The working electrode had 300·5 μm microporous holes, and the counter electrode was located on one side with a width of 0.15 mm.
The circular arrangement of the electrode consisted of microporous working electrodes arranged in a circle (Figure 1b), while the counter electrode formed a ring around the working electrodes. The working electrodes contained 300·5 μm micropores, and the width of the counter electrode ring was 0.15 mm.
To compare the properties of both electrode structures, the Comsol Multiphysics 6.1 finite element analysis software was used to study their electric field strength and current density distributions. In the simulation analysis, the effective area of the working electrode was the same for both electrode structures, and a solution with the same dielectric constant was selected. The same voltage (1 V for the working electrode and 0 V for the counter electrode) was applied to the working and counter electrodes. The simulation results of the two electrodes are shown in Figure 1c,d.
The use of a square electrode led to obvious changes in the distribution of the electric field strength and current density in the solution (Figure 1c,d). A larger distribution of the electric field strength and current density between the working and counter electrodes with the same orientation and a smaller distribution farther away from the parallel relative position was observed. This prevented a uniform and consistent electrocatalytic effect for the test article measured on the working electrode. The circular electrode, in contrast, had a more uniform and consistent distribution of the electric field strength and current density in the solution, providing a more uniform and consistent electrocatalytic effect for the objects measured on the working electrode, enabling a better measurement effect.
2.2. Detailed Structural Design of the Microelectrode Array Electrode
After calculation and simulation calibration, a detailed structural design of the microelectrode array electrode was obtained (Figure 1e). The 200 μm Si base served as the foundation for chip processing, following the direction indicated by the arrow from bottom to top. A 200 nm SiO2 insulating layer was employed to isolate the connection between the metal layer and the base, while a 20 nm Ti adhesive layer facilitated a smooth transition between the metal and insulating layers. The electrochemical reaction layer of the chip included a 200 nm Ir conductive layer. Etched with a microporous array working electrode, the 200 nm SiO2 insulating layer defined the electrode area. Surrounding this working electrode, an SU8 photoresist stop ring was applied to enclose it and protect against fouling, while its interior was filled with gel.
The number of microvias was 300, and all center-to-center spacings (d) were chosen to satisfy the criterion of d = 23r (where r is the radius of the Ir microdisks) to prevent the overlap of the diffusion layers [26]. A 200-μm-thick SU-8 layer was coated around the Ir microdisk array using photolithography as a protective ring for the agarose gel antifouling film. The use of a gel protective layer can prevent the electrode’s surface from becoming contaminated and effectively extend its effective working time [25].
2.3. Processing of Composite Electrodes for Microelectrode Arrays
- (1)
- A silicon wafer was selected as the substrate and cleaned until it reached the processing standard.
- (2)
- The SiO2 insulating layer was deposited using plasma-enhanced chemical vapor deposition as the underlying insulating layer for the sensor.
- (3)
- Using an ion sputtering apparatus, a 20 nm Ti adhesion layer and a 200 nm Ir electrode layer were sequentially percolated on the substrate, using the substrate as a specimen.
- (4)
- A SiO2 insulating layer was deposited using plasma-enhanced chemical vapor deposition as an insulating layer for the sensor.
- (5)
- A 150-μm-thick SU-8 photoresist ring was printed around the periphery of the microporous array working electrode as a protective ring for the gel plating layer (Figure 2).
- (6)
- Using a silicon knife, the wafer was cut to obtain individual electrode chips (Figure 3a).
- (7)
- The gold wire was led out from the chip pad, press-soldered to the pad on the PCB, and sealed with epoxy resin to complete the sensor package (Figure 3b).
Figure 2.
Electrode chip processing: (a) silicon substrate cleaning; (b) underlying silicon nitride deposition; (c) metal layer processing; (d) surface insulating layer; (e) SU-8 photoresist processing.
Figure 2.
Electrode chip processing: (a) silicon substrate cleaning; (b) underlying silicon nitride deposition; (c) metal layer processing; (d) surface insulating layer; (e) SU-8 photoresist processing.
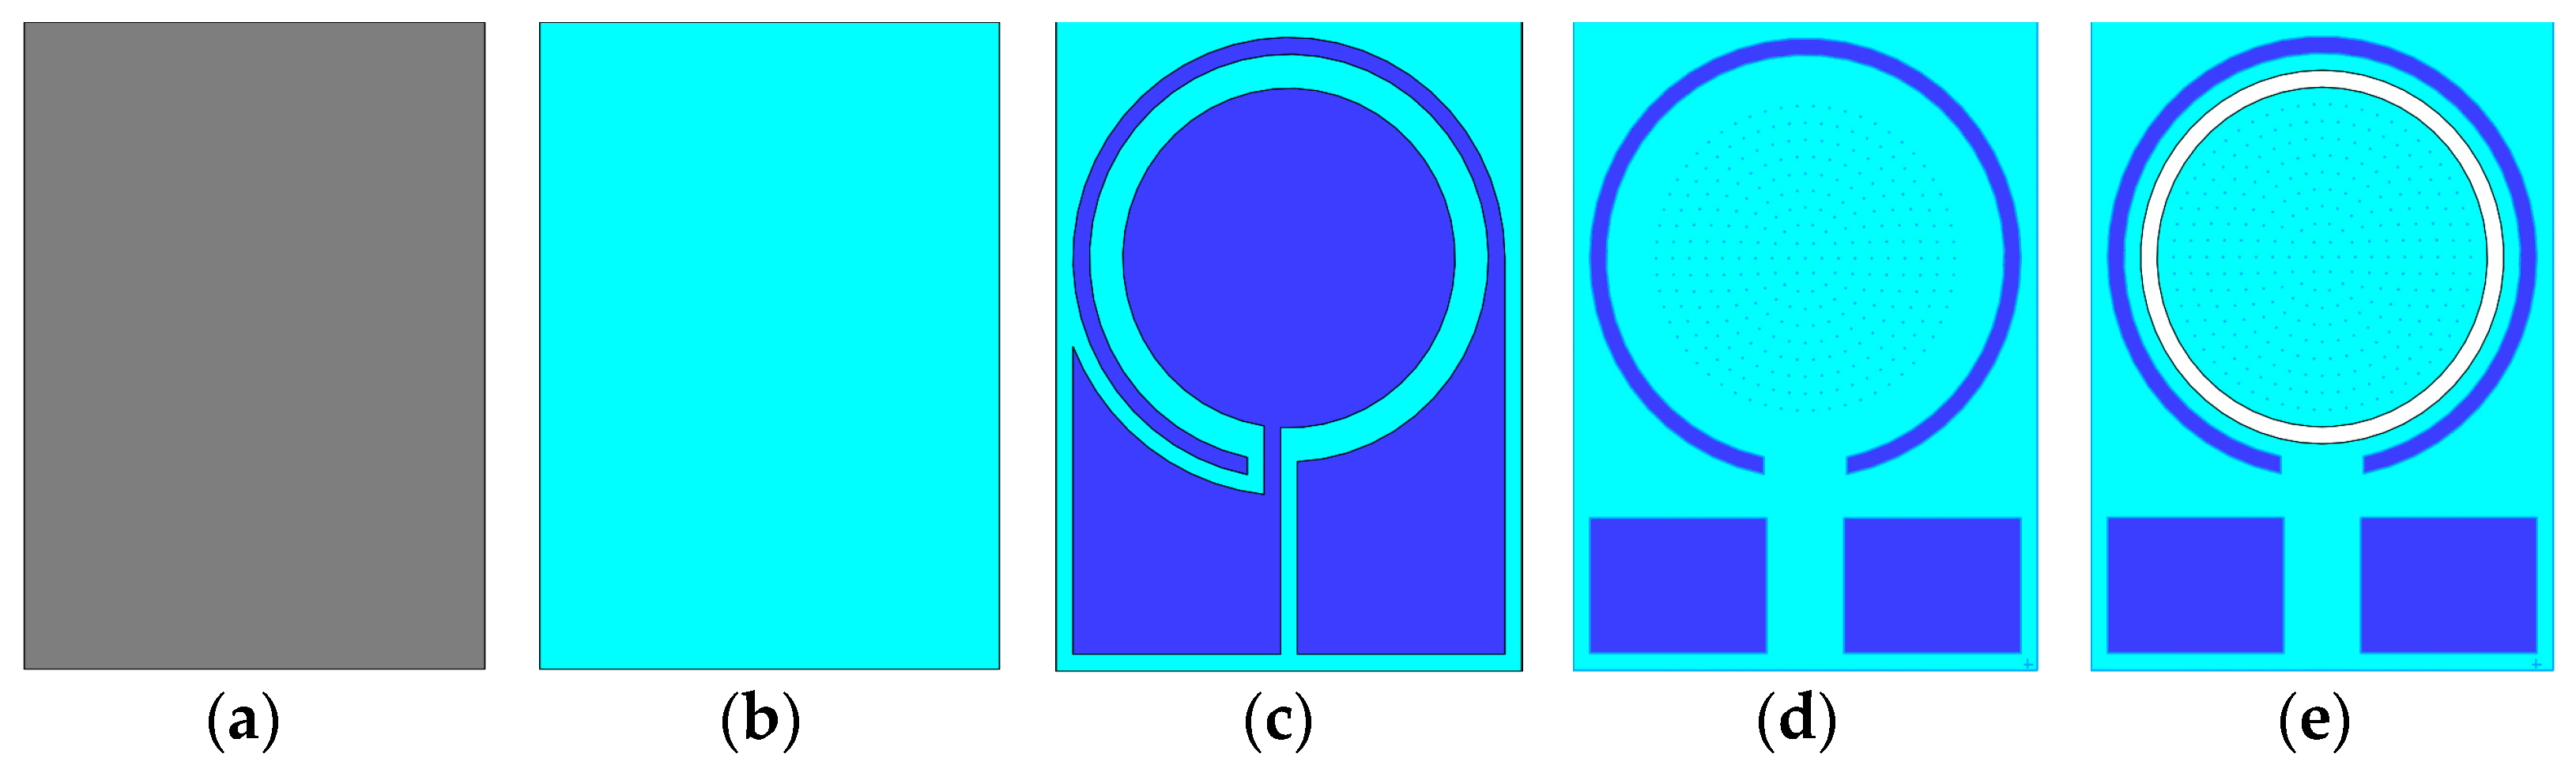
Figure 3.
(a) Photograph of wafer after dicing. (b) Packaged composite electrode.

2.4. Instruments and Reagents
All electrochemical analyses were performed using a VA 797 voltammetric polarimeter (Aptar, Switzerland). Stock standard solutions for the preparation of Cu, Pb, Cd, and Zn standard solutions were provided by the Center for National Standard Substances (CRMs, Beijing, China). The experiments were conducted at room temperature and normal pressure, and all experimental vessels were soaked in 5% HNO3 acid wash solution for 24 h, rinsed with deionized water, and dried before use. A three-electrode system was connected to the VA 797 voltammetric polarimeter, which consisted of a Ag/AgCl reference electrode and the working and counter electrodes of the microelectrode array electrode.
2.5. Selection of Measurement Method
2.6. Electrode Modification
Before the electrodes were used, the microporous array area of the working electrode was coated with a protective gel layer [28] and activated by immersion in pure water for 1 h and then in sodium nitrate for more than 3 h. The activated working electrode was plated in a constant potential (−0.4 V) mercury plating solution with a coating time of t = 480 s and set aside (Figure 4) [29].
2.7. Sample Collection and Processing
In this study, a hand-thrown sampler (Figure 5) was used to select four sampling sites along the Sanya River (Figure 6), and six 1 L samples were collected from each site at a depth of 1 m in the surface layer. Samples collected at Sanya Bay, Nanbianhai Pier, Xinfengqiao, and Fenghuangshuicheng, respectively, represented seawater, estuary, mangrove (at the junction of freshwater and seawater), and upstream freshwater environments (Table 2). After the water samples were collected, three 1 L samples were taken from each sampling point and filtered through a 0.45 μm filter membrane, adjusted to pH 2 with nitric acid, and kept away from light for 2 days to measure the concentration of total dissolved metal elements according to the requirements of the GB 17378.4-2007 Specification for Marine Monitoring Part 4: Seawater Analysis. Three additional 1 L samples from each sampling location were filtered through a 0.45 μm membrane without the addition of acid, and the concentrations of metal elements in the ionic state were measured.
3. Results and Discussion
3.1. Electrochemical Characterization
In stripping analysis, mercury (Hg) has a broad cathodic potential range, which results in a high overvoltage against the hydrogen evolution reaction that ensures reliable and repeatable measurements [30,31]. Additionally, the amalgamation capability of mercury with various metals, along with its rapid electrode kinetics [32], further enhances its suitability for this analytical method. Before using the electrodes, mercury film modification was carried out, and the morphological changes on the surface of the working electrode were observed by scanning electron microscopy (SEM). After the mercury film modification, the surface of the microporous array working electrode formed a distinct raised structure due to the accumulation of mercury on the surface. The mercury film modification also changed the shape of the micropores from planar to hemispherical, which greatly increased the surface area. This undoubtedly contributed to the significantly improved rate and efficiency of electrochemical reactions (Figure 7a). After a period of testing, the mercury film is no longer complete and gradually deteriorates, resulting in its detachment and the leakage of the conductive metal layer. Consequently, the electrode cannot function properly, necessitating the modification of the mercury film (Figure 7b).
3.2. Electrode Detection Range
The study encompassed a comprehensive investigation into the simultaneous detection ranges of Pb(II) and Cu(II) ions, employing the established standard addition methodology. The experimental design utilized filtered coastal seawater as the matrix for these analyses, reflecting real-world conditions. Square wave anodic stripping voltammetry (SWASV) was selected as the electroanalytical technique due to its sensitivity and specificity in detecting metal ions. A wide potential scanning range of −0.8 to −0.05 V was employed to ensure the thorough coverage of potential peaks.
These concentrations included 0.1, 0.5, 1, 5, 50, 100, 250, 500, 750, 1000, 1250, 1500, 1750, 2000, and 3000 μg/L. Such a diverse concentration range was chosen to establish the limits of detection and quantification for both Pb(II) and Cu(II) ions. The utilization of filtered coastal seawater as the experimental medium was significant, This approach allowed for a more realistic assessment of the method’s applicability in environmental monitoring and analysis.
The resulting dissolution peaks observed at the various concentration levels, as depicted in Figure 8, provide a clear visualization of the method’s performance characteristics across the specified concentration range. This detailed analysis enables a thorough understanding of the method’s sensitivity, selectivity, and quantitative capabilities in the detection of Pb(II) and Cu(II) ions in coastal seawater environments.
The voltammetric curves for various ion concentrations, distinguished by different colors, reveal distinctive peak current patterns in the linear scan. These results demonstrate a clear linear relationship, showing a robust increase with the concentration of metal ions (Figure 8). The experimental data obtained using the standard addition method for Pb(II) and Cu(II) ions within the 0.1 to 3000 μg/L concentration range are visually depicted in Figure 8.
The linear regression equation for Pb(II) is expressed as I = 0.0882C − 0.8914. This equation displays a remarkably high correlation coefficient (R2) of 0.9998, indicating a strong linear relationship between the peak current and Pb(II) concentration. Similarly, the linear equation for Cu(II) is given as I = 0.0021C − 0.0237. This equation demonstrates a substantial correlation coefficient (R2) of 0.9924, also indicating a strong linear association between the peak current and Cu(II) concentration.
3.3. Electrode Repeatability Tests
The Cu(II) standard solution was added to the coastal seawater samples from Sanya Bay, filtered through a 0.45 μm membrane, and the concentration was set at 2 μg/L. The sample solutions were detected by SWASV, with a scanning potential range of −1.2 to −0.1 V. Ten consecutive measurements of the Cu(II) peak current (i.e., 57.12, 59.48, 61.92, 56.54, 60.19, 59.75, 57.03, 57.25, 58.79, and 61.20 nA) were recorded to evaluate the reproducibility of the electrode. These Cu(II) voltammetric curves nearly overlapped, demonstrating the consistency of the peak current measurements. The calculated relative standard deviation (RSD) of the peak currents was 3.04%, indicating that the sensor chip had very good reproducibility (Figure 9).
3.4. Comparison of This Study with Other Literature
Compareing this study with other literature (Table 3), this microelectrode array was meticulously engineered with a low detection limit (0.1 μg/L) and a wide detection range (0.1–3000 μg/L).
3.5. Electrode Detection Performance
To evaluate the performance of the microelectrode array electrode, a sample of coastal seawater from Sanya Bay, filtered through a 0.45 μm filter membrane, was tested by SWASV with a scanning potential range of −1.2 to −0.1 V at a measurement frequency of 15 Hz [39]. Although the results showed that the electrode was capable of simultaneously measuring four elements, i.e., Zn(II), Cd(II), Pb(II), and Cu(II), the measured value of Zn(II) was too high to obtain the effective concentration. The quantitative calculation of the other three metal elements was completed to obtain the effective concentrations. The linearity of the electrode was tested via standard addition by measuring the concentrations of Cd(II), Pb(II), and Cu(II) ions in triplicate at 1 μg/L increments and averaging the values [40]. The corresponding peak current curves were obtained, as shown in Figure 8a.
By analyzing the standard curves, the sensitivity of the electrode toward Cd(II), Pb(II), and Cu(II) was, respectively, calculated as 43.62, 4.31, and 2.42 nA/(μg⋅L−1), with linear correlation coefficients (R2) of 0.9964, 0.9992, and 0.9903 (Figure 10). The sensitivity of Pb(II) and Cu(II) was calculated as 4.31 and 2.42 nA/(μg⋅L−1), while the limits of detection were 0.01 and 0.02 μg⋅L−1.
3.6. Measurement of Lead and Copper Ion Concentrations in Sanya River Samples
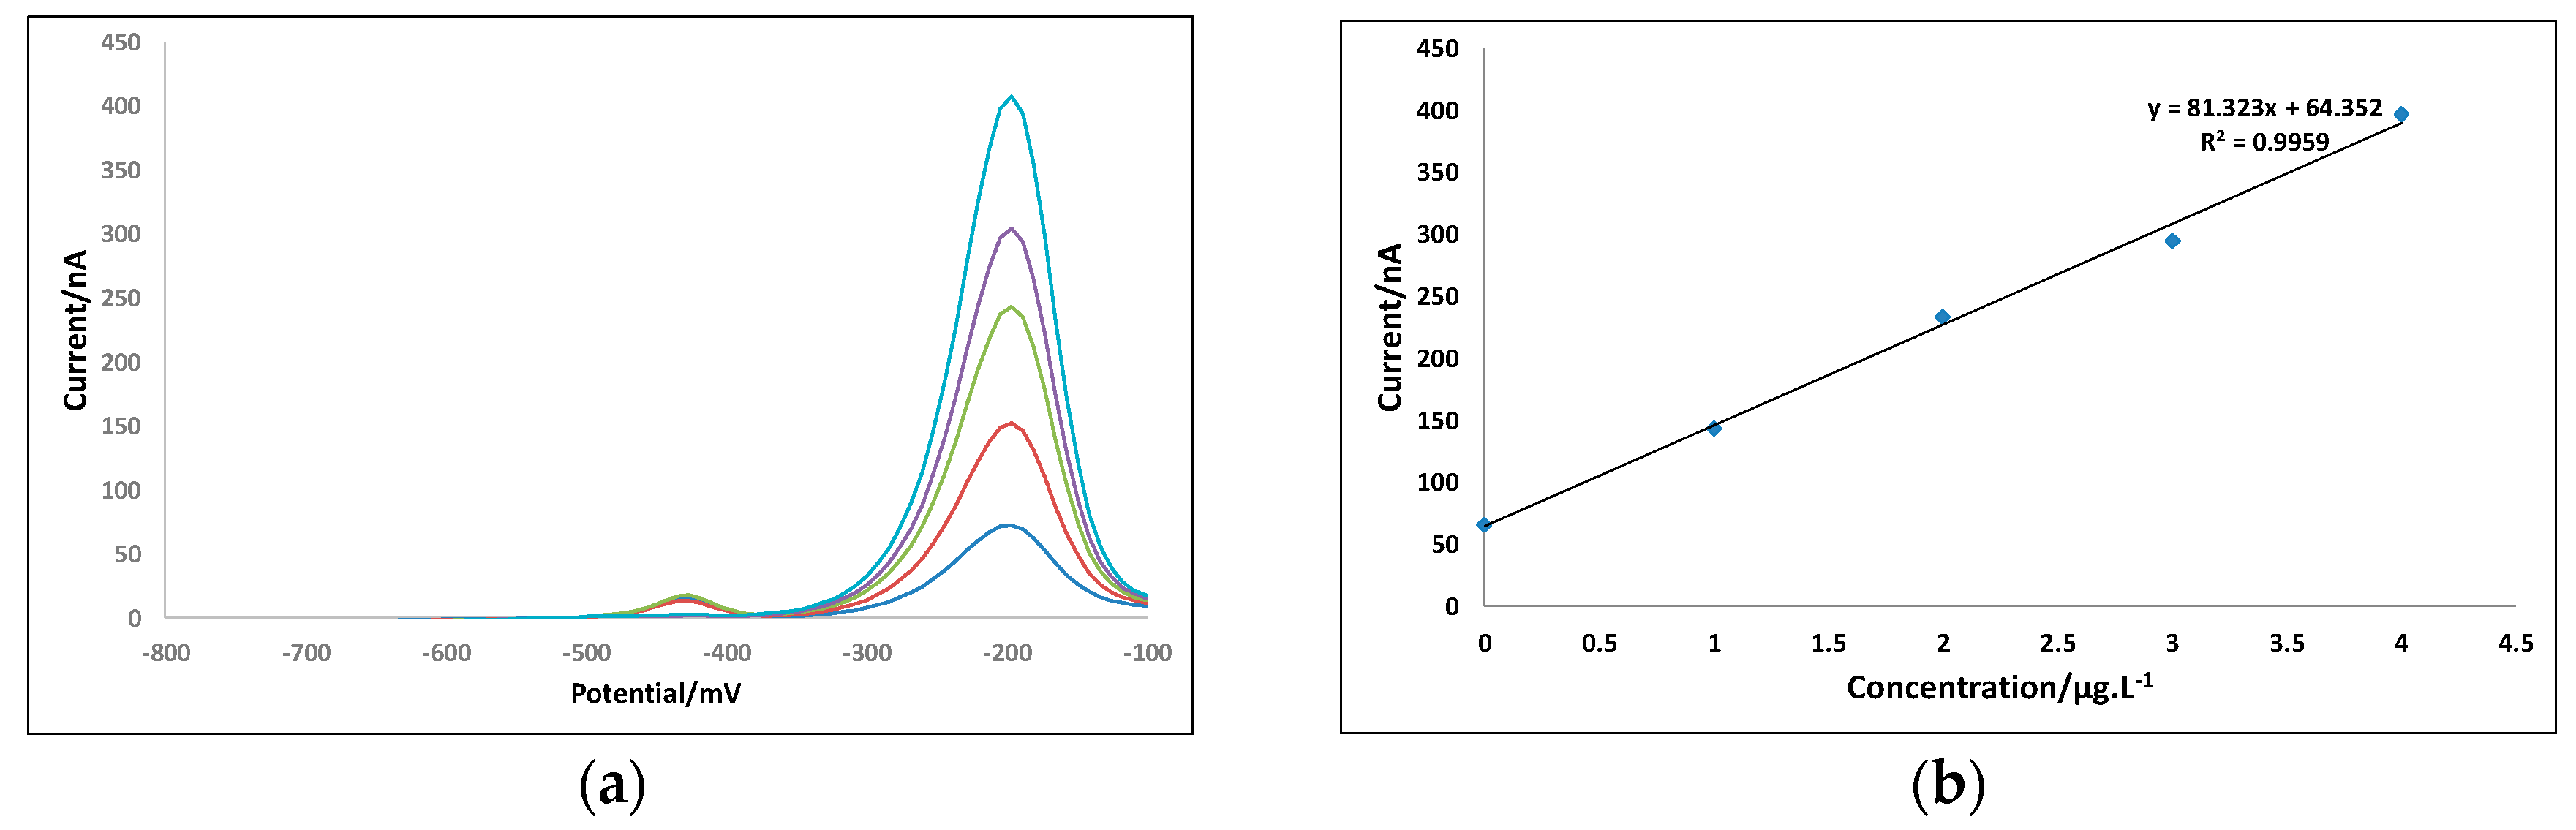
The concentrations of lead and copper ions in the water samples from the Sanya River were measured using the designed microelectrode array electrode and detected by SWASV with a scanning potential range of −1.2 to −0.01 V (Table 4 and Table 5). The water samples were quantified by standard addition (Figure 11). The concentrations of lead and copper ions in the Sanya River were unevenly distributed due to the influence of tides and anthropogenic activity but were confirmed to meet the Grade I Chinese Seawater Quality Standard (GB 3097-1997) [41].
4. Conclusions
In this study, a microelectrode array was meticulously engineered with heightened sensitivity and an expansive detection range, thereby facilitating the precise quantification of the lead and copper ion concentrations within the intricate aquatic ecosystems of the Sanya River. Despite the successful application of the array, notable constraints were identified, limiting its simultaneous quantification capacity to two to three metal ions. In particular, the quantification of Zn(II) surpassed the measurable limits, posing a challenge to accurate determination. Additionally, the stability of the Cd(II) measurements was observed to be inconsistent. Moving forward, our research endeavors will focus on refining the structural design and preparation methodology of the microelectrode array. This strategic optimization aims to bolster its measurement efficacy, enabling the comprehensive assessment of a diverse array of metal elements. Ultimately, this advancement promises to provide crucial technical support in combatting and mitigating the pervasive threat of heavy metal pollution within aquatic ecosystems.
Author Contributions
F.Z., S.W. and J.Z. conceived and designed the study; J.Z. collected the samples; J.Z. and S.W. carried out the experiments; J.Z., S.W., F.Z., B.J. and C.Y. analyzed the data and prepared the figures; J.Z., S.W., F.Z., B.J. and C.Y. wrote the manuscript; and F.Z. revised the manuscript. All authors have read and agreed to the published version of the manuscript.
Funding
This work has benefited from financial supports of the Special Project for Deep Sea Technology Industry Promotion of the Deep Sea Technology Innovation Center of Hainan Province (DSTIC-CYCJ-2022001 and DSTIC-CYCJ-2022003), National Natural Science Foundation of China (NSFC) Young Scientists Fund Project: Research on Multi-Modal Control Mechanism of Hybrid Aerial Underwater Vehicle Based on Foldable Flexible Wings (42306206), Zhejiang Province 2024 “Jianbing” Plan Project ‘Research and Product Development of In-situ Analysis Instrument Technology for Heavy Metals Based on Marine Ecological Environment Observation’ (2024C03035).
Institutional Review Board Statement
Not applicable.
Informed Consent Statement
Not applicable.
Data Availability Statement
The data presented in this study are available on request from the authors.
Conflicts of Interest
The authors declare no conflict of interest.
References
- Yang, F.; Zhang, H.; Xie, S.; Wei, C.; Yang, X. Concentrations of heavy metals in water, sediments and aquatic organisms from a closed realgar mine. Environ. Sci. Pollut. Res. Int. 2023, 30, 4959–4971. [Google Scholar] [CrossRef] [PubMed]
- Qin, W.; Han, D.; Song, X.; Liu, S. Sources and migration of heavy metals in a karst water system under the threats of an abandoned Pb-Zn mine, Southwest China. Environ. Pollut. 2021, 277, 116774. [Google Scholar] [CrossRef] [PubMed]
- Vicente-Martorell, J.J.; Galindo-Riaño, M.D.; García-Vargas, M.; Granado-Castro, M.D. Bioavailability of heavy metals monitoring water, sediments and fish species from a polluted estuary. J. Hazard. Mater. 2009, 162, 823. [Google Scholar] [CrossRef] [PubMed]
- Liu, B.Q.; Wang, J.; Xu, M.; Zhao, L.; Wang, Z. Spatial distribution, source apportionment and ecological risk assessment of heavy metals in the sediments of Haizhou Bay national ocean park, China. Mar. Pollut. Bull. 2019, 149, 110651. [Google Scholar] [CrossRef]
- Han, J.L.; Pan, X.D.; Chen, Q.; Huang, B.F. Health risk assessment of heavy metals in marine fish to the population in Zhejiang, China. Sci. Rep. 2021, 11, 11079. [Google Scholar] [CrossRef] [PubMed]
- Chakraborty, S.; Bhattacharya, T.; Singh, G.; Maity, J.P. Benthic macroalgae as biological indicators of heavy metal pollution in the marine environments: A biomonitoring approach for pollution assessment. Ecotoxicol. Environ. Saf. 2014, 100, 61–68. [Google Scholar] [CrossRef] [PubMed]
- Jiang, Y.X.; Chao, S.H.; Liu, J.W.; Yang, Y.; Chen, Y.; Zhang, A.; Cao, H. Source apportionment and health risk assessment of heavy metals in soil for a township in Jiangsu Province, China. Chemosphere 2017, 168, 1658–1668. [Google Scholar] [CrossRef]
- Wang, C.L.; Zou, X.Q.; Feng, Z.Y.; Hao, Z.; Gao, J. Distribution and transport of heavy metals in estuarine-inner shelf regions of the East China Sea. Sci. Total Environ. 2018, 644, 298–305. [Google Scholar] [CrossRef] [PubMed]
- Jonsson, S.; Andersson, A.; Nilsson, M.B.; Skyllberg, U.; Lundberg, E.; Schaefer, J.K.; Åkerblom, S.; Björn, E. Terrestrial discharges mediate trophic shifts and enhance methylmercury accumulation in estuarine biota. Sci. Adv. 2017, 3, e1601239. [Google Scholar] [CrossRef]
- Kumar, V.; Parihar, R.D.; Sharma, A.; Bakshi, P.; Sidhu, G.P.S.; Bali, A.S.; Karaouzas, I.; Bhardwaj, R.; Thukral, A.K.; Gyasi-Agyei, Y.; et al. Global evaluation of heavy metal content in surface water bodies: A meta-analysis using heavy metal pollution indices and multivariate statistical analyses. Chemosphere 2019, 236, 124364. [Google Scholar] [CrossRef]
- Buffle, J.; Tercier-Waeber, M.L. Voltammetric environmental trace-metal analysis and speciation: From laboratory to in situ measurements. TrAC Trends Anal. Chem. 2005, 24, 172–191. [Google Scholar] [CrossRef]
- Tercier-Waeber, M.L.; Buffle, J. Submersible online oxygen removal system coupled to an in situ voltammetric probe for trace element monitoring in freshwater. Environ. Sci. Technol. 2000, 34, 4018–4024. [Google Scholar] [CrossRef]
- Morais, P.V.; Suman, P.H.; Schöning, M.J.; Siqueira, J.R., Jr.; Orlandi, M.O. Layer-by-Layer Film Based on Sn3O4 Nanobelts as Sensing Units to Detect Heavy Metals Using a Capacitive Field-Effect Sensor Platform. Chemosensors 2023, 11, 436. [Google Scholar] [CrossRef]
- Finšgar, M.; Rajh, B. A Factorial Design and Simplex Optimization of a Bismuth Film Glassy Carbon Electrode for Cd(II) and Pb(II) Determination. Chemosensors 2023, 11, 129. [Google Scholar] [CrossRef]
- Prontera, C.T.; Sciurti, E.; De Pascali, C.; Giampetruzzi, L.; Biscaglia, F.; Blasi, L.; Esposito, V.; Casino, F.; Siciliano, P.A.; Francioso, L.N. Anodic Stripping Voltammetric Determination of Copper Ions in Cell Culture Media: From Transwell® to Organ-on-Chip Systems. Chemosensors 2023, 11, 466. [Google Scholar] [CrossRef]
- Hirbodvash, Z.; Houache, M.S.E.; Krupin, O.; Khodami, M.; Northfield, H.; Olivieri, A.; Baranova, E.A.; Berini, P. Electrochemical Performance of Lithographically-Defined Micro-Electrodes for Integration and Device Applications. Chemosensors 2021, 9, 277. [Google Scholar] [CrossRef]
- Silva, P.R.M.; Khakani, M.A.E.; Chaker, M.; Champagne, G.Y.; Chevalet, J.; Gastonguay, L.; Lacasse, R.; Ladouceur, M. Development of Hg-electroplated-iridium based microelectrode arrays for heavy metal traces analysis. Anal. Chim. Acta 1999, 385, 249–255. [Google Scholar] [CrossRef]
- Wightman, R.M. Voltammetry with microscopic electrodes in new domains. Science 1988, 240, 415–420. [Google Scholar] [CrossRef]
- Uhlig, A.; Schnakemberg, U.; Hintsche, R. Highly sensitive heavy metal analysis on platinum- and gold-ultramicroelectrode arrays. Electroanalysis 1997, 9, 125–129. [Google Scholar] [CrossRef]
- Tercier-Waeber, M.L.; Fighera, M.; Abdou, M.; Bakker, E.; van der Wal, P. Newly designed gel-integrated nanostructured gold-based interconnected microelectrode arrays for continuous in situ arsenite monitoring in aquatic systems. Sens. Actuators B Chem. 2021, 328, 128996. [Google Scholar] [CrossRef]
- Guo, J.; Lindner, E. Cyclic voltammograms at coplanar and shallow recessed microdisk electrode arrays: Guidelines for design and experiment. Anal. Chem. 2009, 81, 130–138. [Google Scholar] [CrossRef] [PubMed]
- Xie, X.; Stueben, D.; Berner, Z. The application of microelectrodes for the measurements of trace metals in water. Anal. Lett. 2005, 38, 2281–2300. [Google Scholar] [CrossRef]
- Kiani, H.; Beheshti, B.; Borghei, A.M.; Rahmati, M.H. Detection of olive oil contaminated with heavy metals using a three-electrode system based on cyclic voltammetry. J. Electroanal. Chem. 2021, 116, 293–303. [Google Scholar] [CrossRef]
- Pitsou, M.; Kokkinos, C.; Economou, A.; Fielden, P.R.; Baldock, S.J.; Goddard, N.J. “Green” Three-Electrode Sensors Fabricated by Injection-Moulding for On-Site Stripping Voltammetric Determination of Trace In(III) and Tl(I). Chemosensors 2021, 9, 310. [Google Scholar] [CrossRef]
- Davis, F.; Higson, S.P.J. Arrays of microelectrodes: Technologies for environmental investigations. Environ. Sci. Process. Impacts 2013, 15, 1477–1489. [Google Scholar] [CrossRef] [PubMed]
- Tercier-Waeber, M.L.; Abdou, M.; Fighera, M.; Kowal, J.; Bakker, E.; van der Wal, P. In situ voltammetric sensor of potentially bioavailable inorganic mercury in marine aquatic systems based on gel-integrated nanostructured gold-based microelectrode arrays. ACS Sens. 2021, 6, 925–937. [Google Scholar] [CrossRef] [PubMed]
- Abdou, M.; Tercier-Waeber, M.L.; Dutruch, L.; Bossy, C.; Pougnet, F.; Coynel, A.; Bakker, E.; Blanc, G.; Schäfer, J. Estuarine dissolved speciation and partitioning of trace metals: A novel approach to study biogeochemical processes. Environ. Res. 2022, 208, 112596. [Google Scholar] [CrossRef] [PubMed]
- Tercier-Waeber, M.L.; Confalonieri, F.; Koudelka-Hep, M.; Dessureault-Rompré, J.; Graziottin, F.; Buffle, J. Gel-integrated voltammetric microsensors and submersible probes as reliable tools for environmental trace metal analysis and speciation. Electroanalysis 2008, 20, 240–258. [Google Scholar] [CrossRef]
- Wang, J. Stripping analysis at bismuth electrodes: A review. Electroanalysis 2005, 17, 1341–1346. [Google Scholar] [CrossRef]
- Injang, U.; Noyrod, P.; Siangproh, W.; Dungchai, W.; Motomizu, S.; Chailapakul, O. Determination of trace heavy metals in herbs by sequential injection analysis-anodic stripping voltammetry using screen-printed carbon nanotubes electrodes. Anal. Chim. Acta 2010, 668, 54–60. [Google Scholar] [CrossRef]
- Kachoosangi, R.T.; Banks, C.E.; Ji, X.; Compton, R.G. Electroanalytical determination of cadmium (II) and lead (II) using an in-situ bismuth film modified edge plane pyrolytic graphite electrode. Anal. Sci. 2007, 23, 283–289. [Google Scholar] [CrossRef]
- Herzog, G.; Arrigan, D.W.M. Determination of trace metals by underpotential deposition–stripping voltammetry at solid electrodes. Trends Anal. Chem. 2005, 24, 208–217. [Google Scholar] [CrossRef]
- Lu, Z.; Zhang, J.; Dai, W.; Lin, X.; Ye, J.; Ye, J. A screen-printed carbon electrode modified with a bismuth film and gold nanoparticles for simultaneous stripping voltammetric determination of Zn(II), Pb(II) and Cu(II). Microchim. Acta 2017, 184, 4731–4740. [Google Scholar] [CrossRef]
- Guo, Z.; Li, D.D.; Luo, X.K.; Li, Y.H.; Zhao, Q.N.; Li, M.M.; Zhao, Y.T.; Sun, T.S.; Ma, C. Simultaneous determination of trace Cd(II), Pb(II) and Cu(II) by differential pulse anodic stripping voltammetry using a reduced graphene oxide-chitosan/poly-l-lysine nanocomposite modified glassy carbon electrode. J. Colloid Interface Sci. 2017, 490, 11–22. [Google Scholar] [CrossRef] [PubMed]
- Han, X.; Meng, Z.; Zhang, H.; Zheng, J. Fullerene-based anodic stripping voltammetry for simultaneous determination of Hg(II), Cu(II), Pb(II) and Cd(II) in foodstuff. Microchim. Acta 2018, 185, 274. [Google Scholar] [CrossRef] [PubMed]
- Wu, W.; Jia, M.; Wang, Z.; Zhang, W.; Zhang, Q.; Liu, G.; Zhang, Z.; Li, P. Simultaneous voltammetric determination of cadmium (II), lead (II), mercury (II), zinc (II), and copper (II) using a glassy carbon electrode modified with magnetite (Fe3O4) nanoparticles and fluorinated multiwalled carbon nanotubes. Mikrochim. Acta 2019, 186, 97. [Google Scholar] [CrossRef] [PubMed]
- Mourya, A.; Sinha, S.K.; Mazumdar, B. Glassy carbon electrode modified with blast furnace slag for electrochemical investigation of Cu2+ and Pb2+ metal ions. Microchem. J. 2019, 147, 707. [Google Scholar] [CrossRef]
- Fan, C.; Chen, L.; Jiang, R.; Ye, J.; Li, H.; Shi, Y.; Luo, Y.; Wang, G.; Hou, J.; Guo, X. ZnFe2O4 nanoparticles for electrochemical determination of trace Hg (II), Pb (II), Cu (II), and glucose. ACS Appl. Nano Mater. 2021, 4, 4026. [Google Scholar] [CrossRef]
- Xiong, S.; Xu, J.; Xie, F.; Hu, X.; Gong, G.; Wu, Z.; Yao, L. Stripping analysis of Pb(II), Cd(II), Hg(II) and Cu(II) based on irradiated attapulgite/Ionic liquid composites. Chem. Eng. J. 2017, 316, 383–392. [Google Scholar] [CrossRef]
- Suteerapataranon, S.; Jakmunee, J.; Vaneesorn, Y.; Grudpan, K. Exploiting flow injection and sequential injection anodic stripping voltammetric systems for simultaneous determination of some metals. Talanta 2002, 58, 1235. [Google Scholar] [CrossRef]
- GB 17378.4-2007; The Specification for Marine Monitoring—Part 4: Seawater Analysis. Standards Press of China: Beijing, China, 2007.
Figure 1.
(a) Square and (b) circular electrode structures. Electric field simulation of (c) square and (d) circular electrode structures (A/m2). (e) Electrode structural components.
Figure 1.
(a) Square and (b) circular electrode structures. Electric field simulation of (c) square and (d) circular electrode structures (A/m2). (e) Electrode structural components.
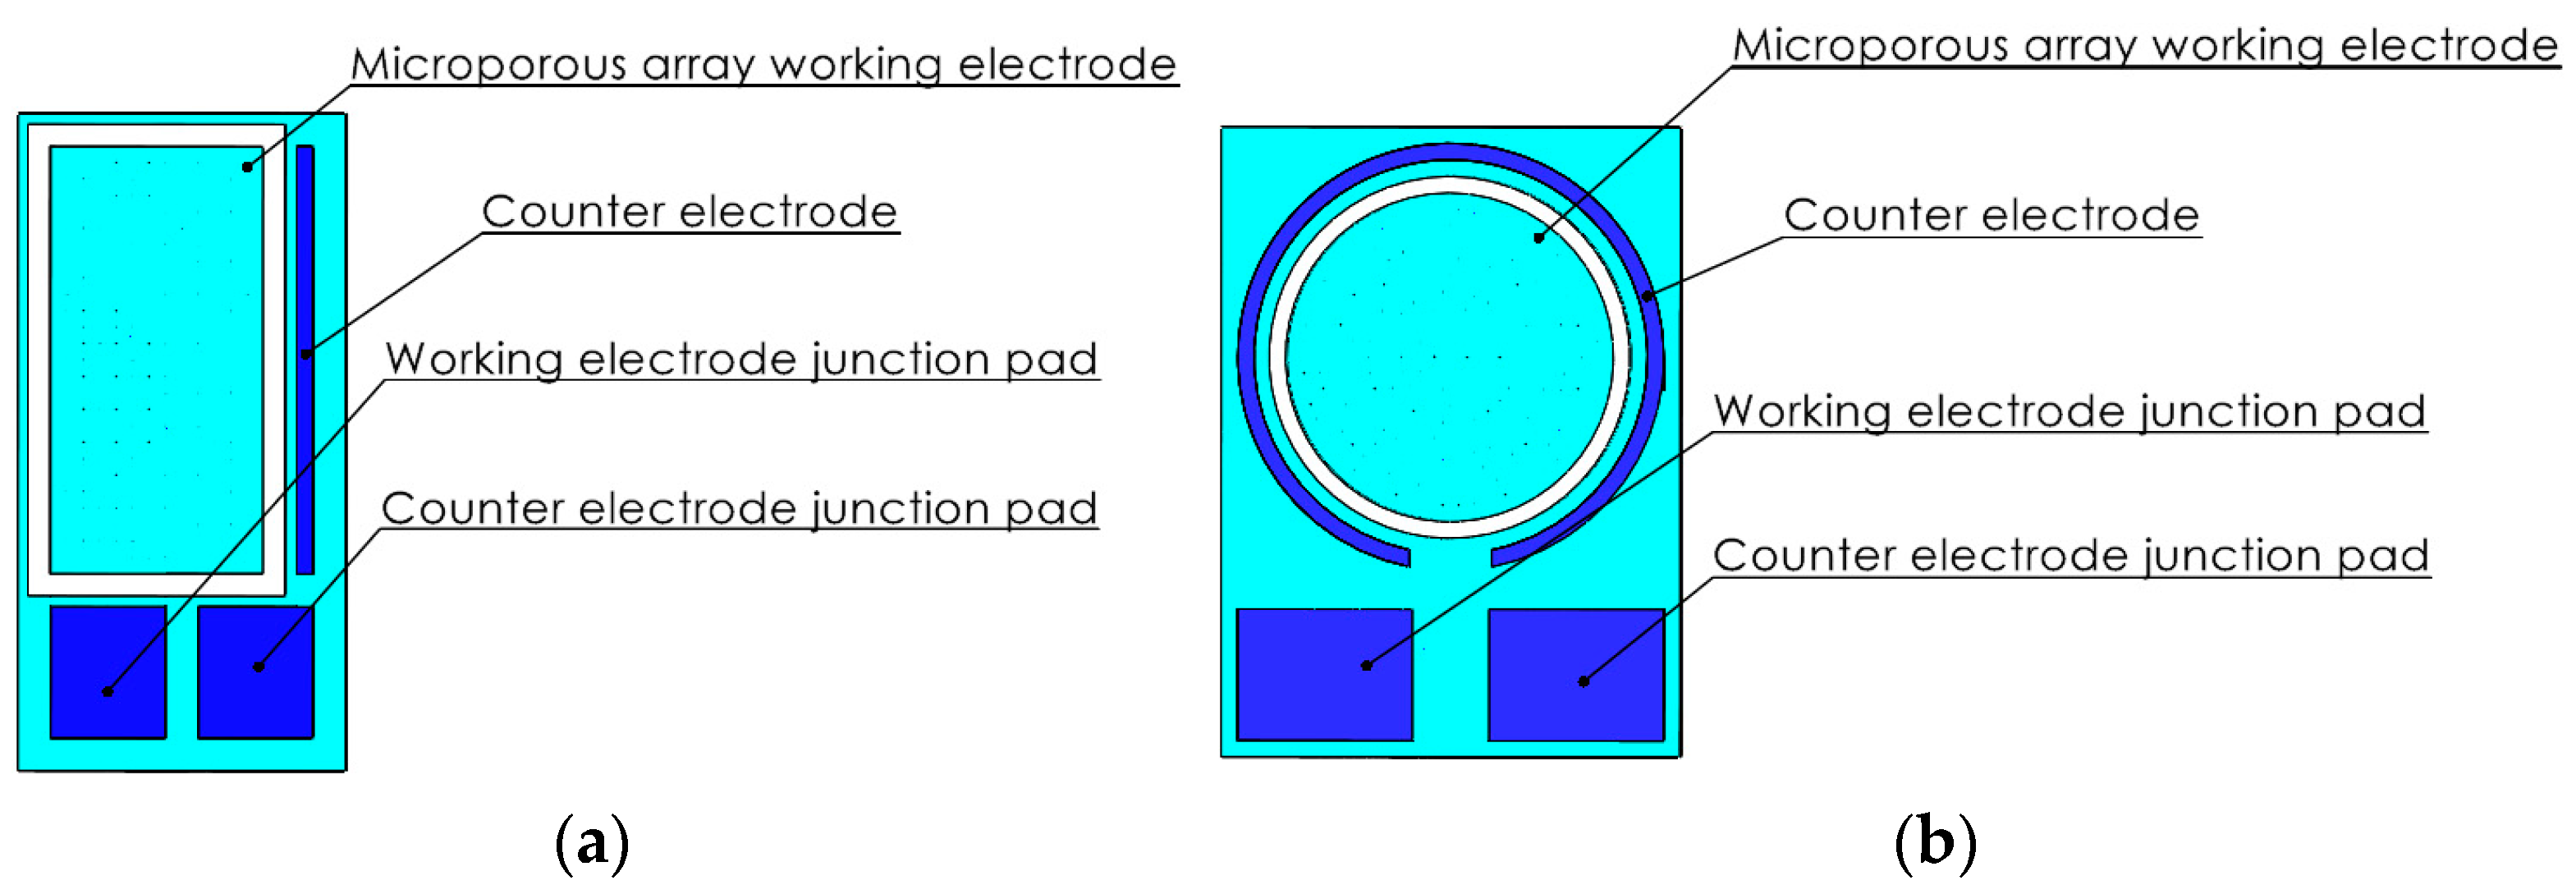
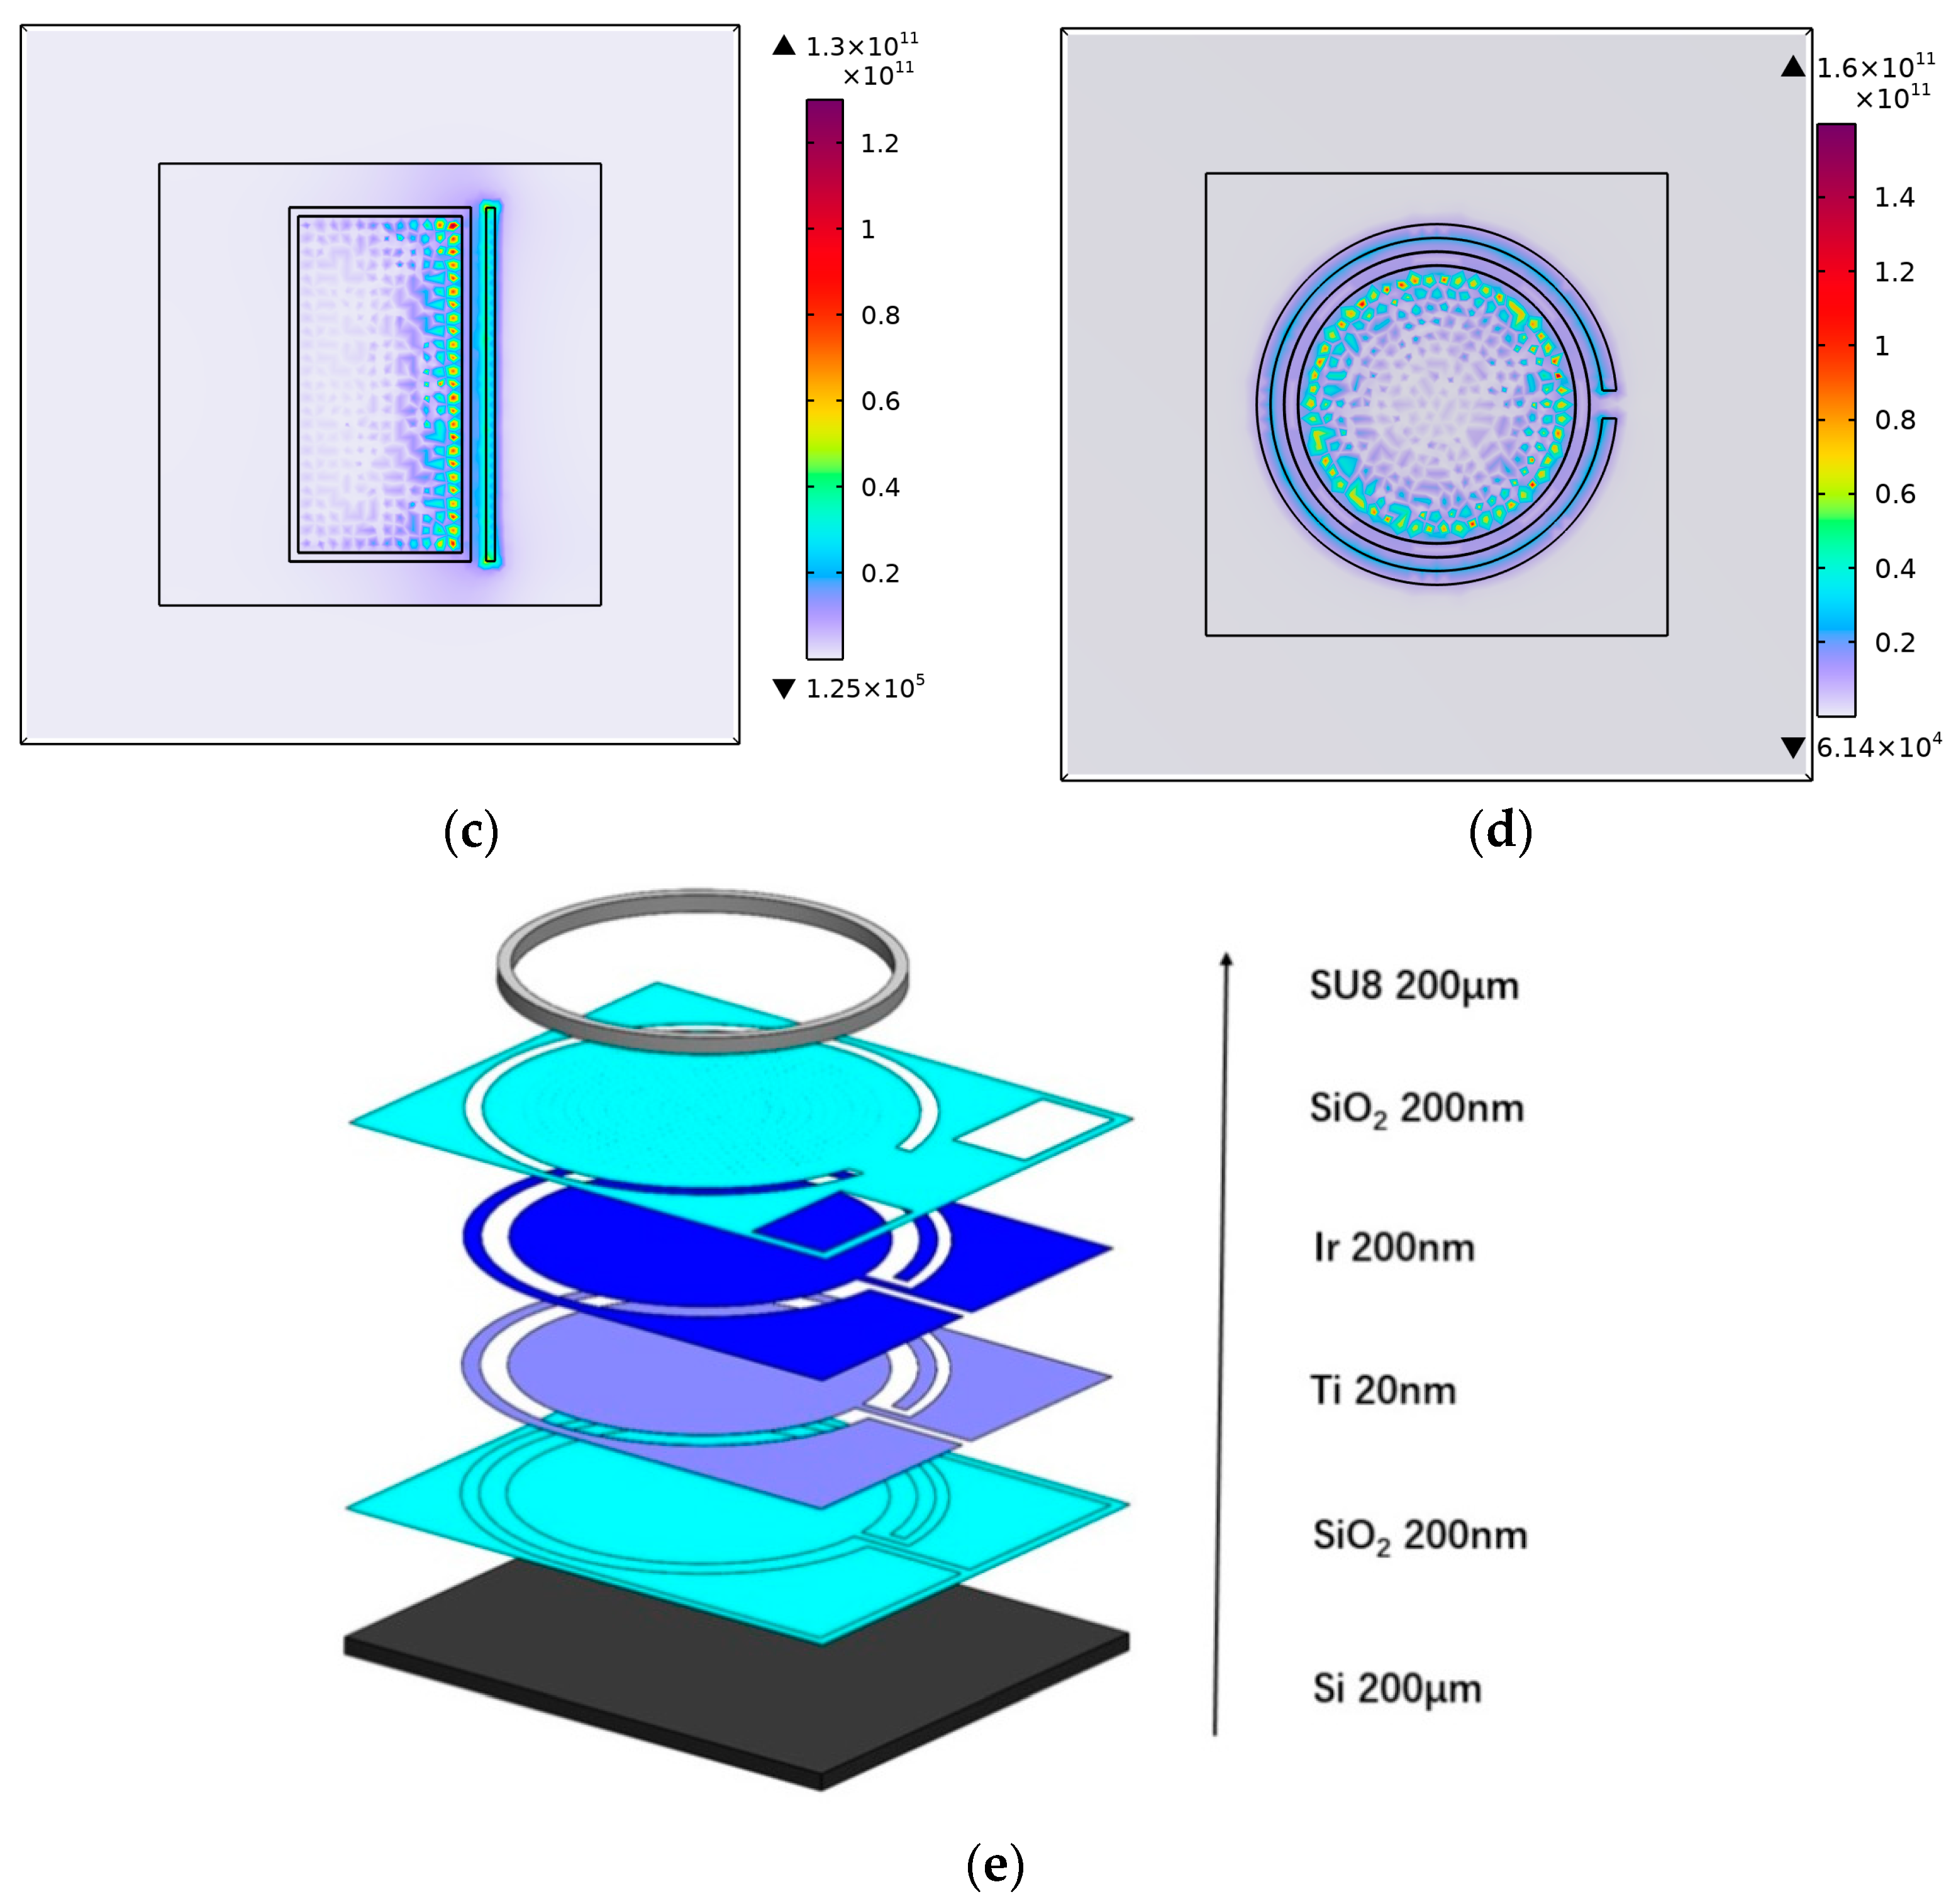
Figure 4.
Comparison of the electrode (a) before and (b) after mercury plating.

Figure 5.
Hand-thrown sampler.
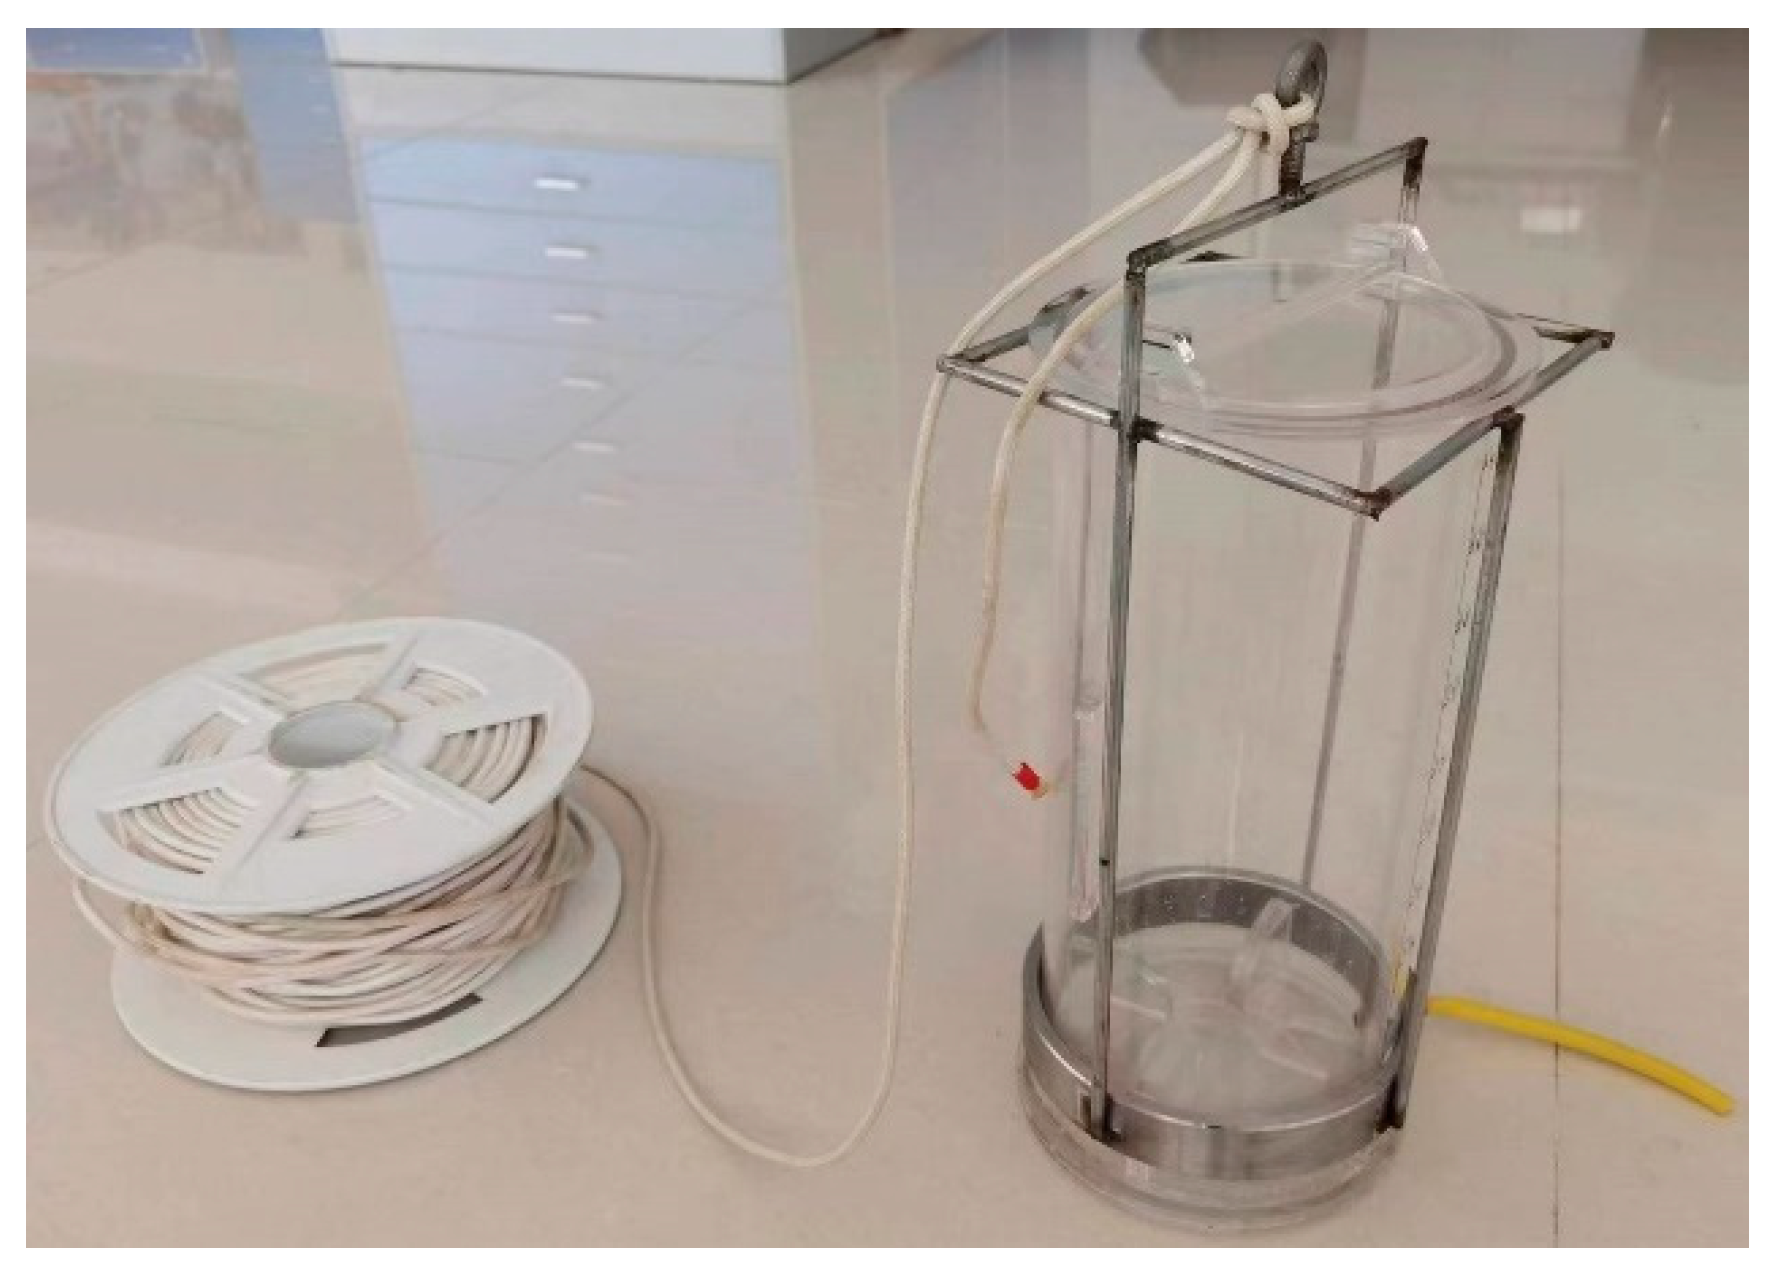
Figure 6.
Distribution of sampling points.
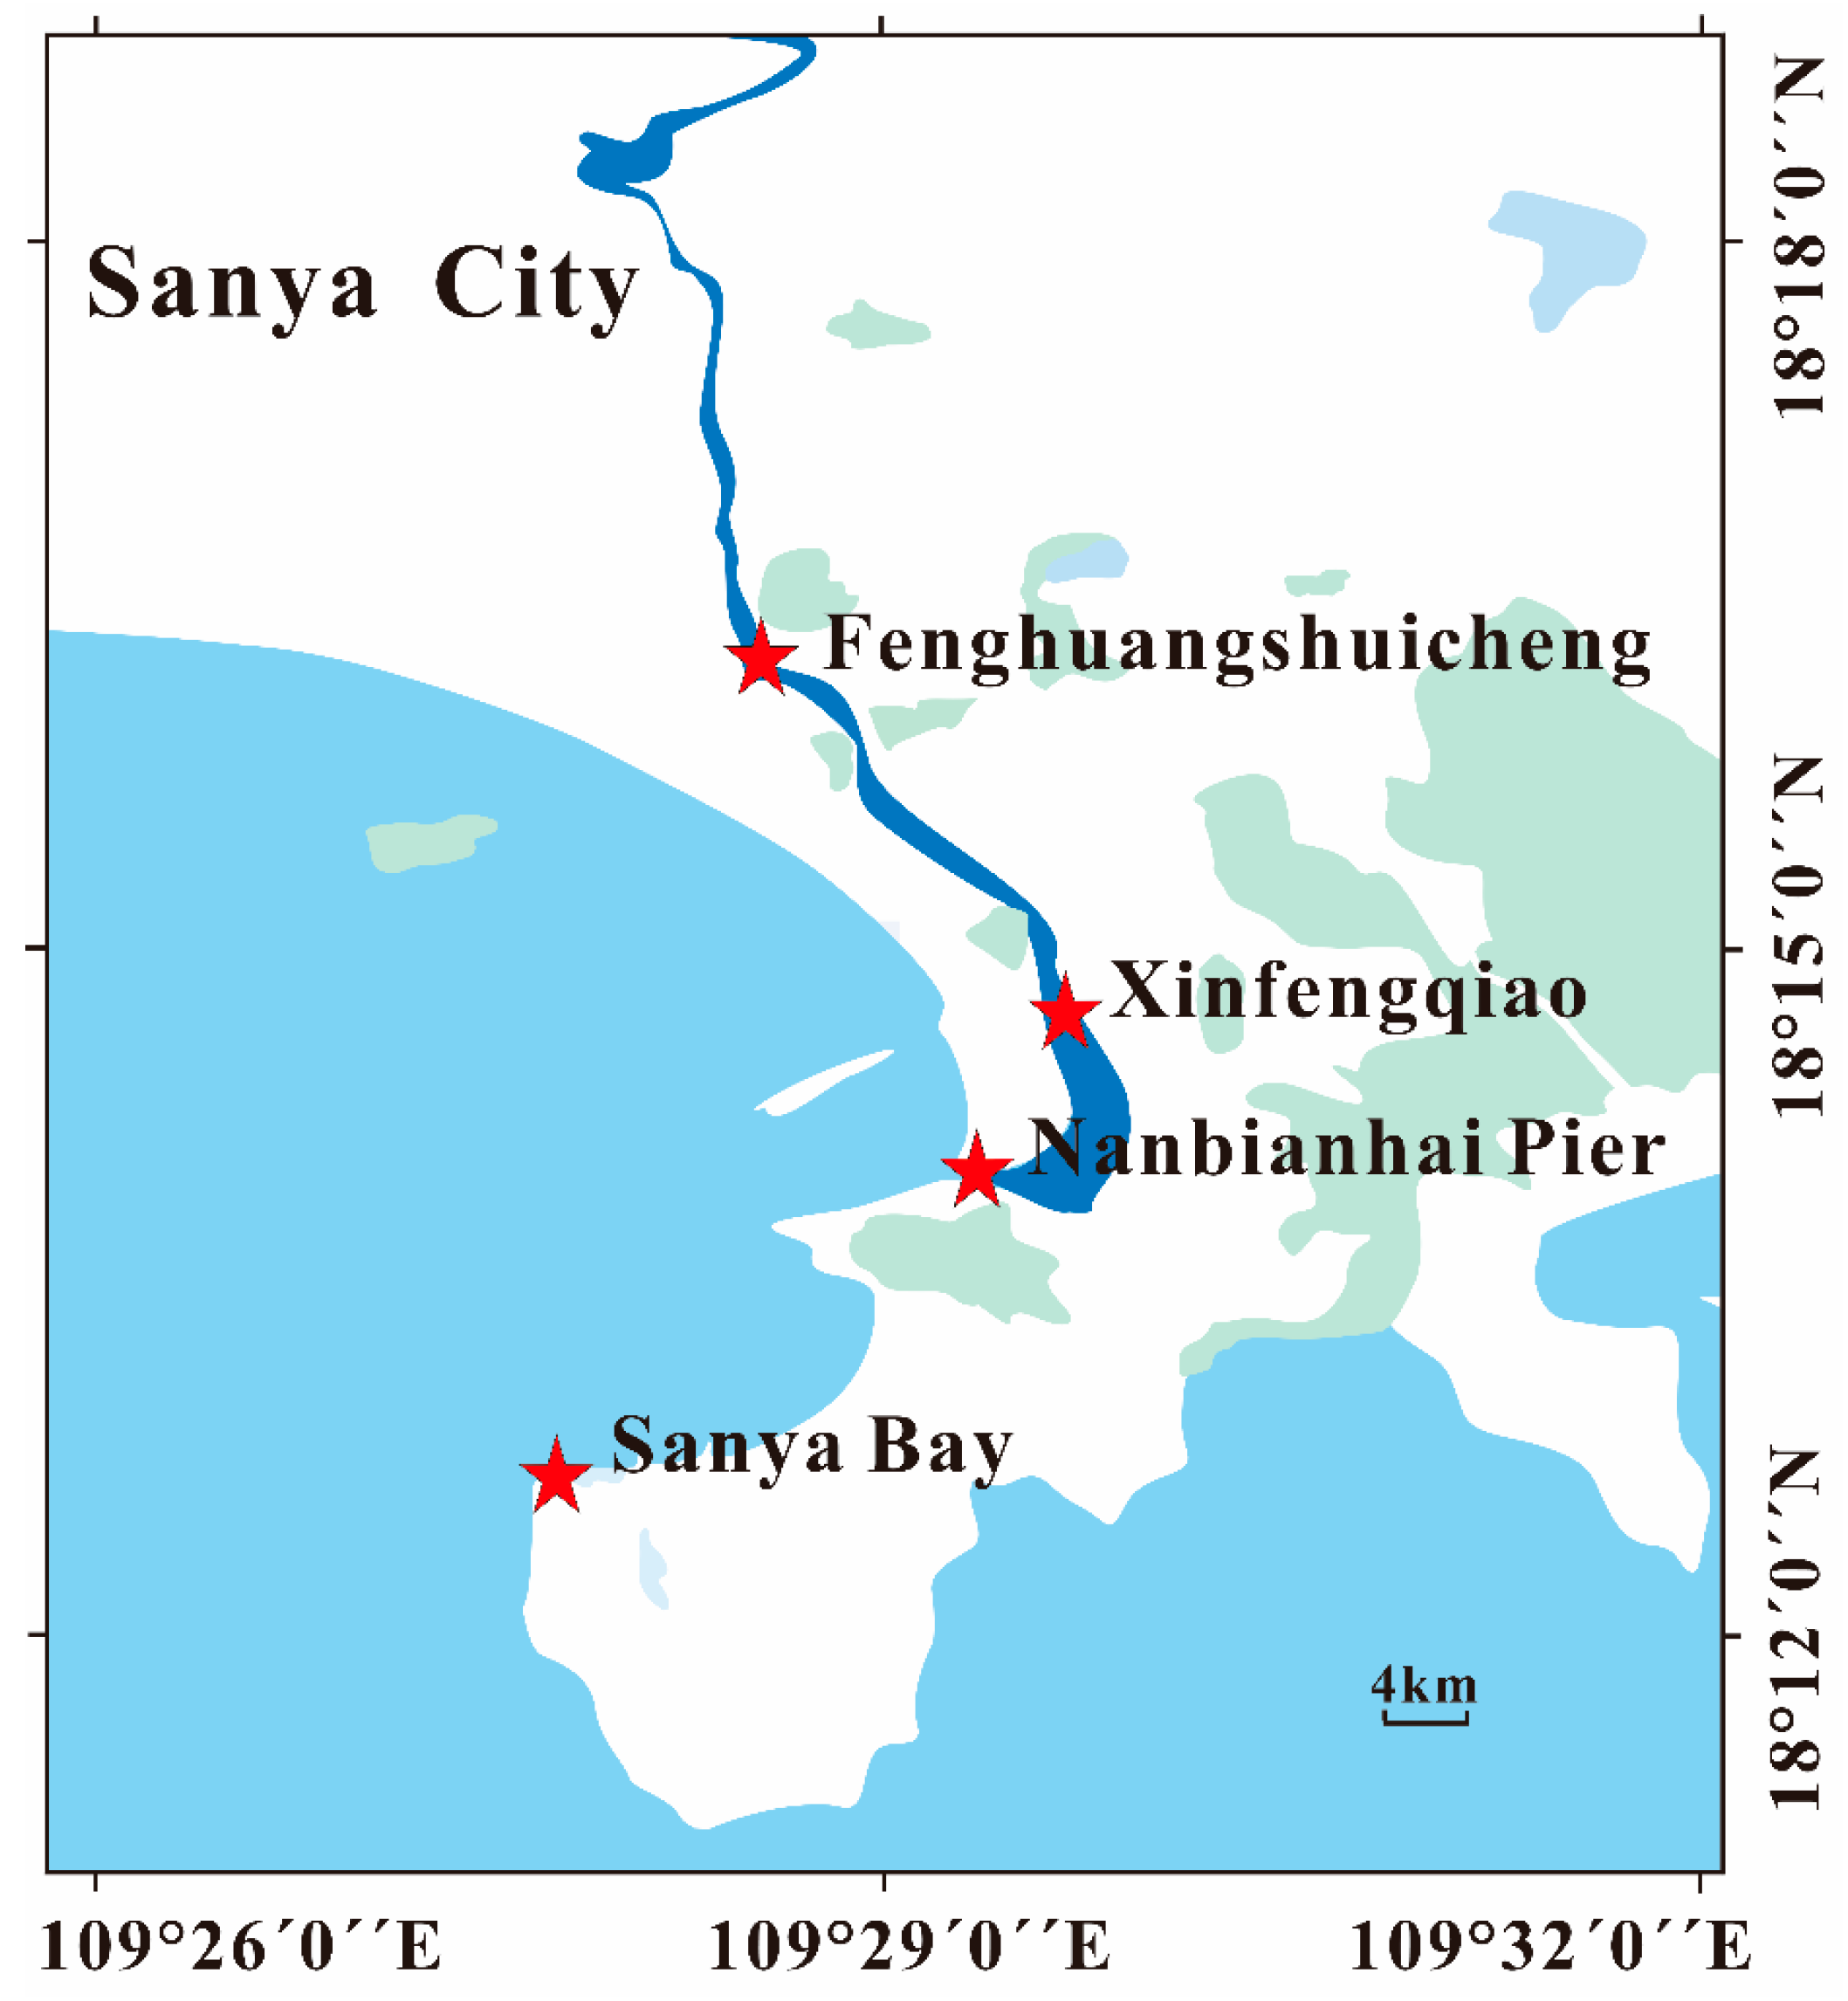
Figure 7.
SEM image of the circular mercury film before (a) and (b) after a period of testing.
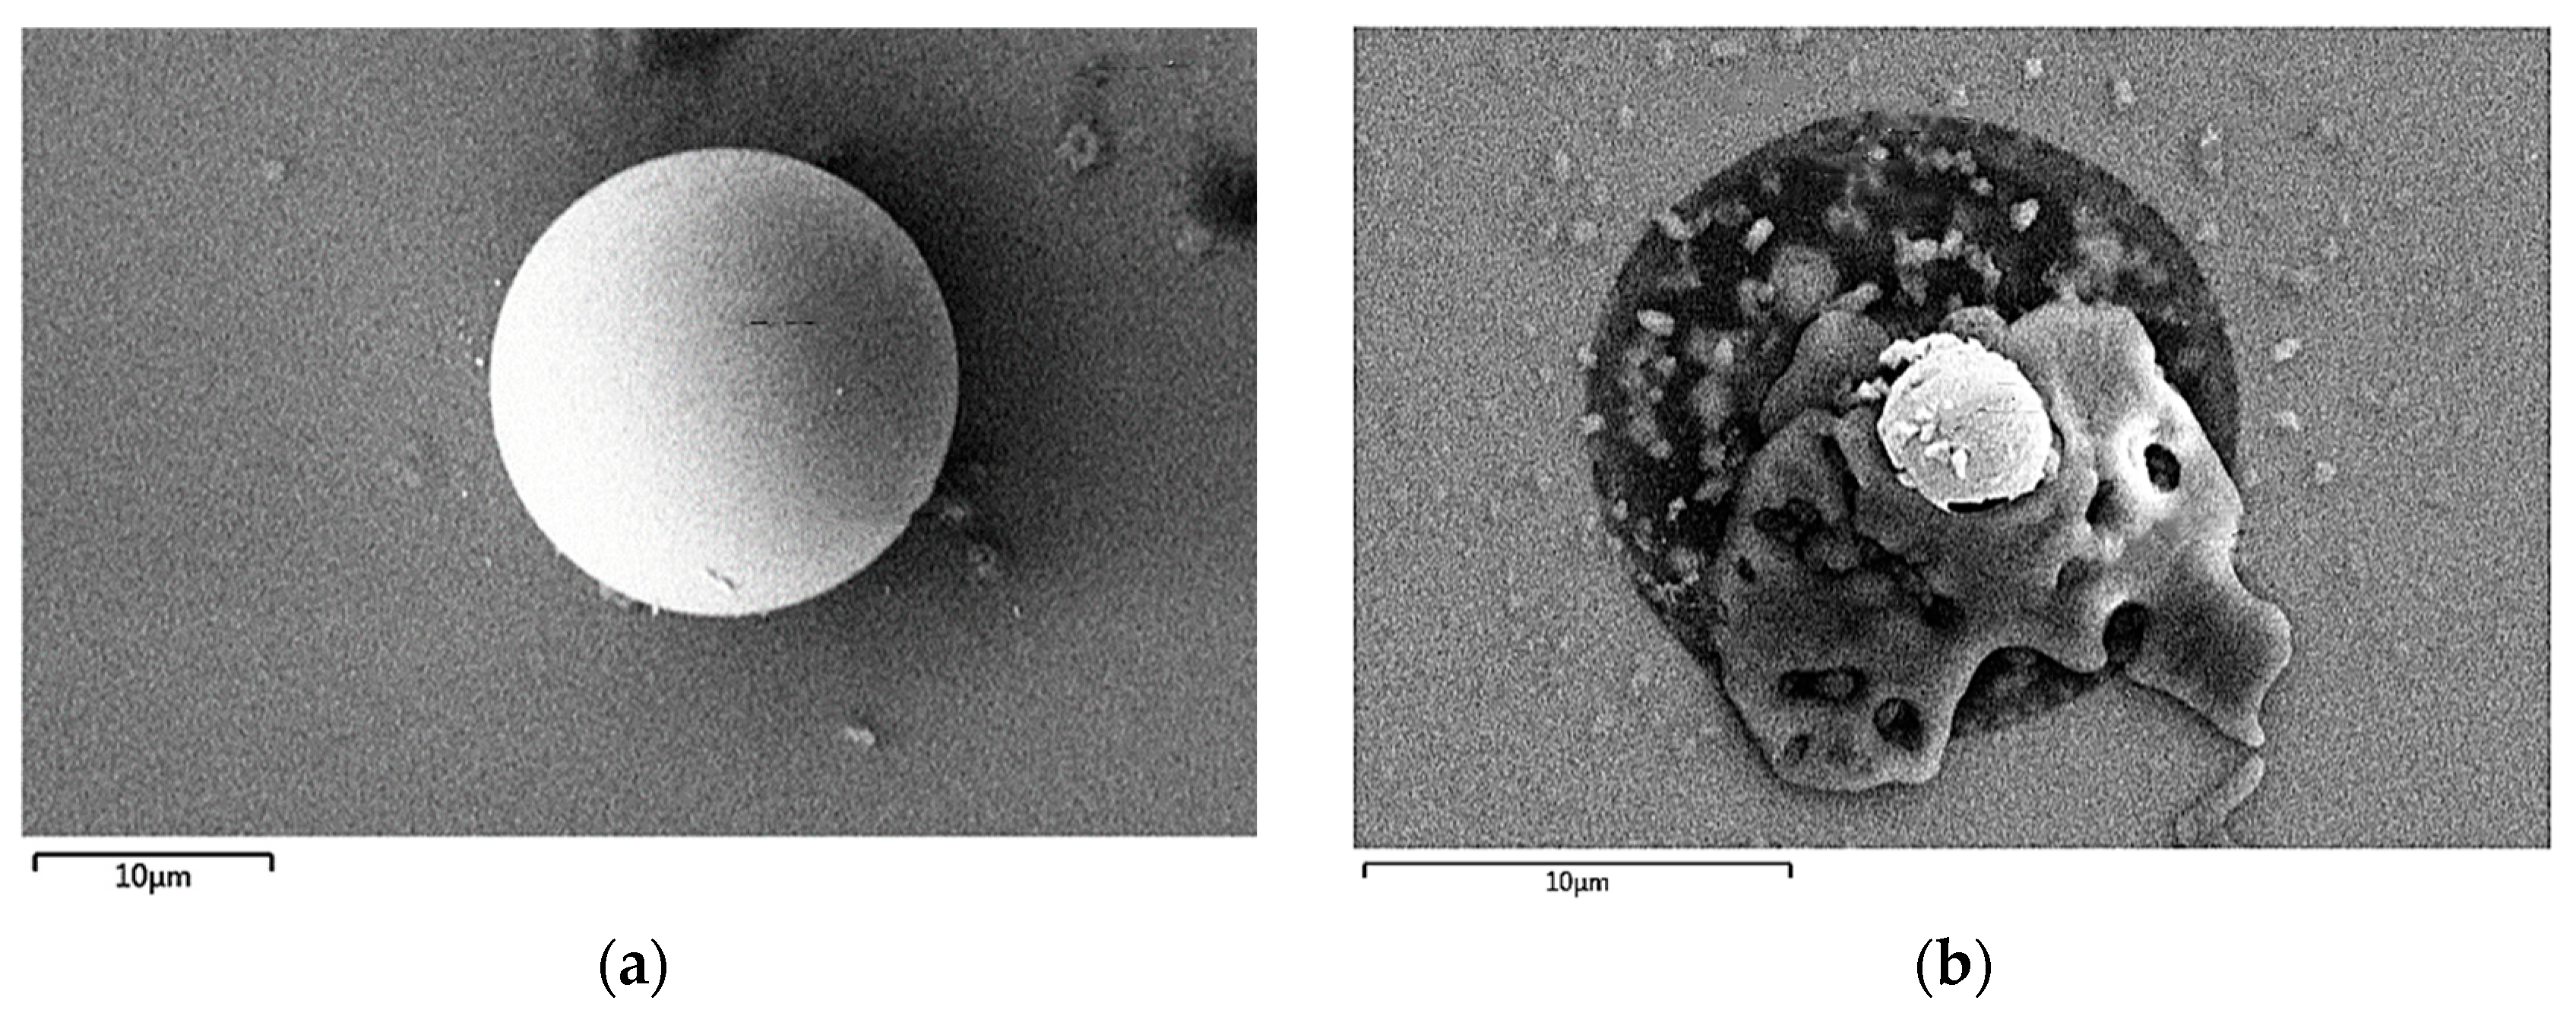
Figure 8.
(a) Pb(II) and (c) Cu(II) dissolution peaks at different concentrations and linearization results for (b) Pb(II) and (d) Cu(II).
Figure 8.
(a) Pb(II) and (c) Cu(II) dissolution peaks at different concentrations and linearization results for (b) Pb(II) and (d) Cu(II).
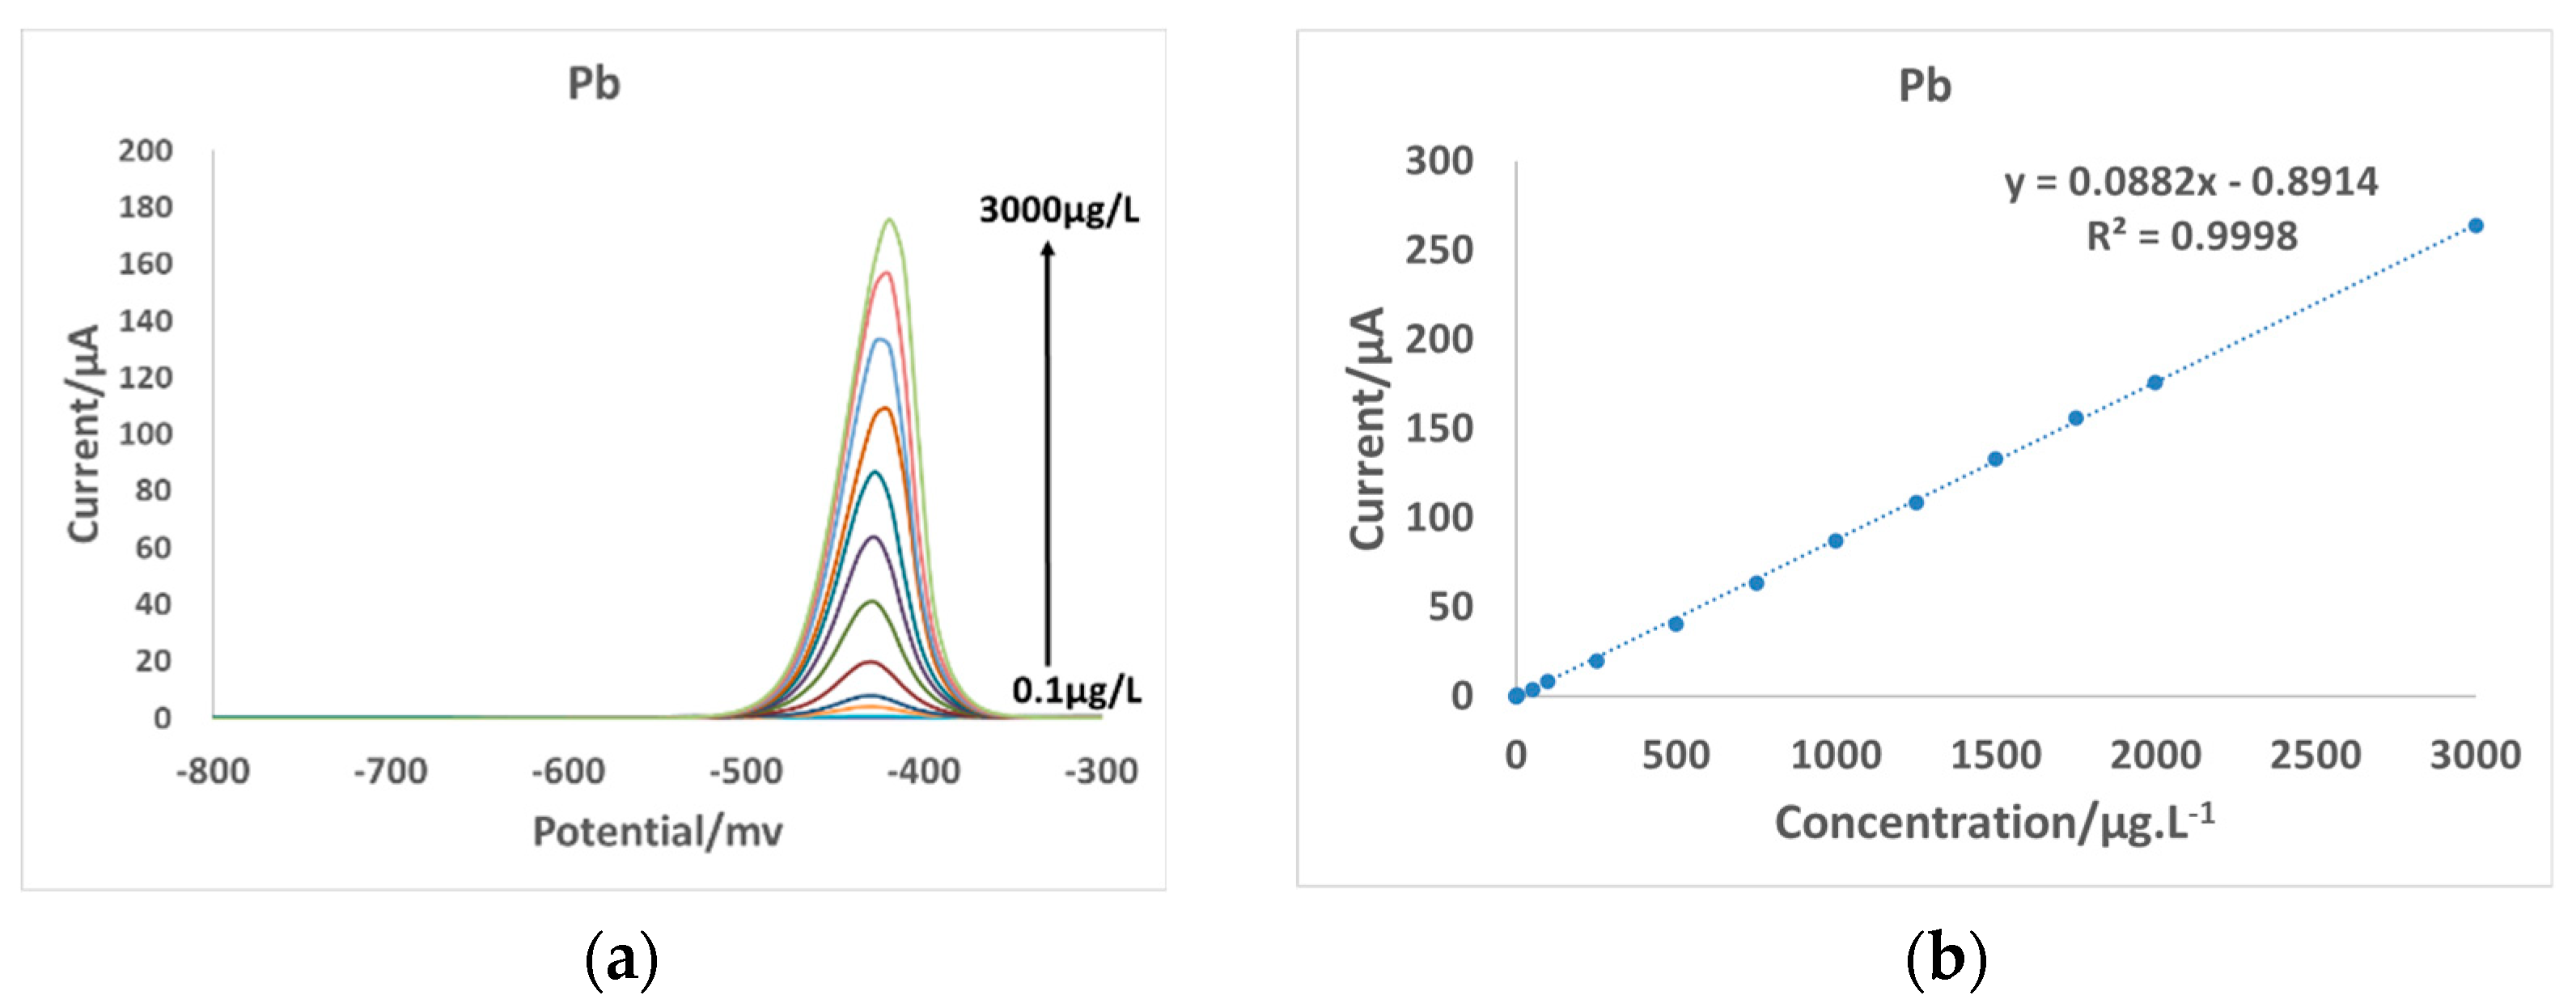
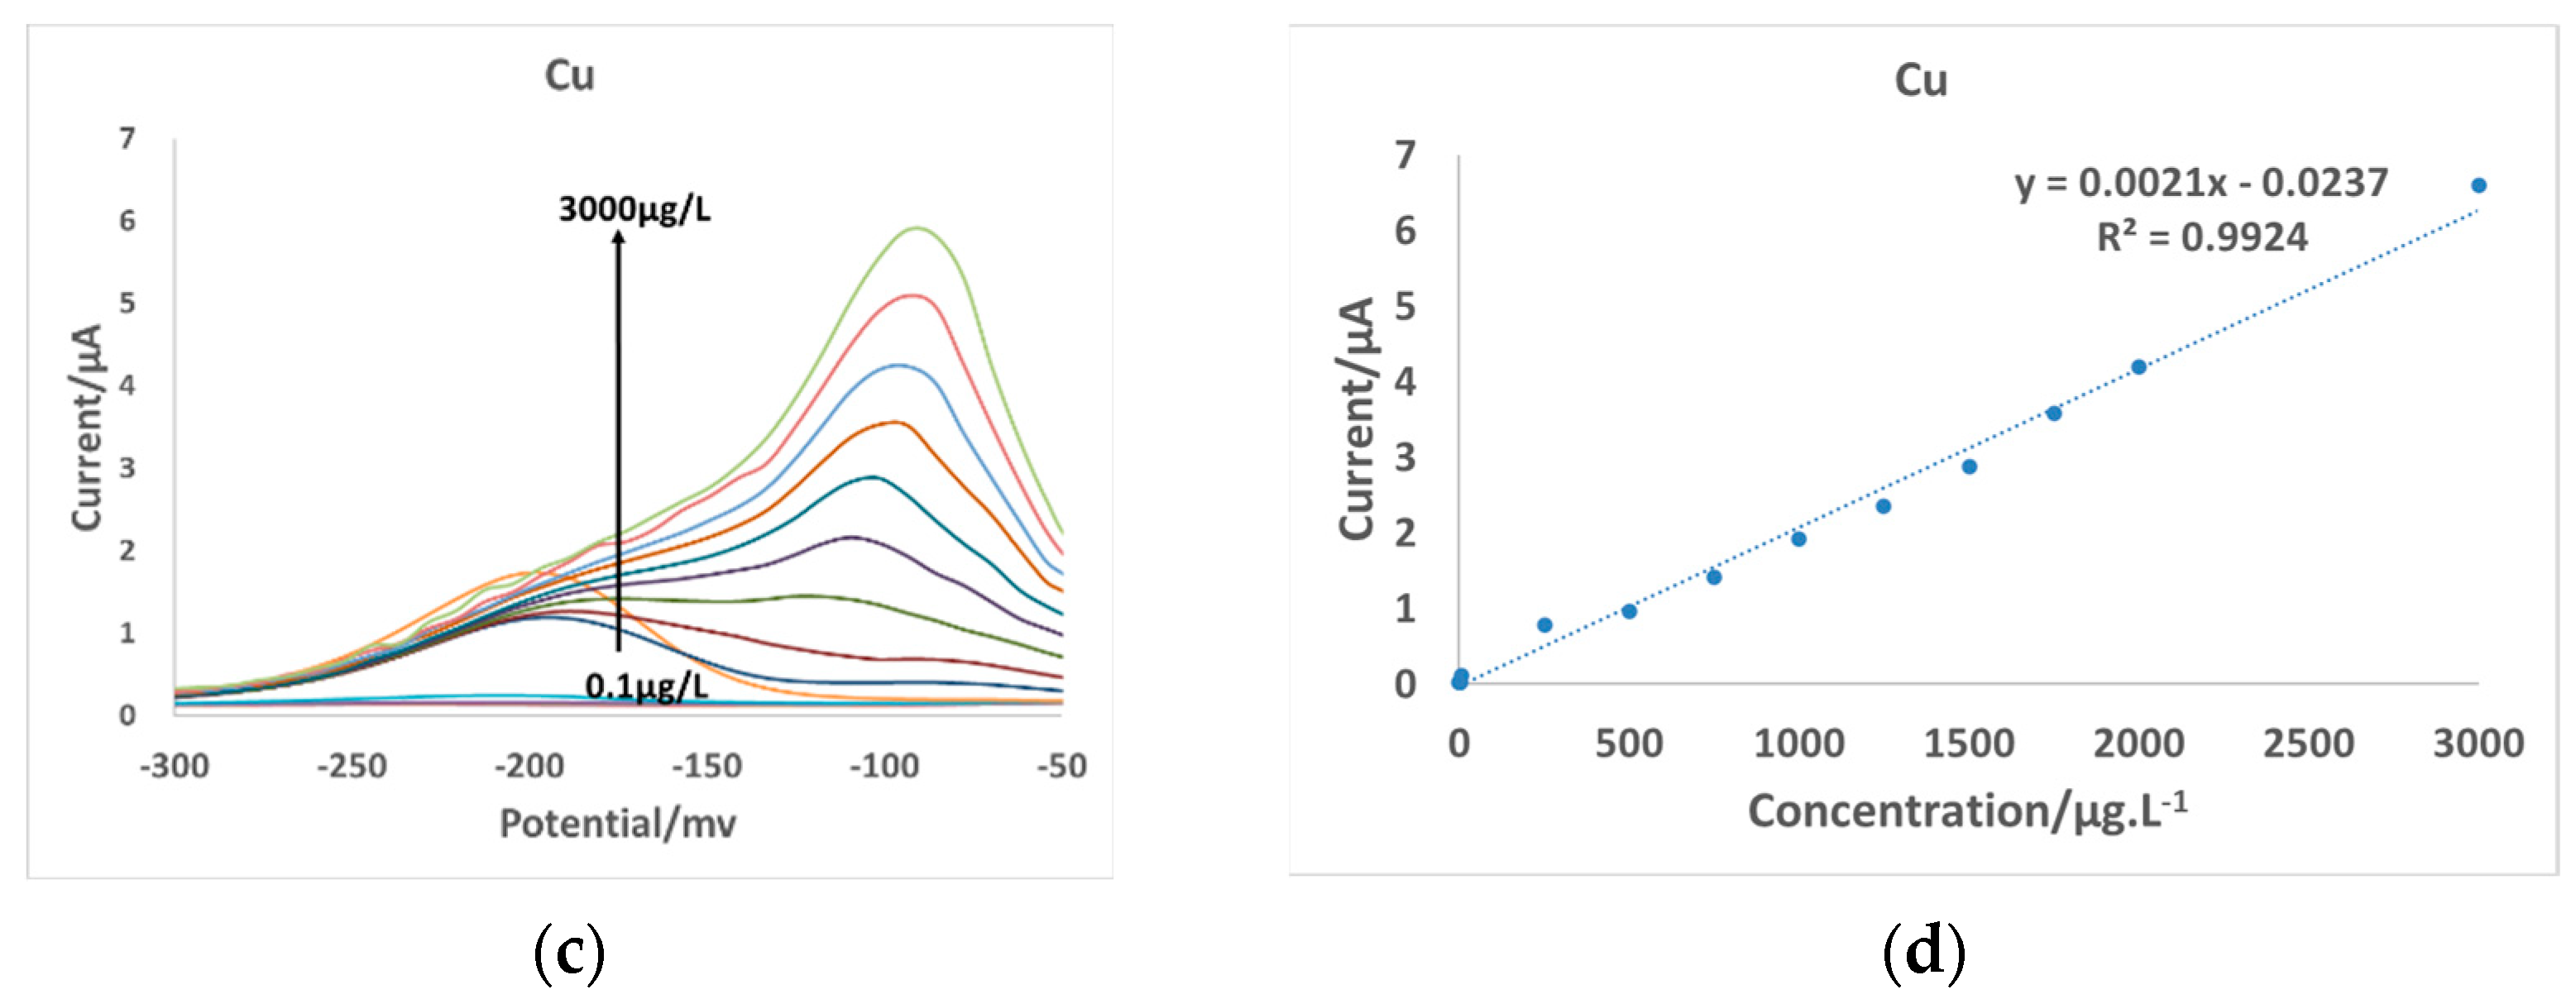
Figure 9.
(a) Cu(II) repeatability tests; (b) RSD.
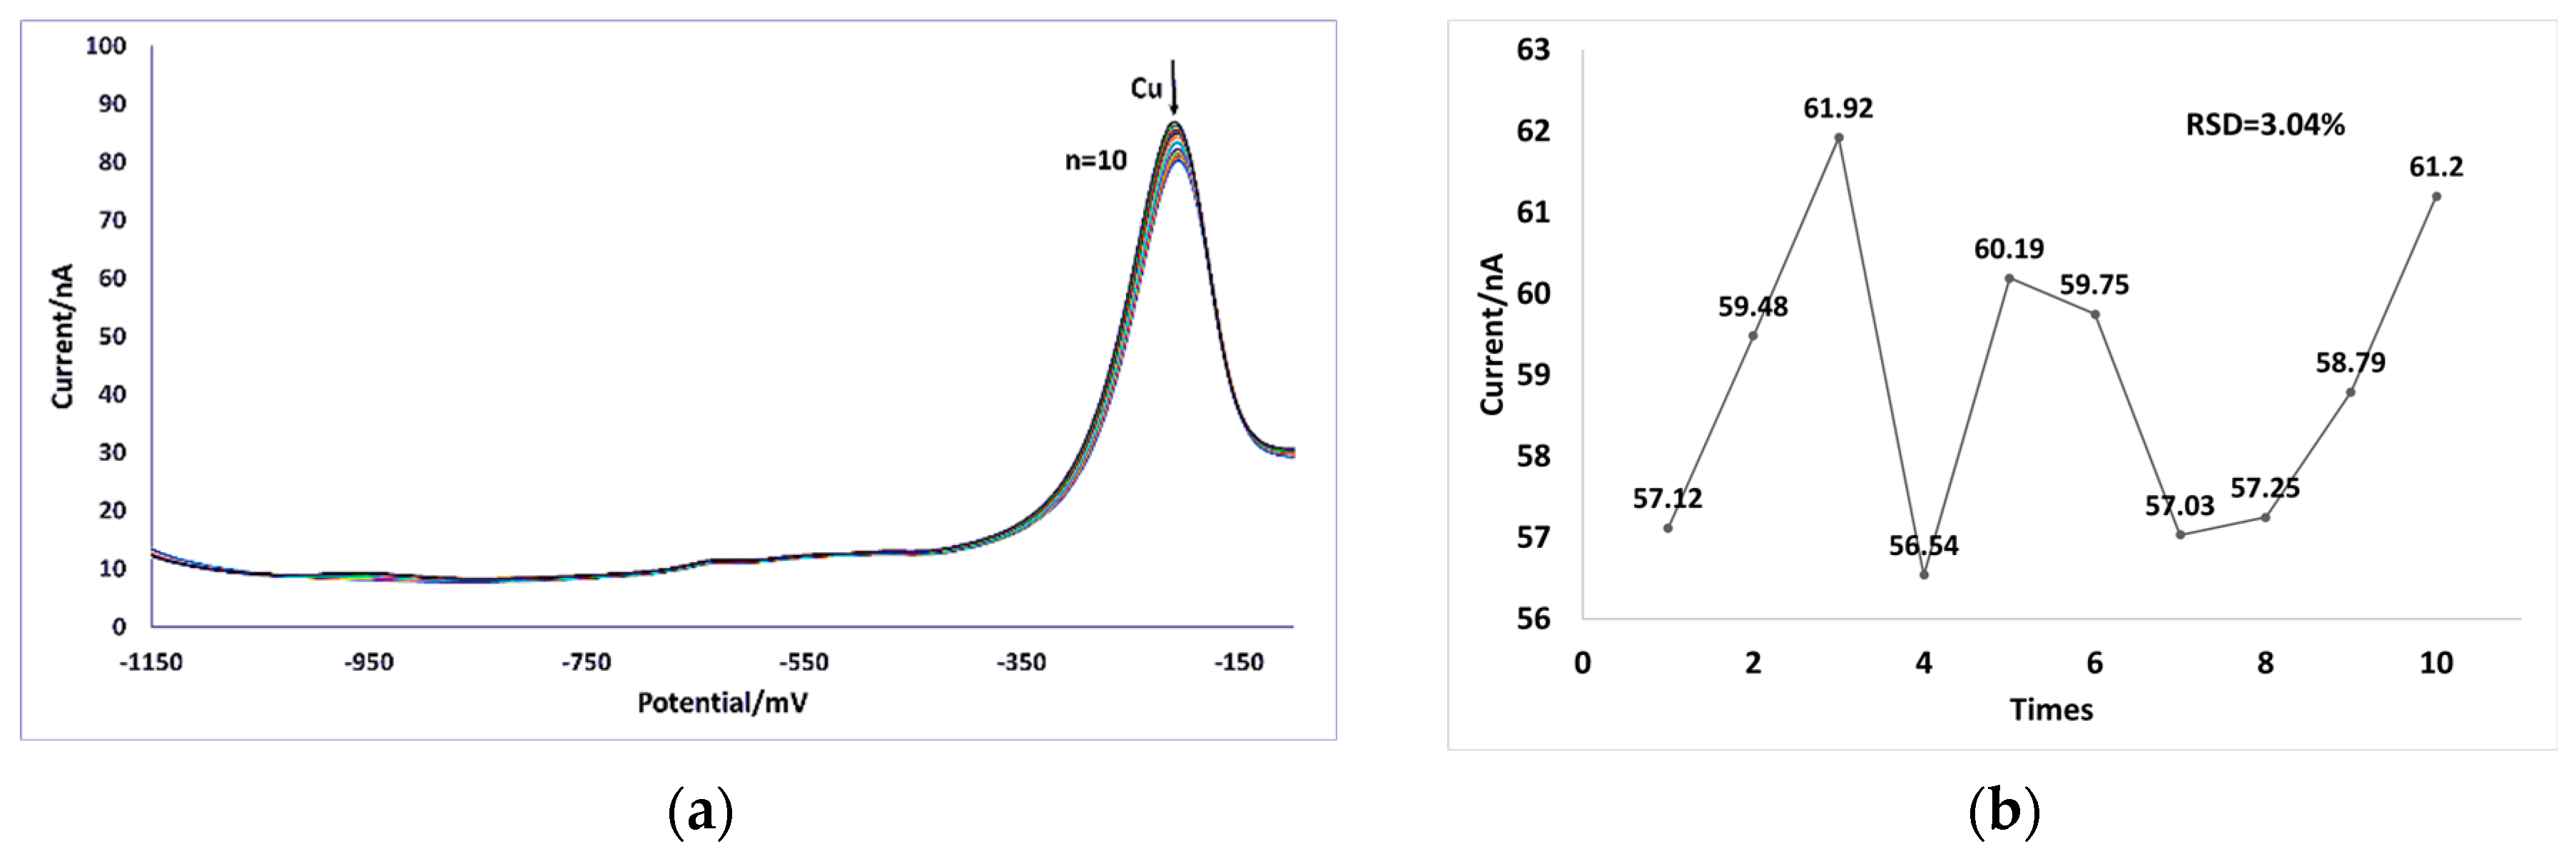
Figure 10.
(a) Electrode standard addition tests for Cd(II), Pb(II), and Cu(II) ions. (b) Cd(II), (c) Pb(II), and (d) Cu(II) standard curves obtained by standard addition.
Figure 10.
(a) Electrode standard addition tests for Cd(II), Pb(II), and Cu(II) ions. (b) Cd(II), (c) Pb(II), and (d) Cu(II) standard curves obtained by standard addition.
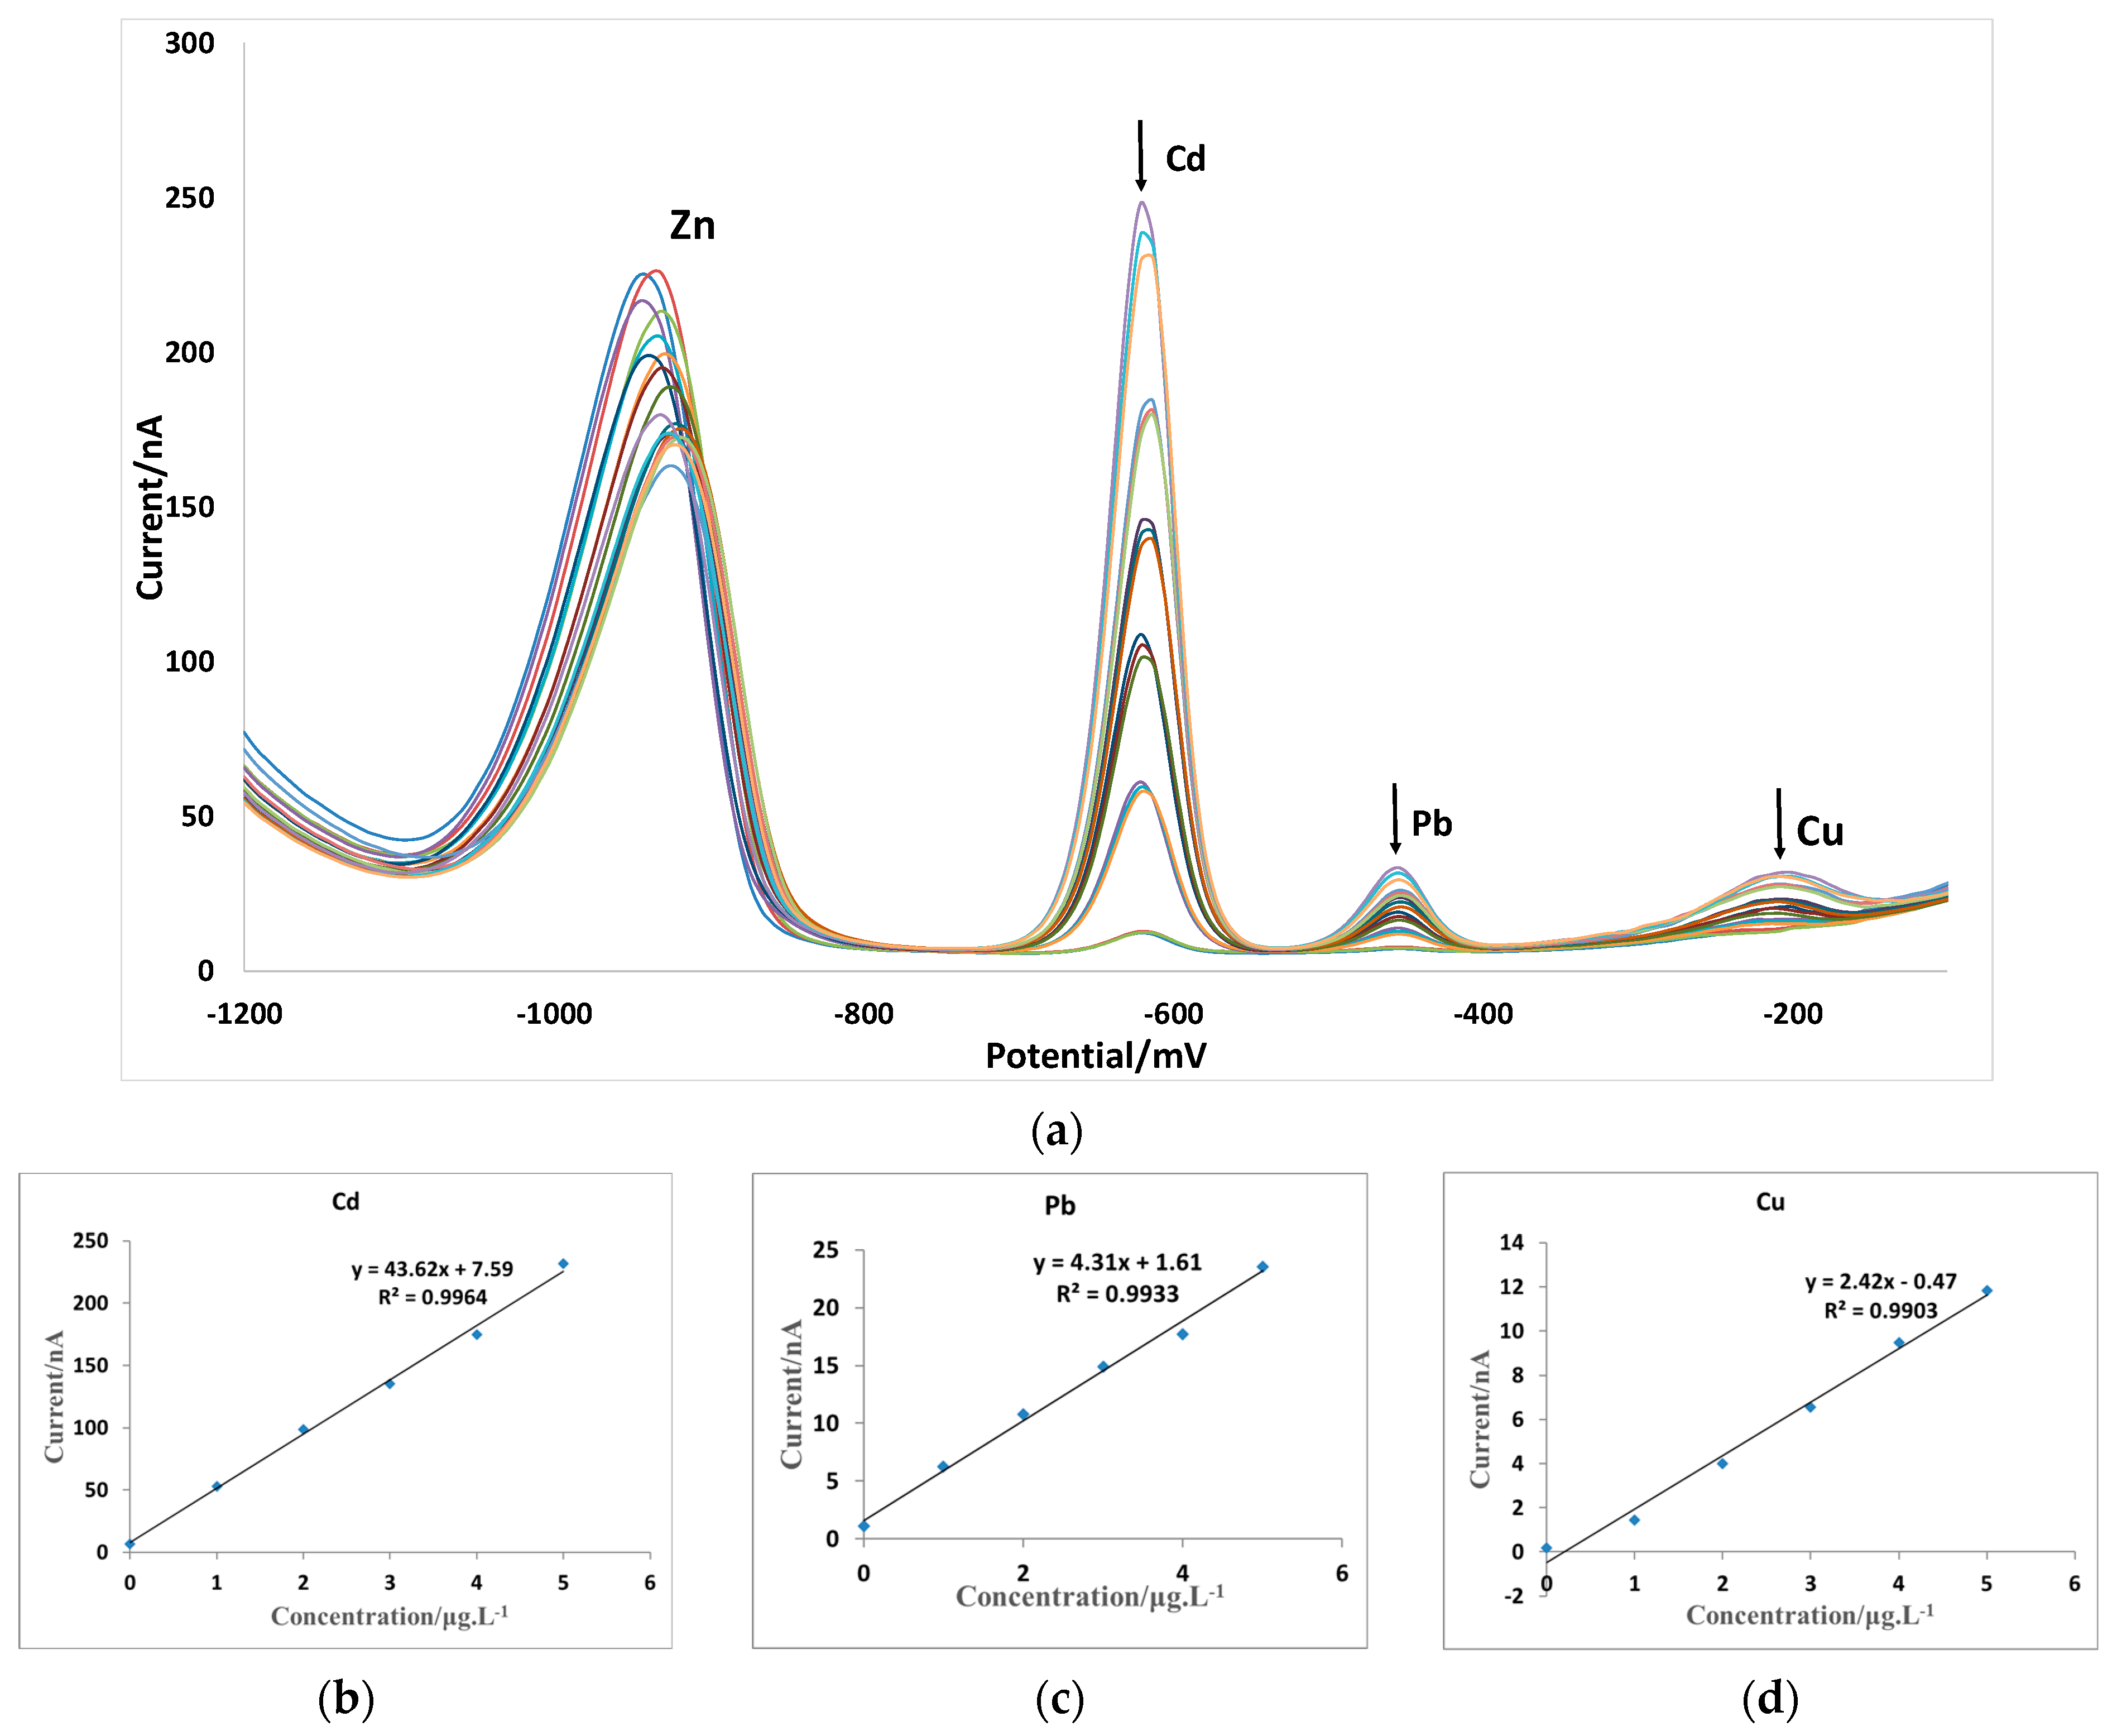
Figure 11.
(a) Sanya Bay total dissolved state sample tests for Cu(II) ions. (b) Standard curves obtained by standard addition.
Figure 11.
(a) Sanya Bay total dissolved state sample tests for Cu(II) ions. (b) Standard curves obtained by standard addition.

Table 1.
SWASV core parameter set.
| Sampling Point | Pretreatment |
|---|---|
| E (initial) | −1200 to −800 mV |
| E (final) | −100 to 0 mV |
| Pulse amplitude | 25 mV |
| Step amplitude | 8 mV |
| Frequency | 15Hz |
| Preconc | −1200 to −800 mV; t = 600 s |
Table 2.
Sampling points and sampling details.
| Sampling Point | Pretreatment |
|---|---|
| Sanya Bay | filtration with acid 1 L × 3; filtration 1 L × 3 |
| Nanbianhai Pier | filtration with acid 1 L × 3; filtration 1 L × 3 |
| Xinfengqiao | filtration with acid 1 L × 3; filtration 1 L × 3 |
| Fenghuangshuicheng | filtration with acid 1 L × 3; filtration 1 L × 3 |
Table 3.
Comparison of reported electrodes and measurement methods.
| Electrode | Measurement Method | Pb Detection Range (μg/L) | Pb Sensitivity (nA/μg/L) | Pb Detection Limit (μg/L) | Cu Detection Range (μg/L) | Cu Sensitivity (nA/μg/L) | Cu Detection Limit (μg/L) | Reference |
|---|---|---|---|---|---|---|---|---|
| Bi/AuNP-SPCE | DPV | 1.00–150.00 | 0.48 | 0.03 | 1.00–150.00 | 0.48 | 0.03 | [33] |
| RGO-CSCS/PLL/GCE | DPV | 0.05–2.00 | 4.84 | 0.02 | 0.05–2.00 | 4.84 | 0.02 | [34] |
| C60-CS/GCE | DPV | 1.04–1242.00 | 1.29 | 0.21 | 6.40–384.00 | 1.29 | 0.21 | [35] |
| F-MWCNT | SWV | 5.80–6210.00 | 0.21 | 1.74 | 1.09–2016.00 | 0.21 | 1.74 | [36] |
| GCE-BFS | DPV | 103.50–16,560.00 | 0.15 | 17.39 | 32.00–5120.00 | 0.15 | 17.39 | [37] |
| ZFO/GCE | DPV | 20.70–414.00 | 0.56 | 1.06 | 6.40–64.00 | 0.56 | 1.06 | [38] |
| MAE | SWV | 0.1–3000 | 4.31 | 0.01 | 0.1–3000 | 2.42 | 0.02 | this study |
Bi/AuNP-SPCE: screen-printed bismuth film and gold-nanoparticle-modified carbon electrode; RGO-CS/PLL/GCE: reduced graphene oxide, chitosan, and polylysine nanocomposite; C60-CS/GCE: fullerene-and-chitosan-modified glassy carbon electrode; F-MWCNT/Fe3O4/GCE: glassy carbon electrode modified with fluorinated multiwalled carbon nanotubes and tetrakis iron oxide nanoparticles; GCE-BFS: glassy carbon electrode modified with blast-furnace slag; ZFO/GCE: glassy carbon electrode modified with ZnFe2O4-nanoparticle-modified glassy carbon electrode; GCE-BFS: blast-furnace-slag-modified glassy carbon electrode; ZFO/GCE: ZnFe2O4-modified glassy carbon electrode; DPV: differential pulse voltammetry; SWV: square wave voltammetry.
Table 4.
Ionic state sample tests.
| Sampling Location | Pb Ion Concentration (μg/L) | Cu Ion Concentration (μg/L) |
|---|---|---|
| Sanya Bay | 0.39 | 0.28 |
| Nanbianhai Pier | 0.61 | 0.45 |
| Xinfengqiao | 0.12 | 0.23 |
| Fenghuangshuicheng | 0.35 | 0.25 |
Table 5.
Total dissolved state sample tests.
| Sampling Location | Pb Ion Concentration (μg/L) | Cu Ion Concentration (μg/L) |
|---|---|---|
| Sanya Bay | 0.98 | 0.79 |
| Nanbianhai Pier | 0.78 | 0.70 |
| Xinfengqiao | 0.42 | 0.96 |
| Fenghuangshuicheng | 0.53 | 0.66 |
Disclaimer/Publisher’s Note: The statements, opinions and data contained in all publications are solely those of the individual author(s) and contributor(s) and not of MDPI and/or the editor(s). MDPI and/or the editor(s) disclaim responsibility for any injury to people or property resulting from any ideas, methods, instructions or products referred to in the content. |
© 2024 by the authors. Licensee MDPI, Basel, Switzerland. This article is an open access article distributed under the terms and conditions of the Creative Commons Attribution (CC BY) license (https://creativecommons.org/licenses/by/4.0/).
Share and Cite
MDPI and ACS Style
Zhang, J.; Wu, S.; Zhang, F.; Jin, B.; Yang, C. Improved Microelectrode Array Electrode Design for Heavy Metal Detection. Chemosensors 2024, 12, 51. https://doi.org/10.3390/chemosensors12040051
AMA Style
Zhang J, Wu S, Zhang F, Jin B, Yang C. Improved Microelectrode Array Electrode Design for Heavy Metal Detection. Chemosensors. 2024; 12(4):51. https://doi.org/10.3390/chemosensors12040051
Chicago/Turabian StyleZhang, Jian, Shijun Wu, Feng Zhang, Bo Jin, and Canjun Yang. 2024. "Improved Microelectrode Array Electrode Design for Heavy Metal Detection" Chemosensors 12, no. 4: 51. https://doi.org/10.3390/chemosensors12040051
Note that from the first issue of 2016, this journal uses article numbers instead of page numbers. See further details here.