An Enzyme Immunoassay Developed for the Determination of Methylene Blue in Aquatic Products Based on a Novel Hapten


1
Key Laboratory of Exploration and Utilization of Aquatic Genetic Resources of the Ministry of Education, Engineering Research Center of Environmental DNA and Ecological Water Health Assessment, Shanghai Ocean University, Shanghai 201306, China
2
Laboratory of Quality Safety and Processing for Aquatic Product, East China Sea Fisheries Research Institute, Chinese Academy of Fishery Sciences, Shanghai 200090, China
*
Author to whom correspondence should be addressed.
†
These authors contributed equally to this work.
Chemosensors 2024, 12(4), 52; https://doi.org/10.3390/chemosensors12040052
Submission received: 29 February 2024
/
Revised: 25 March 2024
/
Accepted: 25 March 2024
/
Published: 31 March 2024
(This article belongs to the Section Analytical Methods, Instrumentation and Miniaturization)
Abstract
:Methylene blue (MB) is a chemical dye which is used as an alternative drug for malachite green. In this study, based on computational chemistry, a novel hapten (TM) of MB was designed by comparing the conformational and electronic properties of MB. TM was synthesized and further conjugated with bovine serum albumin (BSA) and Ovalbumin (OVA). Then, the polyclonal antibodies were obtained by immunization with the immunogen of TM-BSA. Under optimal conditions, a sensitive indirect competitive enzyme-linked immunosorbent assay (icELISA) was developed for the determination of MB, with an IC50 value of 41.5 μg L−1 and displaying a cross reaction of 78.2~88.9% with three different MB metabolins. The limit of detection (LOD) and the limit of quantitation (LOQ) for MB were validated to be 4.8 µg/kg and 6.0 µg/kg, respectively. Spiking experiments showed recoveries between 82.3% and 84.3%, with a relative standard deviation (RSD) of ≤6%. The results showed the generated polyclonal antibodies from the new hapten TM were reliable and could be used for detecting MB in fishery productions.
1. Introduction
Methylene blue (MB) (Figure 1), a member of the phenothiazine class of compounds, was originally synthesized as a dye for the textile industry [1,2]. Subsequently, MB was used in the study of malaria treatment and achieved success, becoming the first synthetic compound used to treat malaria [3]. Afterwards, MB was used to treat methemoglobinemia, cyanide poisoning, neurodegenerative diseases, and so on [4,5,6]. In recent years, MB has attracted increasing attention in the field of water treatment as an effective disinfectant [7]. Recently, MB plays a good role in the prevention and control of hydromildew [8] in aquaculture, where it is used as an alternative drug for malachite green in preventing and treating water mildew [9,10]. Additionally, with the fast-developing dye-related industry, a massive quantity of MB wastewater is continuously discharged to the water [11], which can also lead to MB residues in fishes. The consumption of contaminated fish poses a great hazard to human health, causing nausea, vomiting, quadriplegia, and cyanosis [12]. In addition, the European Food Safety Authority (EFSA) decided that MB should be regarded as genotoxic [10]. Due to its potential risks [13,14,15], MB was banned in food-producing animals. Moreover, the maximum residue limit (MRL) of MB in food products of animal origin has been established in Japan (10 µg/kg) [16]. At present, MB is not approved for use in aquaculture by the Chinese government. Therefore, it is essential to oversee the residues of MB in fisheries production.
Various methods have been explored for the analysis of MB and its metabolites, including ultraviolet spectrophotometry (UV) [17,18], high-performance liquid chromatography (HPLC) [19], high-performance liquid chromatography-tandem mass spectrometry (HPLC-MS/MS) [20,21,22], and surface-enhanced Raman spectroscopy (SERS) [23]. Notably, HPLC and HPLC-MS indeed offer high sensitivity and precise detection, establishing them as the preferred technologies in most standard testing methods. However, these methods require large instruments and professional testing personnel, which are not suitable for field testing. UV and SERS are usually utilized for rapid analysis of pollutants, but the sensitivity and selectivity of these methods need further improvement. In this aspect, an immunoassay, the enzyme-linked immunosorbent assay (ELISA), is the most commonly used method for detecting and quantifying residuals because of its simplicity, high-throughput detection capabilities, low cost, and high sensitivity and specificity [24,25,26,27]. Furthermore, icELISA is commonly employed for the screening of contaminants in the environment and food, playing a particularly significant role in grassroots food quality and safety monitoring. However, as we know, there is no report about immunoassays for the determination of MB in aquatic products. Therefore, the development of a rapid, cheap, and high-sensitivity immunoassay was urgently needed.
To establish an icELISA method for detecting MB in aquatic products, high-affinity antibodies against MB should be prepared. However, MB is a small molecular compound, which cannot independently induce the production of high-affinity antibodies. Therefore, it needs to combine with carrier proteins to induce the production of high-affinity antibodies. Unfortunately, MB has no functional group for direct conjugation with proteins. Consequently, a new hapten of MB must be synthesized. Typically, the target is modified to include functional groups such as amino, carboxyl, hydroxyl, etc., facilitating their binding with proteins.
The design of a hapten plays a crucial role in generating high-affinity antibodies [28,29], and multiple factors need to be considered, such as their immunogenicity, affinity, and ability to bind to the target molecule. Generally, an appropriate hapten should mimic the target molecule in terms of structural resemblance, size, steric conformation, electronic configuration, and hydrophobic property [30,31]. Through the rational design of a hapten, the binding of antibodies to the target molecule can be made more stable, thereby improving the affinity and specificity of the antibodies.
In the present study, we designed a novel hapten for MB by using molecular technology, which can induce antibodies with a high affinity for MB. Based on the polyclonal antibody, a highly sensitive icELISA method was developed for MB determination in aquatic products.
2. Materials and Methods
2.1. Reagents and Physical Measurements
All chemical reagents and solvents of analytical grade were purchased and used without further purification unless otherwise noted. MB was purchased from the United States Pharmacopeial Convention (Rockville, MD, USA); Azure A was purchased from Xiya Chemical Technology (Shandong) Co., Ltd. (Linyi, Shandong, China); Azure B was purchased from Beijing Zhengxiang Technology Co., Ltd. (Beijing, China); Azure C, freund’s complete adjuvant (cFA) and incomplete adjuvant (iFA) were purchased from Sigma-Aldrich Company (St. Louis, MO, USA). Dimethylsulfoxide (DMSO), ethanol, and dimethylformamide (DMF) were purchased from Shanghai Lingfeng Chemical Reagent Co., Ltd. (Shanghai, China). N-Hydroxysuccinimide (NHS), n-butylamine, isobutyl chloroformate, dicyclohexylcarbodiimide (DCC), 3,3′,5,5′-tetramethylbenzidine (TMB), and bovine serum albumin (BSA) were all purchased from Sinopharm Chemical Reagent Co., Ltd. (Shanghai, China). Ovalbumin (OVA) and horseradish peroxidase (HRP) conjugated goat anti-rabbit IgG were purchased from Sango Biotech Co., Ltd. (Shanghi, China). All animal studies were performed in compliance with the institutional guidelines.
The synthesis of haptens was monitored by thin layer chromatography (TLC). Column chromatography was performed on flash silica gel (300~400 mesh) using the mixture of petroleum ether and ethyl acetate as eluent. Nuclear Magnetic Resonance spectra (NMR) were recorded on a Bruker AV-400 spectrometer in CDCl3 solvent using TMS as an internal standard. Mass spectra were performed on a Thermo TSQ Quantum Access MAX mass spectrometer. Optical absorption spectra were obtained by a UV-2450 spectrophotometer (Shimadzu, kyoto, Japan). Fluorescence emission spectra were recorded on a Shimadzu RF-5301PC spectrofluorometer using 1 cm path length cuvettes at r.t. The slit widths were set to 5 nm. Unless otherwise noted, all reagents were obtained from Nanjing WANQING chemical Glassware & Instrument Co., Ltd. (Nanjing, China).
2.2. Synthesis of Artificial Antigen
2.2.1. The Synthesis of S-(2-amino-5-(dimethylamino)phenyl) O-Hydrogen Sulfurothioate (Intermediate I)
N,N-dimethylbenzene-1,4-diamine (10 g, 73 mmol) was added to a solution of aluminum sulfate (45 g, 65 mmol), sodium thiosulfate (22 g, 140 mmol), and zinc chloride (8.8 g, 63 mmol) in 200 mL of water. The mixture was stirred at 0 °C for 5 min. Then, a solution of potassium chromate (5.0 g, 17 mmol) in water (30 mL) was added dropwise over 10 min at 0 °C. The mixture was further stirred at 0–5 °C for 2 h, and slowly warmed to room temperature. The formed precipitate was obtained by filtration. The filter cake was washed with water (200 mL) and acetone (100 mL). The crude product was further triturated by methyl tert-butyl ether (200 mL) to afford Intermediate I as purple solid (yield 72%). ESI-MS: m/z calcd. For C8H12N2O3S2 [M + H]+: 249.14; found 249.22.
2.2.2. The Synthesis of 5-(Methyl(phenyl)amino)pentanoic Acid (Intermediate II)
A mixture of N-methyl aniline (10.1 mL, 93 mmol), 2,6-dimethyl pyridine (11.3 mL, 100 mmol), and 5-bromovaleric acid ethyl ester (15.5 mL, 100 mmol) in acetonitrile (100 mL) was stirred at reflux for 30 h. The mixture was concentrated, and ethyl acetate (50 mL) was added. The organic phase was washed twice with water (20 mL), dried with anhydrous sodium sulfate, and concentrated to provide a crude product. The obtained crude product was added to an aqueous sodium hydroxide solution (30 mL, 2.5 mol), and the mixture was stirred at reflux for 2 h. After cooling to room temperature, the mixture was adjusted to pH = 5 with conc. HCl. The solution was extracted with ethyl acetate (30 mL × 3). The combined organic phase was dried with anhydrous sodium sulfate and concentrated to provide crude product, which was purified by silica gel column (n-hexane/ethyl acetate = 1:1) to give Intermediate II as white solid (yield 46.7%). ESI-MS: m/z calcd. for C12H17NO2 [M + H]+: 208.14; found 208.24.
2.2.3. The Synthesis of the Novel Hapten (TM)
A solution of Intermediate I (2.4 g, 9.7 mmol) and Intermediate II (2.0 g, 9.7 mmol) in methanol and water (200 mL, 5:2) was heated to 50 °C. Then, silver carbonate on celite (5.2 g, 19 mmol) was added slowly. The mixture was further stirred at reflux for 2 h. The mixture was filtered and concentrated to provide crude product, which was purified by silica gel column (dichloromethane/methanol = 9:1) to produce the final target as a blue solid (yield 17.8%). 1H NMR (400 MHz, CD3OD): δ 7.81 (d, 2H, J = 2.8 Hz, ArH), 7.41 (q, 2H, J = 2.8 Hz, ArH), 7.26–7.24 (m, 2H, ArH), 3.72 (s, 9H, N-CH3), 2.41 (t, 2H, J = 6.8 Hz, CH2), 1.77–1.73 (m, 4H, CH2), 0.89 (m, 2H, CH2); ESI-MS: m/z calcd. for C12H17NO2 [M + H]+: 370.16; found 370.53.
2.2.4. Preparation of TM-BSA and TM-OVA
The hapten–protein conjugates of TM-BSA and TM-OVA were prepared according to a similar NHS ester method [31]. For TM-BSA, a solution of TM (37.0 mg, 0.1 mmol) in DMF (0.4 mL) was added to DCC (20.6 mg, 0.1 mmol) and NHS (11.5 mg, 0.1 mmol) at 0 °C. The mixture was stirred at 0 °C for 1.5 h. BSA (2.5 mL, 16.4 mg/mL) was added dropwise and the mixture was further stirred at 0 °C for 1.5 h. The mixture was then stirred at 4 °C for 20 h. The conjugate was transferred into a dialysis bag and soaked in PBS solution (0.2 mol/L, containing 0.9% NaCl) for 4 days by changing the PBS solution every day. The antigen products were freeze-dried and packaged under cryopreservation. The conjugate of TM-OVA was obtained according to the similar method for TM-BSA.
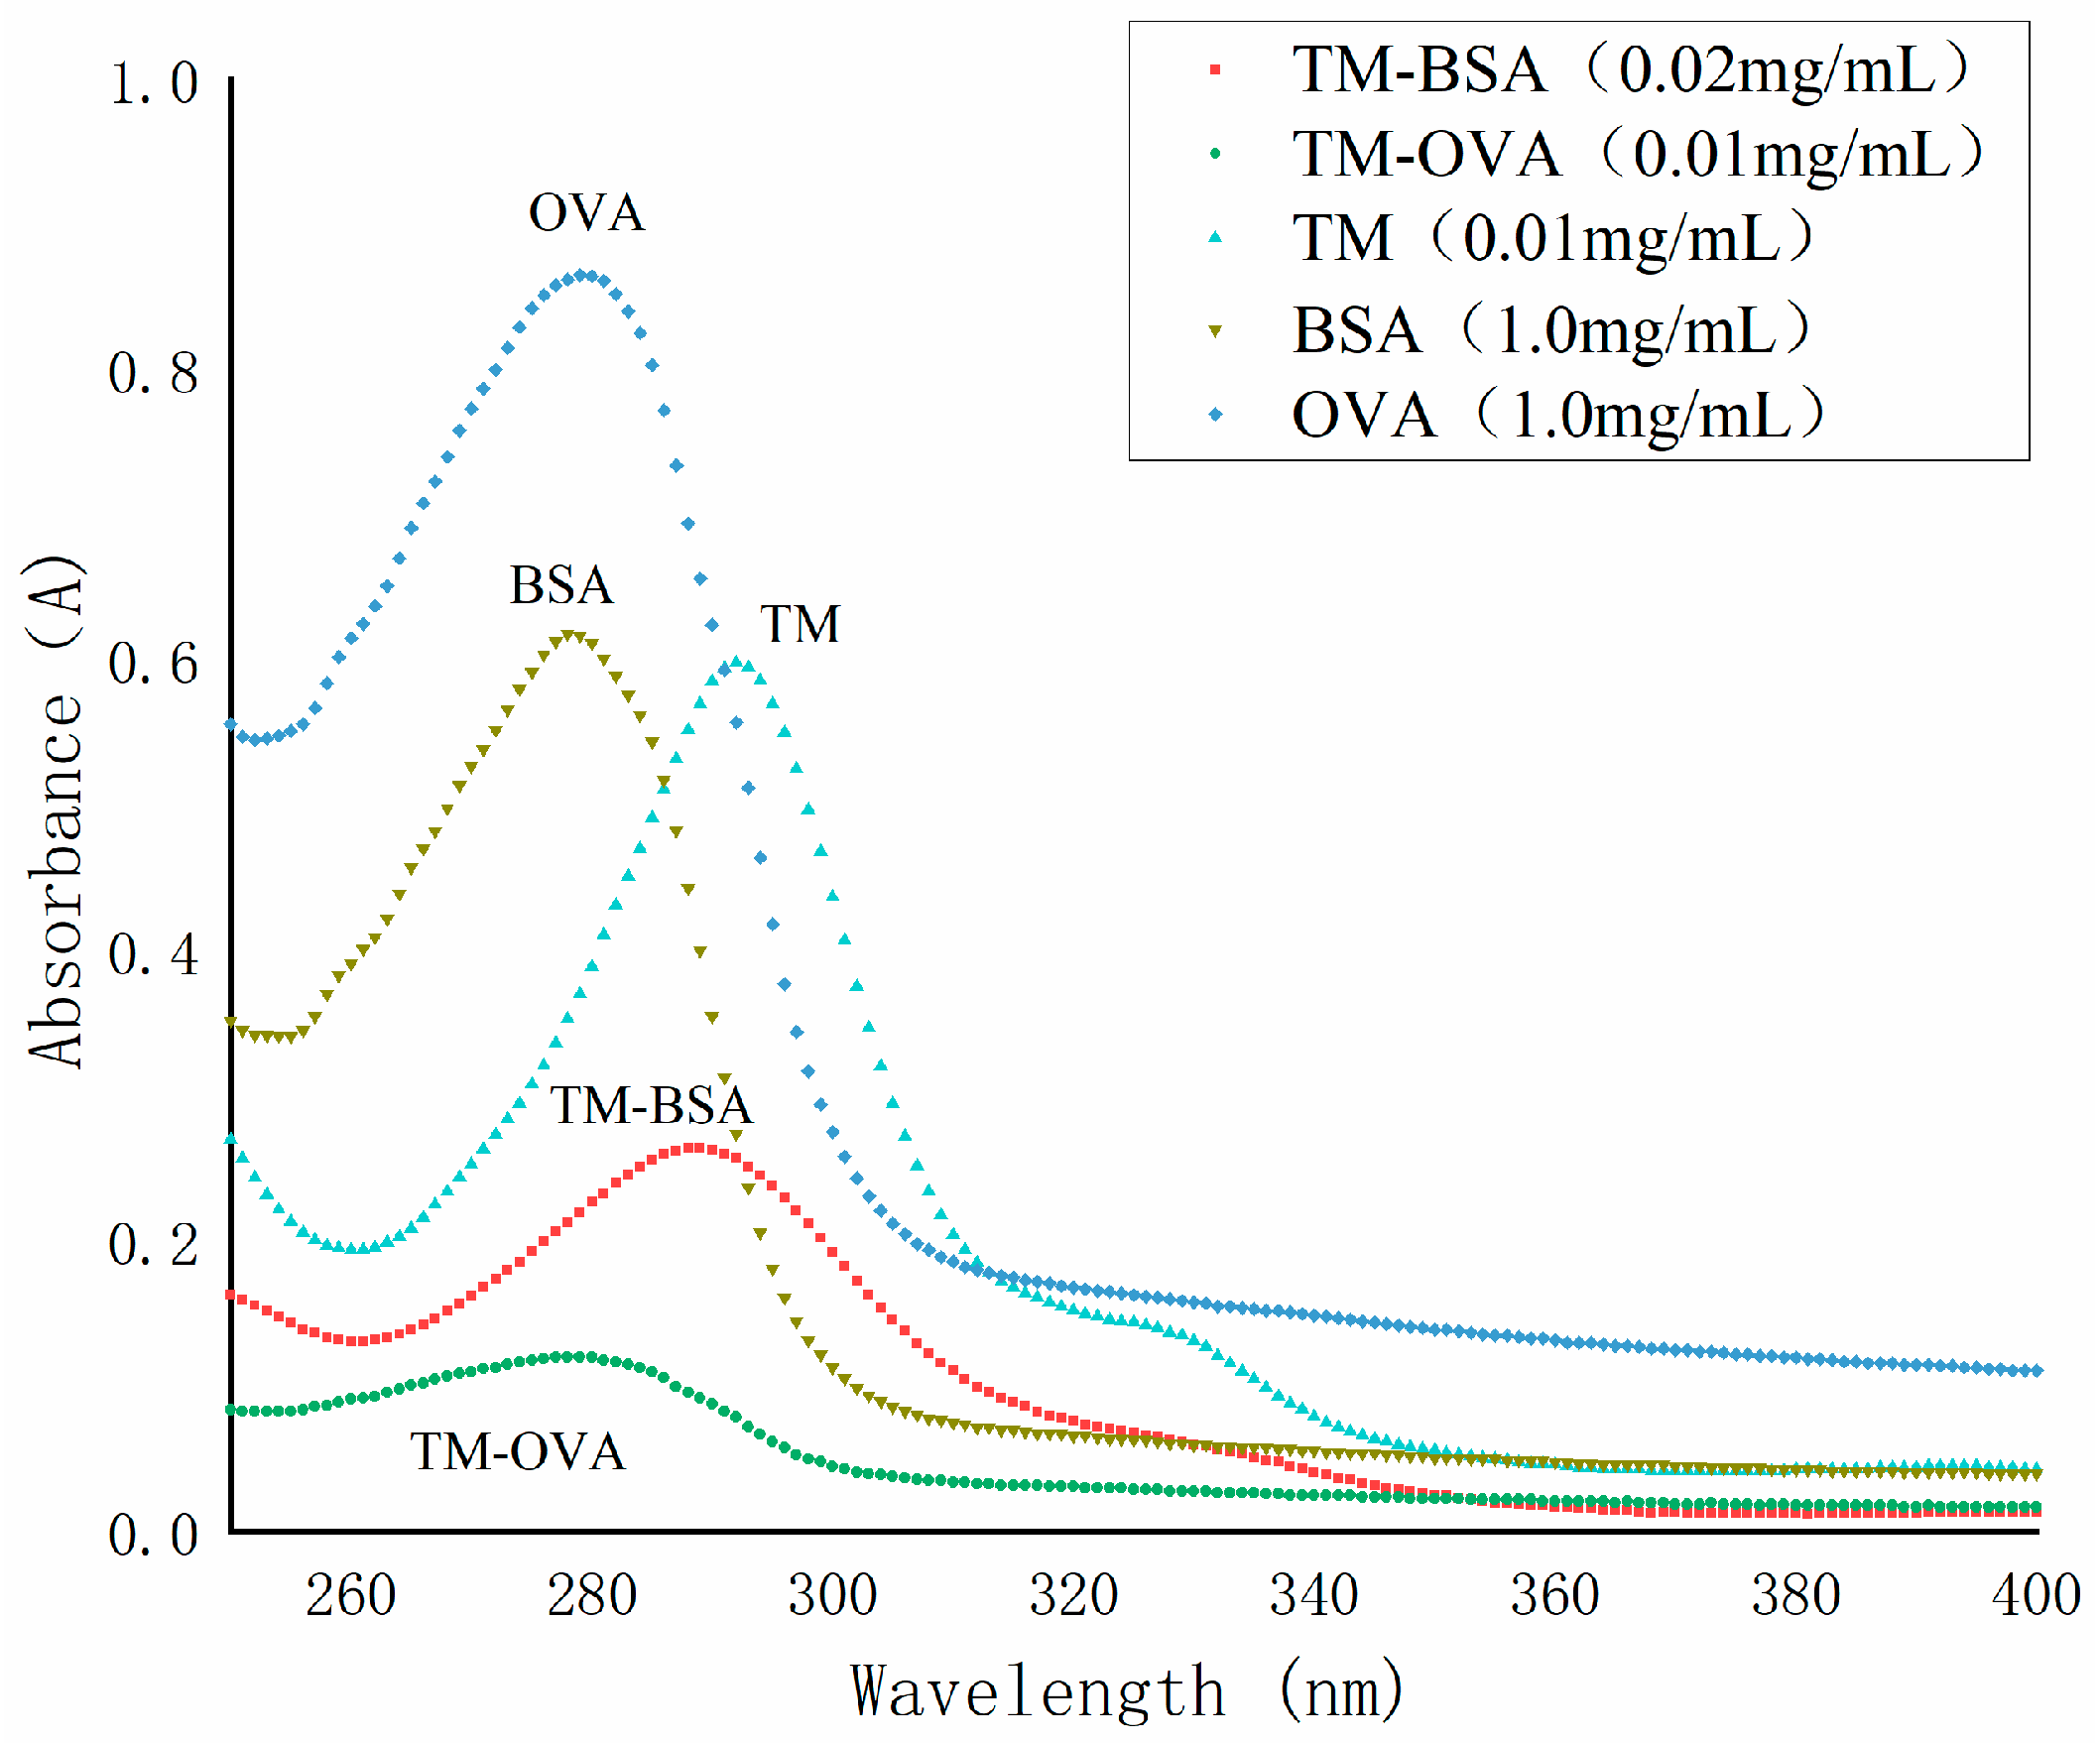
The TM, BAS, OVA, TM-BSA, and TM-OVA were diluted in PBS solution, respectively. The UV–Vis spectra among 250 nm and 400 nm were collected using a UV–Vis spectrophotometer (Shimadzu, kyoto, Japan). The success of coupling for each sample was identified by the change of the maximum absorption wavelength (λmax) of the sample.
2.3. Preparation of Polyclonal Antibody
Animal immunization was performed as follows. Each New Zealand white rabbit was subcutaneously and intramuscularly injected with 1 mL of emulsion containing a mixture of TM-BSA (500 μL, 2 mg/mL) and cFA (500 μL). After 14 days, the rabbits were injected with a solution of immunogen (1 mg) in normal saline (0.5 mL) and iFA (0.5 mL). The rabbits were injected four times in total every two weeks. From the third booster onward, the ear vein blood was sampled for each rabbit 7 days after each immunization. ELISA was utilized to ascertain serum titers, evaluating the quality of antisera in immunized rabbits. Seven days subsequent to the final booster, blood from each rabbit’s jugular vein was collected, with serum subsequently isolated via the caprylic acid/ammonium sulfate precipitation technique. The harvested antiserum underwent freeze-drying before being preserved at −20 °C.
2.4. Development of icELISA
The protocol of icELISA was carried out based on the reported study [32]. TM-OVA were coated in carbonate-buffered saline (CBS) (0.05 M, pH 9.6) in a 96-well microplate with 100 μL per well for 1 h at 37 °C. After washing three times with PBST (0.01 M PBS, pH = 7.4, containing 0.5% tween-20), the plates were blocked with 250 μL of 5% skim milk powder in PBS (0.01 M, pH = 7.4) overnight at 4 °C. Then, 50 μL of standard solution with various concentrations of the sample solutions were added. Then, 50 μL of antisera (1:16,000) was added to each well followed by incubation at 37 °C for 1 h. Subsequently, the plates were washed and 100 μL of HRP-conjugated goat anti-rabbit IgG (1:2000) was added at 37 °C for 1 h. After washing five times, 100 μL substrate solution of TMB was added. After 10 min, the reaction was finished by the addition of 2 M H2SO4 (50 μL per well) and the absorbance values were collected at 450 nm using a Thermo MK3 microplate reader.
Results were expressed as percentage inhibition = (1 − B/B0) × 100, with B representing absorbance in the competitor’s presence and B0 denoting absorbance in the absence of the competitor. Inhibition was graphically depicted against Log C in the form of competitive inhibition curves.
Cross-reactivity (CR) evaluation was conducted through IC50 value determination via icELISA. In a concise manner, CR testing employed azure A, azure B, azure C, malachite green, leucomalachite green, crystal violet, leucocrystal violet, and brilliant green. Standard solution concentrations for the tested compounds varied between 10 and 1000 μg L−1. CR value calculation was performed as follows:
CR = (IC50 of MB/IC50 of competitor) × 100%.
2.5. Theoretical Calculation
The density functional theory (DFT) calculated with the B3LYP function [33] and def2-svp basis set were performed to obtain the CM5 charges using Gaussian 09 (Gaussian, Inc., Wallingford, CT, USA). Multiwfn [34] was used for post-processing to obtain the molecular electrostatic potential (ESP). VMD was used to draw the electron distribution diagram, electrostatic potential diagram, and superimpose the molecule. All the density functional theory calculations were commissioned from the high-performance computing center, Nanjing University.
2.6. Sample Preparation
Stock solutions were prepared in methanol at 1 µg/mL for MB, azure A, azure B, and azure C. Further dilution was applied for recovery and calibration solutions. The blank samples were prepared using the muscle of grass carp obtained from a local supermarket in Shanghai (China). All blank samples were firstly screened with HPLC-MS/MS to ensure that they were free of the target compound of interest. The calibration curve was established using a standard solution of different concentrations prepared with PBS (0.02 M, pH 7.4) at 5 μg L−1,10 μg L−1, 25 μg L−1, 50 μg L−1, 100 μg L−1, and 200 μg L−1.
Briefly, a 5 g homogenized sample was weighed in a 50 mL centrifuge tube. Then, 10 mL of acetonitrile was added and subjected to ultrasound for 20 min. The mixtures were centrifuged at 4000 rpm for 5 min. The supernatant was mixed with 10 mL dichloromethane, vortexed for 3 min, and then the lower organic phase was collected and dried under nitrogen at 40 °C. The residues were redissolved in 1.0 mL of PBS, cleaned by 1.0 mL of n-hexane, and centrifuged (5000 rpm) for 5 min. Following this, a 50 μL aliquot was prepared for icELISA.
2.7. Assay Validation
The limit of detection (LOD), limit of quantification (LOQ), linearity, precision, and accuracy of this method were evaluated using optimized parameters. The LOD and LOQ were ascertained according to a previous report [31]. Linearity was verified through the coefficient of determination (R2) and regression fitting, evaluated using a linear regression model for the calibration curve. Recovery and accuracy were examined by comparing the measured concentrations from processed samples with different spiking levels (10, 20, and 30 μg/kg). Intra- and inter-assay precision were assessed using the relative standard deviation (RSD) of the measured positive samples. The RSD was calculated for all determinations in a spiking experiment with three replicates.
3. Results and Discussion
3.1. Synthesis of TM-BSA and TM-OVA
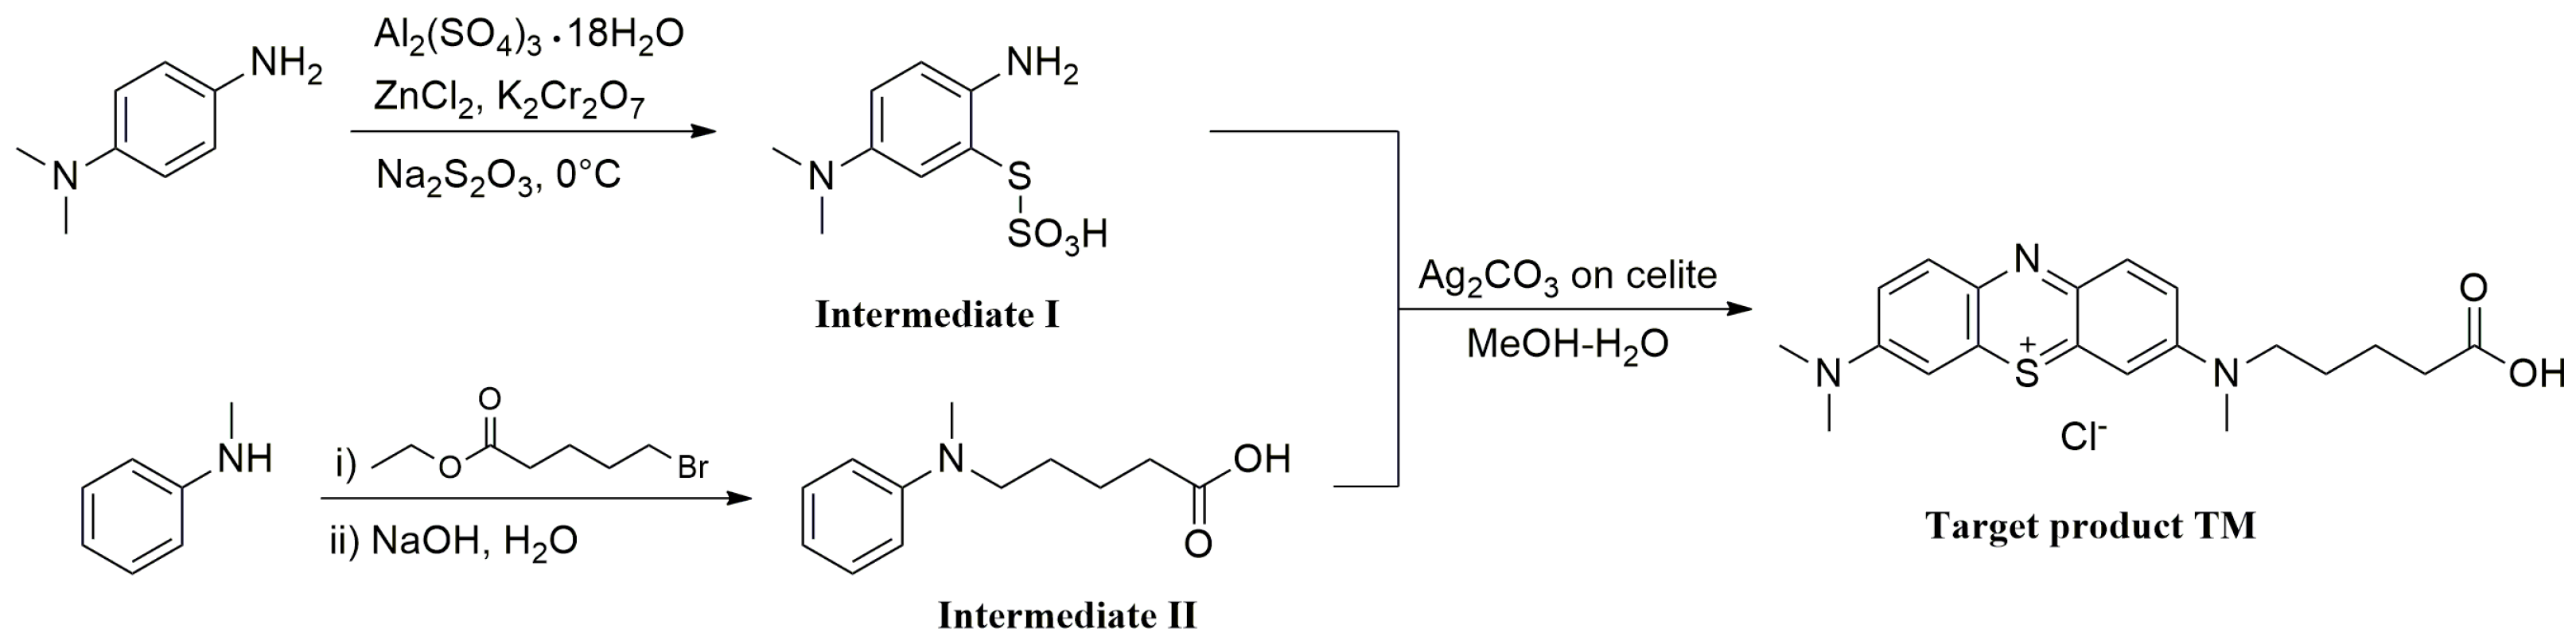
The hapten TM was synthesized by the substitution of S-(2-amino-5-(dimethylamino)phenyl) O-hydrogen sulfothioate (Intermediate I, Figure S1) with 5-(methyl(phenyl)amino) pentanoic acid (Intermediate II, Figure S2) in a methanol–water system and purified via flash chromatography (Figure 2). The structures were confirmed by 1H NMR and MS spectra. In the 1H NMR spectra (Figure 3), a triplet appearing at 2.41 ppm was attributed to CH2 near N-CH3 due to the deshielding effect of the N and phenothiazine ring. The CH3 of the N-CH3 side chain appeared as a singlet at 3.72 ppm. All the aromatic protons resonated in the range of 7.81–7.24 ppm. Due to the proton exchange in the carboxyl group, it is hard to find the COOH signal. The [M + H]+ peak for TM appeared at m/z 370.53, which is in good agreement with the calculated value (370.16).
Generally, a long arm comprising 3–5 carbon units attached to the side chain in hapten was deemed to expose more antigenic determinants, which could enhance the sensitivity of the antibody. Thus, TM was developed by a 5-carbon long arm introduced to the hapten on the basis of the core geometric structure of the phenothiazine in order to achieve high sensitivity.
The conjugating of TM with BSA or OVA was carried out using DCC condensation (Figure 4). As shown in Figure 5, the maximum absorption wavelengths (λmax) of TM, BSA, OVA, TM-BSA, and TM-OVA were 292 nm, 278 nm, 279 nm, 288 nm, and 287 nm, respectively. The λmax of the conjugates (TM-BSA and TM-OVA) deviated from protein (BSA and OVA) and TM, which indicated the coupling reaction was successful.
3.2. Theoretical Calculation
To further evaluate the electronic character of TM, DFT calculations were performed using the Gaussian 09 program package. MB and TM were aligned according to their lowest conformations, with MB serving as the reference molecule. Figure S3 shows a perfect overlap between the hapten TM and the target MB, indicating that adding spacer arms at MB’s N16 position (insert section of Figure S4) barely affects MB’s conformational integrity. Furthermore, incorporating long-chain substituents resulted in negligible changes to the atomic charges within the MB component, with a discrepancy between MB and TM of less than 0.1 a.u. (Figure 6a). Moreover, the distribution of atomic charges at positions N1 and N16 showed distinct variations, influenced by the long-chain substituents attached at these positions. Therefore, hapten TM is very close to MB in geometric structure, electrostatic potential, and atomic charges. This indicates that the designed TM in this study fits well with the electronic features and geometric structure of MB and has great potential for preparing antibodies for MB (Figure 6b).
3.3. Antiserum Characterization and Optimization of icELISA
The antibody titer is an important parameter reflecting the quality of antibodies [35]. From the third immunization, the serum titers were determined by ELISA. The antibody titers increased with the number of immunizations. At the last immunization, the serum titers of rabbits were 32,000 and 64,000, respectively. The higher titer rabbit was selected to produce antibodies for follow-up experiments.
In order to improve the icELISA performance, some parameters were optimized. These factors included the coating antigen and antibody concentration and the blocking buffer [31]. The antigen–antibody binding reaction should follow a certain dose-to-antibody ratio. Optimizing the concentration of antigen and antibody can avoid the waste of antigens and antibodies and improve the sensitivity of the method. The concentration of antigen and antibody is optimized by checkerboard method, and the corresponding OD value closest to 1.0 is selected as the best concentration of antigen and antibody. Accordingly, the dilution of the coating antigen and the antibody were optimized using a checkerboard procedure. The dilution of the coating antigen and antibody ranged from 1:1000 to 1:128,000 and 1:1000 to 1:32,000. An optimal combination for the coating antigen and the antibody were 1:16,000 and 1:16,000, producing an absorbance around 1.0 in the absence of analytes.
In the ELISA analysis system, it is necessary to optimize the blocking buffer to overcome the false positives caused by a high background signal. Therefore, four different blocking buffers, BSA, OVA, gelatin, and skim milk powder were prepared for their blocking capacity. The effect of the blocking buffers was determined by measuring the OD max and the P/N values. As a result, 5% skim milk powder showed a better blocking capacity because of the higher P/N values (14.8) than that of 1% BSA (9.3) or 1% OVA (9.3) or 1% gelatin (11.7). Thus, 5% skim milk powder was chosen as the blocking buffer in this study.
3.4. Validation
Under optimum conditions, the sensitivity and stability of the developed icELISA was determined by conducting competitive assays for the MB. A series of MB standard solutions (5 μg L−1,10 μg L−1, 25 μg L−1, 50 μg L−1, 100 μg L−1 and 200 μg L−1) was used to construct standard curves. The linear equation was y = 0.4286x − 0.1933 (R2 = 0.985, Figure 7), indicating a good linearity for the determination of MB.
The IC50 and IC15, calculated as the concentration that gave 50% and 15% inhibition of the maximal signal, are the key parameters for evaluating the sensitivity of ELISA. As a result, an IC50 and an IC15 of 41.5 μg L−1 and 6.3 μg L−1 were achieved, respectively. The quantitation limit (LOQ) was determined by adding ten times the standard deviation of 20 blank samples to their mean, resulting in 6.0 µg/kg. The detection limit (LOD) was similarly calculated, adding three times the standard deviation of the blank samples to the mean blank value, yielding an LOD of 4.8 µg/kg. Both LOD and LOQ were rigorously validated, underscoring the high sensitivity of our icELISA method. Compared to the reported method [12], the novel icELISA method presents high sensitivity, more simplicity, low cost-effectiveness, and a potential for high-throughput screening for the determination of MB. Therefore, the developed icELISA in our study offers a competitive alternative to the HPLC-MS/MS approaches.
The cross-reactivity of the icELISA was evaluated using azure A, azure B, azure C, malachite green, leuco malachite green, bright green, leuco bright green, crystal violet, and leuco crystal violet. The compounds information and cross-reactivity values are presented in Table 1. As a result, azure A, azure B, and azure C showed higher cross-reaction values at 78.2%, 83.5%, and 88.9%, respectively. However, these three compounds showed a low cross-reaction with other dye compounds which are generally detected in aquatic products. These results suggested that the polyclonal antibody could be used to detect MB and its metabolites (azure A, azure B, azure C).
The accuracy and precision of the icELISA for MB were evaluated using a blank sample spiked with a standard solution of MB. Blank samples were spiked with MB at three concentrations (10 μg/kg, 20 μg/kg, and 30 μg/kg). The accuracy was reflected by recovery. Recoveries were calculated as the found content of blank samples after spiking with a specific concentration of MB. Precision (repeatability) was expressed as the RSD of the measured concentrations after analysis. Results for recoveries, intra-assay and inter-assay precision are presented as averages across three concentrations (n = 6, m = 3). The average recovery of MB in the samples ranged from 82.3% to 84.3%. The intra-assay reproducibility and inter-assay precision in ELISA varied between 2.3% and 6.0% (Table 2). The values of repeatability and reproducibility are within the limits of the acceptance criteria recommended by the AOAC. These results demonstrated that the developed icELISA had acceptable sensitivity, accuracy, and precision for determination of MB in aquatic products.
4. Conclusions
In summary, this paper presents a developed method for the sensitive and rapid determination of MB in aquatic products using icELISA. Initially, a new hapten TM was designed based on molecular simulation. Subsequently, TM was synthesized and further prepared by conjugating with carrier proteins BSA and OVA through carbodiimide methods. After that, polyclonal antibodies were achieved by immunizing New Zealand white rabbits with TM-BSA. Under the optimized icELISA conditions, the results revealed that the antibodies could recognize both MB and its metabolites, indicating that the new hapten could induce the strongest immune response. Therefore, a sensitive icELISA assay was developed with a LOD measured at 4.8 µg/kg, based on the specific polyclonal antibodies. Under optimized conditions, the IC50 value and the IC15 of the assay were 41.5 μg L−1 and 6.3 μg L−1, respectively, indicating the high sensitivity of the developed method. Our method was validated with satisfactory recoveries ranging from 82.3% to 84.3% and a standard deviation of less than 6% in aquatic products. Therefore, it is demonstrated to be time-efficient and easy to operate, providing a practical, accurate, and precise way to determine MB.
Supplementary Materials
The following supporting information can be downloaded at https://www.mdpi.com/article/10.3390/chemosensors12040052/s1, Figure S1: The MS spectrogram for Intermediate I; Figure S2: The MS spectrogram for Intermediate II; Figure S3: The alignment of the lowest energy conformations of MB and TM; Figure S4: Calculated partial atomic charges of common structure atoms of MB and TM.
Author Contributions
Conceptualization, X.H. and G.Y.; methodology, X.H.; software, Y.T.; validation, X.H., G.Y. and Y.T.; formal analysis, Y.T.; investigation, X.H.; resources, L.W.; data curation, Y.T.; writing—original draft preparation, X.H.; writing—review and editing, G.Y.; visualization, G.Y.; supervision, L.W.; project administration, L.W.; funding acquisition, L.W. All authors have read and agreed to the published version of the manuscript.
Funding
This study was supported by the Project of Special Research Fund for the National Non-Profit Institutes (2015M05) and the Project of Shanghai Science and Technology Commission (19DZ1204504).
Institutional Review Board Statement
The animal study protocol was approved by the Ethics Committee of East China Sea Fisheries Research Institute, Chinese Academy of Fishery Sciences (ECSF-JC-2023-012, 8 April 2023).
Informed Consent Statement
Not applicable.
Data Availability Statement
The data presented in this study are available on request from the corresponding author.
Conflicts of Interest
The authors declare no conflicts of interest.
Ethical Statements
This study was conducted in accordance with the Declaration of Helsinki, and the protocol was approved by the Ethics Committee of ECSF-JG-2023-012.
References
- En-Naji, S.; Ghazi, S.; Mabroum, H.; Mabroum, S.; Khatib, K.; Taha, Y.; Taha, T.; Lodeiro, I.G.; Hakkou, R. Design of Acid-Geopolymers Based on Clays by-Products for Methylene Blue Removal from Wastewater. Appl. Clay Sci. 2023, 245, 107126. [Google Scholar] [CrossRef]
- Oladoye, P.O.; Ajiboye, T.O.; Omotola, E.O.; Oyewola, O.J. Methylene Blue Dye: Toxicity and Potential Elimination Technology from Wastewater. Results Eng. 2022, 16, 100678. [Google Scholar] [CrossRef]
- Atamna, H.; Krugliak, M.; Shalmiev, G.; Deharo, E.; Pescarmona, G.; Ginsburg, H. Mode of Antimalarial Effect of Methylene Blue some of its Analogues on Plasmodium falciparum in Culture their Inhibition of, P. vinckei petteri and P. yoelii nigeriensis in Vivo. Biochem. Pharmacol. 1996, 51, 693–700. [Google Scholar] [CrossRef] [PubMed]
- van Bebber, F.; Paquet, D.; Hruscha, A.; Schmid, B.; Haass, C. Methylene Blue Fails to Inhibit Tau and Polyglutamine Protein Dependent Toxicity in Zebrafish. Neurobiol. Dis. 2010, 39, 265–271. [Google Scholar] [CrossRef] [PubMed]
- Oz, M.; Lorke, D.E.; Petroianu, G.A. Methylene Blue and Alzheimer’s Disease. Biochem. Pharmacol. 2009, 78, 927–932. [Google Scholar] [CrossRef] [PubMed]
- Oz, M.; Lorke, D.E.; Hasan, M.; Petroianu, G.A. Cellular and Molecular Actions of Methyleneblue in the Nervous System. Med. Res. Rev. 2010, 1, 93–117. [Google Scholar]
- Wang, Y.; Huang, X.; Lv, X.; Sun, J.; Zheng, R.; Hu, K. The Metabolism of Methylene Blue and its Derivatives in Japanese Eel (Anguilla japonica). J. Ocean Univ. China 2020, 19, 653–658. [Google Scholar] [CrossRef]
- Sharma, P.; Olufemi, A.F.; Qanungo, K. Development of Green Geo-Adsorbent Pellets from Low Fire Clay for Possible Use in Methylene Blue Removal in Aquaculture. Mater. Today Proc. 2022, 49, 1556–1565. [Google Scholar] [CrossRef]
- Lv, X.M.; Yang, X.L.; Xie, X.Y.; Yang, Z.Y.; Hu, K.; Wu, Y.J.; Jiang, Y.Y.; Liu, T.F.; Fang, W.H.; Huang, X.Y. Comparative Transcriptome Analysis of Anguilla japonica Livers Following Exposure to Methylene Blue. Aquacluture Res. 2018, 49, 1232–1241. [Google Scholar] [CrossRef]
- Mitrowska, K.; Kijewska, L.; Giannetti, L.; Neri, B. A Simple and Sensitive Method for the Determination of Methylene Blue and its Analogues in Fish Muscle Using Uplc-Ms/Ms. Food Addit. Contam. Part A Chem. Anal. Control Expo. Risk Assess. 2023, 40, 641–654. [Google Scholar] [CrossRef]
- Cheng, J.; Zhan, C.; Wu, J.; Cui, Z.; Si, J.; Wang, Q.; Peng, X.; Turng, L.S. Highly Efficient Removal of Methylene Blue Dye from an Aqueous Solution Using Cellulose Acetate Nanofibrous Membranes Modified by Polydopamine. ACS Omega 2020, 5, 5389–5400. [Google Scholar] [CrossRef] [PubMed]
- Zhang, X.; Hui, Y.; Fang, C.; Wang, Y.; Han, F.; Lou, X.; Fodjo, E.K.; Cai, Y.; Kong, C. Determination of Methylene Blue and its Metabolite Residues in Aquatic Products by High-Performance Liquid Chromatography–Tandem Mass Spectrometry. Molecules 2021, 26, 4975. [Google Scholar] [CrossRef] [PubMed]
- Akazawa, M.; Wu, Y.; Liu, W. Allergy-Like Reactions to Methylene Blue Following Laparoscopic Chromopertubation: A Systematic Review of the Literature. Eur. J. Obstet. Gynecol. Reprod. Biol. 2019, 238, 58–62. [Google Scholar] [CrossRef] [PubMed]
- U.S. Food and Drug Administration. FDA Drug Safety Communication: Serious CNS Reactions Possible When Methylene Blue is Given to Patients Taking Certain Psychiatric Medications. [1/22]. Available online: https://www.fda.gov/drugs/drug-safety-and-availability/fda-drug-safety-communication-serious-cns-reactions-possible-when-methylene-blue-given-patients (accessed on 14 December 2017).
- National Toxicology Program. Toxicology and Carcinogenesis Studies of Methylene Blue Trihydrate (Cas No. 7220-79-3) in F344/N Rats and B6C3F1 Mice (Gavage Studies). Natl. Toxicol. Program Tech. Rep. Ser. 2008, 540, 1–224. [Google Scholar]
- Xu, J.; Dai, L.; Wu, B.; Ding, T.; Zhu, J.J.; Lin, H.; Chen, H.L.; Shen, C.Y.; Jiang, Y. Determination of Methylene Blue Residues in Aquatic Products by Liquid Chromatography-Tandem Mass Spectrometry. J. Sep. Sci. 2009, 32, 4193–4199. [Google Scholar] [CrossRef] [PubMed]
- Razmara, R.S.; Daneshfar, A.; Sahrai, R. Determination of Methylene Blue and Sunset Yellow in Wastewater and Food Samples Using Salting-Out Assisted Liquid–Liquid Extraction. J. Ind. Eng. Chem. 2011, 17, 533–536. [Google Scholar] [CrossRef]
- Ahmadi, R.; Kazemi, G.; Ramezani, A.M.; Safavi, A. Shaker-Assisted Liquid-Liquid Microextraction of Methylene Blue Using Deep Eutectic Solvent Followed by Back-Extraction and Spectrophotometric Determination. Microchem. J. 2019, 145, 501–507. [Google Scholar] [CrossRef]
- Kasuga, Y.; Hishida, M.; Tanahashi, N. Simultaneous Determination of Malachite Green and Methylene Blue in Cultured Fishes by High Performance Liquid Chromatography. Food Hyg. Saf. Sci. (Shokuhin Eiseigaku Zasshi) 1991, 32, 137–141. [Google Scholar] [CrossRef]
- Kim, S.; Ha, D.; Koo, T. Simultaneous Quantification of Methylene Blue and its Major Metabolite, Azure B, in Plasma by LC-MS/MS and its Application for a Pharmacokinetic Study. Biomed. Chromatogr. 2014, 28, 518–524. [Google Scholar] [CrossRef]
- Khan, M.R.; Khan, M.A.; Alothman, Z.A.; Alsohaimi, I.H.; Naushada, M.; Al-Shaalanb, N.H. Quantitative Determination of Methylene Blue in Environmental Samples by Solid-Phase Extraction and Ultra-Performance Liquid Chromatography-Tandem Mass Spectrometry: A Green Approach. RSC Adv. 2014, 4, 34037–34044. [Google Scholar] [CrossRef]
- Amelin, V.G.; Korotkov, A.I.; Andoralov, A.M. Simultaneous Determination of Dyes of Different Classes in Aquaculture Products and Spices Using HPLC–High-Resolution Quadrupole Time-of-Flight Mass Spectrometry. J. Anal. Chem. 2017, 72, 183–190. [Google Scholar] [CrossRef]
- Xu, T.; Wang, X.; Huang, Y.; Lai, K.; Fan, Y. Rapid Detection of Trace Methylene Blue and Malachite Green in Four Fish Tissues by Ultra-Sensitive Surface-Enhanced Raman Spectroscopy Coated with Gold Nanorods. Food Control 2019, 106, 106720. [Google Scholar] [CrossRef]
- Yang, G.; Zhang, J.; Gu, L.; Tang, Y.; Zhang, X.; Huang, X.; Shen, X.; Zhai, W.; Fodjo, E.K.; Kong, C. Ratiometric Fluorescence Immunoassay Based on Carbon Quantum Dots for Sensitive Detection of Malachite Green in Fish. Biosensors 2023, 13, 38. [Google Scholar] [CrossRef] [PubMed]
- Wu, L.; Li, G.; Xu, X.; Zhu, L.; Huang, R.; Chen, X. Application of Nano-Elisa in Food Analysis: Recent Advances and Challenges. Trac Trends Anal. Chem. 2019, 113, 140–156. [Google Scholar] [CrossRef]
- Jin, Y.; Jin, Z.; Sun, D.; Peng, Y.; Zhao, Q.; He, Y.; Li, J.; Zhang, Y.; Cui, Y. Preparation of Spirodiclofen Monoclonal Antibody and Establishment of Indirect Competitive Enzyme-Linked Immunosorbent Assay. Food Chem. 2023, 417, 135936. [Google Scholar] [CrossRef] [PubMed]
- Zhang, B.; Lang, Y.; Guo, B.; Cao, Z.; Cheng, J.; Cai, D.; Shentu, X.; Yu, X. Indirect Competitive Enzyme-Linked Immunosorbent Assay Based on Broad-Spectrum Antibody for Simultaneous Determination of Thirteen Fluoroquinolone Antibiotics in Rana catesbeianus. Foods 2023, 12, 2530. [Google Scholar] [CrossRef] [PubMed]
- Parra, J.; Esteve-Turrillas, F.A.; Abad-Somovilla, A.; Agulló, C.; Mercader, J.V.; Abad-Fuentes, A. Exploring Alternative Hapten Tethering Sites for High-Affinity Anti-Picoxystrobin Antibody Generation. Anal. Biochem. 2011, 416, 82–91. [Google Scholar] [CrossRef]
- Bai, Y.; Liu, R.; Dou, L.; Wu, W.; Yu, W.; Wen, K.; Yu, X.; Shen, J.; Wang, Z. The Influence of Hapten Spacer Arm Length On Antibody Response and Immunoassay Development. Anal. Chim. Acta 2023, 1239, 340699. [Google Scholar] [CrossRef]
- Zhang, X.; Bai, Y.; Tang, Q.; Liu, M.; Nan, L.; Wen, K.; Yu, X.; Yu, W.; Shen, J.; Wang, Z. Development of Epitopephore-Based Rational Hapten Design Strategy: A Combination of Theoretical Evidence and Experimental Validation. J. Hazard. Mater. 2023, 445, 130615. [Google Scholar] [CrossRef]
- Yang, G.; Zhuang, H.; Chen, H.; Ping, X. An Indirect Competitive Enzyme-Linked Immunosorbent Assay for the Determination of 3,4-Dichlorobiphenyl in Sediment Using a Specific Polyclonal Antibody. Anal. Methods 2014, 6, 893–899. [Google Scholar] [CrossRef]
- Li, H.; Ma, S.; Zhang, X.; Li, C.; Dong, B.; Mujtaba, M.G.; Wei, Y.; Liang, X.; Yu, X.; Wen, K.; et al. Generic Hapten Synthesis, Broad-Specificity Monoclonal Antibodies Preparation, and Ultrasensitive Elisa for Five Antibacterial Synergists in Chicken and Milk. J. Agric. Food Chem. 2018, 66, 11170–11179. [Google Scholar] [CrossRef] [PubMed]
- Becke, A.D. Density-Functional Thermochemistry. III. The Role of Exact Exchange. J. Chem. Phys. 1993, 98, 5648–5652. [Google Scholar] [CrossRef]
- Lu, T.; Chen, F. Multiwfn: A Multifunctional Wavefunction Analyzer. J. Comput. Chem. 2012, 33, 580–592. [Google Scholar] [CrossRef] [PubMed]
- Peng, D.; Wei, W.; Pan, Y.; Wang, Y.; Chen, D.; Liu, Z.; Wang, X.; Dai, M.; Yuan, Z. Preparation of a Monoclonal Antibody Against Amantadine and Rimantadine and Development of an Indirect Competitive Enzyme-Linked Immunosorbent Assay for Detecting the Same in Chicken Muscle and Liver. J. Pharm. Biomed. Anal. 2017, 133, 56–63. [Google Scholar] [CrossRef] [PubMed]
Figure 1.
The structure of methylene blue.

Figure 2.
Synthesis route of hapten TM.

Figure 3.
The 1H NMR spectra of TM.

Figure 4.
The conjugates of TM-BSA.

Figure 5.
The UV spectra of TM, BSA, OVA, TM-BSA, and TM-OVA.

Figure 6.
The charge distribution (a) and ESP (b) of MB and hapten TM.

Figure 7.
The standard icELISA inhibition curve of MB (n = 3).


Table 1.
Cross-reactivity of the antibody against MB and other dye compounds.
| Compound | Structure | IC50 (μg L−1) | Cross Reaction (%) |
|---|---|---|---|
| Methylene Blue |  | 41.5 | - |
| Azure A |  | 53.1 | 78.2 |
| Azure B |  | 49.7 | 83.5 |
| Azure C |  | 46.7 | 88.9 |
| Malachite Green |  | >1000 | <0.3 |
| Leuco Malachite Green |  | >1000 | <0.3 |
| Bright green |  | >1000 | <0.3 |
| Leuco Bright Green |  | >1000 | <0.3 |
| Crystal Violet |  | >1000 | <0.3 |
| Leuco Crystal violet |  | >1000 | <0.3 |
Table 2.
Recovery and precision of MB detected by icELISA.
| Spiked Concentration (μg/kg) | Average Recovery (%) | Intra-RSD (%) | Inter-RSD (%) |
|---|---|---|---|
| 10 | 82.3 | 5.5 | 2.3 |
| 20 | 84.3 | 4.2 | 5.6 |
| 30 | 83.7 | 6.0 | 3.2 |
Disclaimer/Publisher’s Note: The statements, opinions and data contained in all publications are solely those of the individual author(s) and contributor(s) and not of MDPI and/or the editor(s). MDPI and/or the editor(s) disclaim responsibility for any injury to people or property resulting from any ideas, methods, instructions or products referred to in the content. |
© 2024 by the authors. Licensee MDPI, Basel, Switzerland. This article is an open access article distributed under the terms and conditions of the Creative Commons Attribution (CC BY) license (https://creativecommons.org/licenses/by/4.0/).
Share and Cite
MDPI and ACS Style
Huang, X.; Yang, G.; Tang, Y.; Wang, L. An Enzyme Immunoassay Developed for the Determination of Methylene Blue in Aquatic Products Based on a Novel Hapten. Chemosensors 2024, 12, 52. https://doi.org/10.3390/chemosensors12040052
AMA Style
Huang X, Yang G, Tang Y, Wang L. An Enzyme Immunoassay Developed for the Determination of Methylene Blue in Aquatic Products Based on a Novel Hapten. Chemosensors. 2024; 12(4):52. https://doi.org/10.3390/chemosensors12040052
Chicago/Turabian StyleHuang, Xuanyun, Guangxin Yang, Yunyu Tang, and Liqing Wang. 2024. "An Enzyme Immunoassay Developed for the Determination of Methylene Blue in Aquatic Products Based on a Novel Hapten" Chemosensors 12, no. 4: 52. https://doi.org/10.3390/chemosensors12040052
Note that from the first issue of 2016, this journal uses article numbers instead of page numbers. See further details here.