
Electrochemical Sensor for the Evaluation of Doxorubicin from Novel Pharmaceutical Formulations and Serum
 , , , , and
Abstract
:
1. Introduction
2. Materials and Methods
2.1. Materials
2.1.1. Chemicals and Reagents
2.1.2. Instruments
2.2. Methods
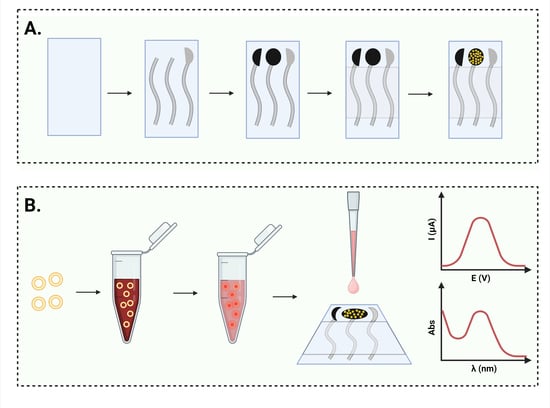
2.2.1. Electrochemical Cell Printing
2.2.2. Gold Nanoparticle Deposition
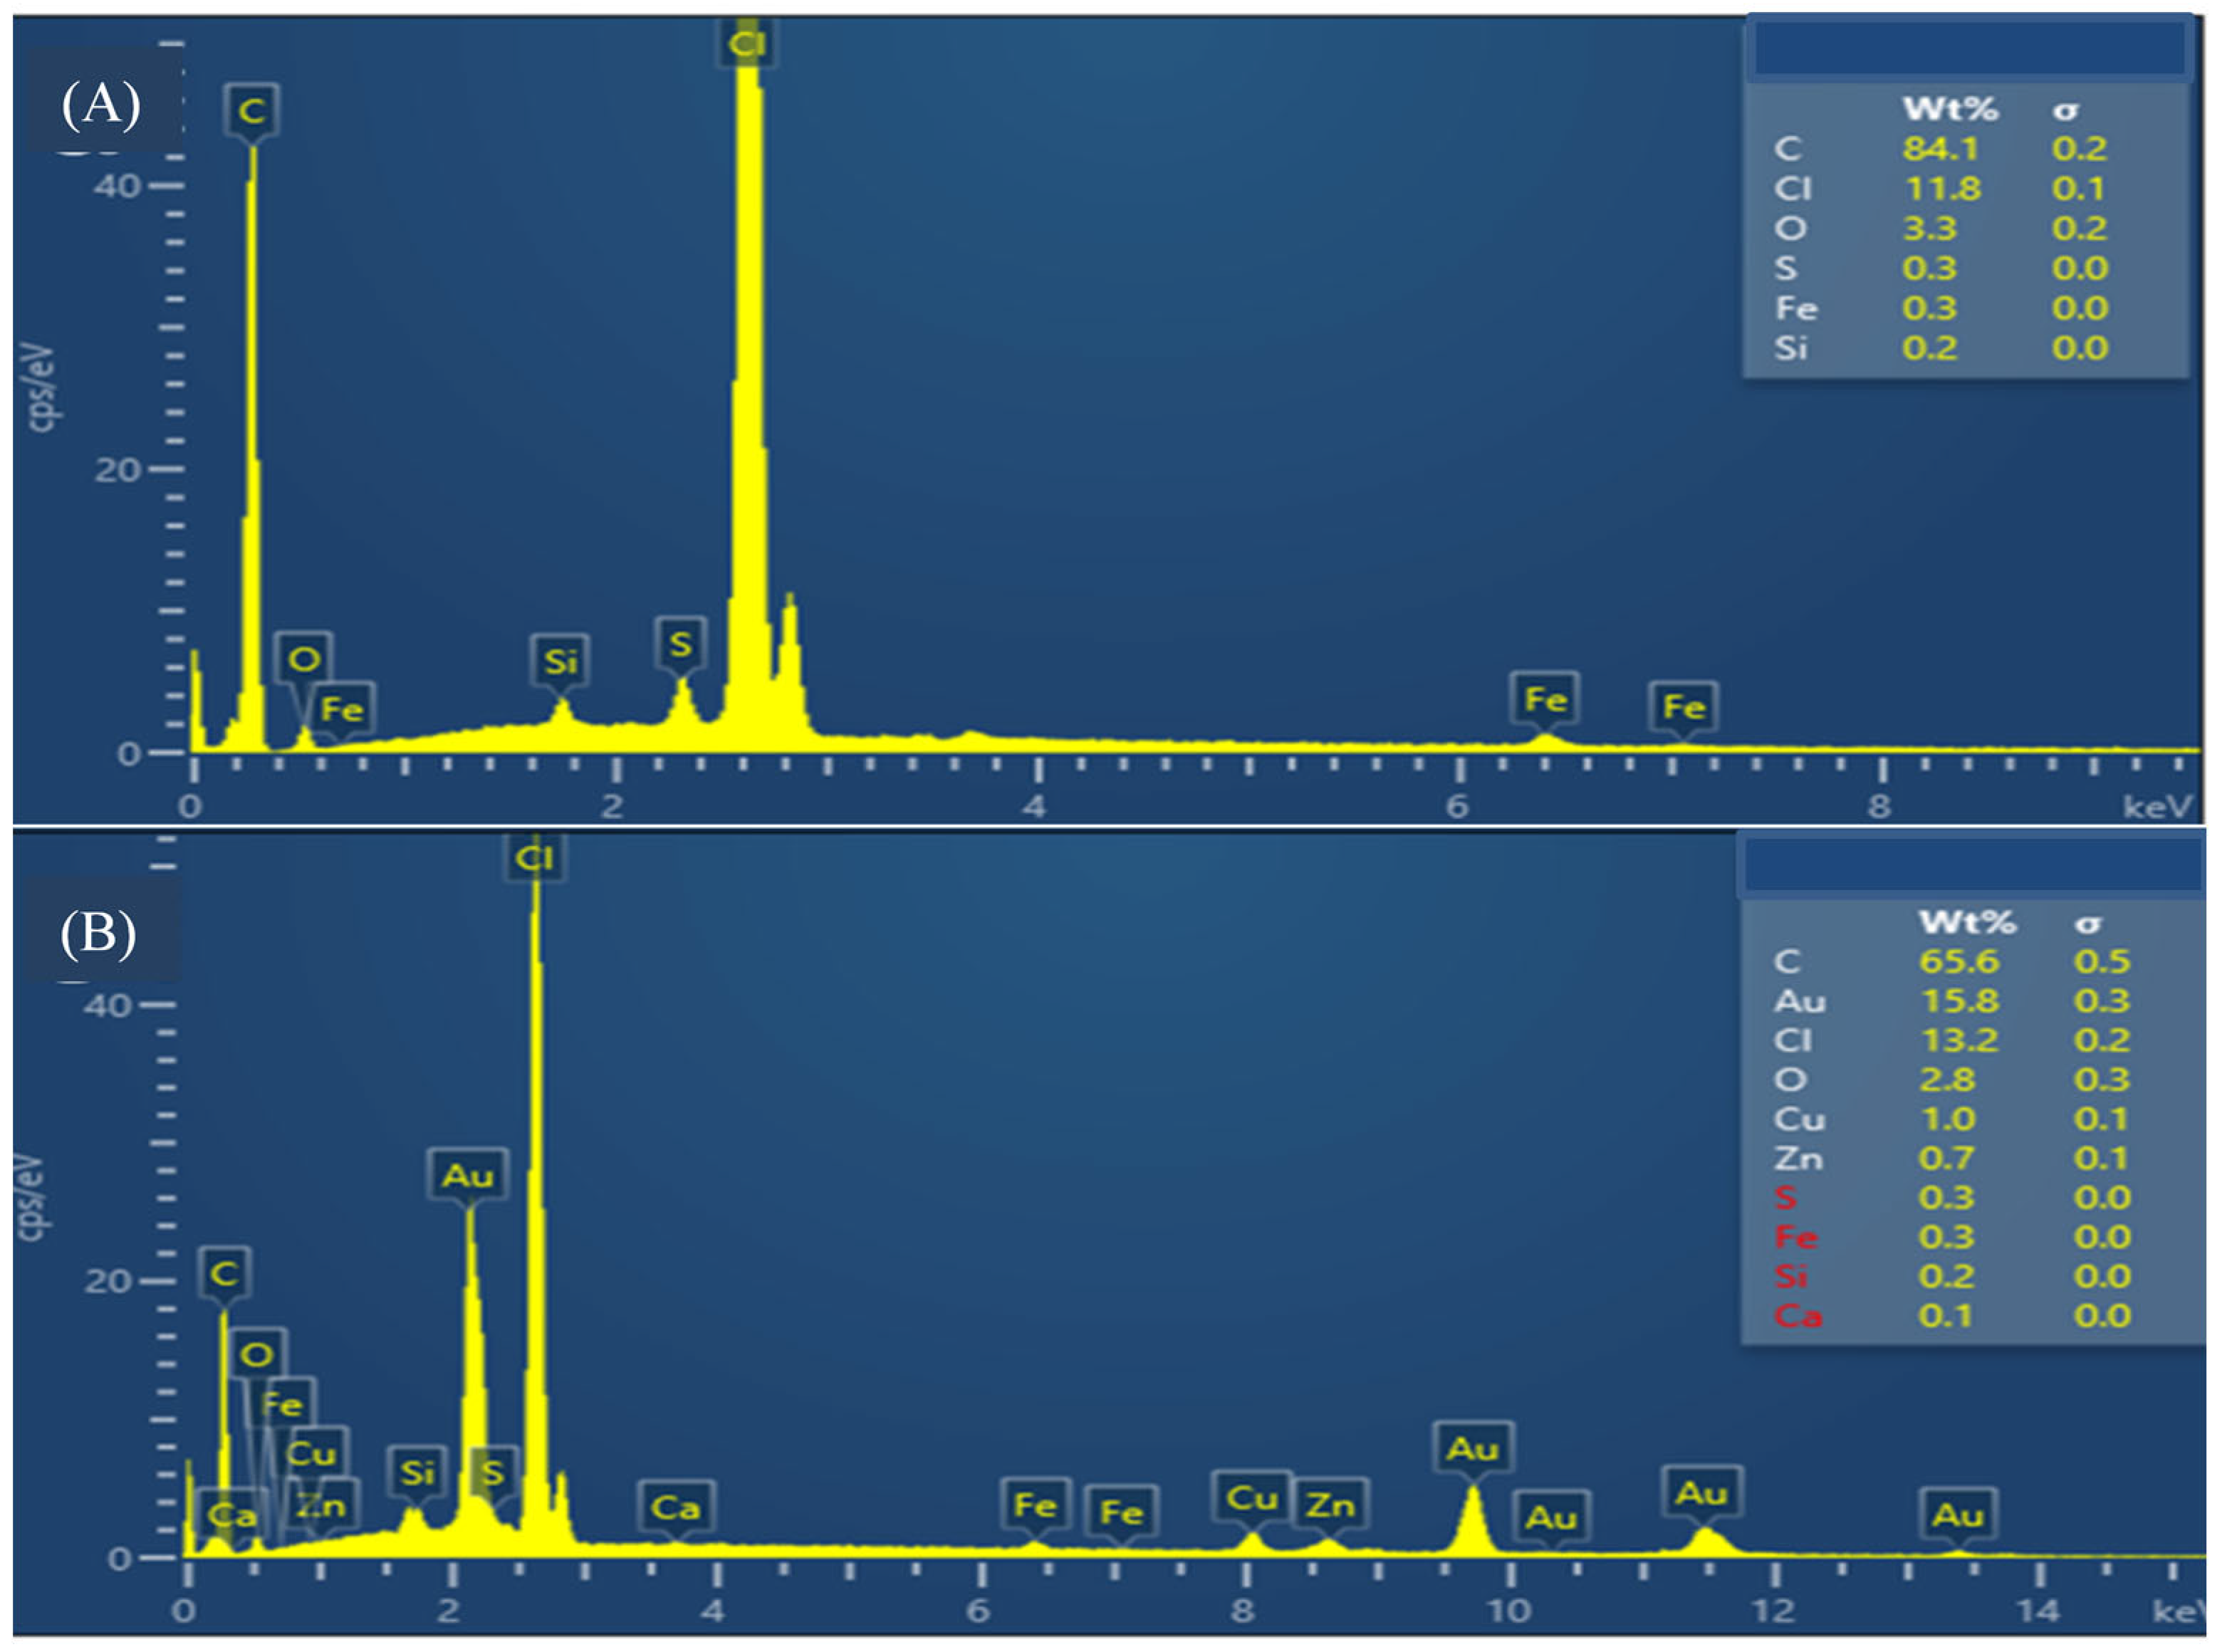
2.2.3. SEM, AFM and EDX Analysis
2.2.4. Electrochemical Characterization and Doxorubicin Detection
2.2.5. Selectivity and Real Sample Analysis
2.2.6. Spectrophotometric Analysis
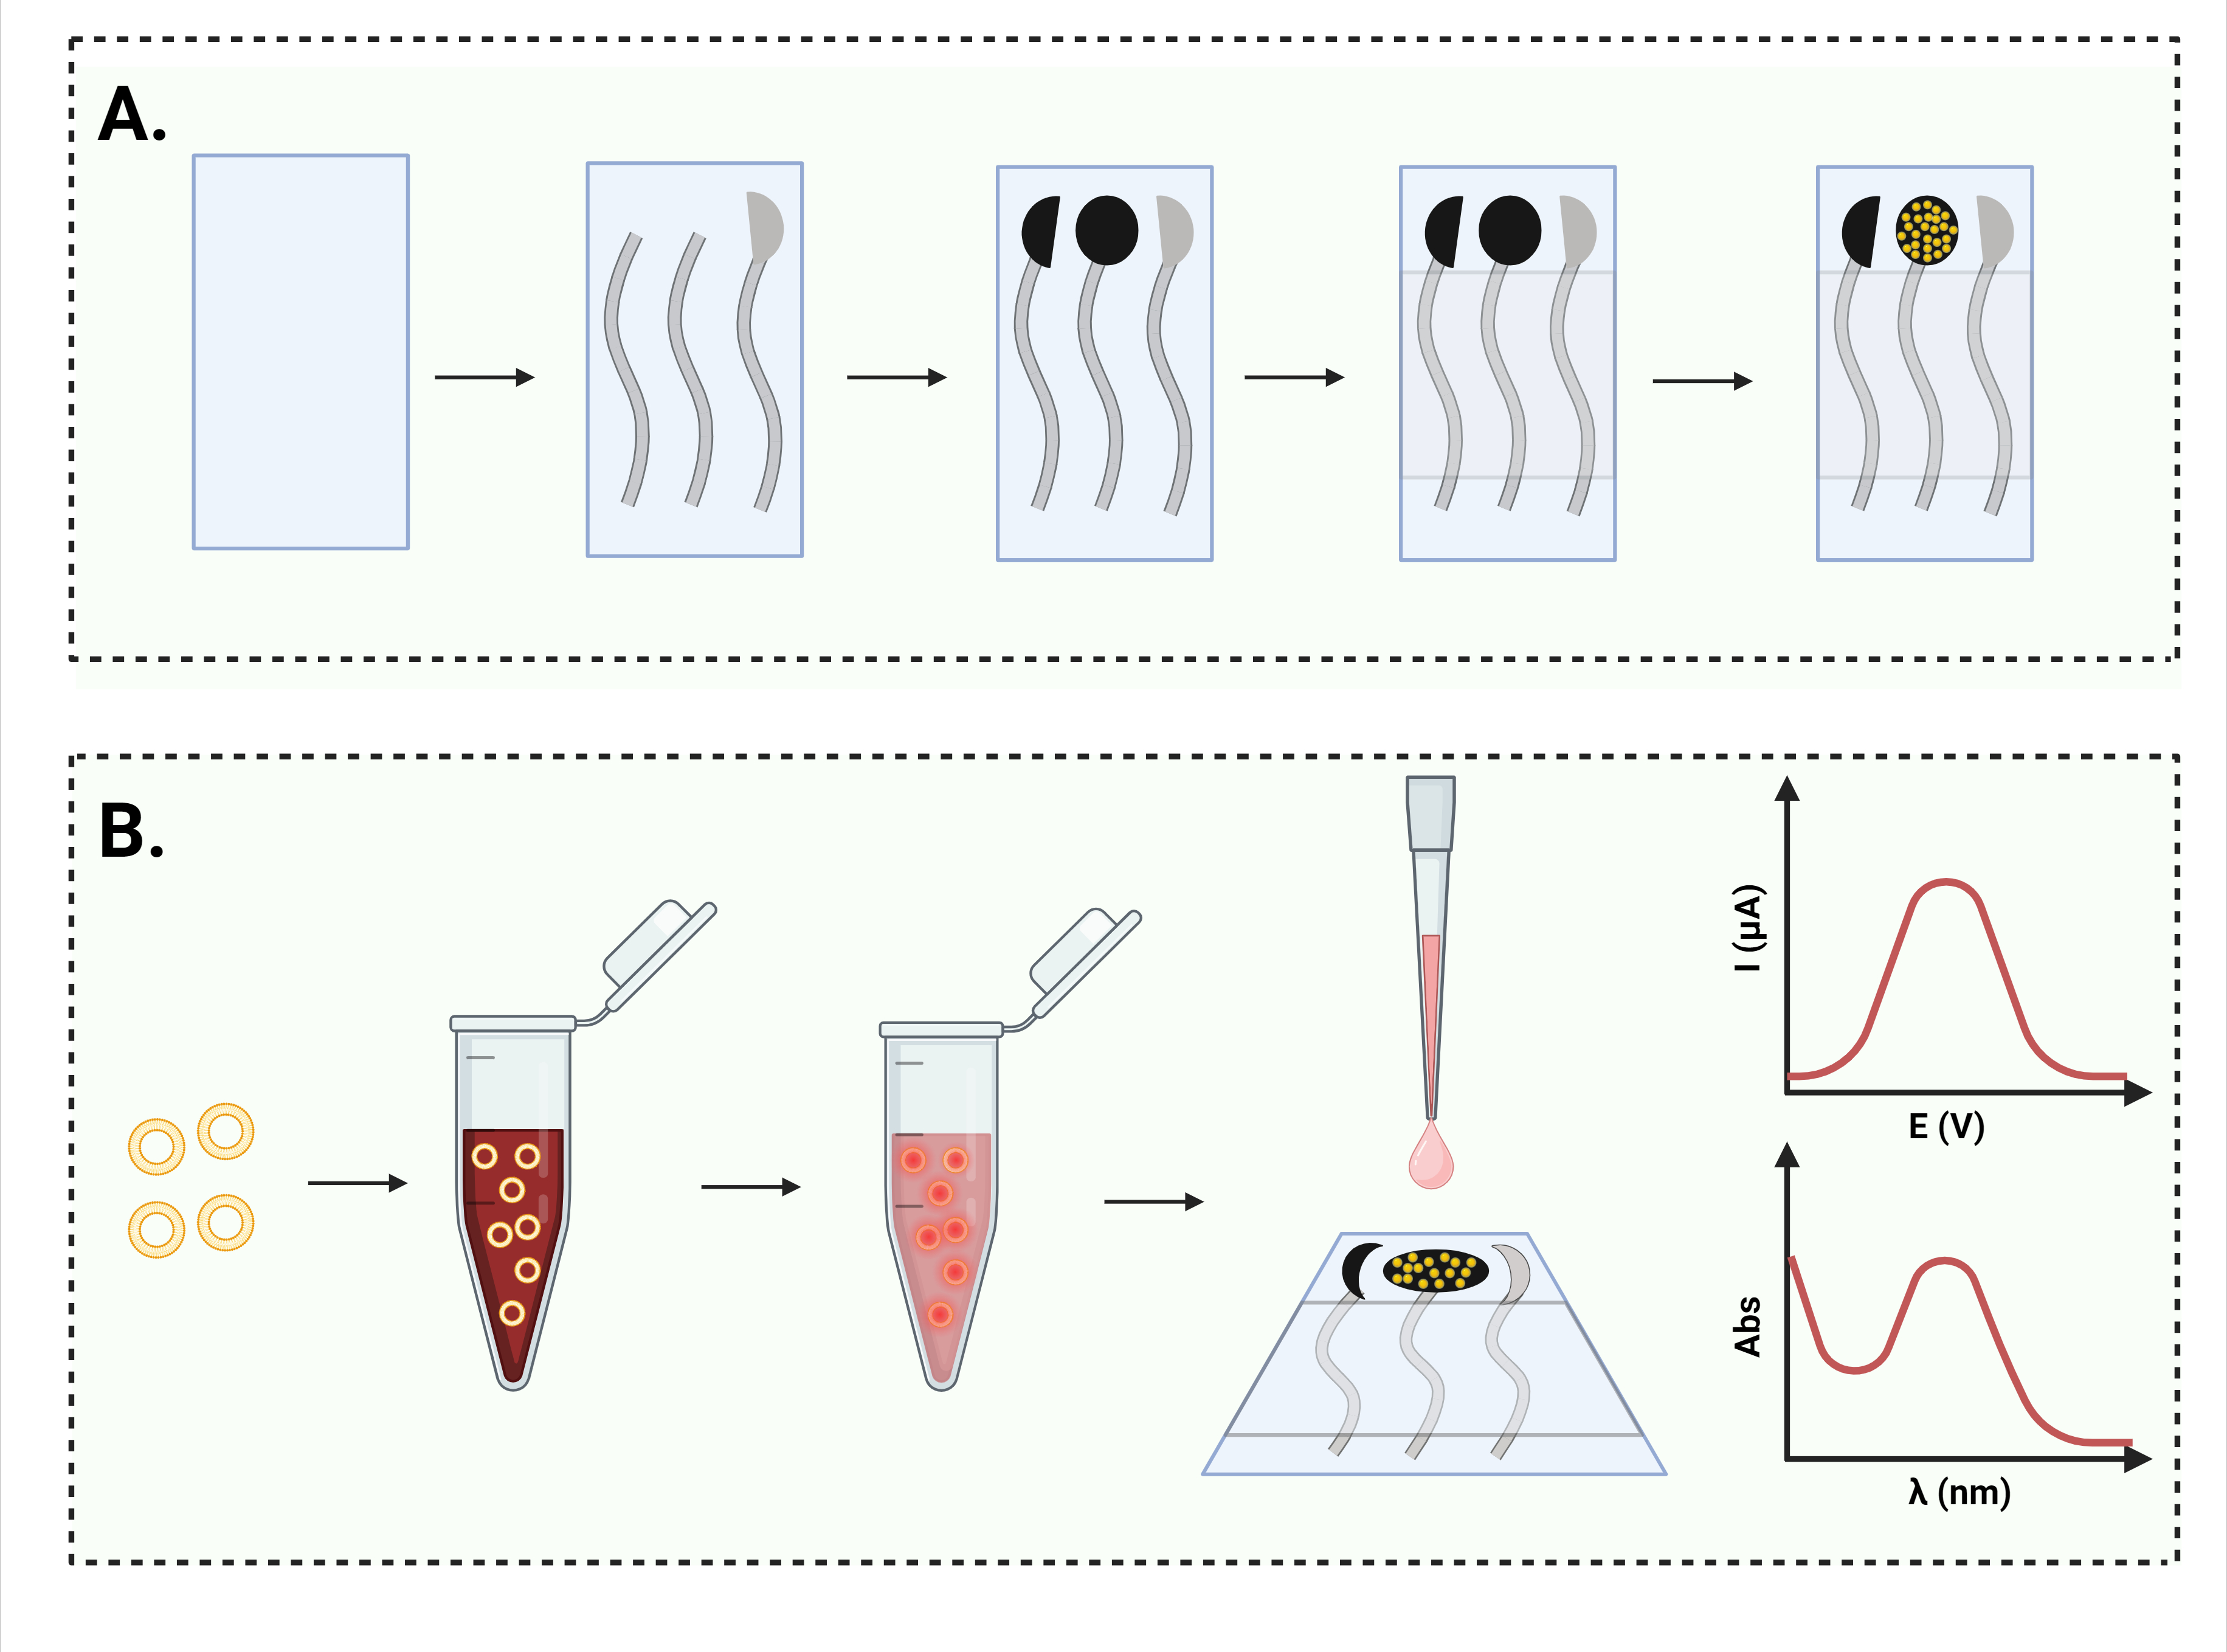
2.2.7. DOX Loading into Nanosomes
2.2.8. DOX Release
3. Results and Discussions
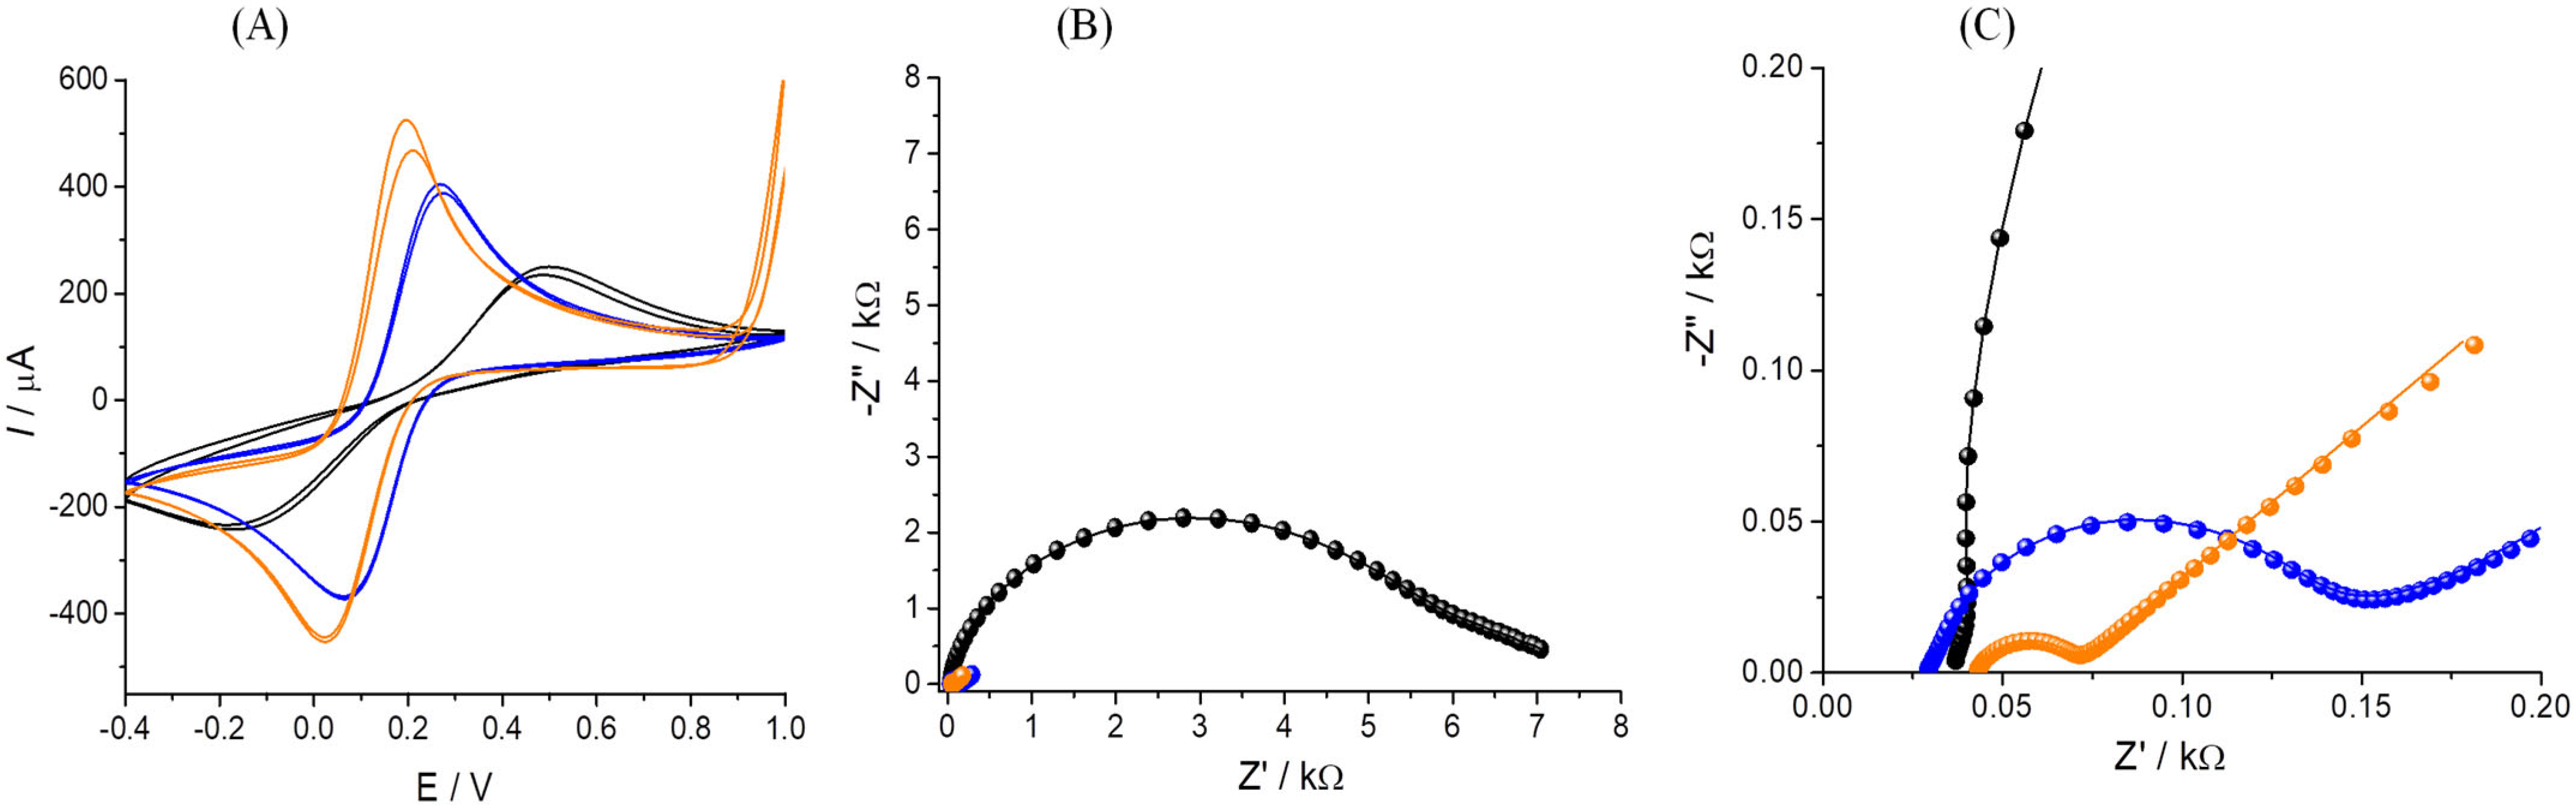
3.1. Gold Nanoparticle Deposition
3.2. Electrochemical Characterization of the Platform
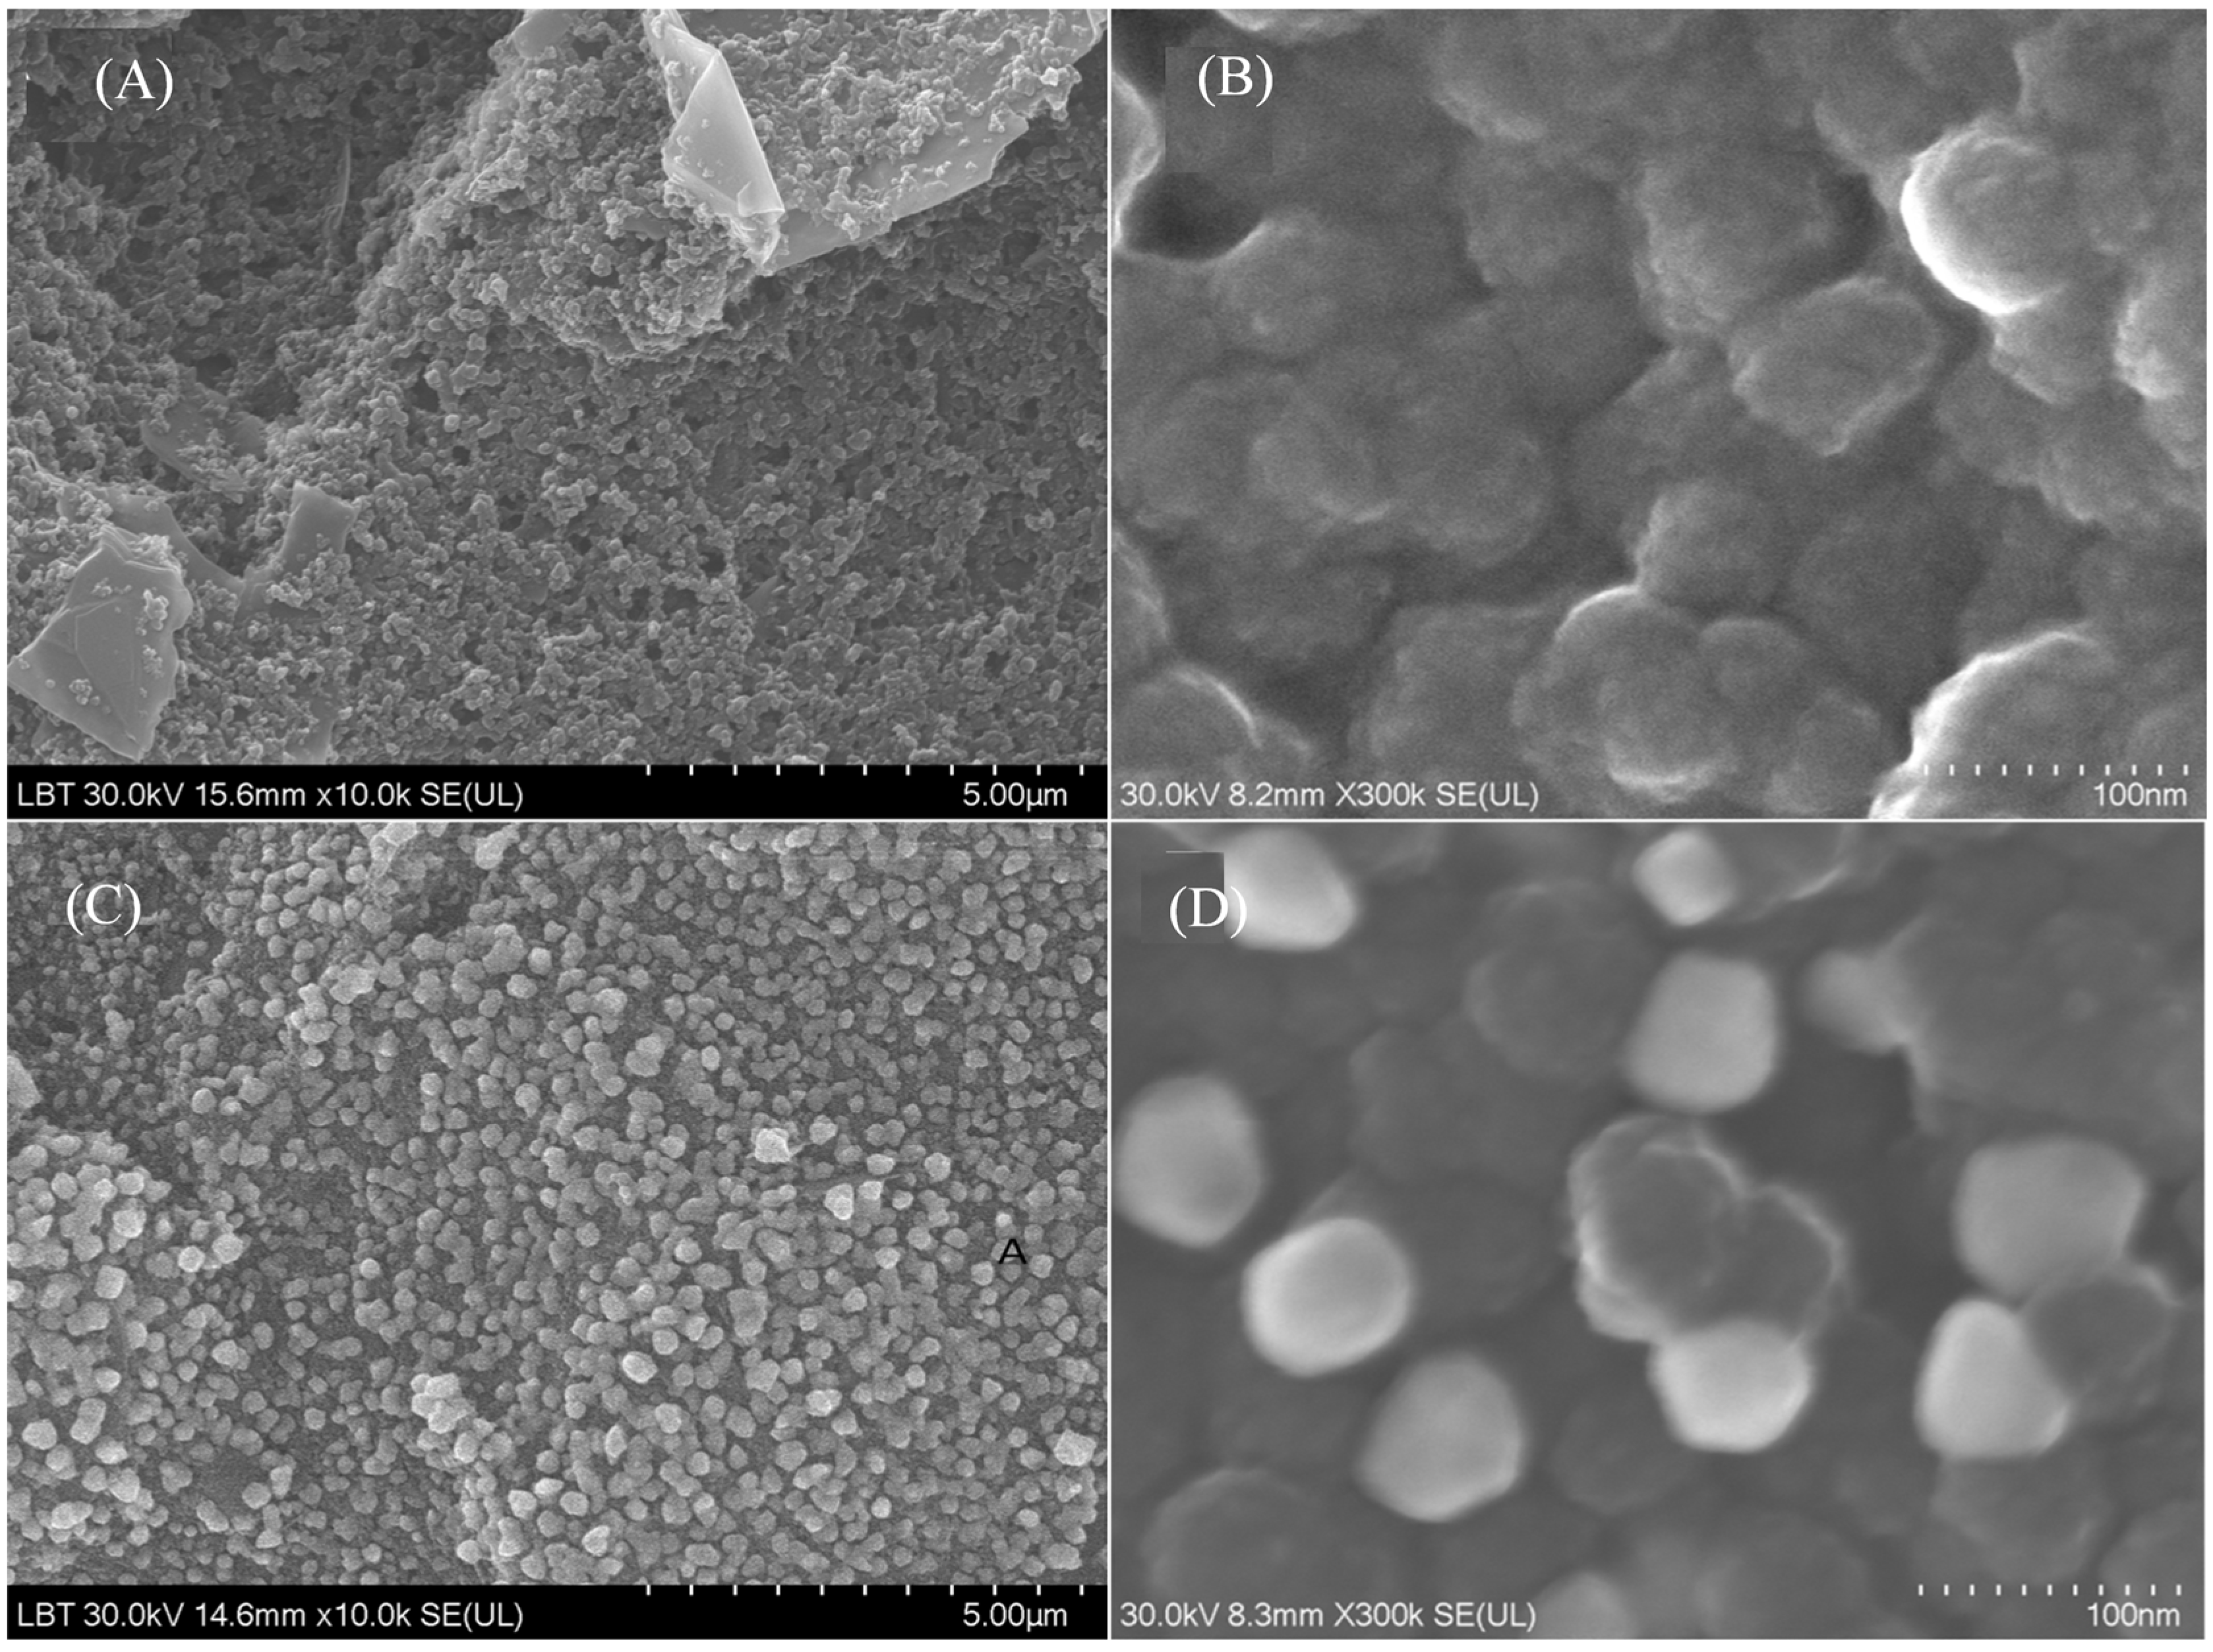
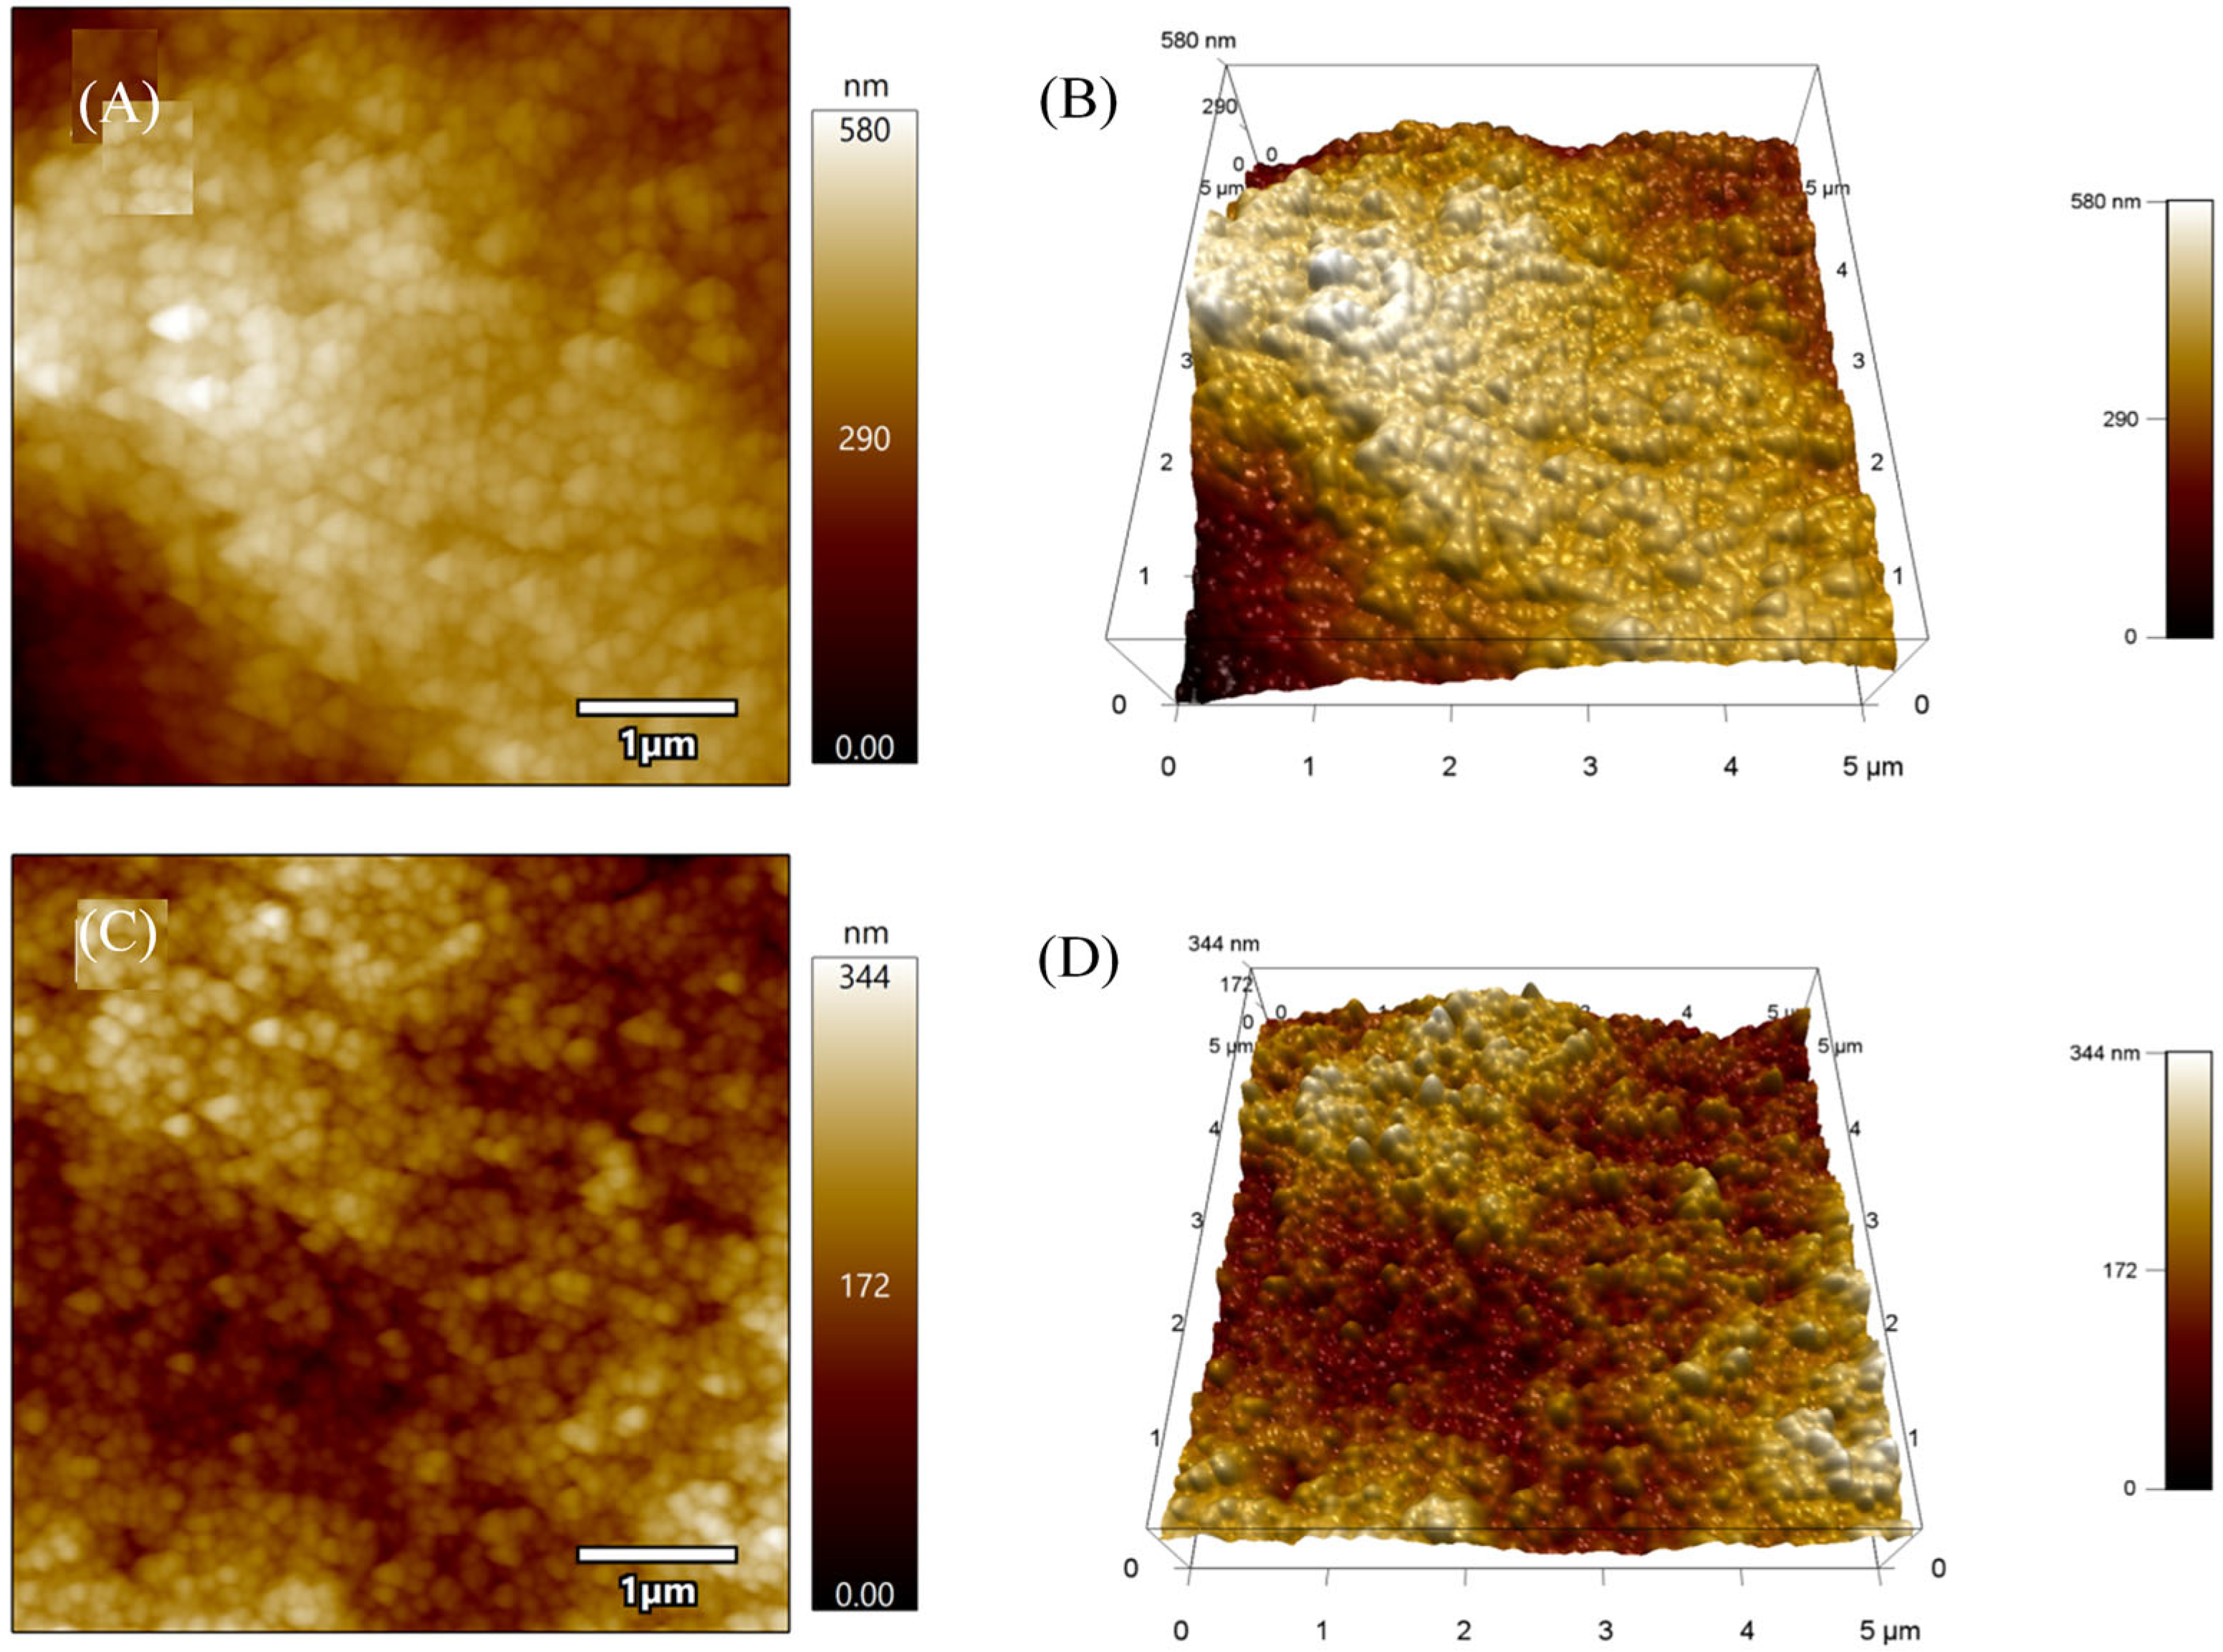
3.3. Morfostructural Characterization of the Platform
3.4. Electrochemical Behavior of DOX
3.4.1. Influence of the Supporting Electrolyte
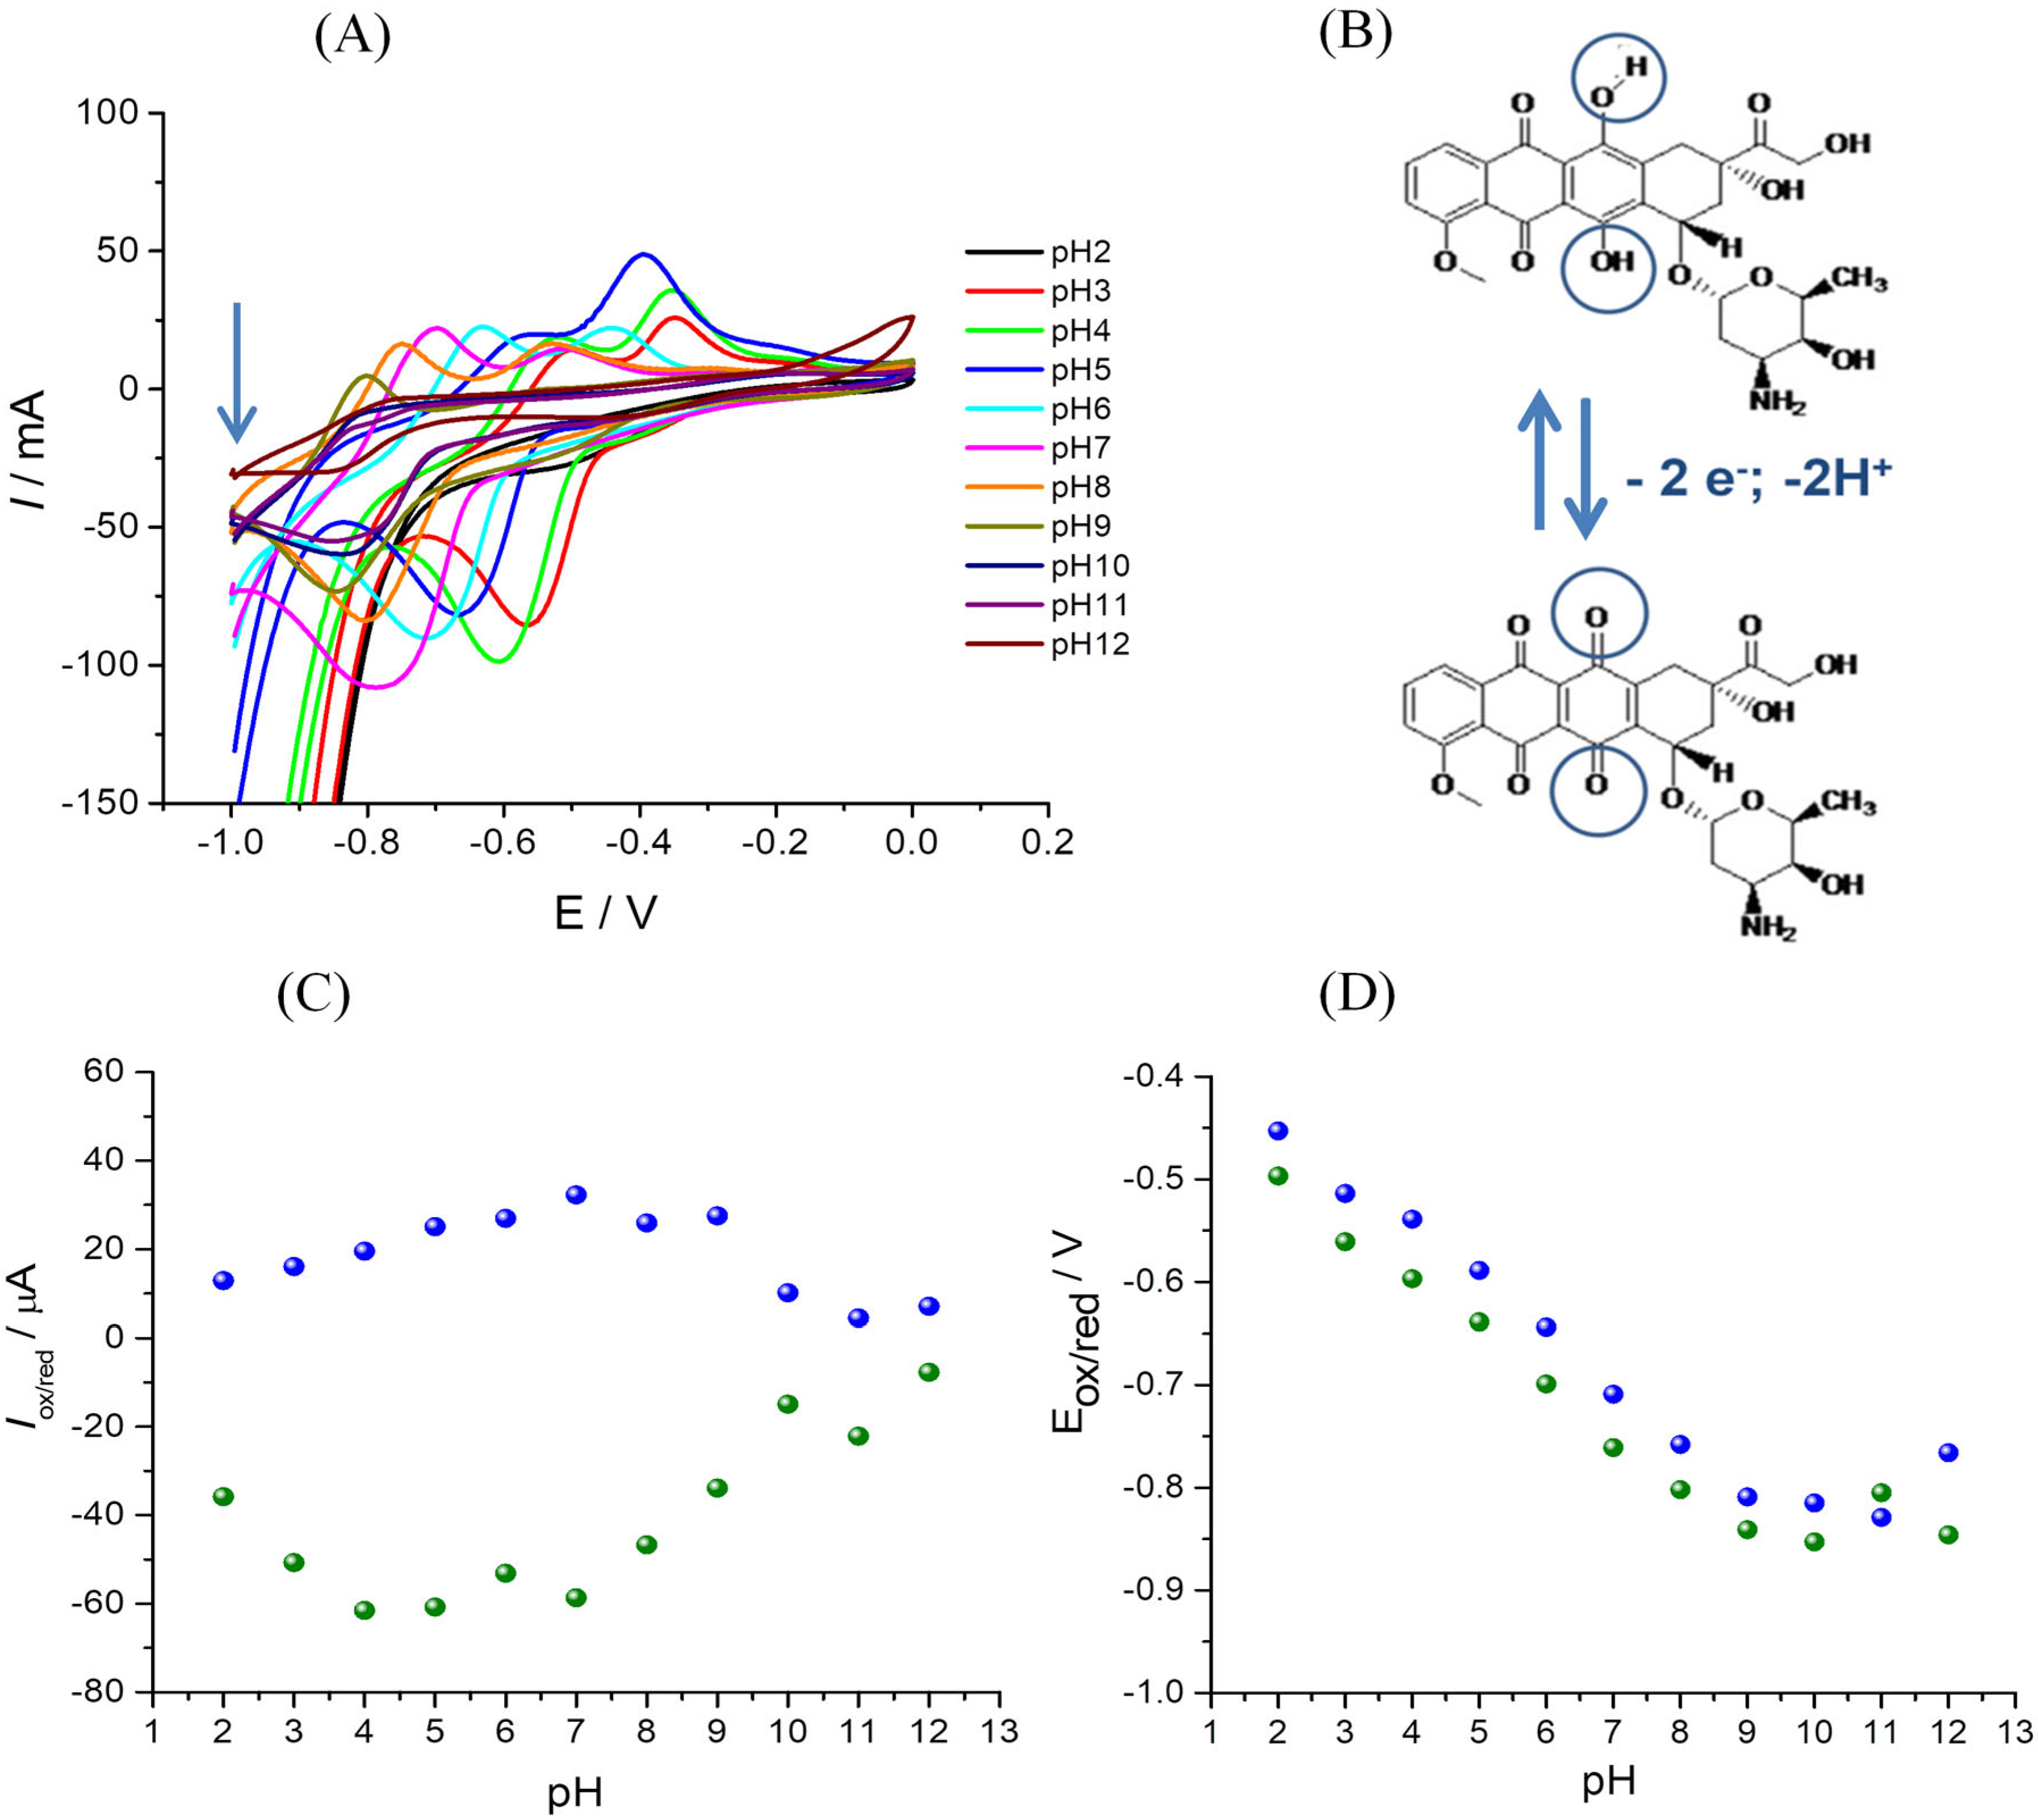
3.4.2. Influence of the pH
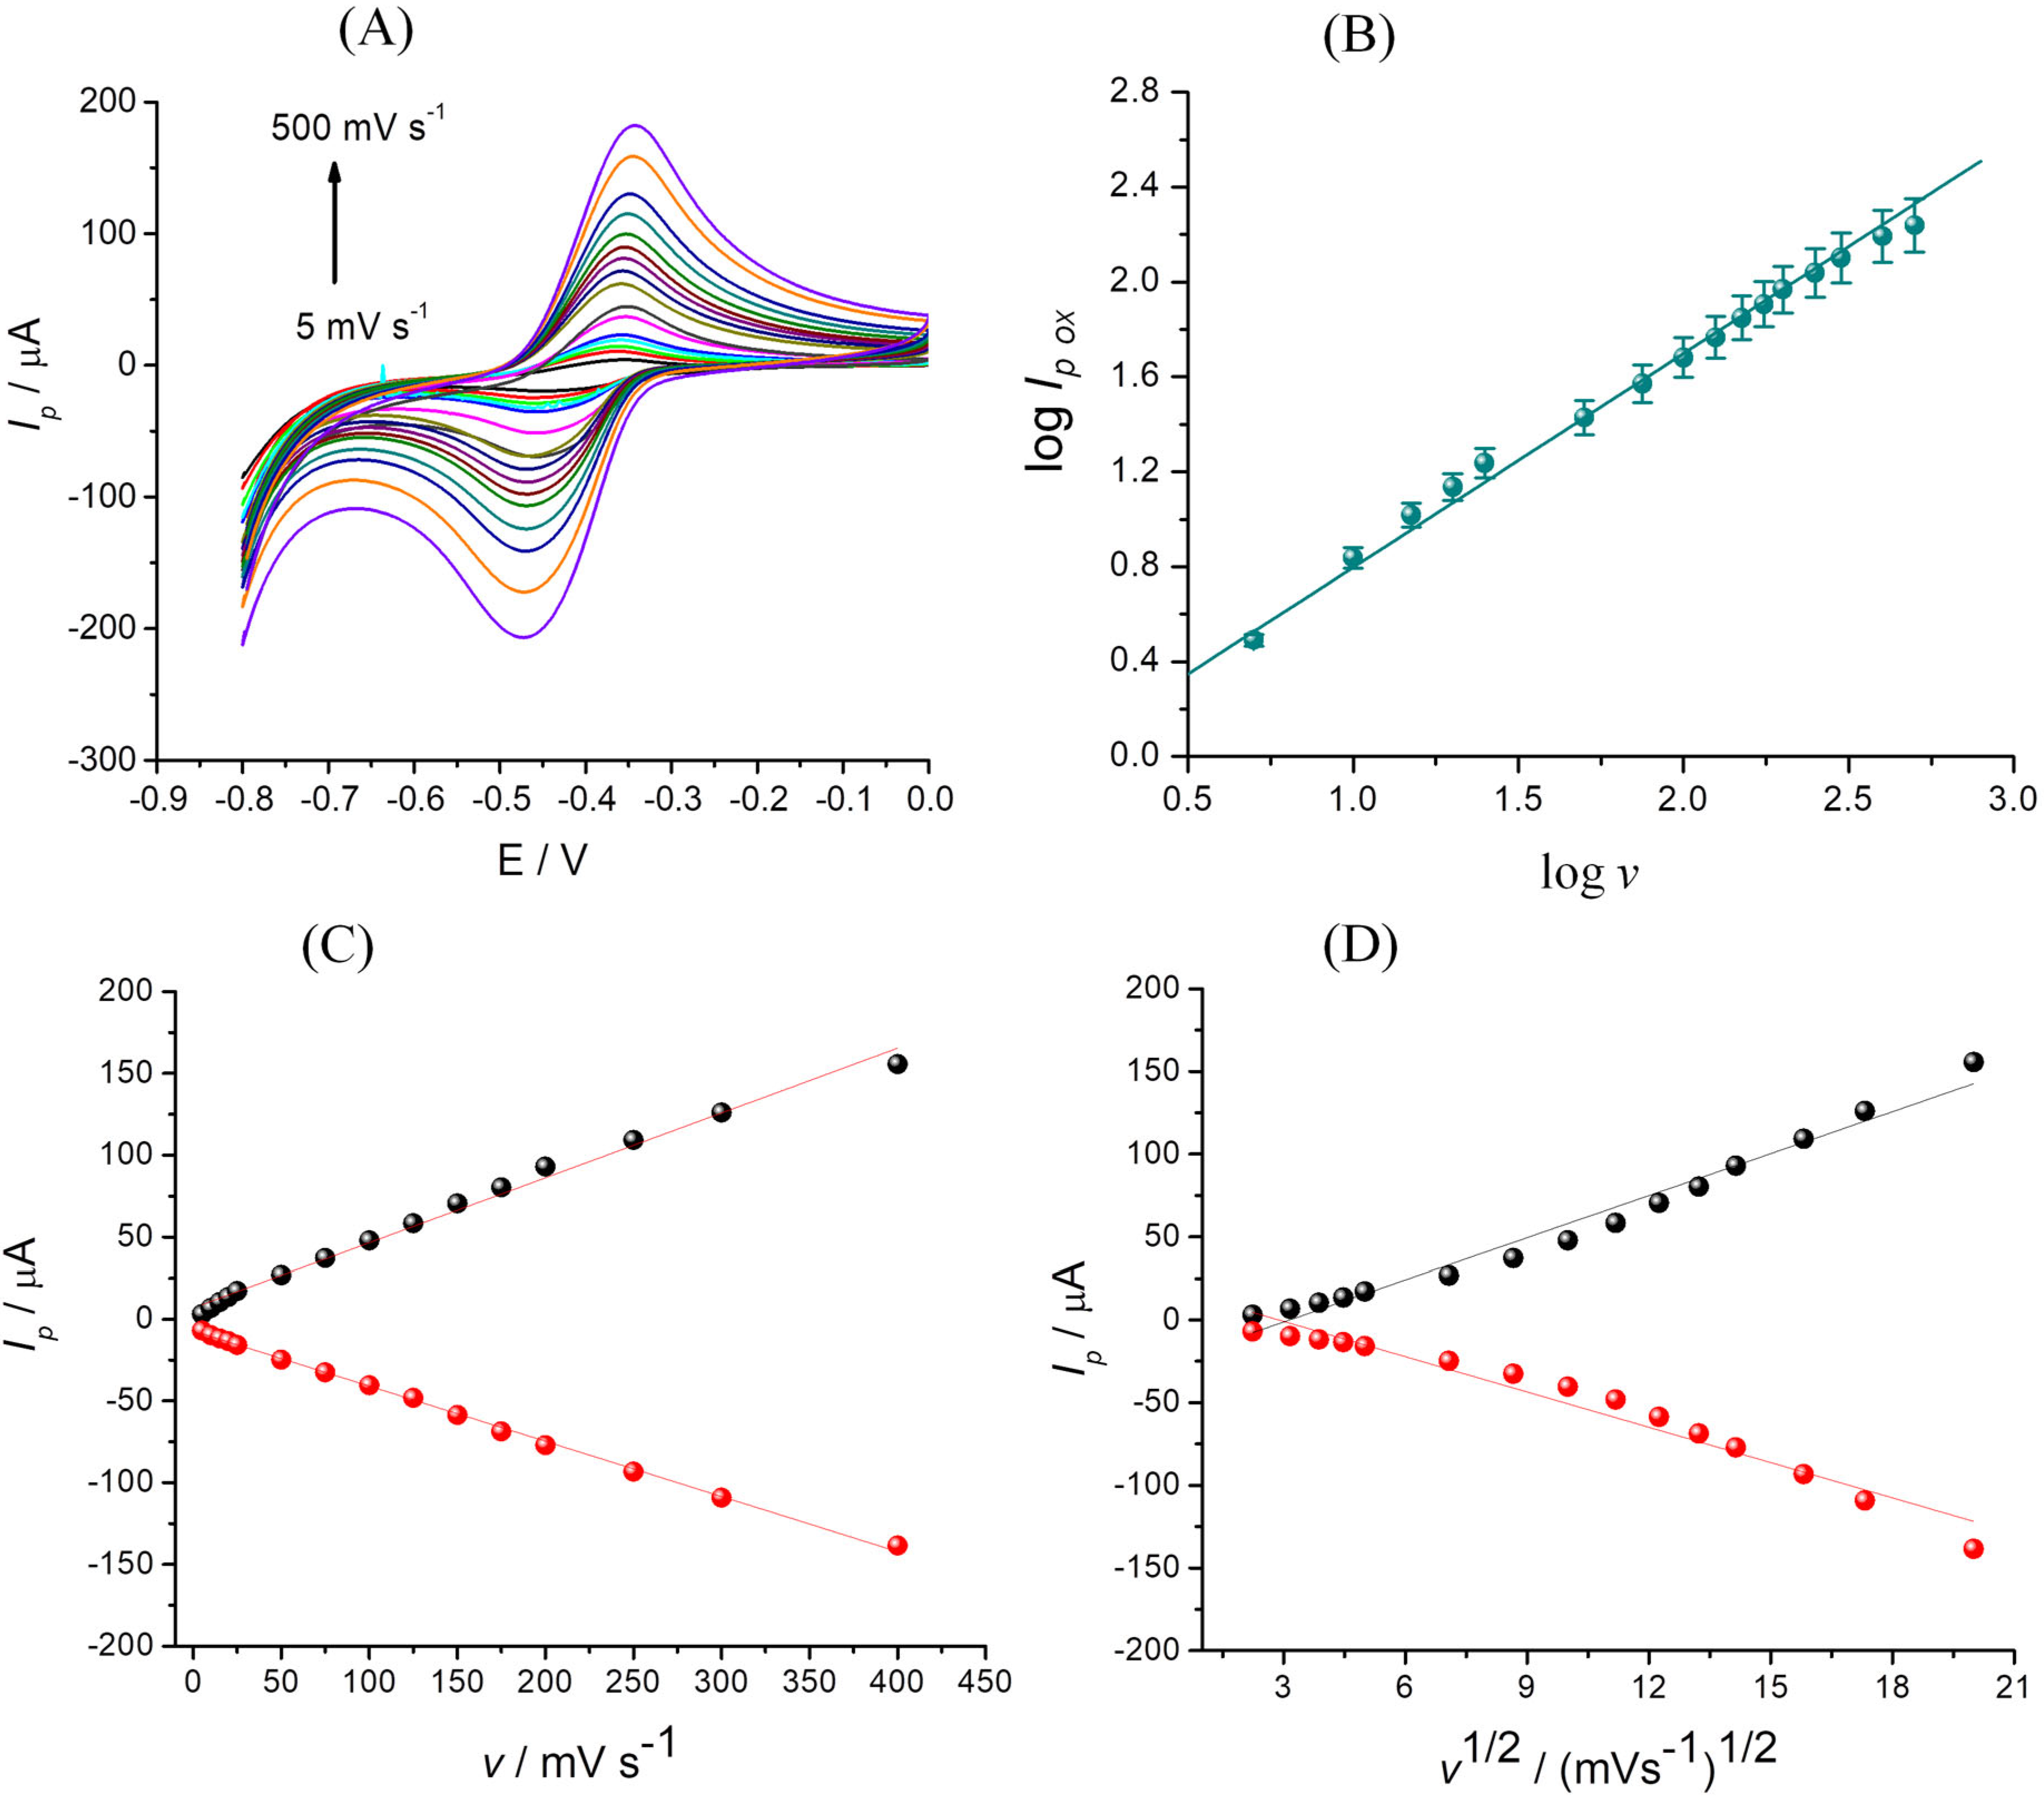
3.4.3. Influence of the Scan Rate
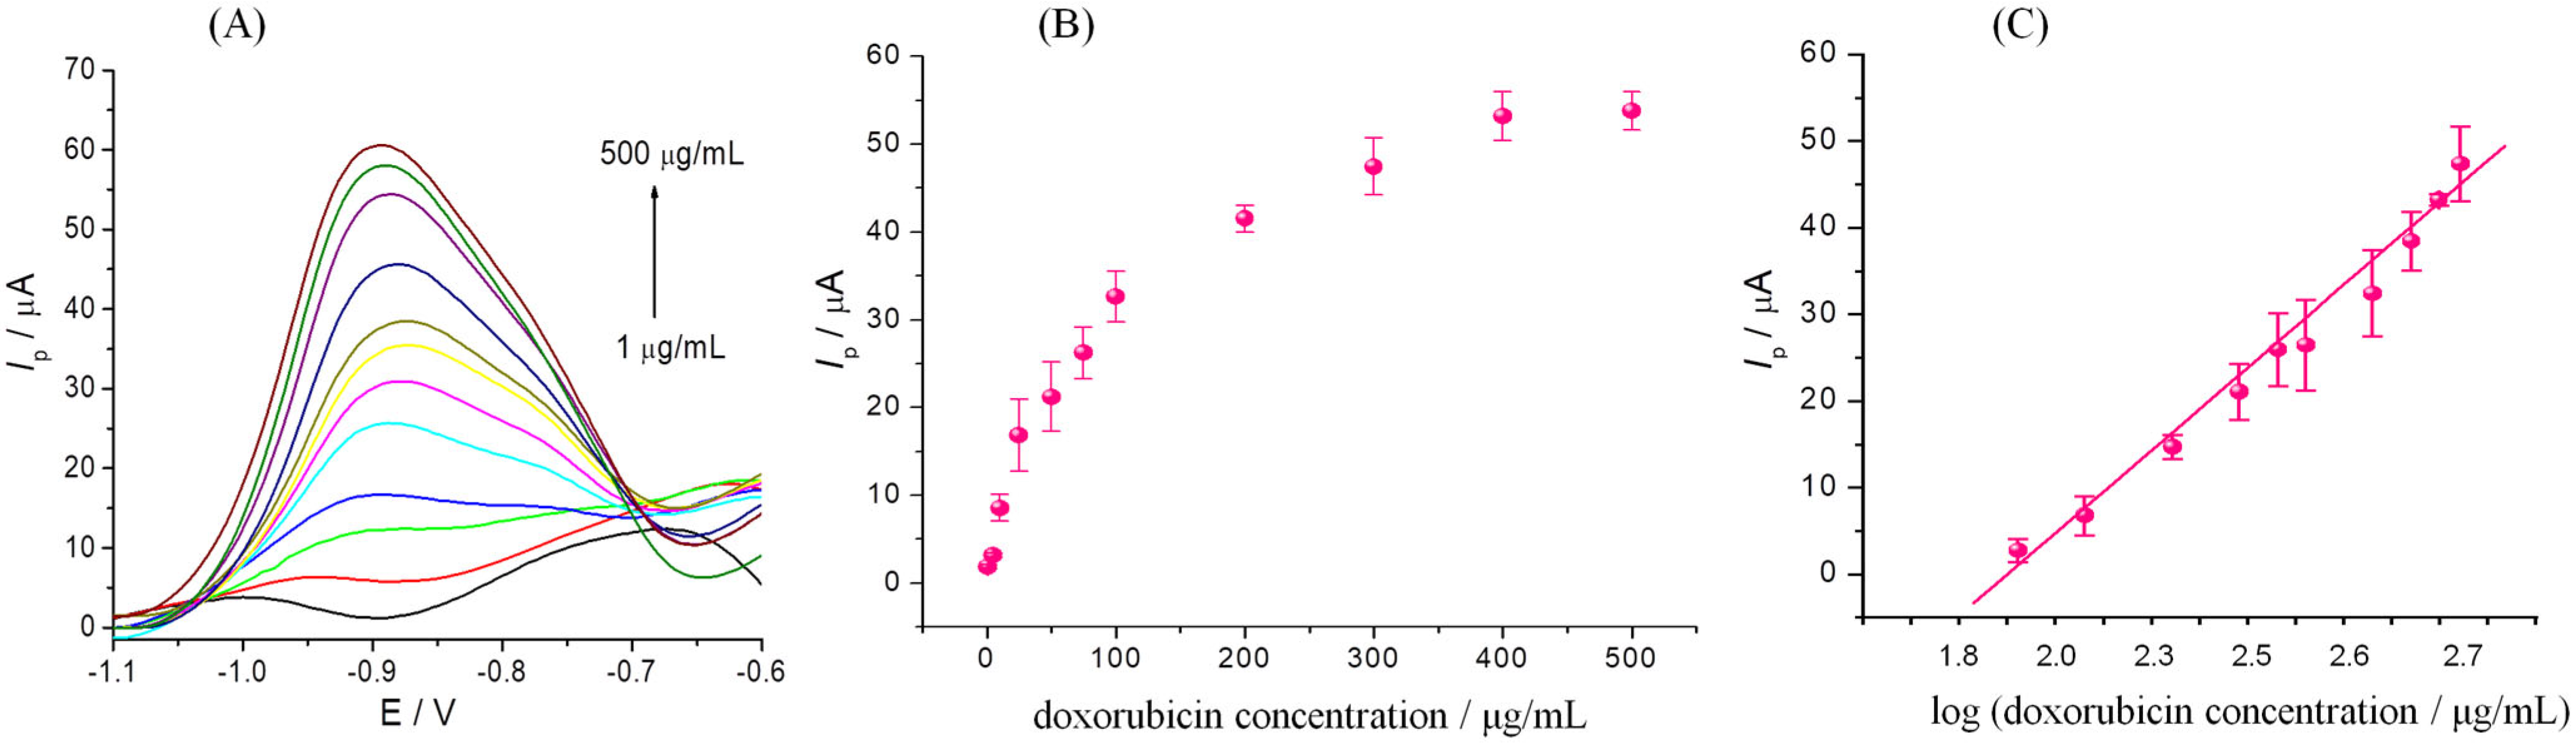
3.5. Electrochemical Detection of DOX
3.6. Stability, Selectivity and Real Sample Analysis
3.7. DOX Spectrophotometric Behavior
3.8. DOX Loading
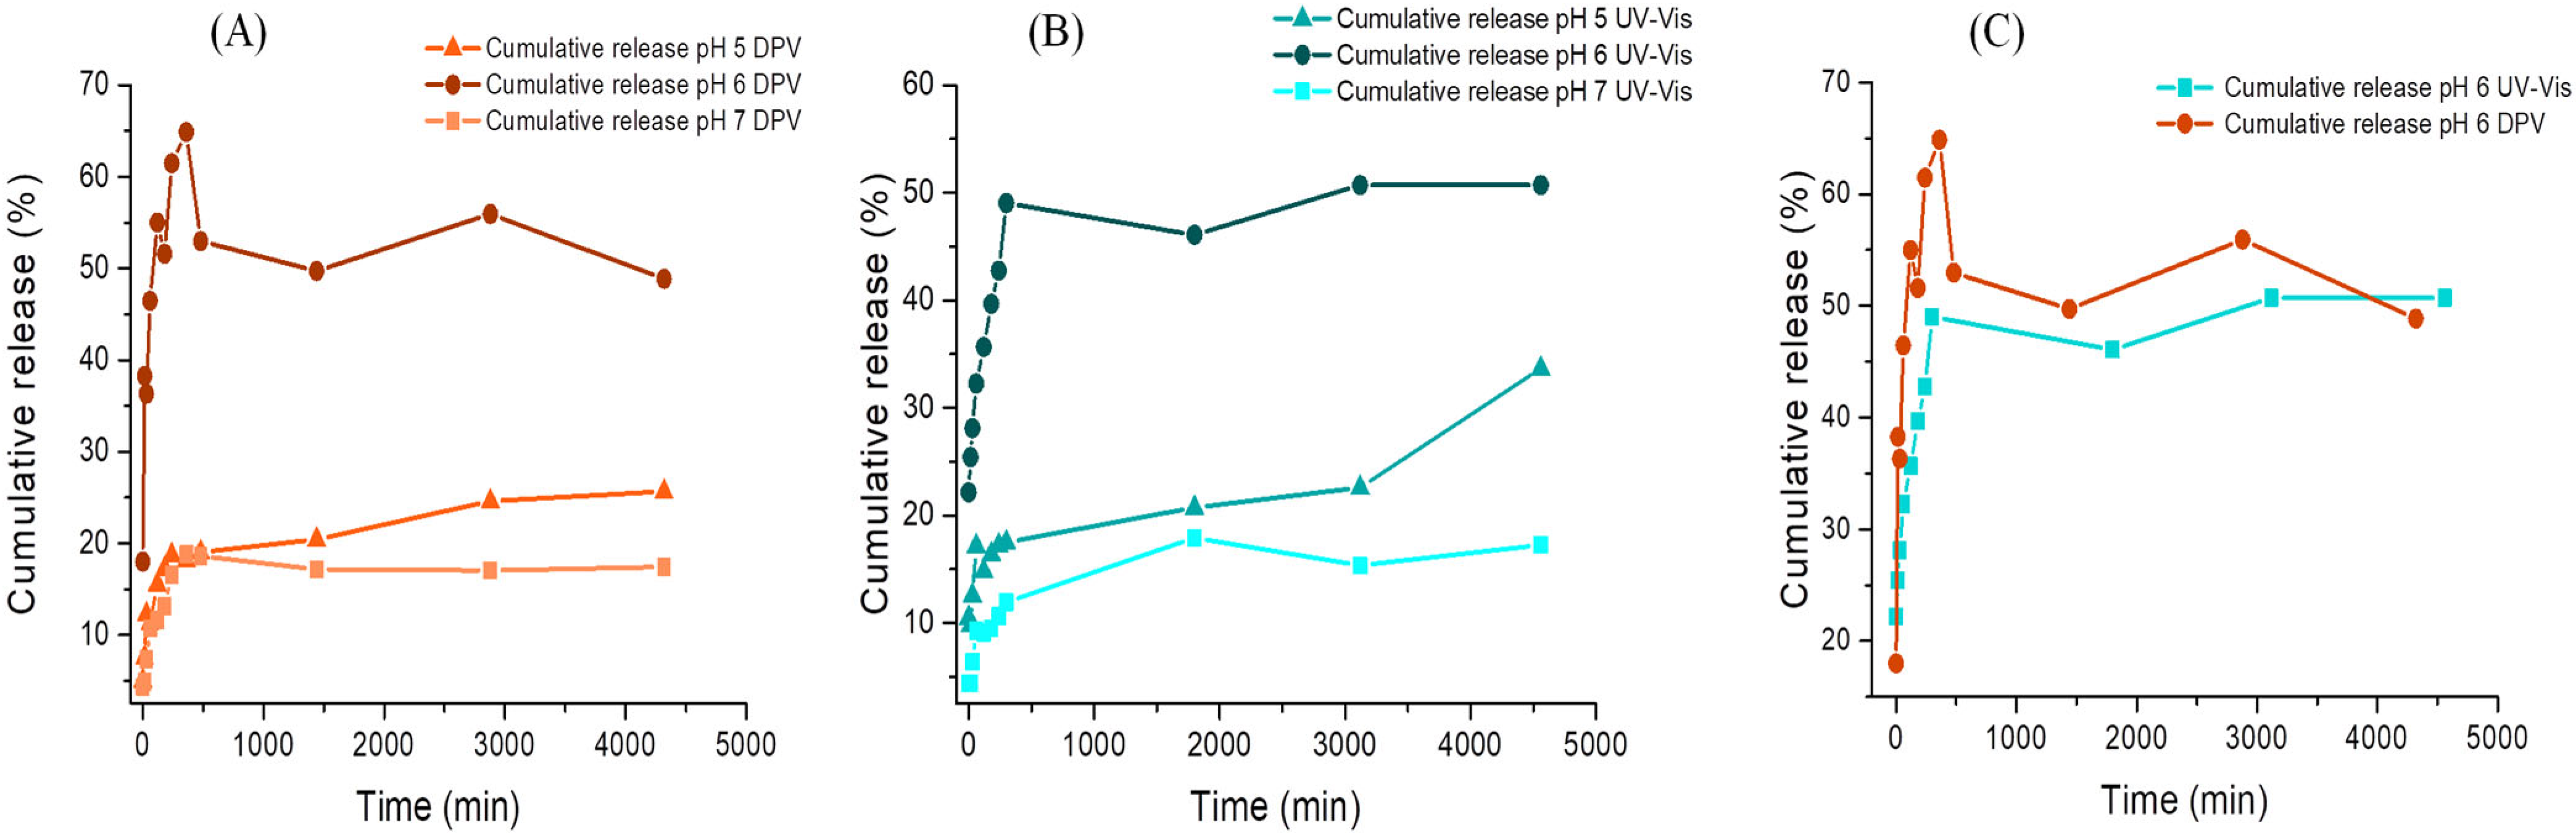
3.9. DOX Release
4. Conclusions
Supplementary Materials
Author Contributions
Funding
Institutional Review Board Statement
Informed Consent Statement
Data Availability Statement
Acknowledgments
Conflicts of Interest
References
- Sritharan, S.; Sivalingam, N. A comprehensive review on time-tested anticancer drug doxorubicin. Life Sci. 2021, 278, 119527. [Google Scholar] [CrossRef]
- Johnson-Arbor, K.; Dubey, R. Doxorubicin. Stat Pearls. Available online: https://www.ncbi.nlm.nih.gov/books/NBK459232/#article-20695.s11 (accessed on 5 December 2023).
- Luu, A.Z.; Chowdhury, B.; Al-Omran, M.; Teoh, H.; Hess, D.A.; Verma, S. Role of Endothelium in Doxorubicin-Induced Cardiomyopathy. JACC Basic Transl. Sci. 2018, 3, 861–870. [Google Scholar] [CrossRef]
- Kalyanaraman, B. Teaching the basics of the mechanism of doxorubicin-induced cardiotoxicity: Have we been barking up the wrong tree? Redox Biol. 2020, 29, 101394. [Google Scholar] [CrossRef]
- Mirhadi, E.; Mashreghi, M.; Askarizadeh, A.; Mehrabian, A.; Alavizadeh, S.H.; Arabi, L.; Badiee, A.; Jaafari, M.R. Redox-sensitive doxorubicin liposome: A formulation approach for targeted tumor therapy. Sci. Rep. 2022, 12, 11310. [Google Scholar] [CrossRef]
- Iman, M.; Moosavian, S.A.; Zamani, P.; Jaafari, M.R. Preparation of AS1411 aptamer-modified PEGylated liposomal doxorubicin and evaluation of its anti-cancer effects in vitro and in vivo. J. Drug Deliv. Sci. Technol. 2023, 81, 104255. [Google Scholar] [CrossRef]
- Shahraki, N.; Mehrabian, A.; Amiri-Darban, S.; Moosavian, S.A.; Jaafari, M.R. Preparation and characterization of PEGylated liposomal Doxorubicin targeted with leptin-derived peptide and evaluation of their anti-tumor effects, in vitro and in vivo in mice bearing C26 colon carcinoma. Colloids Surf. B Biointerfaces 2021, 200, 111589. [Google Scholar] [CrossRef]
- Sonju, J.J.; Shrestha, P.; Dahal, A.; Gu, X.; Johnson, W.D.; Zhang, D.; Muthumula, C.M.R.; Meyer, S.A.; Mattheolabakis, G.; Jois, S.D. Lyophilized liposomal formulation of a peptidomimetic-Dox conjugate for HER2 positive breast and lung cancer. Int. J. Pharm. 2023, 639, 122950. [Google Scholar] [CrossRef]
- Chen, H.; Sun, R.; Zheng, J.; Kawazoe, N.; Yang, Y.; Chen, G. Doxorubicin-encapsulated thermosensitive liposome-functionalized photothermal composite scaffolds for synergistic photothermal therapy and chemotherapy. J. Mater. Chem. B 2022, 10, 4771–4782. [Google Scholar] [CrossRef]
- Bahrami Parsa, M.; Tafvizi, F.; Chaleshi, V.; Ebadi, M. Preparation, characterization, and Co-delivery of cisplatin and doxorubicin-loaded liposomes to enhance anticancer Activities. Heliyon 2023, 9, e20657. [Google Scholar] [CrossRef]
- Aloss, K.; Hamar, P. Recent Preclinical and Clinical Progress in Liposomal Doxorubicin. Pharmaceutics 2023, 15, 893. [Google Scholar] [CrossRef]
- O’Brien, M.E.R.; Wigler, N.; Inbar, M.; Rosso, R.; Grischke, E.; Santoro, A.; Catane, R.; Kieback, D.G.; Tomczak, P.; Ackland, S.P.; et al. Reduced cardiotoxicity and comparable efficacy in a phase III trial of pegylated liposomal doxorubicin HCl (CAELYX/Doxil) versus conventional doxorubicin for first-line treatment of metastatic breast cancer. Ann. Oncol. Off. J. Eur. Soc. Med. Oncol. 2004, 15, 440–449. [Google Scholar] [CrossRef]
- Saharkhiz, S.; Zarepour, A.; Nasri, N.; Cordani, M.; Zarrabi, A. A comparison study between doxorubicin and curcumin co-administration and co-loading in a smart niosomal formulation for MCF-7 breast cancer therapy. Eur. J. Pharm. Sci. 2023, 191, 106600. [Google Scholar] [CrossRef]
- Saharkhiz, S.; Zarepour, A.; Zarrabi, A. A new theranostic pH-responsive niosome formulation for doxorubicin delivery and bio-imaging against breast cancer. Int. J. Pharm. 2023, 637, 122845. [Google Scholar] [CrossRef] [PubMed]
- Bofill-Bonet, C.; Gil-Vives, M.; Artigues, M.; Hernández, M.; Borrós, S.; Fornaguera, C. Fine-tuning formulation and biological interaction of doxorubicin-loaded polymeric nanoparticles via electrolyte concentration modulation. J. Mol. Liq. 2023, 390, 122986. [Google Scholar] [CrossRef]
- Cé, R.; Couto, G.K.; Pacheco, B.Z.; Dallemole, D.R.; Paschoal, J.D.; Pacheco, B.S.; Guterres, S.S.; Seixas, F.; Collares, T.; Pohlmann, A.R. Folic acid-doxorubicin polymeric nanocapsules: A promising formulation for the treatment of triple-negative breast cancer. Eur. J. Pharm. Sci. 2021, 165, 105943. [Google Scholar] [CrossRef]
- Jindal, D.; Sinha, S.; Agarwal, V.; Sisodia, V.; Singh, M. Combinatorial Assessment of Doxorubicin with Chlorogenic acid by in silico studies and development of its polymeric-nanoparticle against breast cancer. Mater. Today Proc. 2023. [Google Scholar] [CrossRef]
- Akram, M.U.; Abbas, N.; Farman, M.; Manzoor, S.; Khan, M.I.; Osman, S.M.; Luque, R.; Shanableh, A. Tumor micro-environment sensitive release of doxorubicin through chitosan based polymeric nanoparticles: An in-vitro study. Chemosphere 2023, 313, 137332. [Google Scholar] [CrossRef]
- Gökşen Tosun, N.; Erden Tayhan, S.; Gökçe, İ.; Alkan, C. Doxorubicin-loaded mPEG-pPAd-mPEG triblock polymeric nanoparticles for drug delivery systems: Preparation and in vitro evaluation. J. Mol. Struct. 2023, 1291, 135959. [Google Scholar] [CrossRef]
- Kunene, S.C.; Lin, K.-S.; Weng, M.-T.; Carrera Espinoza, M.J.; Lin, Y.-S.; Wu, C.-M.; Tsai, W.-C. Dual stimuli-responsive polymeric microgels for enhanced doxorubicin delivery to hepatocellular carcinoma. J. Drug Deliv. Sci. Technol. 2023, 87, 104776. [Google Scholar] [CrossRef]
- Sheikh, A.; Abourehab, M.A.S.; Tulbah, A.S.; Kesharwani, P. Aptamer-grafted, cell membrane-coated dendrimer loaded with doxorubicin as a targeted nanosystem against epithelial cellular adhesion molecule (EpCAM) for triple negative breast cancer therapy. J. Drug Deliv. Sci. Technol. 2023, 86, 104745. [Google Scholar] [CrossRef]
- Hashemi, H.; Namazi, H. Understanding the pH dependent fluorescence and doxorubicin release from graphene oxide functionalized citric acid dendrimer as a highly efficient drug delivery system. Mater. Today Commun. 2021, 28, 102593. [Google Scholar] [CrossRef]
- Michlewska, S.; Garaiova, Z.; Šubjakova, V.; Hołota, M.; Kubczak, M.; Grodzicka, M.; Okła, E.; Naziris, N.; Balcerzak, Ł.; Ortega, P.; et al. Lipid-coated ruthenium dendrimer conjugated with doxorubicin in anti-cancer drug delivery: Introducing protocols. Colloids Surf. B Biointerfaces 2023, 227, 113371. [Google Scholar] [CrossRef]
- Carrera Espinoza, M.J.; Lin, K.S.; Weng, M.T.; Kunene, S.C.; Lin, Y.S.; Liu, S.Y. Magnetic boron nitride nanosheets-based on pH-responsive smart nanocarriers for the delivery of doxorubicin for liver cancer treatment. Colloids Surf. B Biointerfaces 2023, 222, 113129. [Google Scholar] [CrossRef] [PubMed]
- Zhao, Q.; Xie, P.; Li, X.; Wang, Y.; Zhang, Y.; Wang, S. Magnetic mesoporous silica nanoparticles mediated redox and pH dual-responsive target drug delivery for combined magnetothermal therapy and chemotherapy. Colloids Surf. A Physicochem. Eng. Asp. 2022, 648, 129359. [Google Scholar] [CrossRef]
- Wang, J.; Zhu, F.; Li, K.; Xu, J.; Li, P.; Fan, Y. pH-responsive mesoporous Fe2O3–Au nanomedicine delivery system with magnetic targeting for cancer therapy. Med. Nov. Technol. Devices 2022, 15, 100127. [Google Scholar] [CrossRef]
- Liu, Q.; Tan, Z.; Zheng, D.; Qiu, X. pH-responsive magnetic Fe3O4/carboxymethyl chitosan/aminated lignosulfonate nanoparticles with uniform size for targeted drug loading. Int. J. Biol. Macromol. 2022, 225, 1182–1192. [Google Scholar] [CrossRef] [PubMed]
- Maliszewska, O.; Plenis, A.; Olędzka, I.; Kowalski, P.; Miękus, N.; Bień, E.; Krawczyk, M.A.; Adamkiewicz-Drożynska, E.; Bączek, T. Optimization of LC method for the quantification of doxorubicin in plasma and urine samples in view of pharmacokinetic, biomedical and drug monitoring therapy studies. J. Pharm. Biomed. Anal. 2018, 158, 376–385. [Google Scholar] [CrossRef] [PubMed]
- Yamamoto, E.; Miyazaki, S.; Aoyama, C.; Kato, M. A simple and rapid measurement method of encapsulation efficiency of doxorubicin loaded liposomes by direct injection of the liposomal suspension to liquid chromatography. Int. J. Pharm. 2018, 536, 21–28. [Google Scholar] [CrossRef]
- Harahap, Y.; Suryadi, H.; Anarta, A. Development and Validation of Doxorubicin Hydrochloride and Doxorubicinol Quantification Method in Dried Blood Spot by Liquid Chromatography-Tandem Mass Spectrometry. J. Pharm. Bioallied Sci. 2020, 12, 406–412. [Google Scholar] [CrossRef]
- Saklani, R.; Tiwari, A.K.; Yadav, P.K.; Yadav, P.; Chourasia, M.K. Validated HPLC-UV Method for Simultaneous Estimation of Paclitaxel and Doxorubicin Employing Ion Pair Chromatography: Application in Formulation Development and Pharmacokinetic Studies. Biomed. Res. Int. 2022, 2022, 7708235. [Google Scholar] [CrossRef]
- Ji, Y.; Zhang, X.; Liu, J.; Chen, Y.; Meng, M.; Li, C.; Wang, L. Direct quantitation of free, encapsulated, total doxorubicin and doxorubicinol in stabilized frozen human plasma to support a BE study of liposomal doxorubicin. J. Pharm. Biomed. Anal. 2020, 189, 113388. [Google Scholar] [CrossRef]
- Han, J.; Zhang, J.; Zhao, H.; Li, Y.; Chen, Z. Simultaneous determination of doxorubicin and its dipeptide prodrug in mice plasma by HPLC with fluorescence detection. J. Pharm. Anal. 2016, 6, 199–202. [Google Scholar] [CrossRef] [PubMed]
- Tertis, M.; Zăgrean, M.; Pusta, A.; Suciu, M.; Bogdan, D.; Cristea, C. Innovative nanostructured aptasensor for the electrochemical detection of gluten in food samples. Microchem. J. 2023, 193, 109069. [Google Scholar] [CrossRef]
- Ehsani, M.; Soleymani, J.; Mohammadalizadeh, P.; Hasanzadeh, M.; Jouyban, A.; Khoubnasabjafari, M.; Vaez-Gharamaleki, Y. Low potential detection of doxorubicin using a sensitive electrochemical sensor based on glassy carbon electrode modified with silver nanoparticles-supported poly(chitosan): A new platform in pharmaceutical analysis. Microchem. J. 2021, 165, 106101. [Google Scholar] [CrossRef]
- Hajian, R.; Tayebi, Z.; Shams, N. Fabrication of an electrochemical sensor for determination of doxorubicin in human plasma and its interaction with DNA. J. Pharm. Anal. 2017, 7, 27–33. [Google Scholar] [CrossRef] [PubMed]
- Ganesh, P.-S.; Govindasamy, M.; Kim, S.-Y.; Choi, D.-S.; Ko, H.-U.; Alshgari, R.A.; Huang, C.-H. Synergetic effects of Mo2C sphere/SCN nanocatalysts interface for nanomolar detection of uric acid and folic acid in presence of interferences. Ecotoxicol. Environ. Saf. 2023, 253, 114694. [Google Scholar] [CrossRef] [PubMed]
- Shi, L.; Wang, Z.; Bai, L.; Yang, G. Preparation of 3D Nanoflower-like ZnO/graphene Oxide decorated with Au@AuPt Bimetallic Nanoparticles for Electrochemical Determination of Doxorubicin Hydrochloride. Int. J. Electrochem. Sci. 2022, 17, 220144. [Google Scholar] [CrossRef]
- Skalová, Š.; Langmaier, J.; Barek, J.; Vyskočil, V.; Navrátil, T. Doxorubicin determination using two novel voltammetric approaches: A comparative study. Electrochim. Acta 2020, 330, 135180. [Google Scholar] [CrossRef]
- Ciui, B.; Tertis, M.; Feurdean, C.N.; Ilea, A.; Sandulescu, R.; Wang, J.; Cristea, C. Cavitas electrochemical sensor toward detection of N-epsilon (carboxymethyl)lysine in oral cavity. Sens. Actuators B Chem. 2019, 281, 399–407. [Google Scholar] [CrossRef]
- Shao, Y.; Dong, Y.; Bin, L.; Fan, L.; Wang, L.; Yuan, X.; Li, D.; Liu, X.; Zhao, S. Application of gold nanoparticles/polyaniline-multi-walled carbon nanotubes modified screen-printed carbon electrode for electrochemical sensing of zinc, lead, and copper. Microchem. J. 2021, 170, 106726. [Google Scholar] [CrossRef]
- Rus, I.; Tertis, M.; Cristea, C.; Sandulescu, R. Modern Analytical Techniques for Drug Delivery Systems Characterization. Curr. Anal. Chem. 2020, 16, 1–10. [Google Scholar] [CrossRef]
- Elgrishi, N.; Rountree, K.J.; McCarthy, B.D.; Rountree, E.S.; Eisenhart, T.T.; Dempsey, J.L. A Practical Beginner’s Guide to Cyclic Voltammetry. J. Chem. Educ. 2018, 95, 197–206. [Google Scholar] [CrossRef]
- Tertis, M.; Leva, P.I.; Bogdan, D.; Suciu, M.; Graur, F.; Cristea, C. Impedimetric aptasensor for the label-free and selective detection of Interleukin-6 for colorectal cancer screening. Biosens. Bioelectron. 2019, 137, 123–132. [Google Scholar] [CrossRef] [PubMed]
- Ghanbari, M.H.; Norouzi, Z. A new nanostructure consisting of nitrogen-doped carbon nanoonions for an electrochemical sensor to the determination of doxorubicin. Microchem. J. 2020, 157, 105098. [Google Scholar] [CrossRef]
- Hashemzadeh, N.; Hasanzadeh, M.; Shadjou, N.; Eivazi-Ziaei, J.; Khoubnasabjafari, M.; Jouyban, A. Graphene quantum dot modified glassy carbon electrode for the determination of doxorubicin hydrochloride in human plasma. J. Pharm. Anal. 2016, 6, 235–241. [Google Scholar] [CrossRef] [PubMed]
- Deepa, S.; Swamy, B.E.K.; Pai, K.V. A surfactant SDS modified carbon paste electrode as an enhanced and effective electrochemical sensor for the determination of doxorubicin and dacarbazine its applications: A voltammetric study. J. Electroanal. Chem. 2020, 879, 114748. [Google Scholar] [CrossRef]
- Rus, I.; Tertiș, M.; Barbălată, C.; Porfire, A.; Tomuță, I.; Săndulescu, R.; Cristea, C. An Electrochemical Strategy for the Simultaneous Detection of Doxorubicin and Simvastatin for Their Potential Use in the Treatment of Cancer. Biosensors 2021, 11, 15. [Google Scholar] [CrossRef] [PubMed]
- Guo, Y.; Chen, Y.; Zhao, Q.; Shuang, S.; Dong, C. Electrochemical Sensor for Ultrasensitive Determination of Doxorubicin and Methotrexate Based on Cyclodextrin-Graphene Hybrid Nanosheets. Electroanalysis 2011, 23, 2400–2407. [Google Scholar] [CrossRef]
- Sun, S.; Xu, X.; Niu, A.; Sun, Z.; Zhai, Y.; Li, S.; Xuan, C.; Zhou, Y.; Yang, X.; Zhou, T.; et al. Novel Electrochemical Sensor Based on Acetylene Black for the Determination of Doxorubicin in Serum Samples. Int. J. Electrochem. Sci. 2022, 17, 221187. [Google Scholar] [CrossRef]
- Shamsadin-Azad, Z.; Ali Taher, M.; Beitollahi, H. Metal organic framework-235/graphene oxide nanocomposite modified electrode as an electrochemical sensor for the voltammetric determination of doxorubicin in presence of dacarbazine. Microchem. J. 2024, 196, 109580. [Google Scholar] [CrossRef]
- Deepa, S.; Kumara Swamy, B.E.; Vasantakumar Pai, K. Voltammetric detection of anticancer drug Doxorubicin at pencil graphite electrode: A voltammetric study. Sensors Int. 2020, 1, 100033. [Google Scholar] [CrossRef]
- Harahap, Y.; Ardiningsih, P.; Corintias Winarti, A.; Purwanto, D.J. Analysis of the Doxorubicin and Doxorubicinol in the Plasma of Breast Cancer Patients for Monitoring the Toxicity of Doxorubicin. Drug Des. Devel. Ther. 2020, 14, 3469–3475. [Google Scholar] [CrossRef] [PubMed]
- Thews, O.; Riemann, A. Tumor pH and metastasis: A malignant process beyond hypoxia. Cancer Metastasis Rev. 2019, 38, 113–129. [Google Scholar] [CrossRef] [PubMed]
- Attia, M.F.; Anton, N.; Wallyn, J.; Omran, Z.; Vandamme, T.F. An overview of active and passive targeting strategies to improve the nanocarriers efficiency to tumour sites. J. Pharm. Pharmacol. 2019, 71, 1185–1198. [Google Scholar] [CrossRef]


| Optimized Parameter | Iox (μA) | RSD (%) | Eox (V) | |
|---|---|---|---|---|
| Deposition method | AMP at −0.1 V (5 mM HAuCl4) | 525 | 8.5 | 0.195 |
| AMP at −0.5 V (5 mM HAuCl4) | 513 | 1.7 | 0.203 | |
| CV (5 mM HAuCl4) | 541 | 2.8 | 0.220 | |
| HAuCl4 concentration | 2.5 mM (CV, 25 cycles) | 392 | 3.2 | 0.222 |
| 5 mM (CV, 25 cycles) | 541 | 2.8 | 0.193 | |
| 10 mM (CV, 25 cycles) | 563 | 1.9 | 0.189 | |
| Number of cycles | 20 (5 mM HAuCl4) | 456 | 4.3 | 0.210 |
| 25 (5 mM HAuCl4) | 541 | 2.8 | 0.193 | |
| 50 (5 mM HAuCl4) | 584 | 3.7 | 0.188 | |
| Eox = f(pH) | Oxidation | EOx = −0.051 pH − 0.347 | R2 = 0.994 |
| Ered = f(pH) | Reduction | ERed = −0.050 pH − 0.402 | R2 = 0.996 |
| I = f(v) | Oxidation | IOx = 0.39 v + 6.87 | R2 = 0.996 |
| Reduction | IRed = −0.33 v − 7.15 | R2 = 0.998 | |
| I = f(v1/2) | Oxidation | IOx = 8.46 v1/2 − 26.61 | R2 = 0.973 |
| Reduction | IRed = −7.11 v1/2 + 20.50 | R2 = 0.954 | |
| logIox = f(logv) | Oxidation | logIOx = 0.90 logv − 0.10 | R2 = 0.994 |
| Electrode Used | Detection Method | Linear Range (μM) | LOD (nM) | Matrix | Ref. |
|---|---|---|---|---|---|
| GCE/AgNP/Chi | SWV | 0.103–8.6 | 103 (LOQ) | Human plasma Cell lysate | [35] |
| PtE/MWCNT | CV | 0.09–7.33 | 3.6 | Human plasma | [36] |
| GCE/Au@AuPt/3D ZnO-GO | DPV | 0.65–369.45 | 13 | Urine | [38] |
| p-AgSAE PLLI | DPCSV DPV | 0.6–10 1–40 | 440 840 | Tap water, urine Buffers | [39] |
| GCE/N-CNOs | DPV | 0.0002–10 | 0.06 | Serum | [45] |
| GCE/GQDs | DPV | 0.018–3.600 | 16 | Human plasma | [46] |
| CPE/SDS | CV DPV | 10–80 2–24 | 1120 390 | Buffer | [47] |
| SPE | AMP | 0.91–119 | 180 | Pharmaceutical formulations | [48] |
| GCE/CD-GN | DPV | 0.01–0.2 | 0.1 | Buffer | [49] |
| GCE/AB | CV | 0.01–2.5 μM | 3.006 nM | Spiked human serum | [50] |
| CPE/GO/MOF | DPV | 0.01–100 | 5 | Injectable solution | [51] |
| PGE | LSV | 10–60 | 9900 | Serum | [52] |
| SPE/AuNP | DPV | 1.83–915 μM | 550 | Pharmaceutical formulations Spiked serum | This work |
| Sample | Recovery (%) | RSD (%) | |
|---|---|---|---|
| 100 μg/mL DOX +10 μg/mL oxalic acid | 111.71 | 1.11 | |
| 100 μg/mL DOX + 10 μg/mL citric acid | 98.57 | 3.46 | |
| 100 μg/mL DOX + 10 μg/mL starch | 81.19 | 2.04 | |
| 100 μg/mL DOX + 1000 μg/mL glucose | 99.46 | 1.97 | |
| Tests in human serum 1:50 | |||
| DOX concentration (μg/mL) | Recovery (%) | RSD (%) | |
| Added | Found | ||
| 5 | 5.47 | 109.42 | 3.67 |
| 25 | 24.38 | 97.52 | 2.59 |
| 100 | 113.21 | 113.21 | 1.46 |
| Loading Solution | Quantification Method | EE (%) | LC (%) |
|---|---|---|---|
| 2 mg/mL DOX in acetate buffer pH 3 | UV–Vis | 41.15 | 1.48 |
| DPV | 42.95 | 1.54 |
Disclaimer/Publisher’s Note: The statements, opinions and data contained in all publications are solely those of the individual author(s) and contributor(s) and not of MDPI and/or the editor(s). MDPI and/or the editor(s) disclaim responsibility for any injury to people or property resulting from any ideas, methods, instructions or products referred to in the content. |
© 2024 by the authors. Licensee MDPI, Basel, Switzerland. This article is an open access article distributed under the terms and conditions of the Creative Commons Attribution (CC BY) license (https://creativecommons.org/licenses/by/4.0/).
Share and Cite
Pusta, A.; Tertis, M.; Bura, I.; Bogdan, D.; Suciu, M.; Mirel, S.; Cristea, C. Electrochemical Sensor for the Evaluation of Doxorubicin from Novel Pharmaceutical Formulations and Serum. Chemosensors 2024, 12, 69. https://doi.org/10.3390/chemosensors12040069
Pusta A, Tertis M, Bura I, Bogdan D, Suciu M, Mirel S, Cristea C. Electrochemical Sensor for the Evaluation of Doxorubicin from Novel Pharmaceutical Formulations and Serum. Chemosensors. 2024; 12(4):69. https://doi.org/10.3390/chemosensors12040069
Chicago/Turabian StylePusta, Alexandra, Mihaela Tertis, Irina Bura, Diana Bogdan, Maria Suciu, Simona Mirel, and Cecilia Cristea. 2024. "Electrochemical Sensor for the Evaluation of Doxorubicin from Novel Pharmaceutical Formulations and Serum" Chemosensors 12, no. 4: 69. https://doi.org/10.3390/chemosensors12040069