Article

Controlling Fluorescence Wavelength in the Synthesis of TGA-Capped CdTe Quantum Dots

by
Catarina S. M. Martins
1,2,
Ana L. Silva
1,
Luís Pleno de Gouveia
3,
Ihsan Çaha
2,
Oleksandr Bondarchuk
2,
Alec P. LaGrow
2,
Francis Leonard Deepak
2 and
João A. V. Prior
1,*
1
LAQV, REQUIMTE, Laboratory of Applied Chemistry, Department of Chemical Sciences, Faculty of Pharmacy, University of Porto, Rua de Jorge Viterbo Ferreira, nº 228, 4050-313 Porto, Portugal
2
International Iberian Nanotechnology Laboratory, 4715-330 Braga, Portugal
3
Pharmacological and Regulatory Sciences Group (PharmaRegSci), Research Institute for Medicines (iMed.ULisboa), Faculdade de Farmácia, Universidade de Lisboa, 1649-003 Lisbon, Portugal
*
Author to whom correspondence should be addressed.
Chemosensors 2024, 12(4), 70; https://doi.org/10.3390/chemosensors12040070
Submission received: 12 March 2024 / Revised: 15 April 2024 / Accepted: 16 April 2024 / Published: 21 April 2024
(This article belongs to the Section Optical Chemical Sensors)

Abstract

:
Quantum dots (QDs) are semiconductor materials, with a size range between 1–10 nm, showcasing unique size-dependent physical and chemical properties. Such properties have potentiated their use in areas like medical imaging and biosensing. Herein, we present an open-air approach for synthesis of QDs, reducing the need for controllable atmospheric conditions. Furthermore, we present a predictive mathematical model for maximum emission wavelength (λmax) control. Through a straightforward microwave-based aqueous synthesis of TGA-CdTe QDs, we investigated the influence of time, temperature, and Te:Cd and TGA:Cd molar ratios on λmax, using a chemometric experimental design approach. CdTe-QDs were characterized by UV-Vis and fluorescence spectroscopies. Additionally, Fourier-Transform Infrared spectroscopy, X-ray photoelectron spectroscopy, Transmission Electron Microscopy, and Energy Dispersive X-ray were conducted. Stable QDs with fluorescence ranging from green to red (527.6 nm to 629.2 nm) were obtained. A statistical analysis of the results revealed that time and temperature were the most significant factors influencing λmax. After fine-tuning the variables, a mathematical model with 97.7% of prediction accurately forecasted experimental conditions for synthesizing TGA-CdTe QDs at predefined λmax. Stability tests demonstrated that the QDs retained their optical characteristics for over a month at 4 °C, facilitating diverse applications.

1. Introduction

Quantum dots (QDs) are semiconductor materials, with a size range between 1–10 nm, that exhibit unique size-dependent physical and chemical properties [1], such as excellent photostability, a large Stokes shift related to their broad absorption spectrum, and a narrow and symmetric fluorescence emission peak [2]. In fact, the ability to fine tune the QD emission wavelength over almost the entire visible spectrum make them ideal substitutes for conventional organic fluorophores [3,4]. They can be synthesized under different conditions to achieve a range of maximum emission fluorescence wavelengths, and this tunability, in simpler terms, allows for the creation of QDs with different fluorescent colors. The ability to tune these colors by manipulating the synthesis conditions is a significant advantage, as it allows for precise control over the color of the fluorescence, determined by the maximum emission fluorescence wavelength. Sensing performance and mechanism strongly depend on the careful selection of the emission wavelength [5]. In biosensing applications, CdTe quantum dots have been employed for detecting a wide range of targets, including dopamine, propafenone, and urea, in diverse real samples such as biological fluids, human serum, and milk samples. Importantly, the sensing performance and mechanism of CdTe quantum dots depend heavily on the careful selection of their emission wavelength [6]. Similarly, in chemosensing applications, QDs can be functionalized with a molecule that binds to a target chemical. The binding of the target chemical to the QD causes a change in the QD’s fluorescence [7]. Due to these excellent optical properties, in recent decades, their use has grown in several areas, namely in medical imaging, biosensing [8], and electronics (solar cells, transistors, LEDs) [9]. Quantum dots are formed by a core, which can be coated with a shell, and they are generally made of elements from groups IIB-VIB, IIIB-VB, and IVB-VIB of the periodic table [10]. The inorganic core is fundamental for the optical properties of the nanocrystals, and the shell, composed of the capping agents, is important to stabilize the core and enhance the quantum yield. The core size of QDs is smaller than the Bohr radius of the constituent materials, leading to the occurrence of the quantum confinement effect. Due to this effect, it is possible to modulate the fluorescence emission, depending directly on the particle size, as well as the composition of the QDs, both core and capping. The lower the diameter of the QD, the greater the value energy of its band gap and, therefore, the shorter the emission wavelength of fluorescence [11,12]. The capping agent, commonly called the stabilizing agent, also increases the stability and the solubility of QDs and allows for control of the size distribution of the nanocrystals and their morphology. In addition, these capping agents avoid the agglomeration of quantum dots during and after their synthesis [13]. Capping agents with thiol functional groups, such as thioglycolic acid (TGA), are widely used in the aqueous synthesis of quantum dots and can markedly increase the intensity of their fluorescence emission due to the formation of a covalent bond between sulfur (the donor atom) and incompletely coordinated Cd2+ ions on the surface of the QDs [14]. Cadmium telluride (CdTe) QDs are the most commonly used due to their small size and ease of acquisition from several direct aqueous synthesis approaches [15]. These nanocrystals can be prepared through different methods, namely top-down and bottom-up approaches. Nowadays, there is a concern about finding greener chemical schemes to synthesize them [16]. The microwave dielectric heating method has begun to be frequently used as an alternative to typical hydrothermal approaches, such as, for example, synthesis in a three-neck round-bottom glass flask with conventional heating [17]. This method is less time-consuming, and it allows a better size control and increases the synthesis product yield [18]. The production of CdTe QDs coated by thiol capping agents was described in the literature, namely mercaptosuccinic acid [19] or mercaptoundecanoic acid [20], and produced by different hydrothermal approaches, such as the work reported by He et al. [21]. Nevertheless, reports about nanomaterials’ synthesis through microwave dielectric heating have also been published, like the TGA-capped CdTe QDs produced by Ding et al. [22] under a nitrogen atmosphere, where the authors studied the influence of parameters like temperature, reaction time, and chemical ratios. The obtained quantum dots were spherical with a size range between 3 and 5 nm. More reports about the optimization of the CdTe QDs synthesis can be found in the literature, where the influence of several parameters is studied. However, there is a lack of simple open-air procedures and size control, and an absence of λmax control, which makes the scaling-up procedure difficult and makes them uninteresting to biomedical applications, namely in biosensing and/or bioimaging, in which the size and the fluorescence color are essential characteristics. The usage of experimental design and multivariate analysis allows the study of different parameters at the same time, reducing the costs associated with the synthesis procedures, and also the study of different interactions between the same parameters, which is not possible through univariate analysis. Also, experimental design gives us a predictive mathematical model to determine certain experimental conditions in order to produce a specific quantum dot. Therefore, in this study, a simple and straightforward method to synthesize CdTe QDs capped with TGA was used, in open-air conditions, under microwave irradiation. Based on our understanding, there is no existing literature that focuses on the creation of a mathematical model for the precise control of the maximum emission fluorescence wavelength of TGA-capped CdTe quantum dots when synthesized by microwave radiation. The use of microwave radiation, as an alternative to the conventional hydrothermal synthetic procedures, can be a valuable non-classical energy source since it allows homogeneous heating of the solution in a shorter time. The synthesis optimization was conducted by design of experiments and multivariate analysis, and four distinct factors, namely time, temperature, tellurium/cadmium ratio (Te:Cd), and TGA/cadmium ratio (TGA:Cd), were studied with the aim of evaluating their influence on QDs synthesis and how they affect the fluorescence maximum emission wavelength (λ
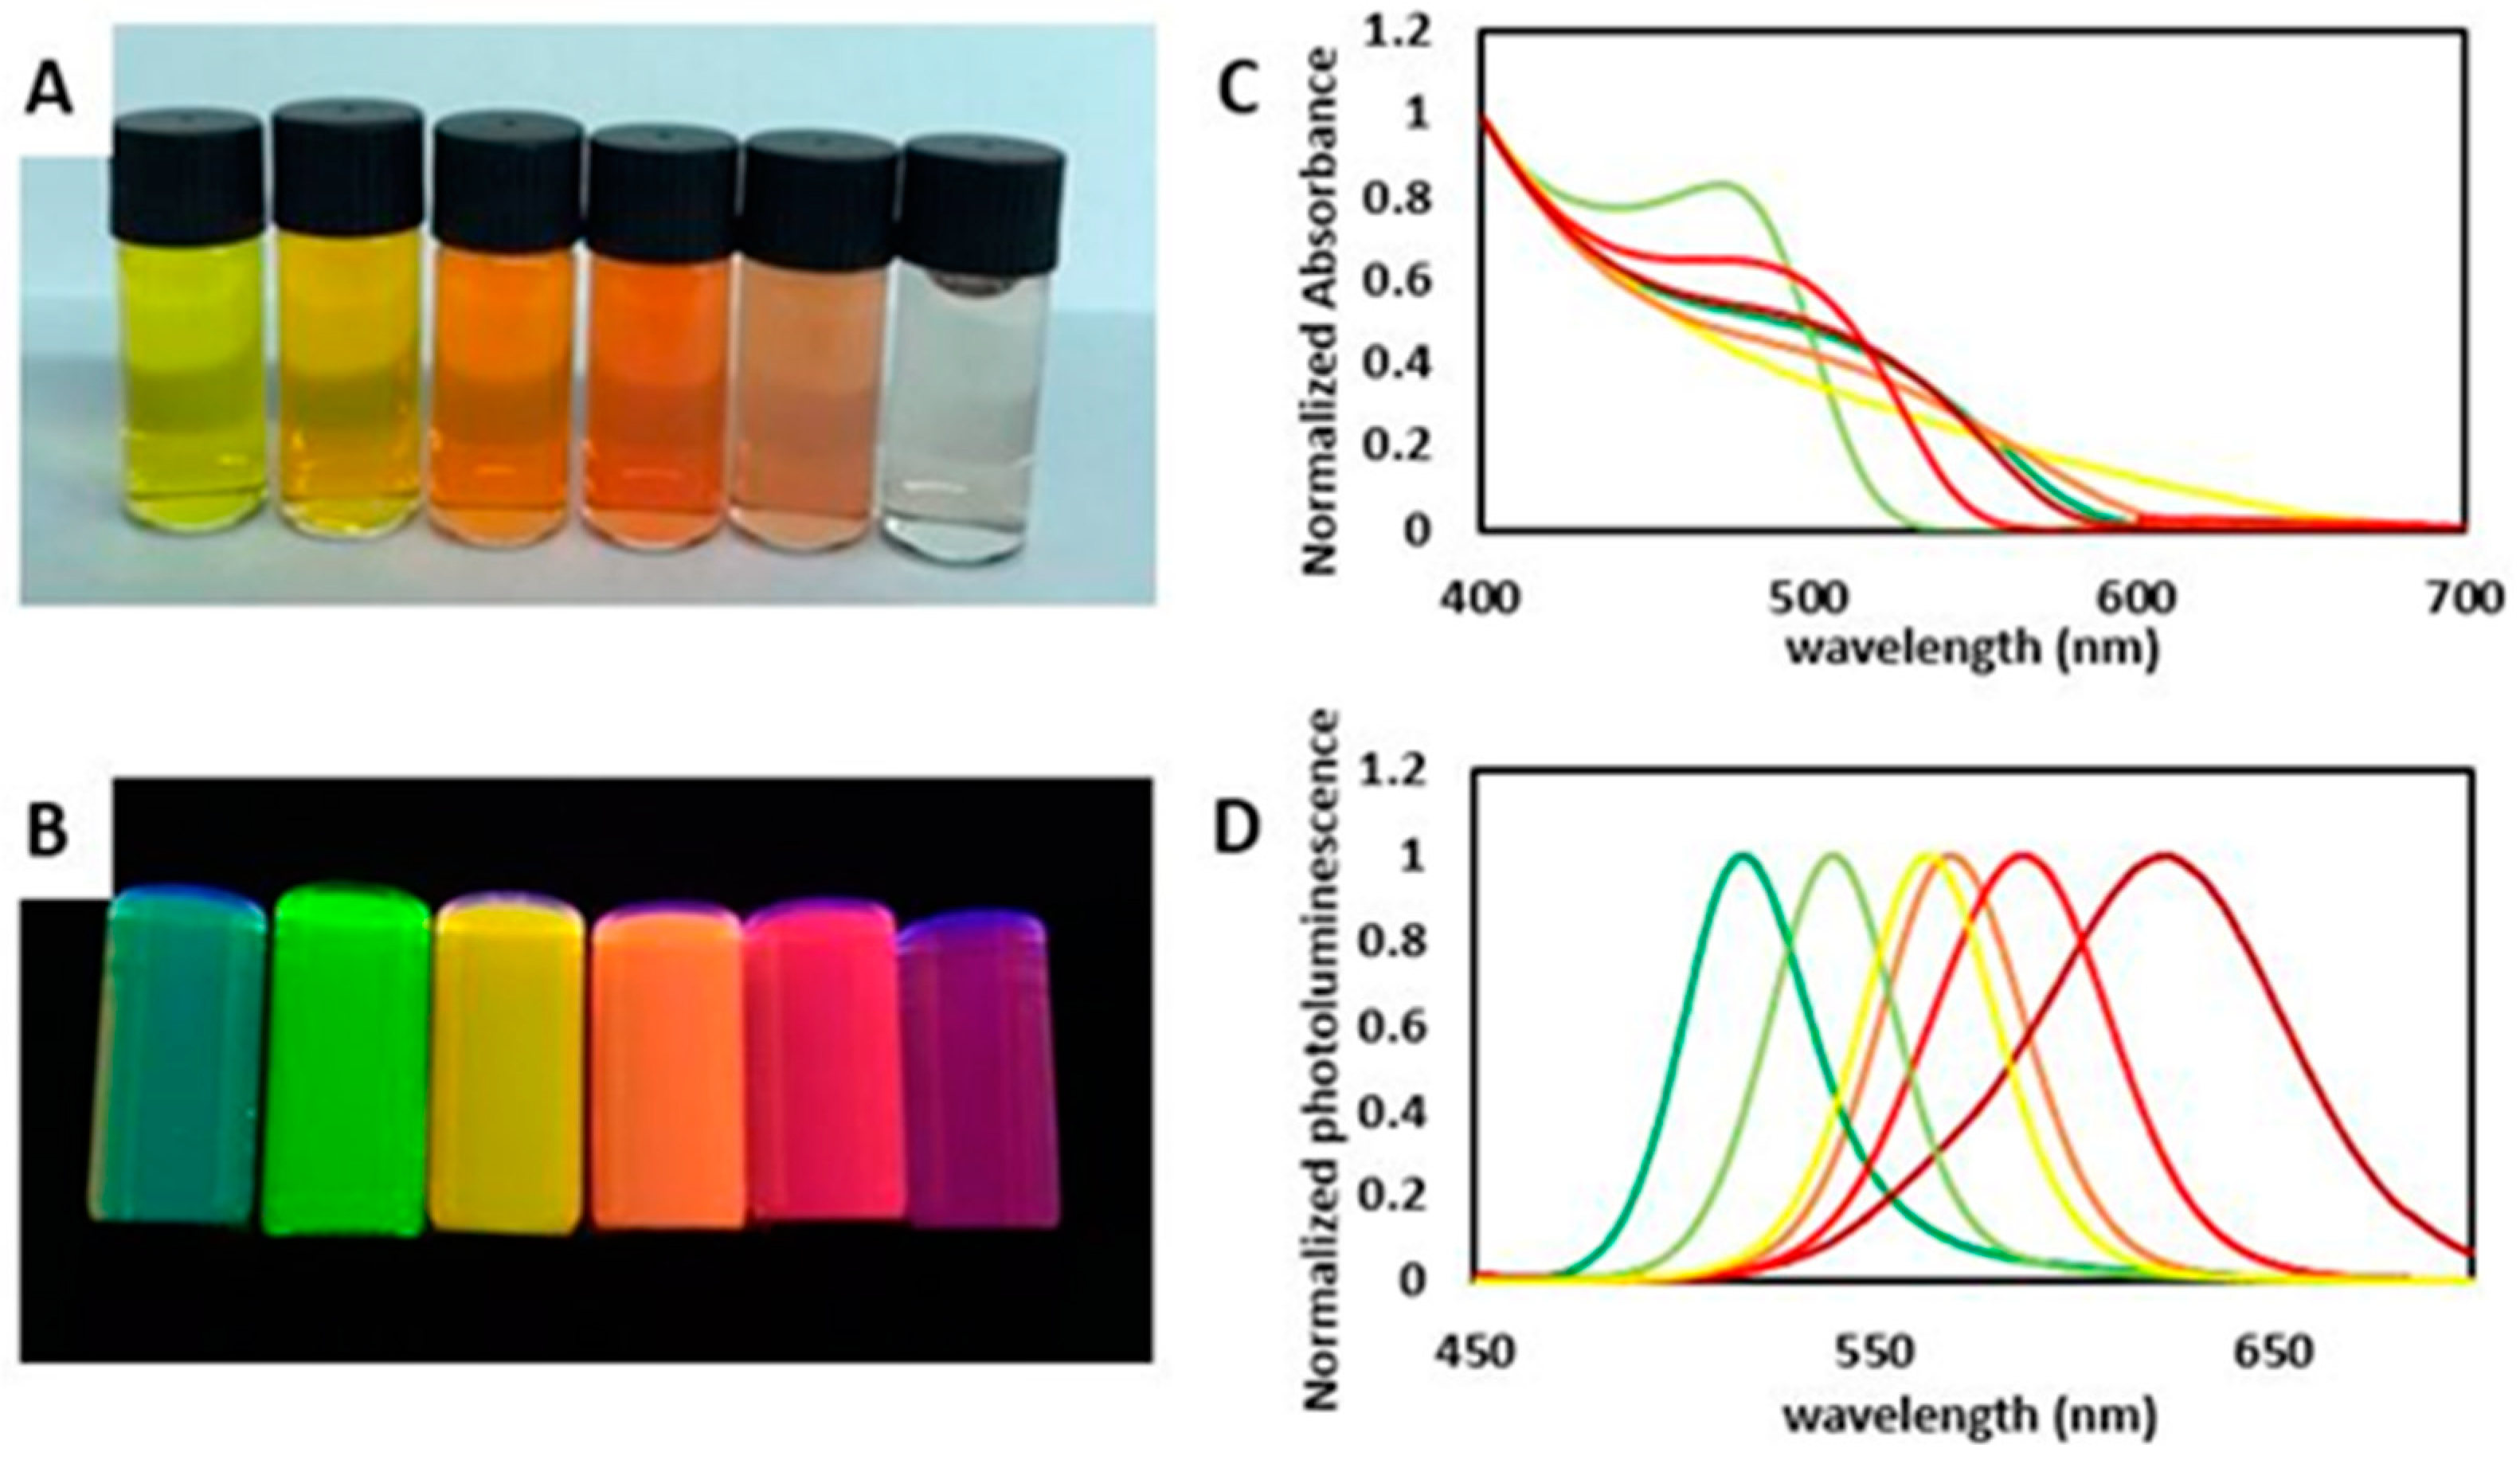
max). The developed approach allowed the production of TGA-capped CdTe QDs with different fluorescence wavelengths and colors, from green to dark red, corresponding to different sizes (~2–5 nm). A mathematical model was adjusted to the obtained results, which enabled us to predict the maximum emission fluorescence wavelength of as-synthesized TGA-capped CdTe quantum dots, considering specific synthesis parameters. This mathematical model was then utilized to determine the necessary synthesis conditions to produce QDs with predetermined maximum emission fluorescence wavelengths. Subsequently, we performed a comprehensive validation by synthesizing QDs aimed at achieving predetermined wavelengths. The long-term stability of the as-synthesized QDs was evaluated to assure their usage weeks after synthesis in diverse applications.

2. Materials and Methods

2.1. Reagents and Equipment

Stock solutions of 0.1 mol L−1 of cadmium chloride (CdCl2, 99.99%, Sigma-Aldrich, St. Louis, MO, USA), 0.1 mol L−1 of citrate (Na3C6H5O7.2H2O, tri-sodium citrate dihydrate, Merck, Darmstadt, Germany), and 0.05 mol L−1 of sodium tellurite (Na2TeO3, 99%, ≈100 mesh, Sigma-Aldrich, St. Louis, MO, USA) were prepared. All stock solutions were prepared daily, using ultra-pure water extracted from a water purification system (Heal Force, model Easy, producing water of ASTM Type I and conductivity ≤ 0.1 μs cm−1), and protected from light. Thioglycolic acid (TGA) (99%, Sigma-Aldrich, St. Louis, MO, USA) was used as capping agent, sodium borohydride (NaBH4, ReagentPlus®, 99%, Sigma-Aldrich, St. Louis, MO, USA) was used to reduce the tellurium precursor, and to adjust the pH, 1 mol L−1 or 0.5 mol L−1 sodium hydroxide solution (NaOH, VWR Chemicals, Leuven, Belgium) and 0.5 mol L−1 chloridric acid solution (HCl, Sigma-Aldrich, St. Louis, MO, USA) were used. The production of the CdTe QDs was performed in a microwave synthesizer operating with the SynergyTM software v1.58 (CEM Discover SP®, Matthews, NC, USA). The characterization measurements of QDs were conducted on a Jasco UV-Vis Spectrophotometer V-660 (Easton, MD, USA), in the range 400–700 nm, with 1 cm of optical path length. CdTe QDs were analyzed with dilution values being adjusted for each synthesis. The goal was to establish an absorbance value below 0.10 a.u. and a total volume of 1 mL. In addition, the fluorescence measurements were conducted on a Jasco FP-6500 spectrofluorometer (Jasco Inc, Tokyo, Japan), with the excitation wavelength fixed at 480 nm. The dilutions established during UV-Vis analysis were the ones analyzed in the fluorimeter. The maximum emission wavelength of fluorescence was registered for each sample. The relative quantum yield was calculated using the rhodamine 6G (Sigma-Aldrich, St. Louis, MO, USA) standard method by single point. A JEOL JEM 2100 model transmission electron microscopy (TEM) and FEI Titan ChemiSTEM equipped with a Cs probe corrector and a SuperX EDX system, operated to 200 kV, were used for morphological, structural, and chemical analysis. For the sample preparation, droplets of water dispersion of QDs were placed on the surface of a 200-mesh copper grid (Ted Pella, Inc.; Redding, CA, USA) and allowed to dry. Chemical characterization by Fourier-transform infrared spectroscopy (FT-IR) was performed on a Frontier TM (PerkinElmer; Fairfield, CA, USA) apparatus, equipped with a horizontal attenuated total reflectance (ATR) sampling accessory with a diamond crystal. The spectra were recorded between 4000 and 600 cm−1, with a resolution of 4 cm−1. The sample was placed in a polyethylene sheet (International Crystal Laboratories; Garfield, NJ, USA) and dried in oven at 40 °C for 24 h. The surface chemical composition was conducted on an X-ray photoelectron spectroscopy (XPS) instrument (XPS, ESCALAB 250XI, Thermo Fisher Scientific, Waltham, MA, USA) using Al Kα X-rays (1486.6 eV) and a 650 μm spot size under a base pressure lower than 10–10 mbar. The acquired data were analyzed using the Thermo Scientific Avantage software, which utilized a Voight function with a Smart background mode for fitting. The data analysis and processing were performed using Microsoft Excel 365 (Microsoft, BA). The model fitting procedure and model statistical analysis was performed using the MODDE v.11 software (Umeå, Sweden). Image data were processed and analyzed through ImageJ software (Bethesda, MD, USA).

2.2. Design Experiments

The microwave-based synthesis of TGA-capped CdTe QDs was investigated and optimized by means of Design of Experiments (DoE) models and multivariate analysis. Experimental design is a detailed experimental plan created to obtain the maximum amount of information with the minimum number of experiments. It provides a complete study and analysis of multiple variables in the study and their interactions at the same time by means of statistical approaches [23]. The goal was to optimize the efficiency of the experiments and ensure that the results obtained were statistically significant and reliable. The DOE and multivariate analysis are formidable tools within the realm of green chemistry, offering significant potential for optimizing synthesis and production processes, playing a pivotal role in rendering these processes not only more efficient but also considerably less detrimental to the environment. Through the systematic variation and meticulous analysis of multiple factors in the synthesis of thioglycolic acid-capped quantum dots, these techniques proved invaluable in discerning the precise conditions that yield the highest properties of interest of the produced nanomaterials while generating the least waste or consuming the lowest amount of energy and reagents. Such insights contribute significantly to the overarching objective of cultivating more sustainable chemical processes, a fundamental tenet of green chemistry that seamlessly aligns with the global sustainability goals set forth by the World Health Organization (WHO). The optimization of the synthesis was carried out aiming at the control of maximum emission wavelength while monitoring the produced nanomaterials by UV-Vis and fluorescence spectrophotometry. A Central Composite Design comprising the 4 factors (time, temperature, Te:Cd ratio, TGA:Cd molar ratios) was used to assess the statistical significance of the effect of each independent variable on the synthesis, as well of their potential interactions. A complete set of 34 experimental runs, herein named design of experiments (DoE), was conducted based on a preliminary set of conditions and divided to be executed in five days of experiments, as indicated in Table 1. This included 10 replicates of the center point, performed in duplicate in each of the 5 days of experiments. The response used in all experimental designs was the maximum emission wavelength of the as-synthesized QDs. Unless otherwise stated, the α-level was set to 0.05. The statistical significance for the effects was set to an α = 0.10 in order to increase the statistical power.

2.3. Synthesis of CdTe QDs

The QDs synthesis was employed according to the following procedure, and aiming for a final volume of 25 mL, for each synthesis. Briefly, ultra-pure water was added to a beaker and maintained under stirring. A volume of 2.500 mL of CdCl2 stock solution was added, followed by the same volume of citrate stock solution. The amount of Cd was maintained in all synthesis. Next, variable volumes of TGA were added accordingly with the desired TGA:Cd molar ratio. Considering that the second pKa of thioglycolic acid is 9.3, the pH value was adjusted to higher value, approximately 10.9 with 1 mol L−1 or 0.5 mol L−1 NaOH. Then, the required volume of Na2TeO3 stock solution was added, taking into account the desired Te:Cd molar ratio, and the resulting solution was poured into a new beaker with previously weighed NaBH4. The pH was again adjusted to 10.9 with 0.5 mol L−1 HCl and the resulting solution was poured into a reaction vessel to undergo microwave heating. The microwave conditions were adjusted to 200 W of power. The time and temperature were adjusted according to the experiments. The quantities of each of the above-described reagent were varied according to each synthesis of the studied DoE (Table 2). For the characterization measurements, precipitation of QDs with 2-propanol was applied, followed by centrifugation at 5000 RPM for 15 min. The supernatant was discarded, and the pellet was resuspended in ultra-pure water.

2.4. Characterization of CdTe QDs

The optical characterization of QDs was performed by UV-Vis and fluorescence spectroscopy, and the CdTe QDs size (D) was estimated through Equation (1) [24] and also confirmed by TEM.
D = (9.8127 × 10−73 − (1.7147 × 10⁻³² + (1.0064)λ − (194.84)
The relative quantum yield was calculated using the method described in the literature [25]. The surface chemical composition and the elemental states were assessed by XPS and compared with EDX analysis. FT-IR spectroscopy was executed to verify the TGA capping at the QDs’ surface. The crystal structure was evaluated through selected area electron diffraction (SAED) and fast Fourier-transform (FFT) patterns.

3. Results and Discussion

3.1. Synthesis of CdTe QDs

The formation of TGA-capped QDs was based on the reduction of the tellurium precursor by NaBH4, leading to the formation of Te2−, which then reacted with Cd2+ in the presence of the capping agent to stabilize the nanocrystal. The chemical reactions that occur during the successive additions of the reagents are translated into the following equations:
Cd2+ + TGA − SH ⟶ Cd − (S − TGA) + 2H+
3BH4 + 4TeO32− ⟶ 4Te2− + 3BO2 + 2H2
Cd − (S − TGA) + Te2− ⟶ CdTe − (S − TGA)
Citrate was used to avoid the formation and deposition of cadmium tellurite (CdTeO3) in the solution. Also, besides acting like a capping agent, TGA has the same function of citrate, protecting the oxidation of Cd2+ ions present in the aqueous solution, which would form complexes of Cd(OH)2, and later, Cd(TeO3). On the other hand, excess NaBH4, in addition to reducing the Te4+ ion to Te2−, avoids the need to use an inert environment, such as a nitrogen atmosphere, during the synthesis. As this reagent is a strong reductant, it creates a protection that prevents the oxidation of Te2− ions during the growth of QDs [26,27].

Preliminary Assays

As already described in the subsection Materials and Methods, the synthesis of TGA-capped CdTe QDs was supported by sequential addition of pre-determined volumes of cadmium, citrate, and tellurium stock solutions, TGA, NaBH4, and correction of pH. Nevertheless, some preliminary assays regarding the time in which the pH was corrected revealed different obtained suspensions of QDs. Thus, three different methods were tested: method A, B, and C. The main difference between them is regarding the occasion of pH adjustment. In method A, the pH was adjusted after the addition of the TGA; in method B, the pH was adjusted only at the end of the addition of all reagents, before the solution has been placed in the microwave; and in the last one, method C, the pH was adjusted twice: after the addition of TGA and before going to the microwave. Furthermore, preliminary assays regarding the preparation of a stock solution of tellurium were performed to evaluate whether the resulting QDs’ suspensions kept the λmax and quantum yield (QY) of the suspensions prepared with the reagents weighed out onto filter paper, weighed separately for each run. As a result of these first assays, the λmax and the QY were similar to the previous ones prepared, where each reagent was weighed separately for each run. Thus, the preparation of stock solutions seems to facilitate the synthesis method. All the resultant suspensions were analyzed by UV-Vis and Fluorescence spectrometry, as well as the estimation of the relative QY, and the sequence of reagent addition proved to be crucial for the synthesis (Table 3). Method C was chosen as the best sequential order since it allowed us to obtain more-homogeneous QDs suspensions and higher QY. The λmax was similar to the QDs obtained by method A, though method B was the one in which the λmax was more than 10% less.

3.2. Characterization of QDs

Characterization of CdTe quantum dots can be achieved through a variety of techniques. Each of these techniques provides different information about the quantum dots, and it is an important step in understanding their properties and optimizing their use. UV-Vis and fluorescence spectroscopies were used to assess the optical properties, FT-IR spectroscopy was employed to confirm the capping of TGA attached at QDs’ surface, the particle size distribution and the core’s size were achieved through TEM, the elemental composition were evaluated by EDX and XPS analysis, and the crystalline structure of the CdTe core was confirmed by SAED and FFT analysis. A synthesis corresponding to the central point of the DoE (as shown in Table 1) was chosen to represent the synthesis of QDs. All characterizations in this section were based on this particular synthesis. Figure 1 compiles the UV-Vis, fluorescence, and FT-IR spectra.
Regarding the profile of the absorption spectrum (Figure 1A, curve I), the as-synthesized QDs exhibited a broad absorption band, while the emission spectrum (Figure 1A, curve II) showed a narrow emission band with a maximum wavelength at ≈567 nm, like the ones found in the literature for the CdTe QDs [28,29]. The visual aspect of the QDs’ suspensions is represented in Figure 1B. The image on the left shows the suspension under visible light and the image on the right shows the suspension under UV light. The FT-IR spectrum of CdTe QDs (Figure 1C) presents a peak at 1540 cm−1 that corresponds to the asymmetric COO- stretching vibration, and another at 1364 cm−1 that corresponds to the symmetric COO- vibration, confirming the presence of TGA, since according to the literature [30,31]; the C = O and S-H stretching vibrations are typical of the FT-IR spectrum of TGA. However, we cannot observe the typical S-H vibration in the 2550–2600 cm−1 region, expected for thiols, because of the passivation of the surface of the CdTe QDs, in which the cadmium ions complex with the thiol functional group from TGA [32,33]. An intense peak between 3100–3600 cm−1 is related to O-H vibrations due to the presence of water. At 2848 and 2912 cm−1, there are two intense peaks that are a feature of the background because of the polyethylene sheet in which the sample was placed. Figure 2A depicts a high-resolution TEM image, and the inset shows a zoom-in of a single particle. The TEM analysis revealed a spherical shape and a narrow size distribution, with an average particle size (Figure 2C) of 3.26 ± 0.55 nm, which is in agreement with the determination of the nanocrystal size according to Equation (1) (3.40 ± 0.03 nm). The FFT pattern (Figure 2B) of the single particle represented in the inset of Figure 2A proves the nanocrystalline nature of QDs with diffraction spots corresponding to (2 2 0) and (4 0 0) lattice planes of the cubic CdTe. High-angle annular dark-field scanning transmission electron microscopy (HAADF-STEM) images at low and high magnification are presented in Figure 2D and Figure 2E, respectively. In Figure 2E, it is possible to observe the atomic resolution of CdTe quantum dots, as well as confirm the spherical-shaped particles. A typical SAED pattern from CdTe QDs is shown in Figure 2F, displaying three distinct diffractive rings that corresponded closely with the (1 1 1), (2 2 0), and (3 1 1) reflections of the cubic structure.
In order to confirm the presence of cadmium and tellurium in the as-synthesized nanocrystals, EDX analysis was performed (Figure 3). The EDX spectrum shows the expected presence of Cd and Te with the signals at 3.2 keV for cadmium and at 3.8 keV for tellurium. These values are consistent with the values reported in the literature [30,31]. The atomic composition (at. %) was estimated and the obtained values were 48.6% to Cadmium and 51.4% to Tellurium, corresponding to a ratio of 1:1 Cd:Te. Also, due to the composition of the TEM grid, some copper and carbon signals were detected.
X-ray photoelectron spectroscopy (XPS) was used to investigate the surface composition and elemental states of TGA-capped CdTe QDs. The Cd3d, Te3d, and S2p lines were the focus of this study in order to confirm the production of CdTe QDs coated with thioglycolic acid. To compensate the charge accumulation during the XPS spectra acquisition ion- and electron-flood guns were deployed. The XPS peaks binding energies we referenced to the adventitious C1s peak at 284.8 eV–the main peak in the deconvoluted C1s spectra were used. Figure 4 shows the XPS survey from the as-synthesized QDs. The presence of cadmium species was confirmed by the peaks at 405.2 and 411.93 eV, which are related to Cd3d5/2 and Cd3d3/2, respectively. These Cd3d spectral lines show a slight chemical shift, compared to the theoretical value of 405.1 eV, due to the possible production of an oxide. On the other hand, for tellurium species (Te3d lines), we can easily distinguish at least two oxidation states. The peak at 572.29 eV is attributed to Te3d5/2 from CdTe, and the peak at 575.91 eV is ascribed to Te3d5/2 from TeO2. This could be a result of a partial oxidation of the QDs’ surface.
Furthermore, we can detect the presence of sulfur in the spectra, related to the capping agent used to stabilize the core of quantum dots. The peaks observed between 162.12 and 163.87 eV correspond to the S2p level, corroborating the existence of thiol capping around the quantum dots core. The obtained results are in agreement to the ones presented in the literature for thiol-capped CdTe QDs [31,32].

3.3. Optimization of TGA-Capped CdTe QDs

As previously mentioned, the DoE was focused on the study of the influence of the synthesis parameters on the maximum fluorescence emission wavelength (λmax) of the quantum dots. The knowledge of the influence of time, temperature, and ratios of TGA:Cd and Te:Cd would allow us to prepare QDs with a pre-chosen fluorescence λmax. The analysis of the DoE results (Table 4) revealed that different sets of synthesis conditions produced different λmax ranges of the obtained suspensions, corresponding to distinct fluorescent colors.
A complete surface response model (linear model of four factors plus interactions and quadratic terms, named quadratic model) represented in Table 4 was fitted to the data resulting from the CCD. The overview of the statistical suitability and validity of the model is presented in Figure 5. The blue squares on Figure 5A correspond to the replicate synthesis carried on five different days. Their closeness/overlap indicates a low variability, showing a good reproducibility and high precision, and consequently good/acceptable confidence in the overall results. The quadratic model fit shows a very good squared correlation coefficient (R2) (Figure 5B, 0.9968, green bar) as well as a good prediction ability Q2 (Figure 5B, 0.9826, blue bar). It also shows a very good precision (Figure 5B, rsd = 1.078, cyan bar), but the reported model validity is low (Figure 5B, yellow bar). This may be due to the very low variability observed between replicate experiments and the observation number 25 (R25) being poorly predicted (Figure 5C). The studentized residual number 25 is large due to the low experimental variability and not to the inability of the model to describe the experimental results. This claim is supported by the small absolute residual (3.1 nm) and the high values for both R2 and Q2. The difference between the observed and predicted λmax values, 568.0 and 571.1 nm, respectively, is quite acceptable (≈3 nm) and therefore the reported low model validity is a statistical artifact and not a true issue that could compromise the model analysis and the importance of the factors on the λmax. The influence of each variable on the λmax variation can be seen in Figure 5D.
The model fulfils the requirements in terms of description ability, prediction ability, and precision and is therefore acceptable. Nevertheless, in order to fine-tune the fit of the model, a simplification of the mathematical model, whenever feasible, is always desirable. The model described above (designated hereafter as the “complete model”) contained quadratic parameters whose contribution in explaining the observed variation was quite small, although significant, from a statistical viewpoint, and as such, most of the quadratic model parameters and term interactions were removed (designated hereafter as the “simplified model”). In this simplified model, only the four factors and the temperature squared parameter were kept, meaning a change from a 15- to 6-term model with a loss of only 1.1% in the explained variation (R2: 0.9968 to 0.9855). The fits (complete and simplified models) are summarized below in Table 5 and the final model parameters statistics are summarized in Table 6.
This way, a simplified mathematical model, statistically described in Table 5, equally shows a good fit, since R2 is 0.9855 and the adjusted R2 is 0.9829 in the same inference design range of the complete model (λmax between 527.6–629.2 nm). The verified significance of the model’s lack of fit is due to the very low experimental variability; however, the results obtained are in agreement with those predicted. Also, regardless of the chosen model, the influence of the factors on the λmax remains unchanged, with the temperature and time as the most influential factors, while the molar ratios TGA:Cd and Te:Cd do not exhibit an accentuated influence on λmax. Thus, given the simplified model’s validity (Table 5), an equation for the prediction of λmax (Equation (5)) was obtained using each variable’s coefficients. The model kept for future use was therefore the simplest one since it shows an acceptable fit; refer to the ANOVA in Table 6.
So, the linear model of four variables is defined by Equation (5), where Xvariable is the coded value (−1 to 1) for the variable or squared term:
Y = 567.49 + 5.883Xtime + 25.20Xtemperature + 1.650XTe:Cd − 5.217XTGA:Cd + 2.988Xtemp2
The resultant response surface plot from DoE is depicted in Figure 6. Overall, the surface charts show that the physical variables (time and temperature) showed a much larger impact on the response when compared with the chemical variables (Te:Cd and TGA:Cd ratios). Additionally, as can be seen, the λmax response function increased with the temperature and/or time for the studied inference space, ranging between 527.6 and 629.2 nm. In fact, the minimum λmax response was obtained for 90 °C, and the maximum λmax response was obtained using 130 °C, fixing the reaction time at 15 min, and with the Te:Cd and TGA:Cd ratios at 0.20 and 1.00, respectively. Regarding the time and TGA:Cd ratio, an opposite effect of similar magnitudes was observed between these, that is, higher λmax was obtained when using higher reaction times and lower TGA:Cd ratios.

3.4. Validation of the Design Model

In order to use the mathematical model of Equation (5) to provide the possible factors’ combinations to achieve a pre-chosen λmax, and considering the previous results, the simplified model fitted to the DoE requires the verification and assessment of its validity, comprising also other possible uncontrolled sources of variation derived from the experimental procedures. The inverse function of the surfaces with some additional conditions will allow the estimation of the independent variables combination that originates with QDs showing a predefined emission wavelength (λmax), as represented by the following Equations (6) and (7), in which X1 = time, X2 = temperature, X3 = Te:Cd, and X4 = TGA:Cd molar ratio.
λi = f(X1,i,X2,i,X3,i,X4,i)λ,
X1,i = f1(λi,X2,i,X3,i,X4,i),
where, as the function f is univocal, it is not biunivocal, that is, to each combination of the factors, there is only a single wavelength, but each possible wavelength may be obtained by using more than one combination of the factors. As such, the inverse function f−1 is not univocal and there is a need to include additional rules or conditions in order to ensure a suitable logical sequence of factor combinations. It should be noted that due to the experimental design combinations (Central Composite Design, CCD), no experiments were performed at extreme (low or high) values for more than one factor simultaneously. Thus, a set of experiments, named validation experiments (VE), was executed in order to confirm the range of λmax that could be obtained within the tested domain of the variables, as well as the impact of each variable. The model validity and accuracy were assessed by comparing the predicted results with those obtained after conducting the assays. The prediction of the experimental conditions that originate a specific response, λmax, was evaluated by choosing a set of values for the four independent variables provided by the simplified model obtained from the experimental design used in the synthesis’ optimization (Equation (4)). As already mentioned, the criteria for the assays were to choose combinations that resulted in the desired emission maximum wavelengths but that also presented a monotone variation. This can be achieved by optimizing the first derivative of the parameter (in order to λmax) instead of the parameter itself. Additionally, the factors’ combinations should not heavily deviate from the actual experiments of the experimental design to reduce the potential inaccuracy of the model due to extrapolation. This requirement derives from the fact that no experiments were performed using combinations of two or more factors simultaneously at absolute levels larger than 1 (coded value in DoE). The absolute level 2 for each factor was explored but with the remaining factors kept at level 0. To ensure the compliance with the above-mentioned conditions, in particular the monotonicity of the variation of the four factors, the values for each factor were defined by a first-degree linear function. Figure 7 represents the variation of predicted λmax as function of the coded variables (in the range [−1, +1]).
The linear coefficient (bi in Equation (8)) of these functions should be as large as possible to maximize the variation of the factors, covering the range of the DoE.
Zi = ai + biXi
The values for the four factors were simultaneously optimized by non-linear optimization (Microsoft Excel Solver add-in). Different combinations of the four variables were generated by changing the values of ai and bi (above in Equation (8)) in such a way that the predicted λmax matched the desired ones. After analysis of DoE, the resulting wavelengths ranged from 527.6 to 629.2 nm, showcasing fluorescence from green to red, respectively. With this in mind, the wavelengths chosen for the validation experiments were such as to produce QDs of each possible color (green, yellow, orange, and red). Moreover, two extra wavelengths were explored outside of the tested boundaries. As such, all four factors described above were changed linearly in such a way that the desired λmax were obtained. An additional condition was defined to obtain QDs that have a λmax as close as possible to 568.6 nm, matching the first experimental design central point combination. The experimental conditions fitting these criteria as well as the obtained results are summarized below in Table 7. The values were rounded to the closest 1 min, 1 °C, 0.01 Te:Cd and TGA:Cd ratios.
This assay was repeated thrice, on different days, and the run that corresponds to the central point (R3.VE) was repeated in the same day (R7.VE) in order to estimate the experimental reproducibility. The variation of the experimental λmax with regard to the predictions was suitably described by a straight line, without noticeable “intra-proposal” deviations, meaning that the chosen model (Equation (5)) was appropriate to the stated intent. Furthermore, the observed colors of the suspensions under visible and UV light, shown in Figure 8A and Figure 8B, respectively, are in-line with the predicted λmax ranges for each set of parameters. The QDs prepared in this set of conditions exhibited a broad absorbance spectrum (Figure 8C) and narrow emission bands as represented in the graph of Figure 8D, with maximum emission wavelengths ranging from 530 to 632 nm.
The graph in Figure 9 represents the observed results of the validation experiments plotted against their predictions.
A two-way analysis of variance (ANOVA) was conducted for the results obtained from the three days of experiments and is summarized below in Table 8.
According with the ANOVA in Table 8, and as expected after visualizing the chart in Figure 9, a significant difference between the averages of the different sets of conditions was confirmed (“Samples”, p < 0.001). Additionally, no difference in the average inter-day results was identified as significant (in Table 8, “Day”, p = 0.074). The inter-day variability is acceptable (variance s2 = 58.23; standard deviation s = 7.6 nm) and supports the claim of reproducibility. The residual (non-explained) variance (s2 = 17.85; s = 4.2 nm) is an estimate of the experimental variability and is acceptable, taking into consideration the fact that it reflects both the variability in the QD synthesis as well as the variability due to sample processing and monitorization for λmax. As seen in Figure 9, the linearity between the predicted λmax and the observed λmax is confirmed by a large R2 (0.9941), but there is a slight proportional bias in the λmax prediction. The linear regression slope of 0.9453, and the intercept of 36.39 indicates there is an under-prediction of λmax up to approximately 665 nm. The bias at the tested lowest range (529.5 nm) is 8.7 nm and 0.6 nm at the high end (636.1 nm). These values are acceptable as a small fine-tuning will correct the bias. Comparing the predicted results with the observed ones (Figure 9), the accuracy and reproducibility of the model was further confirmed, since the obtained responses for the central point conditions varied by only 0.7 nm in relation to the results of the DoE. This difference is neither statistically nor practically relevant, taking into consideration the model’s residual standard deviation of 4.2 nm which corresponds to the (observed) variation the model cannot explain (less than 1% of the total variation as seen per the SS in Table 8). Moreover, the observed values were close enough to the predicted ones to be considered adequate, complying with this work objective. Any differences observed for the other predicted λmax are expected to be a consequence of the uncertainty of the coefficients of the model, given that a systematic error should also affect the central points. On average, the differences between predicted and obtained λmax are −4.8 nm with residuals of −8.7 and +0.6 nm at the lowest and highest λ values, respectively.

3.5. Control of λmax by Temperature and Time

The previous multivariate analysis allowed the understanding that only the variables time and temperature had a significant influence on the obtained maximum emission wavelength (showing positive coefficients). Also, the TGA:Cd molar ratio had an important influence (but negative of opposite signal) while the Te:Cd molar ratio had no significant influence on λmax. Considering the accentuated influence of temperature and time on λmax, a third set of experiments was designed to verify if a similar range of λmax could be obtained upon changing only those most influential factors, while fixing the molar ratios of reagents tellurium and TGA. In this set, the values for time and temperature should not lie outside the coded range ±2 (5–25 min and 90–130 °C, respectively) if the reagents’ molar ratios are kept near the coded value of 0; otherwise, the allowed limit will narrow from ±2 to ±1. The reagents molar ratios should be fixed at a level as close to 0 as possible (corresponding to TGA:Cd ratio = 0.83 and Te:Cd ratio = 0.15). Thus, the conditions defined for these additional experiments (E1–E7) as well as the predicted and actual experimental λmax are described in Table 9. The obtained results were used to propose a new model.
The results showed good agreement with the predicted ones, with residuals of +2.1 nm and −6.6 nm at the boundaries of the tested interval. The average error was −2.4 nm and the average absolute error was 3.4 nm.
In this set of conditions, the repeatability of the method was also evaluated by reproducing the condition that corresponds to the central point of this assay (E3) at the end of the experiments (E7). The colors under visible light, as well as the fluorescence colors of each synthesis under UV light, of the as-synthesized quantum dots are demonstrated in Figure 10A and Figure 10B, respectively. Normalized absorbance and fluorescence spectra are graphically represented in Figure 10C and Figure 10D, respectively. The same conclusions as those of the validation experiment can also be drawn here, with the absorbance spectra showing wide peaks and the fluorescence spectra showing defined ones. The λmax values ranged from ≈517 to 624 nm. According to the obtained results, higher temperatures and reaction times lead to the synthesis of QDs with higher maximum emission wavelengths, and consequently, larger nanocrystals’ core sizes. The produced QDs corresponded to each desired emission wavelength and fluorescence color.
The results of DoE and validation experiments support the accuracy and precision of the proposed predictive approach, allowing the user to estimate the experimental conditions suitable to obtain QDs with the desired λmax. The values for the variables time and temperature can be estimated according to Equations (9) and (10), respectively. These equations are derived from Equation (5), while fixing the molar ratios of TGA:Cd and Te:Cd at 0.83 and 0.15, respectively.
time = −9958 + 27.56λ − 0.015λ2
temperature = −107.3 + 0.417λ − 6.51 × 10⁻⁵λ2
Since, from these assays, the quantum dots were produced with different fluorescence colors, they were used as representative for each color (green, yellow, orange, and red) and their sizes were calculated using Equation (1) and confirmed by TEM. The images, as well as the particle size distribution of each color, are compiled in Figure 11. These images are representative images. For particle size distribution measurements, we need many high-magnification TEM images in order to precisely make measurements.
Despite this, we applied a FFT filter with Gaussian blur method to make the images clearer for readers. For green QDs (Figure 11A) (λMax = 539.6 nm), the calculated diameter was 3.12 nm, and in TEM, the resultant one was 3.35 nm. For the yellow QDs (Figure 11B) (λMax = 569.6 nm), the theoretical size was 3.42 nm, and that obtained by TEM was around 3.26 nm. For the orange QDs (Figure 11C) (λMax = 587.4 nm), the formula gives a diameter of 3.56 nm, and by TEM, the mean was 3.54 nm. For the last ones, the red QDs (Figure 11D) (λMax = 612.8 nm), Peng’s equation gives 3.78 nm and the obtained diameter given by TEM was 4.17 nm.

3.6. Study of Stability over Time

The optical behavior and the stability of the QDs’ suspensions were evaluated through the analysis of λmax and relative quantum yield over five weeks while stored at 4 °C. The suspensions under study were utilized as-is, post-synthesis, with no further modifications except for the requisite dilutions carried out for measurement purposes. Some random syntheses representing each fluorescence color (green, yellow, orange, and red) were selected for the stability test, and the results of the analysis are represented in Figure 12.
Each type of QD exhibited a stable λmax, indicating no significant alteration of the fluorescence properties of QDs during the study period. Considering the five-week period, the means ± SD of the λmax were, respectively, as follows: green QDs: 514.8 ± 0.1 nm; yellow QDs: 537.8 ± 0.3 nm; orange QDs: 585.3 ± 0.5 nm; red QDs: 628.9 ± 0.5 nm. The presence of the capping agent was important for maintaining the integrity of the CdTe QDs in the aqueous solution, allowing their chemical preservation and preventing their oxidation [7]. In relation to the QY, it was observed that the red and green QDs had stable QY values during the five weeks. The yellow and orange QDs had their QYs altered, with slightly higher values. After the five-week period, the variations of the QY (mean ± SD) were, respectively, as follows: green QDs: 3.0 ± 0.4%; yellow QDs: 12.8 ± 2.8%; orange QDs: 15.3 ± 2.0%; red QDs: 0.9 ± 0.5%. The observed changes in QY for the QDs over the course of five weeks could be influenced by several factors. Over the five-week period, the yellow and orange QDs may have undergone enhanced exciton migration or energy transfer processes, which could lead to more efficient radiative recombination. If excitons migrate to neighboring QDs with better radiative recombination properties and lower nonradiative recombination rates, the overall emission efficiency of the QD system improves. Also, changes in surface properties, such as the passivation of surface defects or the removal of surface traps, could have occurred gradually over time. This would reduce nonradiative recombination and increase the quantum yield of the yellow and orange QDs. Additionally, QDs may have degraded, aggregated, or formed clusters over time, altering the photophysical properties for the yellow and orange QDs in particular. Overall, the analysis of the results showed that the QDs’ stability for over a month was excellent, which allows their storage at 4 °C and the usage of QDs later for diverse applications.

4. Conclusions

In summary, optimization of synthesis for control of the maximum emission wavelength of water-soluble TGA-capped CdTe QDs was successfully achieved. The use of precursors stock solutions and microwave radiation allowed the simple and straightforward preparation of QDs. The developed approach allowed the production of TGA-capped CdTe QDs with different fluorescence wavelengths and colors, from green to dark red, corresponding to different nanoparticle sizes. The variables reaction time, temperature, and TGA:Cd and Te:Cd molar ratios were studied, and time and temperature were shown to be the most impactful in shifting the maximum emission wavelength of the QDs. A simple mathematical model enabled us to establish an equation that allows the determination of the ideal experimental conditions to produce QDs, with an operator-defined maximum emission wavelength. This model was validated with further assays. Subsequently, a new model was proposed, involving only the manipulation of time and temperature while fixing the molar ratios of the reagents. This quite simple (only two variables) model also revealed a good precision and accuracy in relation to the pre-defined fluorescent maximum emission wavelengths. The long-term stability of the as-synthesized QDs was evaluated, and the results showed an optimal maintenance of the integrity and the optical characteristics of QDs over a month. Additionally, DOE and multivariate analysis proved to be powerful tools in the field of green chemistry. These methodologies allowed us to optimize the production of thioglycolic acid-capped CdTe QDs, making the process more efficient and less harmful for the environment, yielding less waste, and with lower energy and reagents consumption. In this manner, this work contributes to the development of more sustainable chemical processes, which is a key aspect of green chemistry and aligns with the WHO’s sustainability goals. Considering the prospects of aqueous phase-synthesized quantum dots in various application areas, for example, in biosensing and bioimaging, the control of the wavelength, and consequently the color and size, is of high interest since the nanocrystals’ optical characteristics will be fundamental for their ultimate purpose. However, concerns about biological toxicity impairs surface modifications and encapsulation before use, aiming at higher biocompatibility.

Author Contributions

Conceptualization, C.S.M.M., L.P.d.G. and J.A.V.P.; methodology, C.S.M.M., I.Ç., O.B., F.L.D. and J.A.V.P.; validation, C.S.M.M.; formal analysis, C.S.M.M., A.L.S., L.P.d.G., I.Ç., O.B., A.P.L., F.L.D. and J.A.V.P.; investigation, C.S.M.M., A.L.S., L.P.d.G., I.Ç. and O.B.; resources, A.P.L., F.L.D. and J.A.V.P.; data curation, A.L.S., L.P.d.G., I.Ç., O.B. and F.L.D.; writing—original draft preparation, C.S.M.M., L.P.d.G., A.P.L. and J.A.V.P.; writing—review and editing, C.S.M.M., A.L.S., L.P.d.G., I.Ç., O.B., A.P.L., F.L.D. and J.A.V.P.; visualization, C.S.M.M. and J.A.V.P.; supervision, A.P.L., F.L.D. and J.A.V.P.; project administration, J.A.V.P.; funding acquisition, J.A.V.P. All authors have read and agreed to the published version of the manuscript.

Funding

This work received financial support from FCT/MCTES (UIDB/50006/2020 DOI 10.54499/UIDB/50006/2020) through national funds.

Institutional Review Board Statement

Not applicable.

Informed Consent Statement

Not applicable.

Data Availability Statement

Dataset available on request from the authors.

Acknowledgments

Catarina S. M. Martins and Ana L. Silva thank FCT (Fundação para a Ciência e Tecnologia) and National Funds and ESF (European Social Fund) for financial supports, for their Ph.D. grant ref. SFRH/BD/151097/2021 and grant ref. 2021.09393.BD, respectively. This work received support and help from FCT/MCTES (LA/P/0008/2020 DOI 10.54499/LA/P/0008/2020, UIDP/50006/2020 DOI 10.54499/UIDP/50006/2020 and UIDB/50006/2020 DOI 10.54499/UIDB/50006/2020), through national funds. The authors acknowledge using the characterization facilities of the Advanced Electron Microscopy, Imaging and Spectroscopy (AEMIS) facilities of the International Iberian Nanotechnology Laboratory.

Conflicts of Interest

The authors declare no conflicts of interest.

References

  1. Frigerio, C.; Ribeiro, D.S.; Rodrigues, S.S.; Abreu, V.L.; Barbosa, J.A.; Prior, J.A.; Marques, K.L.; Santos, J.L. Application of quantum dots as analytical tools in automated chemical analysis: A review. Anal. Chim. Acta 2012, 735, 9–22. [Google Scholar] [CrossRef]
  2. Jamieson, T.; Bakhshi, R.; Petrova, D.; Pocock, R.; Imani, M.; Seifalian, A.M. Biological applications of quantum dots. Biomaterials 2007, 28, 4717–4732. [Google Scholar] [CrossRef] [PubMed]
  3. Resch-Genger, U.; Grabolle, M.; Cavaliere-Jaricot, S.; Nitschke, R.; Nann, T. Quantum dots versus organic dyes as fluorescent labels. Nat. Methods 2008, 5, 763–775. [Google Scholar] [CrossRef]
  4. Montón, H.; Nogués, C.; Rossinyol, E.; Castell, O.; Roldán, M. QDs versus Alexa: Reality of promising tools for immunocytochemistry. J. Nanobiotechnol. 2009, 7, 4. [Google Scholar] [CrossRef] [PubMed]
  5. Cardoso Dos Santos, M.; Algar, W.R.; Medintz, I.L.; Hildebrandt, N. Quantum dots for Förster Resonance Energy Transfer (FRET). TrAC Trends Anal. Chem. 2020, 125, 115819. [Google Scholar] [CrossRef]
  6. Safari, M. Recent Advances in Quantum Dots-Based Biosensors. In Quantum Dots; Thirumalai, J., Ed.; IntechOpen: Rijeka, Croatia, 2023; p. Chapter 7. [Google Scholar]
  7. Wang, Z.; Yao, B.; Xiao, Y.; Tian, X.; Wang, Y. Fluorescent Quantum Dots and Its Composites for Highly Sensitive Detection of Heavy Metal Ions and Pesticide Residues: A Review. Chemosensors 2023, 11, 405. [Google Scholar] [CrossRef]
  8. Martins, C.S.M.; LaGrow, A.P.; Prior, J.A.V. Quantum Dots for Cancer-Related miRNA Monitoring. ACS Sens. 2022, 7, 1269–1299. [Google Scholar] [CrossRef]
  9. Maxwell, T.; Nogueira Campos, M.G.; Smith, S.; Doomra, M.; Thwin, Z.; Santra, S. Quantum Dots. In Nanoparticles for Biomedical Applications; Chung, E.J., Leon, L., Rinaldi, C., Eds.; Elsevier: Amsterdam, The Netherlands, 2020; pp. 243–265. [Google Scholar]
  10. Ribeiro, D.S.; Frigerio, C.; Santos, J.L.; Prior, J.A. Photoactivation by visible light of CdTe quantum dots for inline generation of reactive oxygen species in an automated multipumping flow system. Anal. Chim. Acta 2012, 735, 69–75. [Google Scholar] [CrossRef]
  11. Smith, A.M.; Nie, S. Semiconductor nanocrystals: Structure, properties, and band gap engineering. Acc. Chem. Res. 2010, 43, 190–200. [Google Scholar] [CrossRef] [PubMed]
  12. Neikov, O.D.; Yefimov, N.A. Nanopowders. In Handbook of Non-Ferrous Metal Powders; Neikov, O.D., Naboychenko, S.S., Yefimov, N.A., Eds.; Elsevier: Oxford, UK, 2019; pp. 271–311. [Google Scholar]
  13. Donegan, J.; Rakovich, Y. Cadmium Telluride Quantum Dots, 1st ed.; Jenny Stanford Publishing: New York, NY, USA, 2016; p. 248. [Google Scholar]
  14. Rodrigues, S.S.; Ribeiro, D.S.; Molina-Garcia, L.; Ruiz Medina, A.; Prior, J.A.; Santos, J.L. Fluorescence enhancement of CdTe MPA-capped quantum dots by glutathione for hydrogen peroxide determination. Talanta 2014, 122, 157–165. [Google Scholar] [CrossRef]
  15. Anthony Le Cigne, A.S.; Nabiev, I. Biological Applications of Cadmium Telluride Semiconductor Quantum Dots. In Cadmium Telluride Quantum Dots: Advances and Applications, 1st ed.; Donegan, Y.R.J., Ed.; Jenny Stanford Publishing: New York, NY, USA, 2013; pp. 173–204. [Google Scholar]
  16. Yang, W.; Li, X.; Fei, L.; Liu, W.; Liu, X.; Xu, H.; Liu, Y. A review on sustainable synthetic approaches toward photoluminescent quantum dots. Green Chem. 2022, 24, 675–700. [Google Scholar] [CrossRef]
  17. Gan, Y.X.; Jayatissa, A.H.; Yu, Z.; Chen, X.; Li, M.H. Hydrothermal Synthesis of Nanomaterials. J. Nanomater. 2020, 2020, 8917013. [Google Scholar] [CrossRef]
  18. Baghbanzadeh, M.; Carbone, L.; Cozzoli, P.D.; Kappe, C.O. Microwave-assisted synthesis of colloidal inorganic nanocrystals. Angew. Chem. Int. Ed. Engl. 2011, 50, 11312–11359. [Google Scholar] [CrossRef] [PubMed]
  19. Melichar, L.; Jarosova, M.; Kopel, P.; Adam, V.; Kizek, R. Synthesyis of Quantum Dots by Microwave Irradiation. In Proceedings of the Nanocon 2013, 5th International Conference, Brno, Czech Republic, 16–18 October 2013; pp. 187–191. [Google Scholar]
  20. Dong, C.; Ren, J. Water-soluble mercaptoundecanoic acid (MUA)-coated CdTe quantum dots: One-step microwave synthesis, characterization and cancer cell imaging. Luminescence 2012, 27, 199–203. [Google Scholar] [CrossRef] [PubMed]
  21. He, X.; Zeng, T.; Li, Z.; Wang, G.; Ma, N. Catalytic Molecular Imaging of MicroRNA in Living Cells by DNA-Programmed Nanoparticle Disassembly. Angew. Chem. Int. Ed. Engl. 2016, 55, 3073–3076. [Google Scholar] [CrossRef] [PubMed]
  22. Ding, L.; Peng, Z.Z.; Shen, W.Z.; Liu, T.; Cheng, Z.Z.; Gauthier, M.; Liang, F. Microwave Synthesis of CdTe/TGA Quantum Dots and Their Thermodynamic Interaction with Bovine Serum Albumin. J. Wuhan. Univ. Technol.-Mater. Sci. Ed. 2016, 31, 1408–1414. [Google Scholar] [CrossRef]
  23. Hanrahan, G.; Zhu, J.; Gibani, S.; Patil, D.G. Chemometrics and Statistics|Experimental Design. In Encyclopedia of Analytical Science; Worsfold, P., Townshend, A., Poole, C., Eds.; Elsevier: Oxford, UK, 2005; pp. 8–13. [Google Scholar]
  24. Yu, W.W.; Qu, L.H.; Guo, W.Z.; Peng, X.G. Experimental determination of the extinction coefficient of CdTe, CdSe, and CdS nanocrystals. Chem. Mater. 2003, 15, 2854–2860. [Google Scholar] [CrossRef]
  25. Wurth, C.; Grabolle, M.; Pauli, J.; Spieles, M.; Resch-Genger, U. Relative and absolute determination of fluorescence quantum yields of transparent samples. Nat. Protoc. 2013, 8, 1535–1550. [Google Scholar] [CrossRef] [PubMed]
  26. Zhou, D.; Lin, M.; Chen, Z.L.; Sun, H.Z.; Zhang, H.; Sun, H.C.; Yang, B. Simple Synthesis of Highly Luminescent Water-Soluble CdTe Quantum Dots with Controllable Surface Functionality. Chem. Mater. 2011, 23, 4857–4862. [Google Scholar] [CrossRef]
  27. Wu, S.L.; Dou, J.; Zhang, J.; Zhang, S.F. A simple and economical one-pot method to synthesize high-quality water soluble CdTe QDs. J. Mater. Chem. 2012, 22, 14573–14578. [Google Scholar] [CrossRef]
  28. Borghei, Y.S.; Hosseini, M. An approach toward miRNA detection via different thermo-responsive aggregation/disaggregation of CdTe quantum dots. RSC Adv. 2018, 8, 30148–30154. [Google Scholar] [CrossRef] [PubMed]
  29. Yang, B.; Zhang, S.; Fang, X.; Kong, J. Double signal amplification strategy for ultrasensitive electrochemical biosensor based on nuclease and quantum dot-DNA nanocomposites in the detection of breast cancer 1 gene mutation. Biosens. Bioelectron. 2019, 142, 111544. [Google Scholar] [CrossRef] [PubMed]
  30. Kiprotich, S.; Dejene, B.F.; Onani, M.O. Effects of precursor pH on structural and optical properties of CdTe quantum dots by wet chemical route. J. Mater. Sci.—Mater. Electron. 2018, 29, 16101–16110. [Google Scholar] [CrossRef]
  31. Moradi Alvand, Z.; Rajabi, H.R.; Mirzaei, A.; Masoumiasl, A.; Sadatfaraji, H. Rapid and green synthesis of cadmium telluride quantum dots with low toxicity based on a plant-mediated approach after microwave and ultrasonic assisted extraction: Synthesis, characterization, biological potentials and comparison study. Mater. Sci. Eng. C Mater. Biol. Appl. 2019, 98, 535–544. [Google Scholar] [CrossRef] [PubMed]
  32. Shen, M.; Jia, W.; You, Y.; Hu, Y.; Li, F.; Tian, S.; Li, J.; Jin, Y.; Han, D. Luminescent properties of CdTe quantum dots synthesized using 3-mercaptopropionic acid reduction of tellurium dioxide directly. Nanoscale Res. Lett. 2013, 8, 253. [Google Scholar] [CrossRef]
  33. Vale, B.R.C.; Mourao, R.S.; Bettini, J.; Sousa, J.C.L.; Ferrari, J.L.; Reiss, P.; Aldakov, D.; Schiavon, M.A. Ligand induced switching of the band alignment in aqueous synthesized CdTe/CdS core/shell nanocrystals. Sci. Rep. 2019, 9, 8332. [Google Scholar] [CrossRef]
Figure 1. Characterization of TGA-CdTe QDs. (A) I—UV-Vis and II—fluorescence spectra; (B) image of CdTe QDs’ suspension under visible light (right) and UV light—365 nm (left); (C) FT-IR spectrum.
Chemosensors 12 00070 g001
Figure 2. (A) High-resolution TEM image of TGA-CdTe QDs from Run 7 of DoE (scale bar: 5 nm). Inset: zoom-in of a single particle. (B) Fast Fourier-Transforms (FFT) of inset particle. (C) Particle size distribution. (D) Low-magnification STEM image (scale bar: 50 nm). (E) High-resolution STEM image (scale bar: 5 nm). (F) SAED pattern.
Chemosensors 12 00070 g002
Figure 3. TGA-CdTe QDs EDX analysis of TGA-CdTe QDs from Run 7 of DoE. (A) HAADF−STEM image; EDX maps of the elements, (B) cadmium (green), and (C) tellurium (red). Scale bar: 10 nm. (D) EDX spectrum and inset the atomic composition (at. %) of cadmium and tellurium.
Chemosensors 12 00070 g003
Figure 4. XPS survey spectrum of the as-synthesized TGA-CdTe QDs from Run 7 of DoE.
Chemosensors 12 00070 g004
Figure 5. Statistical analysis of DoE. (A) Variation of the results; (B) summary of fit showcasing R2 (green bar), Q2 (blue bar), model validity (yellow bar), and reproducibility (cyan bar); (C) plotted residuals; (D) influence of the parameters’ coefficients on the λmax.
Chemosensors 12 00070 g005
Figure 6. Surface response graphs. (A) Influence of temperature and time, fixing Te:Cd and TGA:Cd molar ratios at 0.20 and 1.00, respectively; (B) influence of Te:Cd and TGA:Cd molar ratios, fixing temperature and time at 110 °C and 15 min., respectively.
Chemosensors 12 00070 g006
Figure 7. Monotonic variation of all factors allowing to obtain QDs with the desired λmax. (○—time; ∆—temperature; □—TGA:Cd ratio; ◊—Te:Cd ratio).
Chemosensors 12 00070 g007
Figure 8. Optical characterization of one day of validation experiments. From left to right are represented R1.VE to R6.VE. (A) Representative image of each synthesis under visible light; (B) representative image of each synthesis under UV light (365 nm); (C) normalized absorbance spectra; (D) normalized fluorescence spectra. (The spectra represented in dark green is R1.VE, in green is R2.VE, in yellow is R3.VE, in orange is R4.VE, in red is R5.VE, and in dark red is R6.VE).
Chemosensors 12 00070 g008
Figure 9. Graphical representation of the observed and predicted λmax in the validation experiments.
Chemosensors 12 00070 g009
Figure 10. Optical characterization of one day of validation experiment 2. From left to right are represented E1 to E6: (A) representative image of each synthesis under visible light; (B) representative image of each synthesis under UV light (365 nm); (C) normalized absorbance spectra; (D) normalized fluorescence spectra. (The spectra represented in dark green is E1, in green is E2, in yellow is E3, in orange is E4, in red is E5, and in dark red is E6).
Chemosensors 12 00070 g010
Figure 11. Representative TEM images (FFT filter with Gaussian blur method) and histograms of particle size distribution of each different fluorescence colors of TGA-CdTe QDs: (A) green QDs (λMax = 539.6 nm); (B) yellow QDs (λMax = 569.6 nm); (C) orange QDs (λMax = 587.4 nm); and (D) red QDs (λMax = 612.8 nm). (Scale bar: 10 nm).
Chemosensors 12 00070 g011
Figure 12. QDs stability assays performed for 5 weeks. (A) Summary of λmax stability tests. (B) Summary of QY stability tests. Each data point is the mean (n = 3) ± SD. (●—green QDs; ▲—yellow QDs; ■—orange QDs; ♦—red QDs).
Chemosensors 12 00070 g012
Table 1. Factors and levels of central composite design.
−2−10+1+2
Time (sec)30060090012001500
Temperature (°C)90100110120130
Te:Cd ratio0.100.150.200.250.30
TGA:Cd ratio0.650.82511.1751.35
Table 2. Experimental conditions for runs 1–34 in the central composite DoE.
RunTime (Min)Temperature (°C)Te:Cd Molar RatioTGA:Cd Molar Ratio
1201000.150.825
2101200.150.825
3201000.251.175
4101200.251.175
515900.21
6151100.21
7151100.21
8101000.250.825
9201200.250.825
10101000.151.175
11201200.151.175
12151300.21
13151100.21
14151100.21
15101000.150.825
16201200.150.825
17101000.251.175
18201200.251.175
19151100.11
20151100.21
21151100.21
22201000.250.825
23101200.250.825
24201000.151.175
25101200.151.175
26151100.31
27151100.21
28151100.21
2951100.21
30251100.21
31151100.20.65
32151100.21.35
33151100.21
34151100.21
Table 3. Results of relative QY and λmax obtained from preliminary assays about the sequential order of reagents addition.
MethodQY (%) ± SDλmax (nm) ± SD
A16.38 ± 0.37572.1 ± 1.9
B4.20 ± 1.93565.1 ± 1.5
C18.99 ± 0.61570.6 ± 0.7
SD—standard deviation.
Table 4. Results obtained from DoE: R1–R34 represent the synthesis runs.
Day 1 Day 2 Day 3 Day 4 Day 5
Runλmax (nm)QY (%)Runλmax (nm)QY (%)Runλmax (nm)QY (%)Runλmax (nm)QY (%)Runλmax (nm)QY (%)
R1554.423.72R8544.22.24R15544.011.48R22559.414.41R29556.215.06
R2592.211.14R9613.811.88R16603.46.63R23602.25.96R30580.216.75
R3547.40.14R10535.41.10R17535.410.21R24547.024.70R31568.016.30
R4585.42.40R11594.019.10R18595.211.66R25582.618.91R32551.019.64
R5527.614.19R12629.21.70R19567.224.80R26572.018.12R33568.225.19
R6568.223.73R13568.022.98R20568.820.98R27567.220.68R34567.428.23
R7567.619.22R14568.622.86R21568.423.25R28566.623.50
Table 5. Summary of the fit of the four-factor models (complete and simplified) as produced by MODDE.
Experimental Data
Q(75%)582.6
Median568
Std. dev.22.9087
Min/Max0.838525
Std. dev./Mean0.0402189
Skewness0.530967
Skewness test1.31736
Kurtosis0.327102
Model statisticsCompleteSimplified
Model typeEvaluation of MLR modelEvaluation of MLR model
Scaling typeAll factors are orthogonally scaledAll factors are orthogonally scaled
df1928
R20.99680.9855
R2 adj0.99440.9829
Q20.98270.9766
Power (post hoc)11
Condition number3.942062.03101
Model terms156
df residual1928
rsd1.7082.996
p model<0.001<0.001
df lack of fit1019
p lack of fit<0.001<0.001
df pure error (repl. Runs)99
SD pure error0.68800.6880
df—degrees of freedom; pp-value for the significance of the F estimate.
Table 6. ANOVA of the multivariate model fitting.
dfSSMSFp (F < Fcrit, 0.05)
Regression
(model parameters)
517,067.43413.49380.35<0.001
Residual28251.38.97
Total3317,318.7
df—degrees of freedom; SS—sum of squares; MS—mean square; F—calculated F ratio; p—p-value for the significance of the F estimate.
Table 7. Combination of the factors that fulfil the requirements and originates QDs with the desired emission λmax and observed λmax and QY (%) of the validation experiment (R1.VE–R7.VE: runs of validation experiments).
SampleTime (min)Temperature (°C)Te:Cd RatioTGA:Cd RatioPredicted λmax (nm)Observed
λmax (nm)
QY (%)
R1.VE9950.141.22520.8529.519.3
R2.VE121030.171.11543.5551.623.3
R3.VE151100.191.02566.6568.719.5
R4.VE171160.220.93588.8596.99.5
R5.VE201230.250.82618.2623.31.1
R6.VE221270.270.76636.7636.10.3
R7.VE151100.191.02566.6568.517.9
Table 8. Two-way ANOVA for the validation experiments one data.
Source of VariationSSdfMSFp-ValueF Crit
Day116.461258.233.260.0743.89
Samples26,671.8964445.31249.060.0003.00
Error214.1791217.85
Total27,002.5320
df—degrees of freedom; SS—sum of squares; MS—mean square; F—calculated F ratio; pp-value for the significance of the F estimate.
Table 9. Studied conditions, predictions, and observed λmax of the additional experiments (E1–E7).
SampleTime (min)Temperature (°C)Te:Cd RatioTGA:Cd RatioPredicted λmax (nm)Observed λmax (nm)
E15900.150.83515.1517.2
E2111010.150.83545.0539.6
E315.51090.150.83568.2569.6
E4191160.150.83589.2587.4
E5231240.150.83614.7612.8
E6251290.150.83630.8624.2
E715.51090.150.83568.2563.8
Disclaimer/Publisher’s Note: The statements, opinions and data contained in all publications are solely those of the individual author(s) and contributor(s) and not of MDPI and/or the editor(s). MDPI and/or the editor(s) disclaim responsibility for any injury to people or property resulting from any ideas, methods, instructions or products referred to in the content.

