Article

Electrochemical Immunosensor for Detection of IgY in Food and Food Supplements

Department of Molecular Sciences and Nanosystems, University Ca’ Foscari of Venice, 30174 Venice, Italy
*
Author to whom correspondence should be addressed.
Chemosensors 2017, 5(1), 10; https://doi.org/10.3390/chemosensors5010010
Submission received: 16 December 2016 / Revised: 9 February 2017 / Accepted: 24 February 2017 / Published: 2 March 2017
(This article belongs to the Special Issue Electrochemical Immunosensors and Aptasensors)

Abstract

:
Immunoglobulin Y is a water-soluble protein present in high concentration in hen serum and egg yolk. IgY has applications in many fields, e.g., from food stuff to the mass production of antibodies. In this work, we have implemented an electrochemical immunosensor for IgY based on templated nanoelectrodes ensembles. IgY is captured by the templating polycarbonate and reacted with anti-IgY labeled with horseradish peroxidase. In the presence of H2O2 and methylene blue as the redox mediator, an electrocatalytic current is generated which scales with IgY concentration in the sample. After optimizing the extracting procedure, the immunosensor was applied for analysis of fresh eggs and food integrators. The data obtained with the biosensor were validated by SDS-PAGE and Western blot measurements.

1. Introduction

Immunoglobulin Y (IgY) is a water-soluble livetin, present in egg yolk. There are three different kinds of livetins and each of them can be compared with a protein of hen serum: α (~to albumin), β (~alfa-2-macroglobulin) and γ (~gamma globulins). γ-livetins are represented in yolk by immunoglobulin Y [1]. Its function is similar to mammalian IgG, providing immunity to the chicks. Concerning the structure, IgY is more similar to mammalian IgE, since the Hinge region is not present in its molecular structure [2]. IgY is composed of two heavy chains (Mw = 68 kDa) and two light chains (Mw = 27 kDa), resulting in a molecular weight of around 190 kDa [3]. The concentration of this antibody in hen blood serum is 5–15 mg/mL, in egg yolk is 10–25 mg/mL; for this high concentration and for its complete absence in egg white, IgY is well representative of egg yolk [4].
Recently, it has been demonstrated that IgY has useful applications in many fields. Among all of them, the most promising use of IgY is in immunotherapy, as shown by the many reviews and articles recently published covering this subject [2,3,4,5]; for example, IgY can protect humans and mammalians against animal diseases caused by virus or bacteria attacks. For these purposes, IgY can be added to many foods, both for cattle and humans (kids and adults), to improve the immunological properties of aliments. Moreover, it can be easily purified from egg yolk and its production is low cost and fast. IgY from hen egg yolk is a great resource in the field of primary and secondary antibodies research and development, especially because the cross-reactivity with mammalian complement system is very low or totally absent [2].
It is therefore important to provide reliable analytical methods to monitor the content of IgY in foods and related products. Different analytical methods have been proposed to identify and quantify IgY from egg yolk: ELISA; HPLC [6,7,8]; a biosensor based on surface plasmon resonance [9]; a nanostructured sensor based on electrochemical detection [10]; an electrochemical immunoassay based on electrodes arrays [11]; fluorescence switch assay [12]; or resonance light scattering [13].
Analytical methods should be fast, simple, reliable, highly sensitive and specific, and if possible, not expensive: electrochemical immunosensors satisfy all these requirements. Recently, our research group proposed an electrochemical immunosensor for IgY determination [10] based on nanoelectrode ensembles (NEEs), prepared by electroless deposition of gold using a track-etched polycarbonate (PC) membrane as the hard template. The polycarbonate part of NEEs has high affinity to proteins, therefore it is possible to promote the immobilization of the biorecognition element on the PC insulating surface of the NEE, leaving the gold nanodisks of the electrode surface free for the electron exchange [14]. The proposed IgY-NEE-based immunosensor was successfully applied to detect egg yolk in tempera paintings and other works of art [10]. NEEs present geometrical and diffusion characteristics that allow very low detection limits to be achieved that potentiate the typical high specificity and selectivity of the immunoassays. For these reasons, NEEs are suitable to be used as transducers of electrochemical biosensors, in particular in the case of immunosensors [15].
In the present work, we focus on the NEE-based IgY immunosensor previously proposed [10] whose performance was optimised with respect to the previous work by decreasing both the geometrical area of the sensor and the amount of reagents. Thanks to these improvements, we have been able to analyse a larger concentration range of yolk and IgY, using a very low amount of sample. This optimisation is especially useful when the analyte is present in low concentration or if there is a small amount of sample available. SDS-PAGE and western blot (WB) assays are carried out for the validation of the method. We demonstrate its applicability for the sensitive determination of IgY in complex matrices such as egg yolk, as well as in other food based on egg components. Among the available food and food supplements based on egg, we studied IgY determination in samples that have undergone an industrial treatment, such as freeze-drying. We investigated if this process can inflict the stability of IgY and its concentration levels in the samples.

2. Materials and Methods

2.1. Materials and Instrumentation

NEEs are prepared via template deposition of gold in a nanofilter polycarbonate (PC) membrane supplied by SPI Pore Filter (47 mm diameter, thickness 6 µm, pore diameter 30 nm, nominal pore density 6 × 10⁸ pores/cm2), impregnated with polyvinylpyrrolidone by the producer. The geometrical area (area of the nanoelectrodes plus insulator between them) of the NEEs used for this study is 2.27 mm2, three times smaller than the one used in [10]. The geometrical area (area of the nanoelectrodes plus insulator between them) of the NEEs used for this study is 2.27 mm2, three times smaller than the one used in [10]. The active area (area of the nanodisks electrodes) is approximately 0.01 mm2. More detailed information on the deposition of gold and nanoelectrodes fabrication can be found elsewhere [16,17].
Eggs used in this work were purchased at a local market. Albumin from Bovine Serum (BSA) was from Sigma Aldrich; the secondary antibody goat anti-IgY conjugated to horseradish peroxidase (HRP) HRP-conjugated was from Immunology Consultants Laboratory (USA). Freeze-dried eggs (egg white and egg yolk, separately) were from a sport-related company specialized in the production of freeze-dried products and proteins for sportsmen.
Electrochemical measurements were carried out at room temperature with a CH 1000a instrument potentiostat using a typical three-electrodes cell equipped with a platinum wire as the counter electrode, an Ag/AgCl (KCl saturated) reference electrode and NEEs as working electrodes. The supporting electrolyte used was 0.01 M phosphate-buffered saline solution (PBS). Preliminary cyclic voltammetric experiments indicated 10 mV/s as the optimal scan rate for this application.

2.2. Samples Preparation

To identify IgY, it is necessary to separate the water-soluble proteins (including IgY) from the water-insoluble lipid and lipoprotein part of egg yolk. In the literature, several methods are proposed for the extraction and purification of IgY [18,19,20]; we followed the extraction proposed in [20] that employs 0.2 M acetate buffer at pH 5. Briefly, after mechanical separation of yolk and egg white, a known amount of yolk is dissolved in the buffer to obtain a starting concentration of 0.5 g/mL of egg yolk, then the solution is mixed with vortex and left for two hours in a conical centrifuge tube, to let the heavy and not-soluble fraction deposit. The supernatant, containing IgY and other soluble proteins, is then separated from the pellet with a micropipette. The supernatant is further diluted in acetate buffer to desired values.
IgY was determined in two different food samples: the first was fresh egg yolk and the second was freeze-dried egg commercialised as a food integrator for sportsmen. Eight samples of yolk extracted from the same fresh egg were analysed and analysed concentrations are shown in Table 1; different samples were prepared by sequential dilution. We estimated the amount of IgY immobilized on the electrode from an average concentration of 10 mg/mL of IgY in the yolk and considering a volume of sample deposited on the sensor of 5 µL. For the concentrations of egg yolk in these samples, the amount of IgY present on the surface of the electrodes increases from 4 ng to 1 µg. A sample containing egg white was analyzed as well as a negative test.
Freeze-dried egg samples were prepared following procedure and amounts suggested by the provider: i.e., 15–45 g of powder in 150–200 mL of water or milk. For our purposes, we extracted the proteins with acetate buffer 0.2 M at pH 5 directly from the freeze-dried product without previous dissolution in water or milk. Analyzed samples are described in Table 2: one sample of egg white and two samples of freeze-dried egg yolk at different concentrations. For each sample, 1.5 g of powder was dissolved in 25 mL of buffer, then the sample containing egg yolk was further diluted to obtain a lower concentration value. Yolk concentration was calculated considering the dilution factor. Percentage of the protein content in the samples declared by the company is reported in column 5.

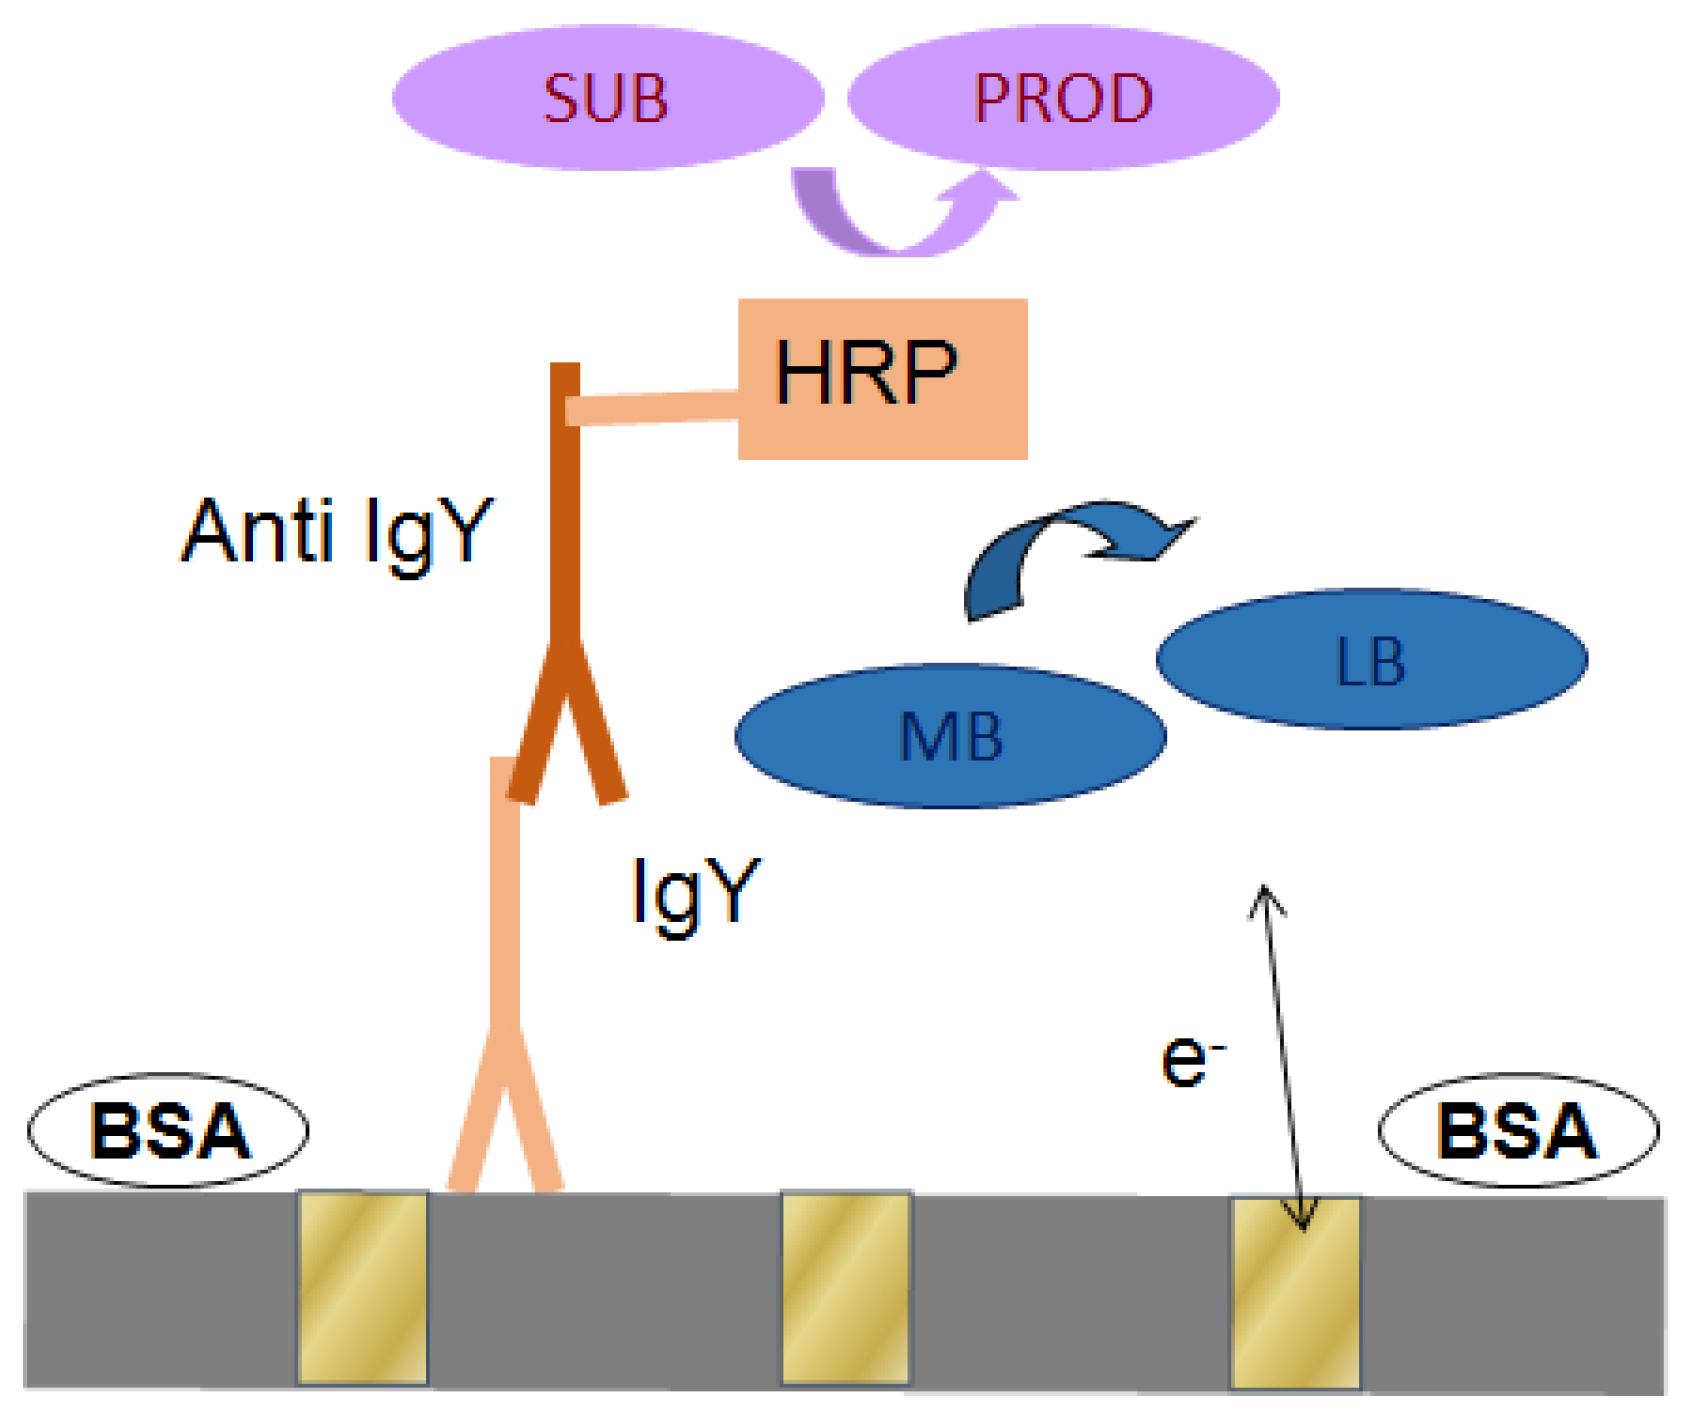
2.3. Operation of the Immunosensor

Scheme 1 briefly illustrates the behaviour of the immunosensor: the analyte is captured on the PC portion of the NEE surface area by incubation in the sample at pH 5. Then a blocking step is performed by immersion of the electrode in a bovine serum albumin (BSA) solution. Afterwards, IgY is recognized by a specific secondary antibody labelled with the enzyme horseradish peroxidase (HRP). The label is finally detected by adding the substrate (0.5 mM hydrogen peroxide) in a solution containing a redox mediator (0.1 mM methylene blue); under these conditions, an electrocatalytic signal is generated that scales with the analyte concentration.

2.4. Capture of IgY on NEEs

The capture of IgY on NEEs was carried out in the following steps:
  • Incubation of 5 µL of the sample solution (in acetate buffer) for 30 min;
  • Four times rinsing of the NEE with 1 mL of 0.01 M PBS, the electrode is then dried by a gentle stream of air;
  • Immersion of the electrode in 1 mL of blocking solution (1% BSA in PBS) on orbital shaker plates for 30 min;
  • Four times rinsing of the electrode with 1 mL of PBS;
  • Incubation of 5 µL of 0.1 mg/mL of the secondary antibody Anti-IgY-HRP for 30 min;
  • Four times rinsing the electrode with 1 mL of PBS.
The incubation steps are performed in a wet chamber at room temperature. Also in this case, the amount of solution and reagents used to complete the immobilization procedure were three times smaller than those used in [10].

2.5. SDS-PAGE and Western Blot Analysis

To validate the results obtained by the electrochemical immunosensors, SDS-PAGE and Western blot (WB) analysis were performed. Samples were loaded on 12% polyacrylamide discontinuous gels [21] under reducing condition, and separation occurred using a constant voltage of 180 V. Proteins were stained using Commassie Blue. A broad range protein standard (Bio-Rad 161-0317) from 6.5 kDa to 200 kDa was used as the marker.
Proteins were also blotted on a polyvinylidene difluoride (PVDF) membrane with a Mini Trans-Blot® Electrophoretic Transfer Cell (instruments settings: 100 V and 350 mA, Bio-Rad, Hercules, CA, USA). IgY detection was carried out with the same secondary antibody anti-IgY HRP-conjugated used for the immunosensor. HRP detection was done with 4-chloronaphthol and hydrogen peroxide.

3. Results and Discussion

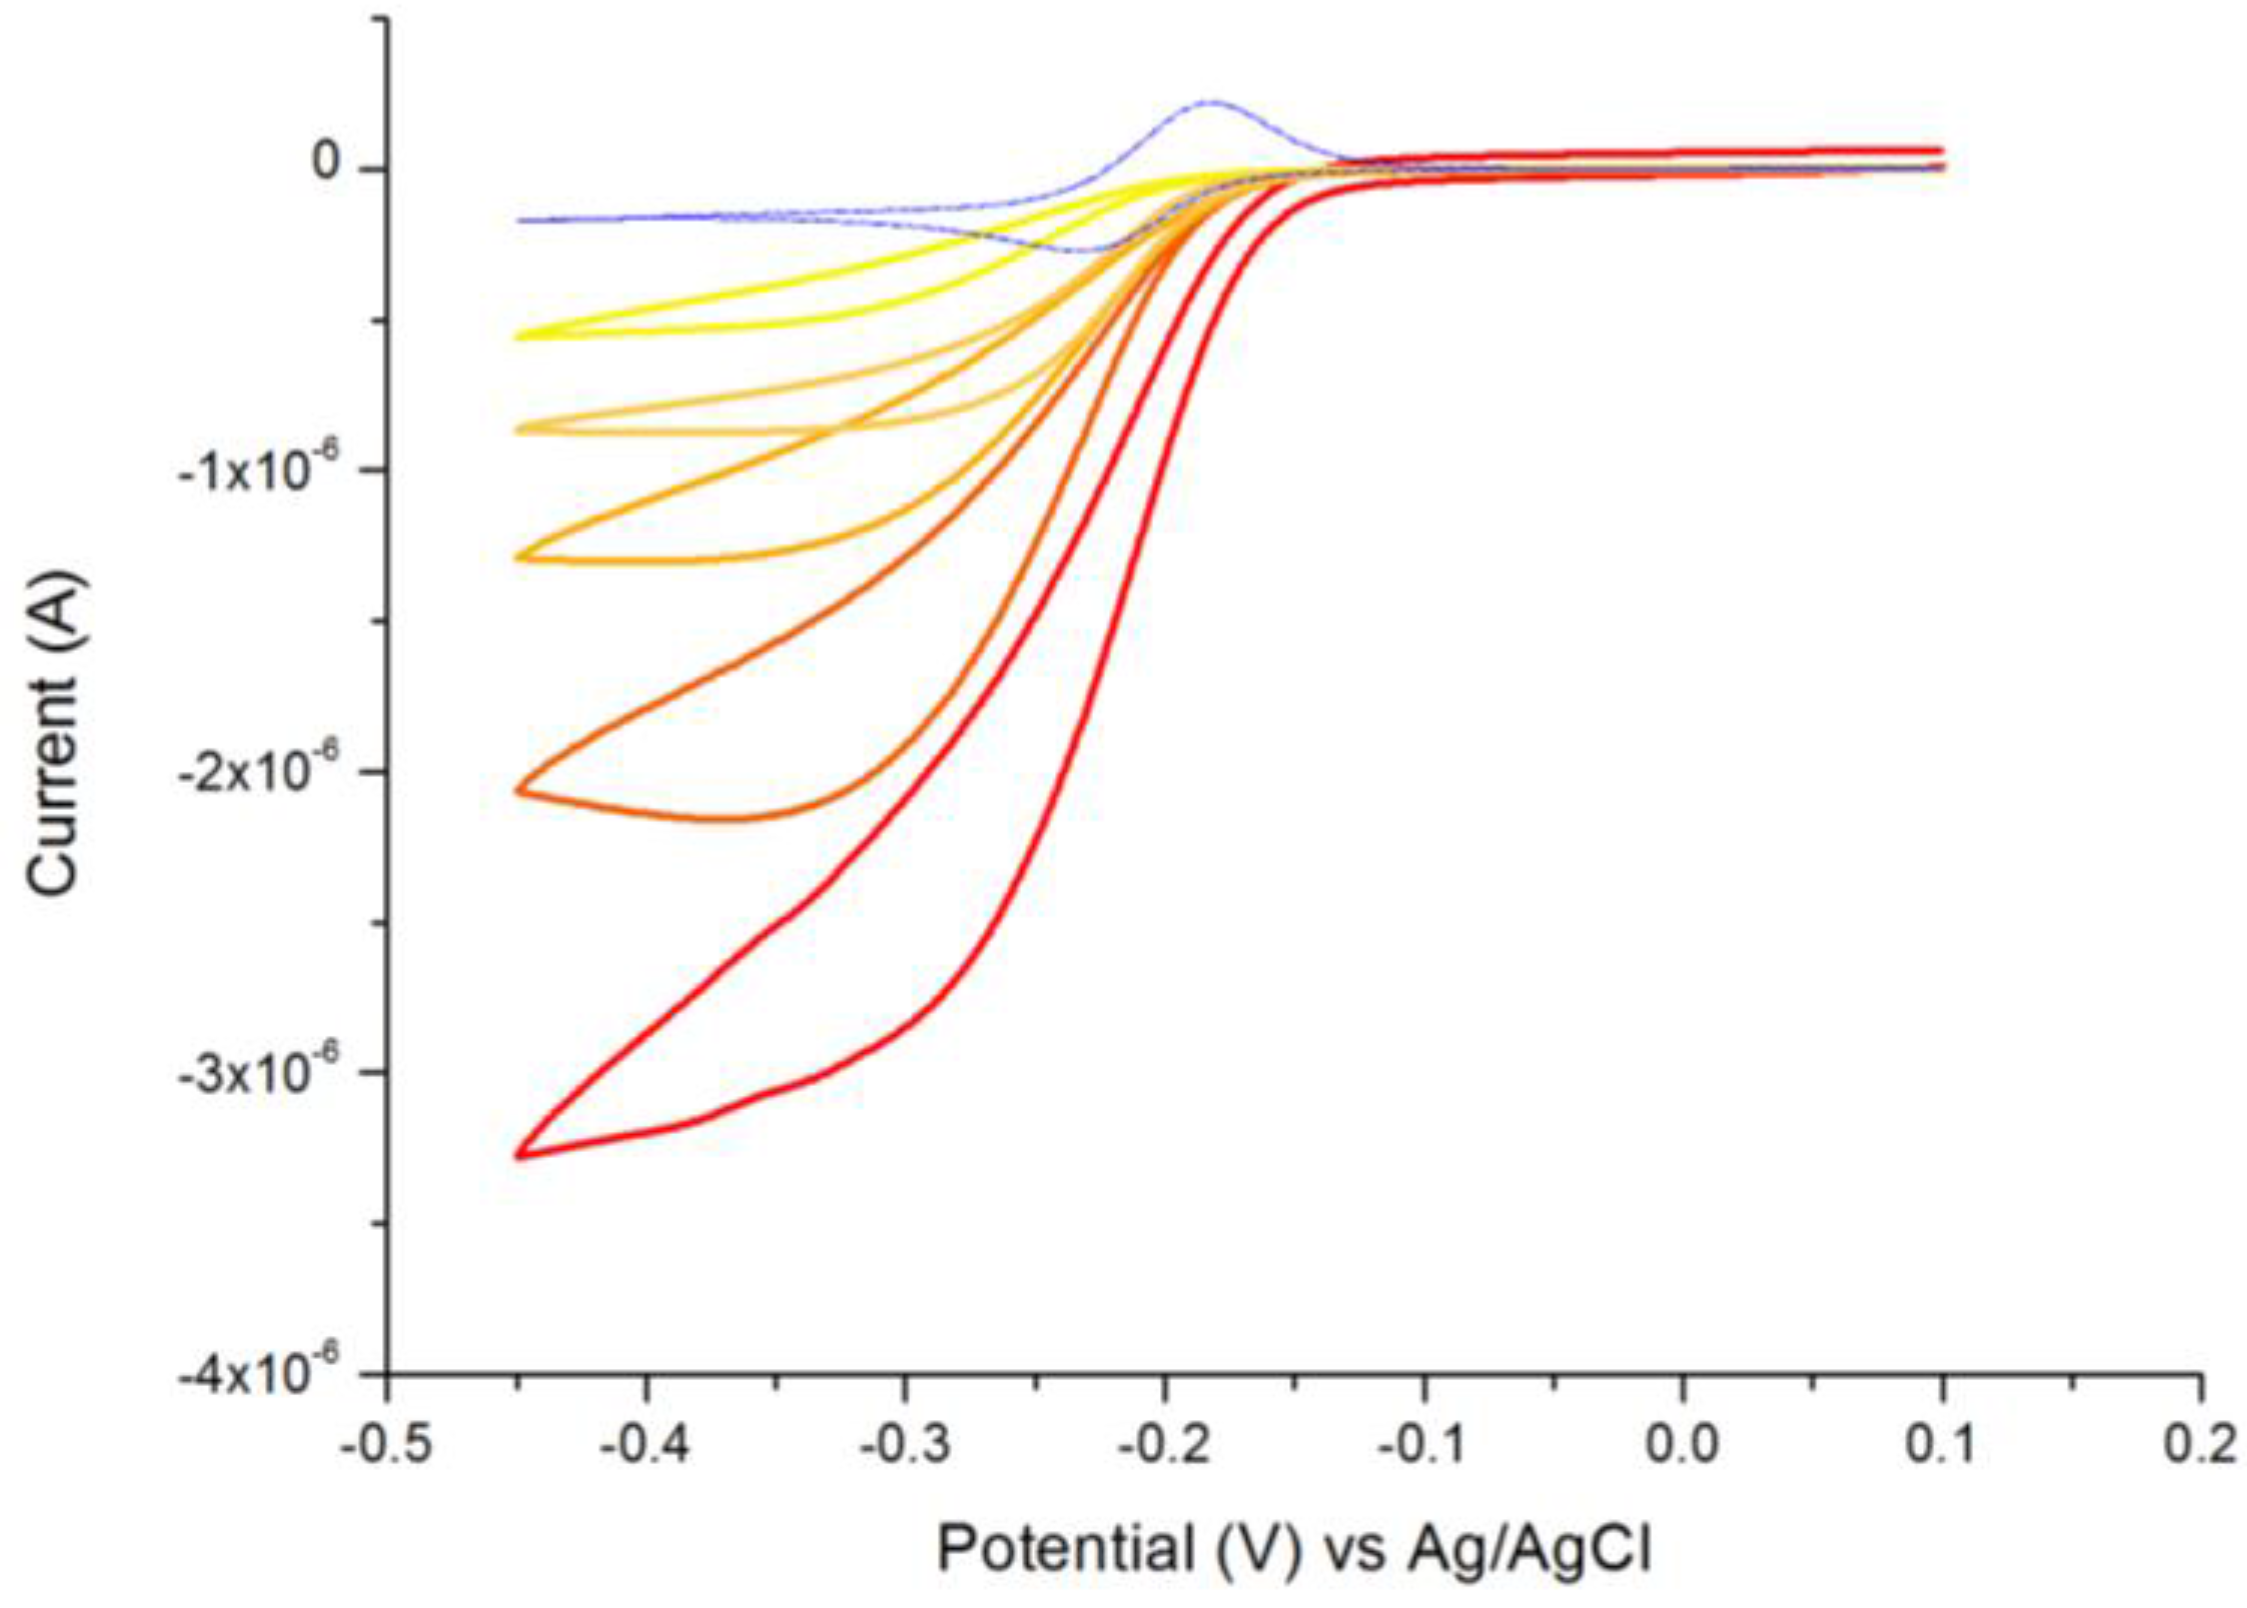
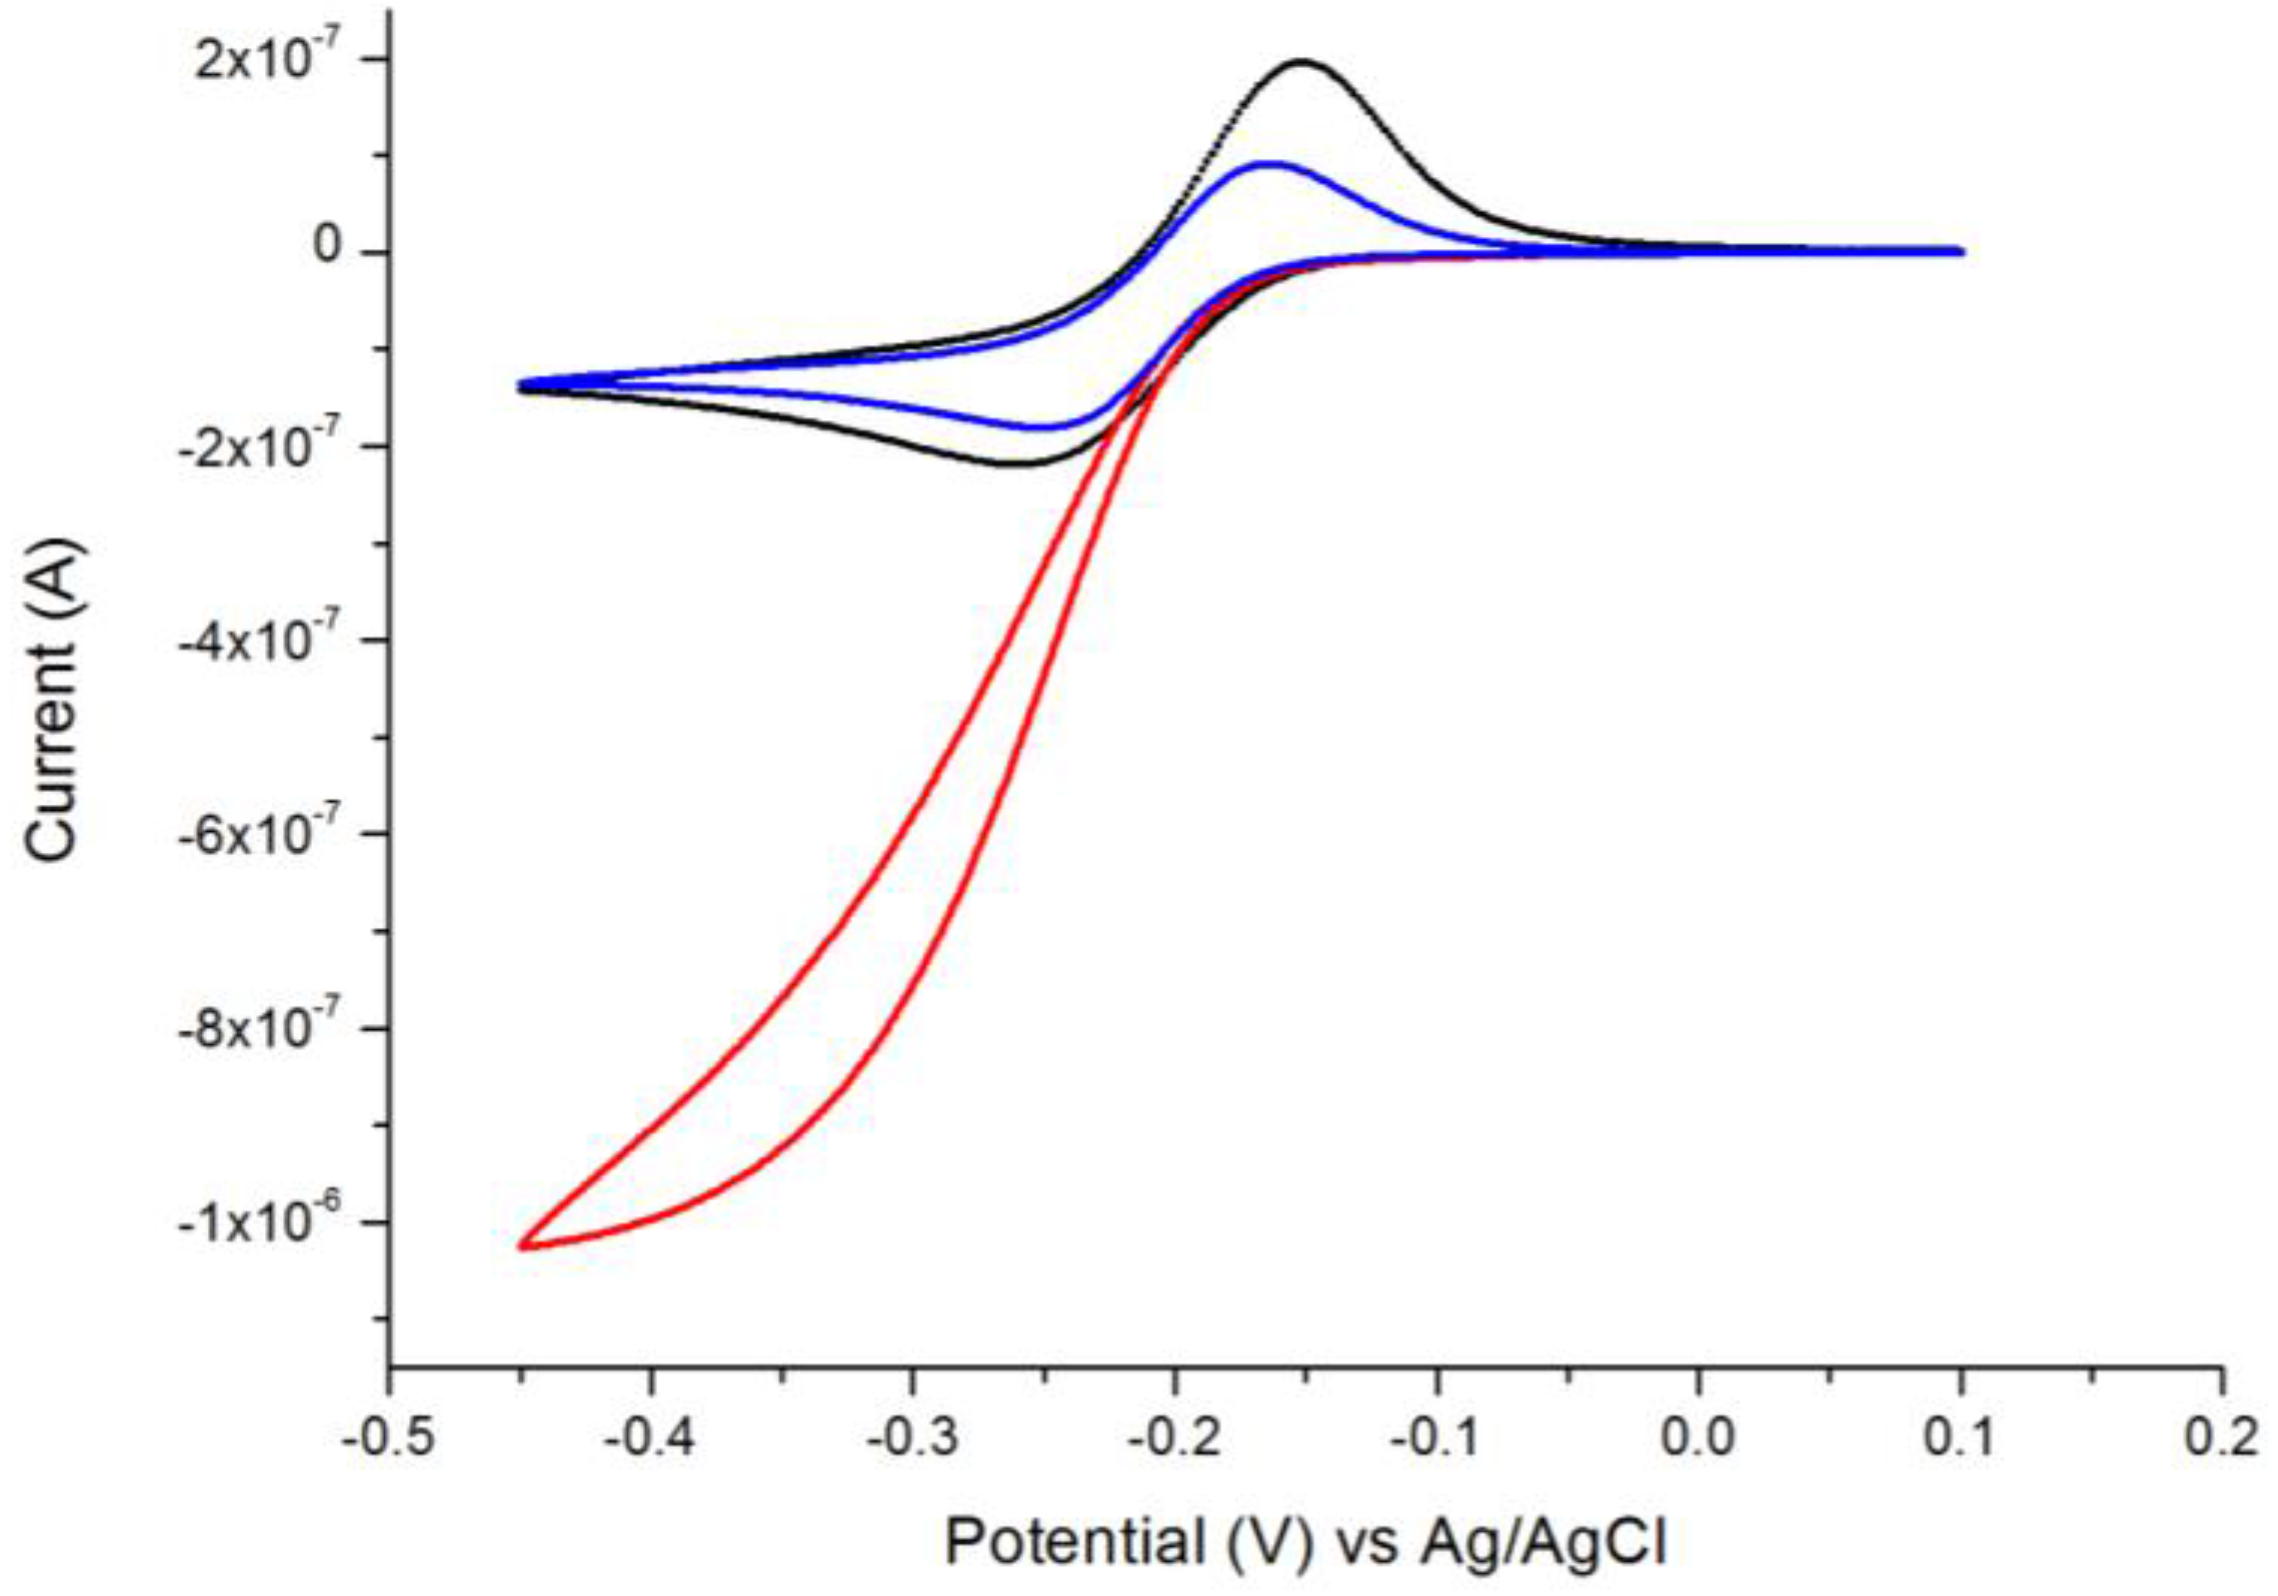
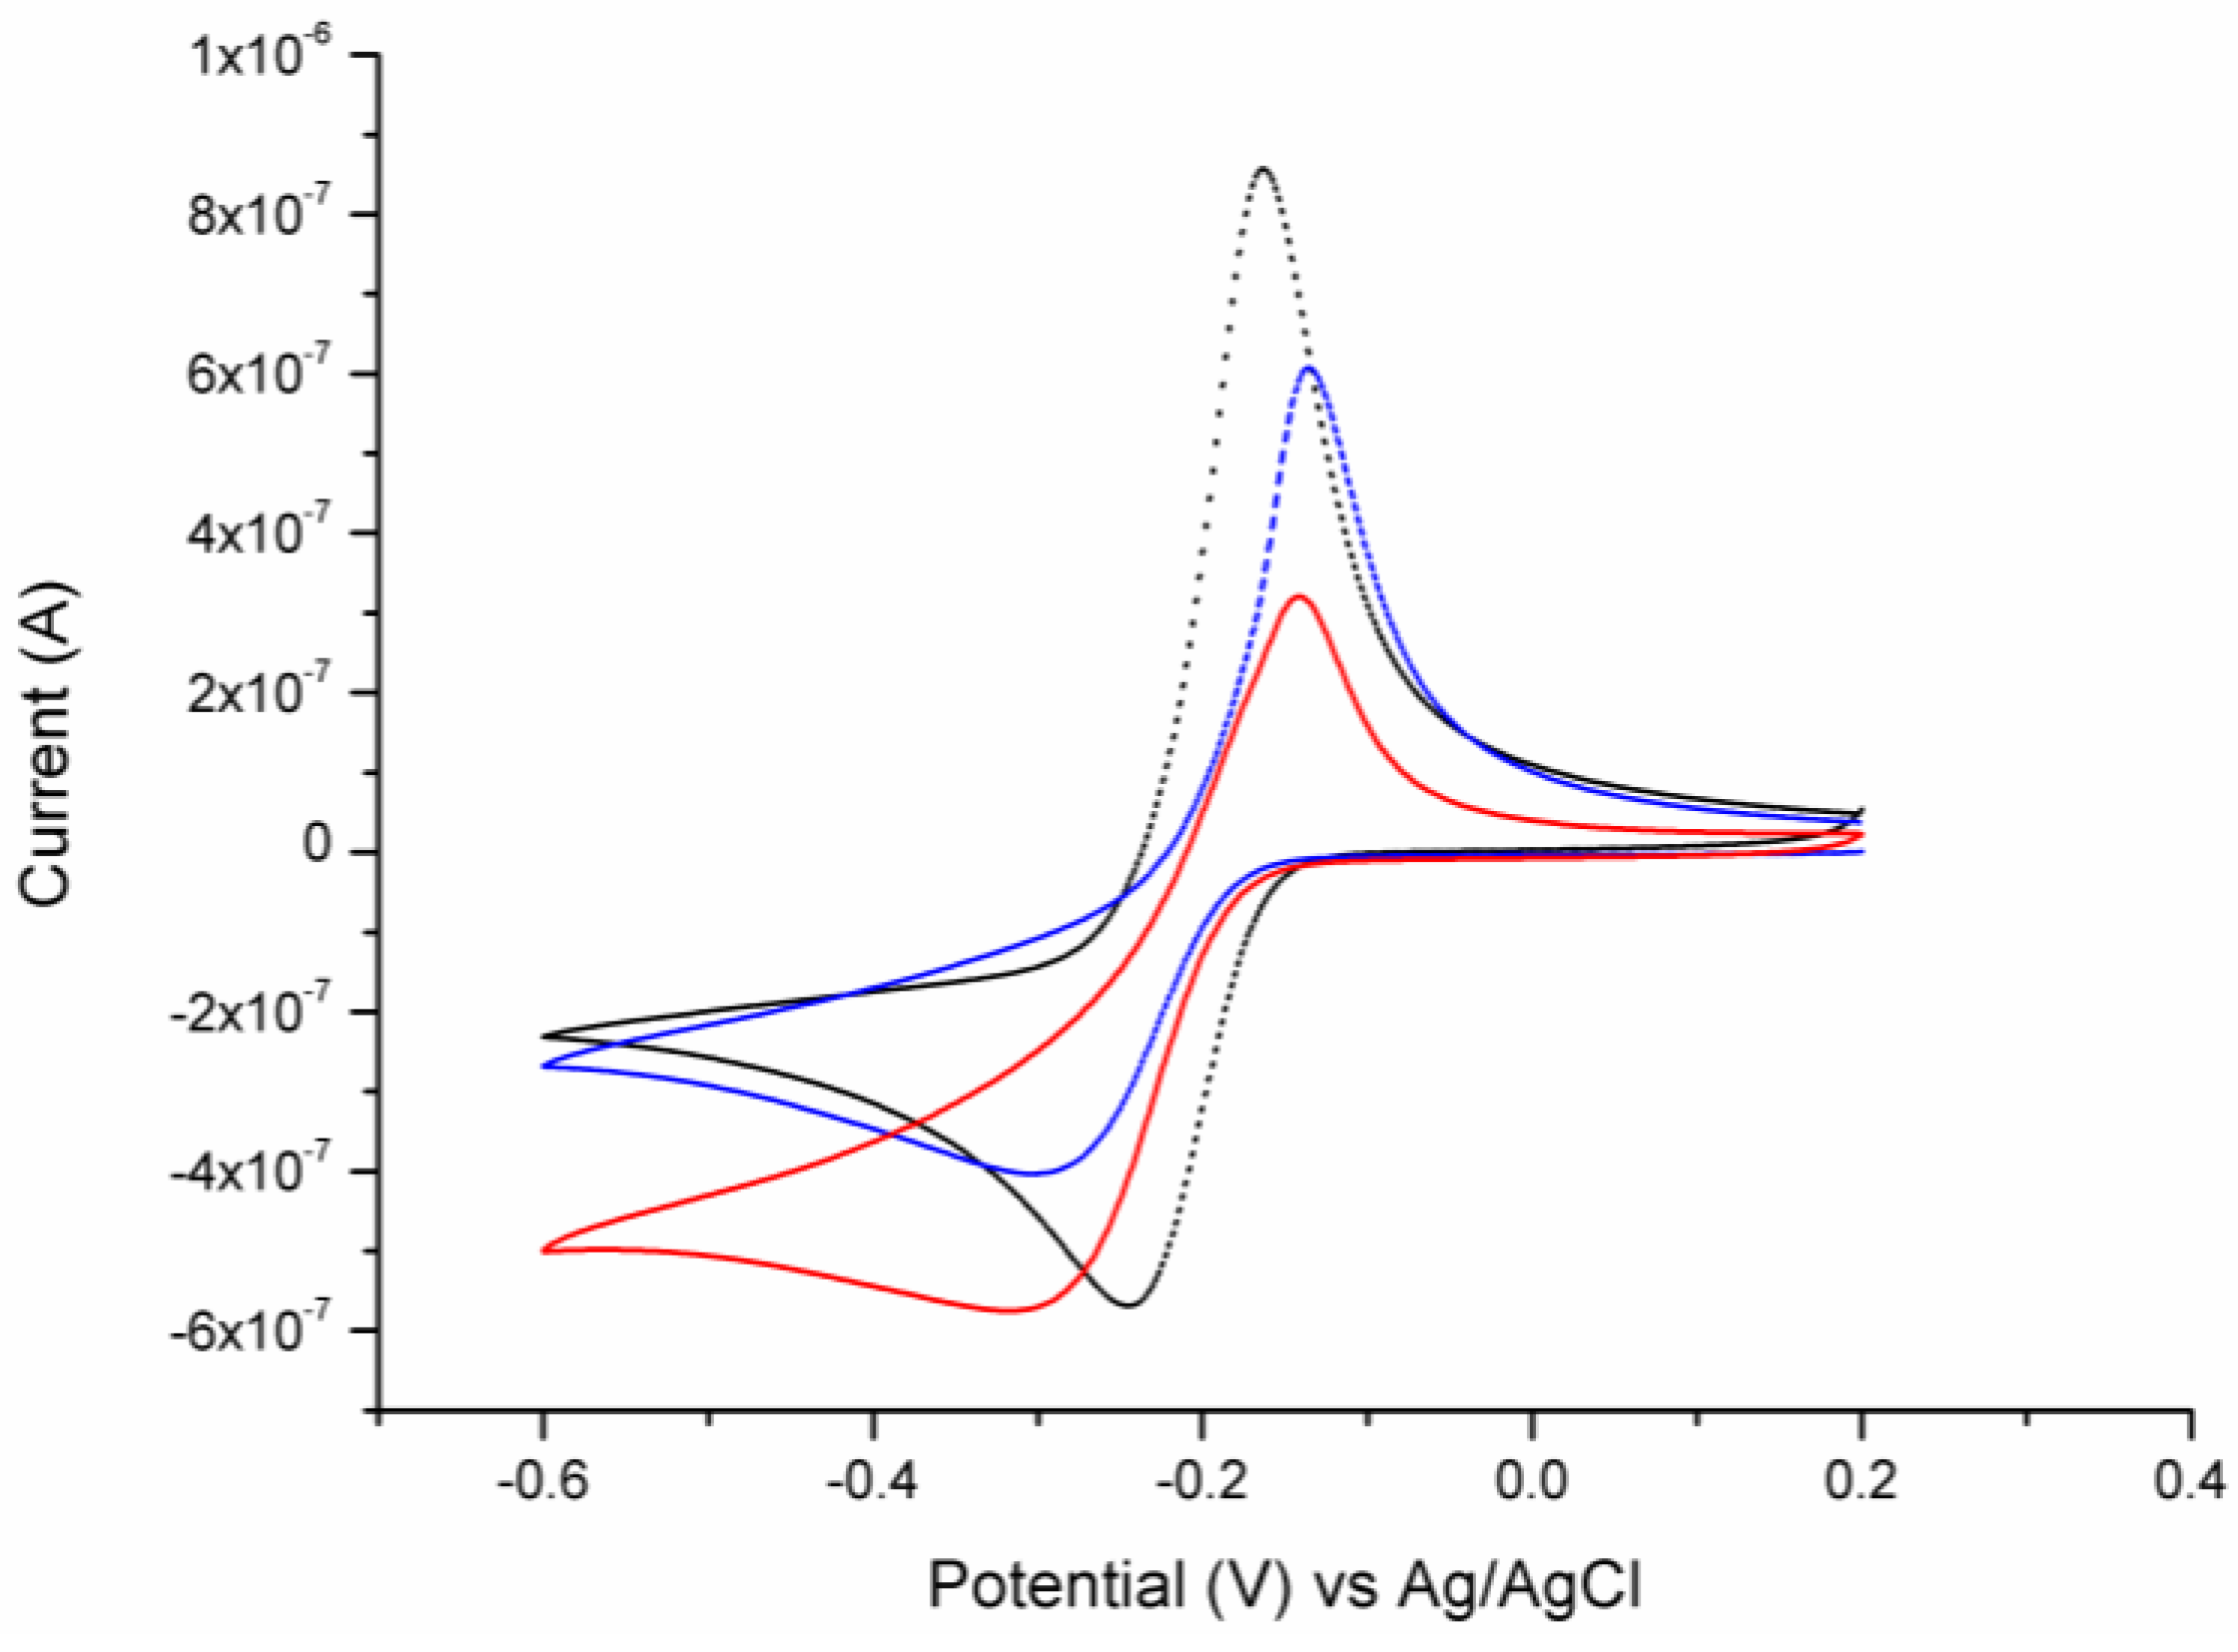
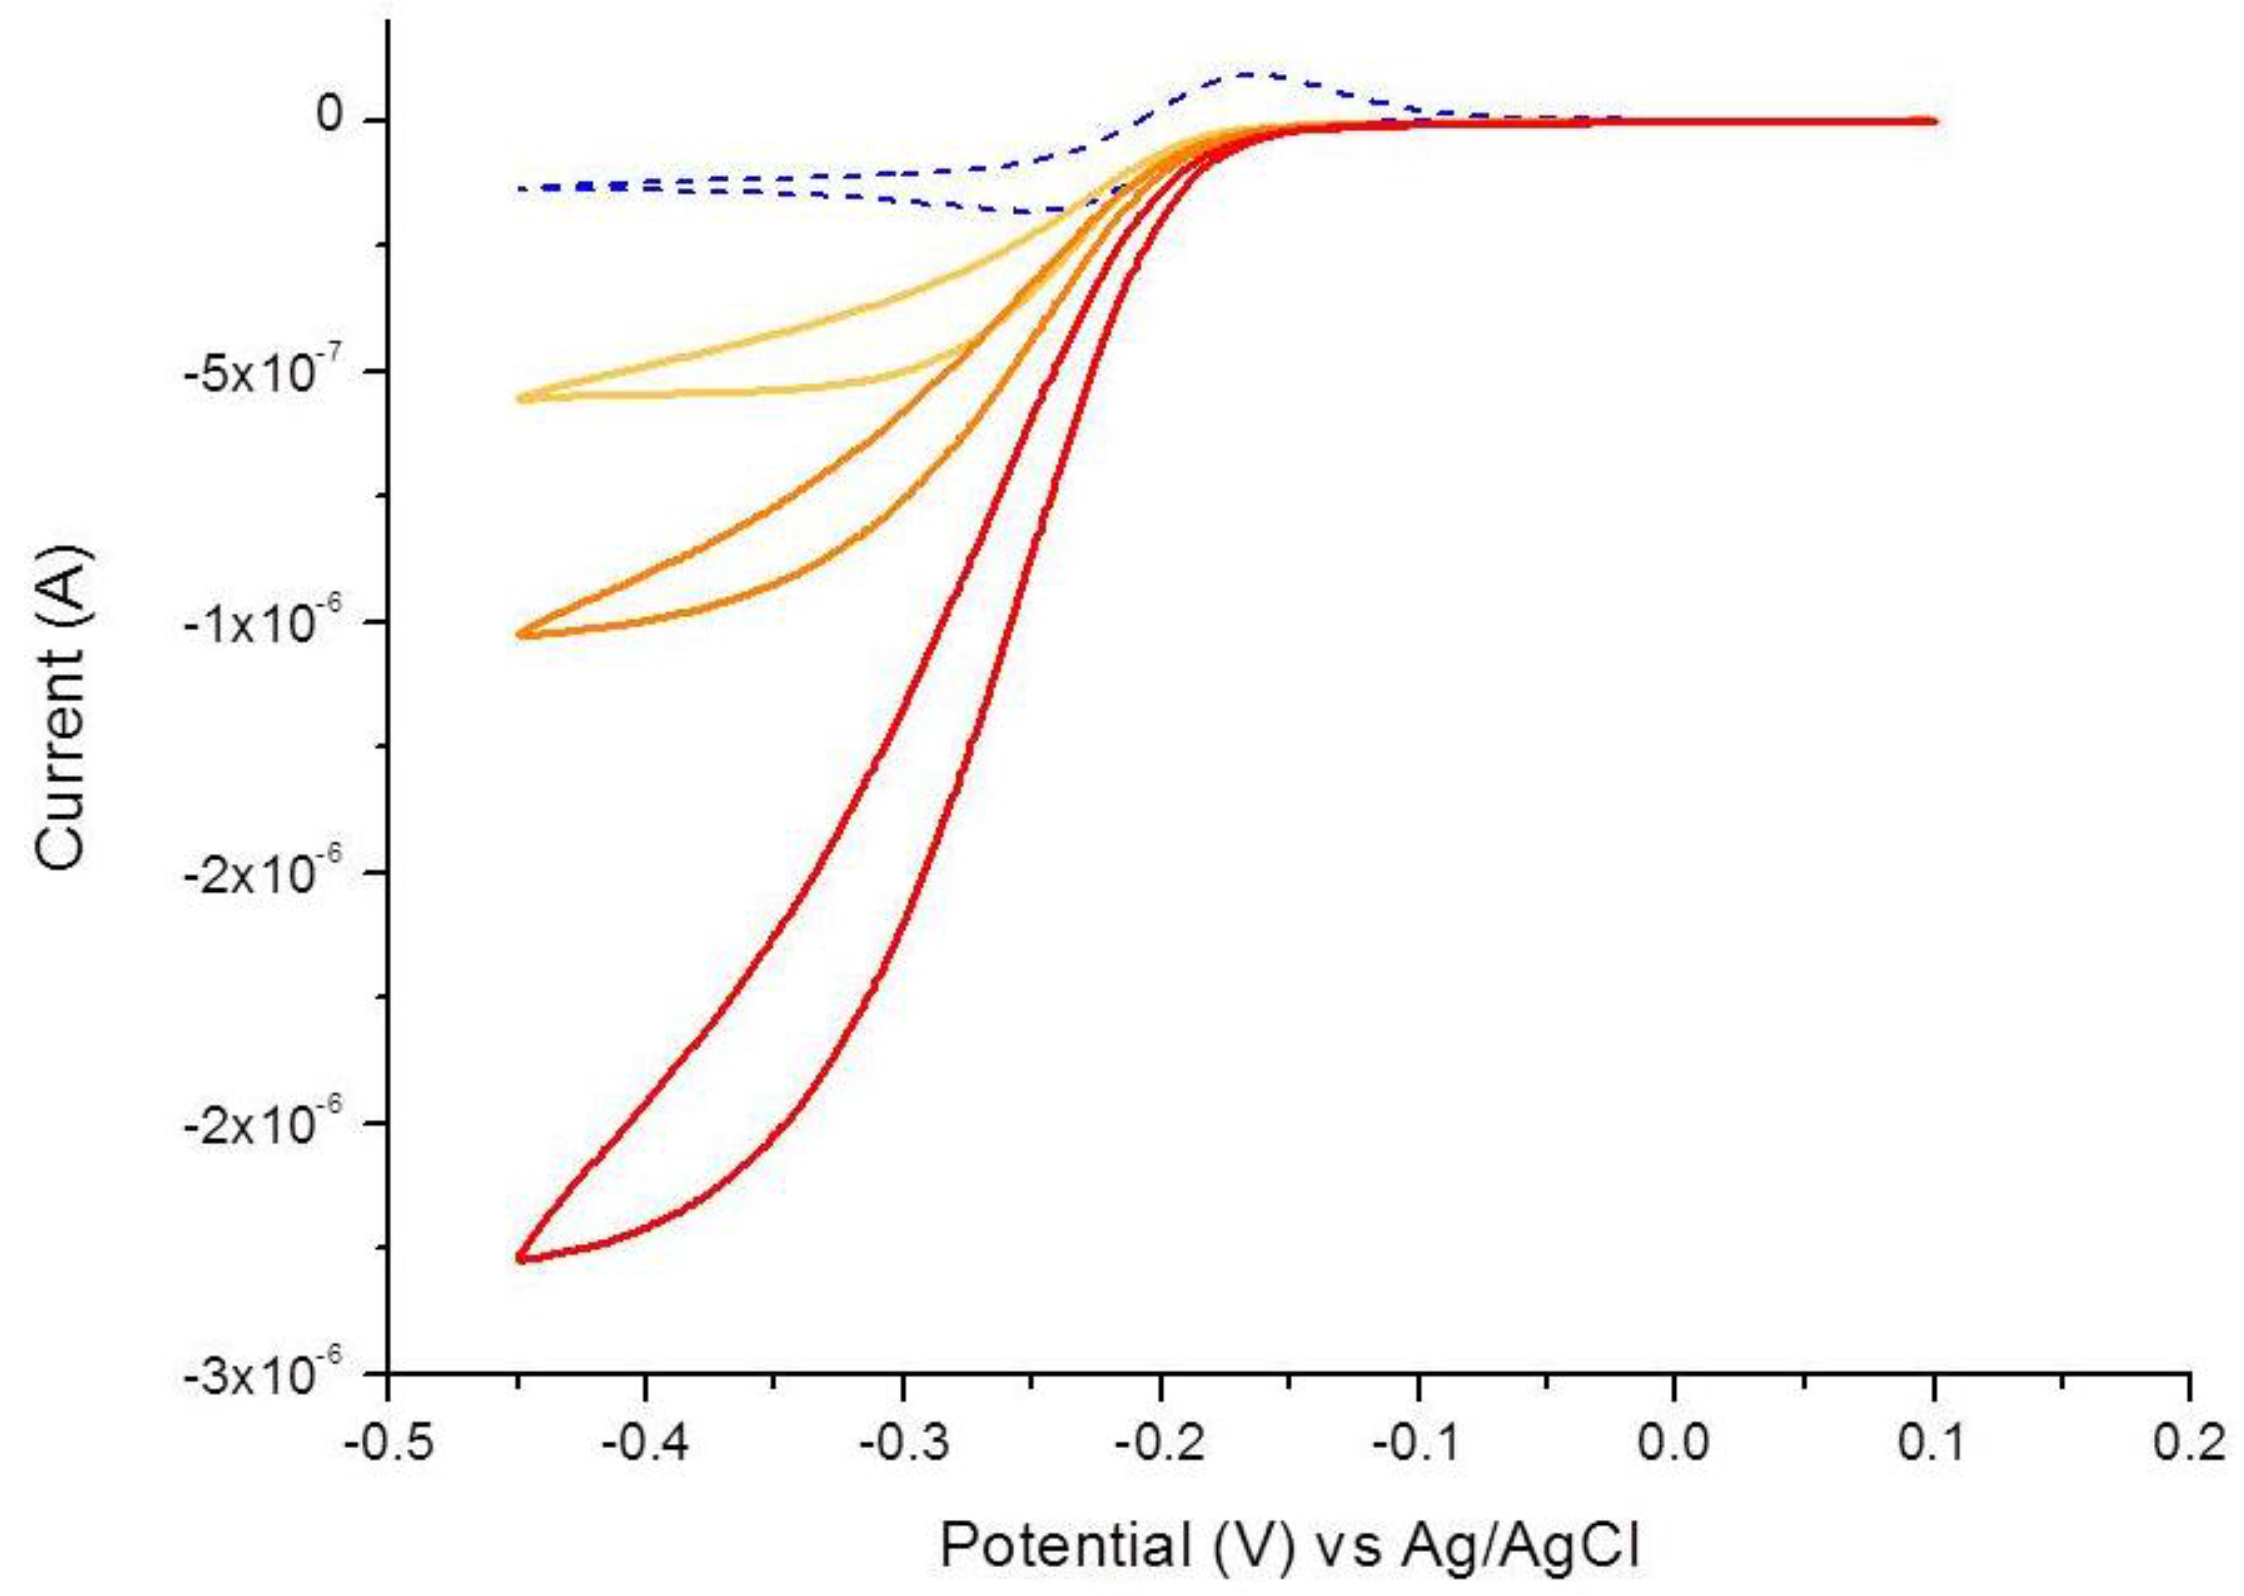
3.1. Characterization of the Immunosensor

The capture of IgY on the NEE was monitored by cyclic voltammetry and is shown in Figure 1. The dotted-black line CV (cyclic voltammogram) was recorded at a bare NEE in 0.1 mM MB. It shows the quasi-reversible voltammetric behavior of MB, with E1/2 = 0.2 V. The dashed-blue line CV was recorded in the same solution at the NEE after the complete functionalization (described in Section 2.3—i.e., incubation with IgY, blocking with BSA and incubation with HRP-secondary antibody). It does not show any significant difference from the one recorded at the bare electrode, just a little decrease of the peak current, probably due to almost negligible adsorption on the nanoelectrode surface during the functionalization procedure. On the contrary, dramatic changes are detected at the functionalized NEE after addition of 0.5 mM hydrogen peroxide (Figure 1 solid-red line), that can be summarized as follows:
  • The CV shape moves from the peak shaped to a sigmoidal pattern, with overall current increasing with IgY amount;
  • The anodic peak disappears.
Indeed, in the presence of the enzyme, the substrate and the redox mediator, the following electrocatalytic cycle is operative:
HRPred + H2O2 → HPRox + H2O
MB + 2e + H+ → LB
HRPox + LB → HPRred + MB
where LB in the reduced Leuco form of the MB; HRPox and HRPred are the oxidized and reduced form of HRP, respectively.
Note that the addition of 0.5 mM H2O2 to MB solution does not cause any change in the MB pattern recorded at a bare NEE [11]. To identify the appropriate concentration of substrate, tests with increasing concentration of H2O2 were performed: 0.5 mM, 1.0 mM and 1.5 mM H2O2 were successively added to the same solution and CVs of MB in the presence of the enzyme and its substrate were recorded (see Figure S1 in the Supplementary Materials).
Figure 2 presents the behavior of the immunosensor when the sample incubated contains rabbit glue (i.e., collagen) instead of egg yolk (i.e., IgY). All the following steps of the procedure are performed as described in 2.3. The dotted-black line CV corresponds to the MB recorded at the bare electrode; the dashed-blue line CV was recorded after the complete functionalization procedure (carried out with rabbit glue) and the solid-red line CV was recorded after the addition of the substrate in the same MB solution. In the case of incubation with rabbit glue, some minor changes appear in the CV pattern, however they do not match at all with the features expected for the electrocatalytic process (1)–(3). This evidence confirms the specificity of the NEE-based method for IgY detection.

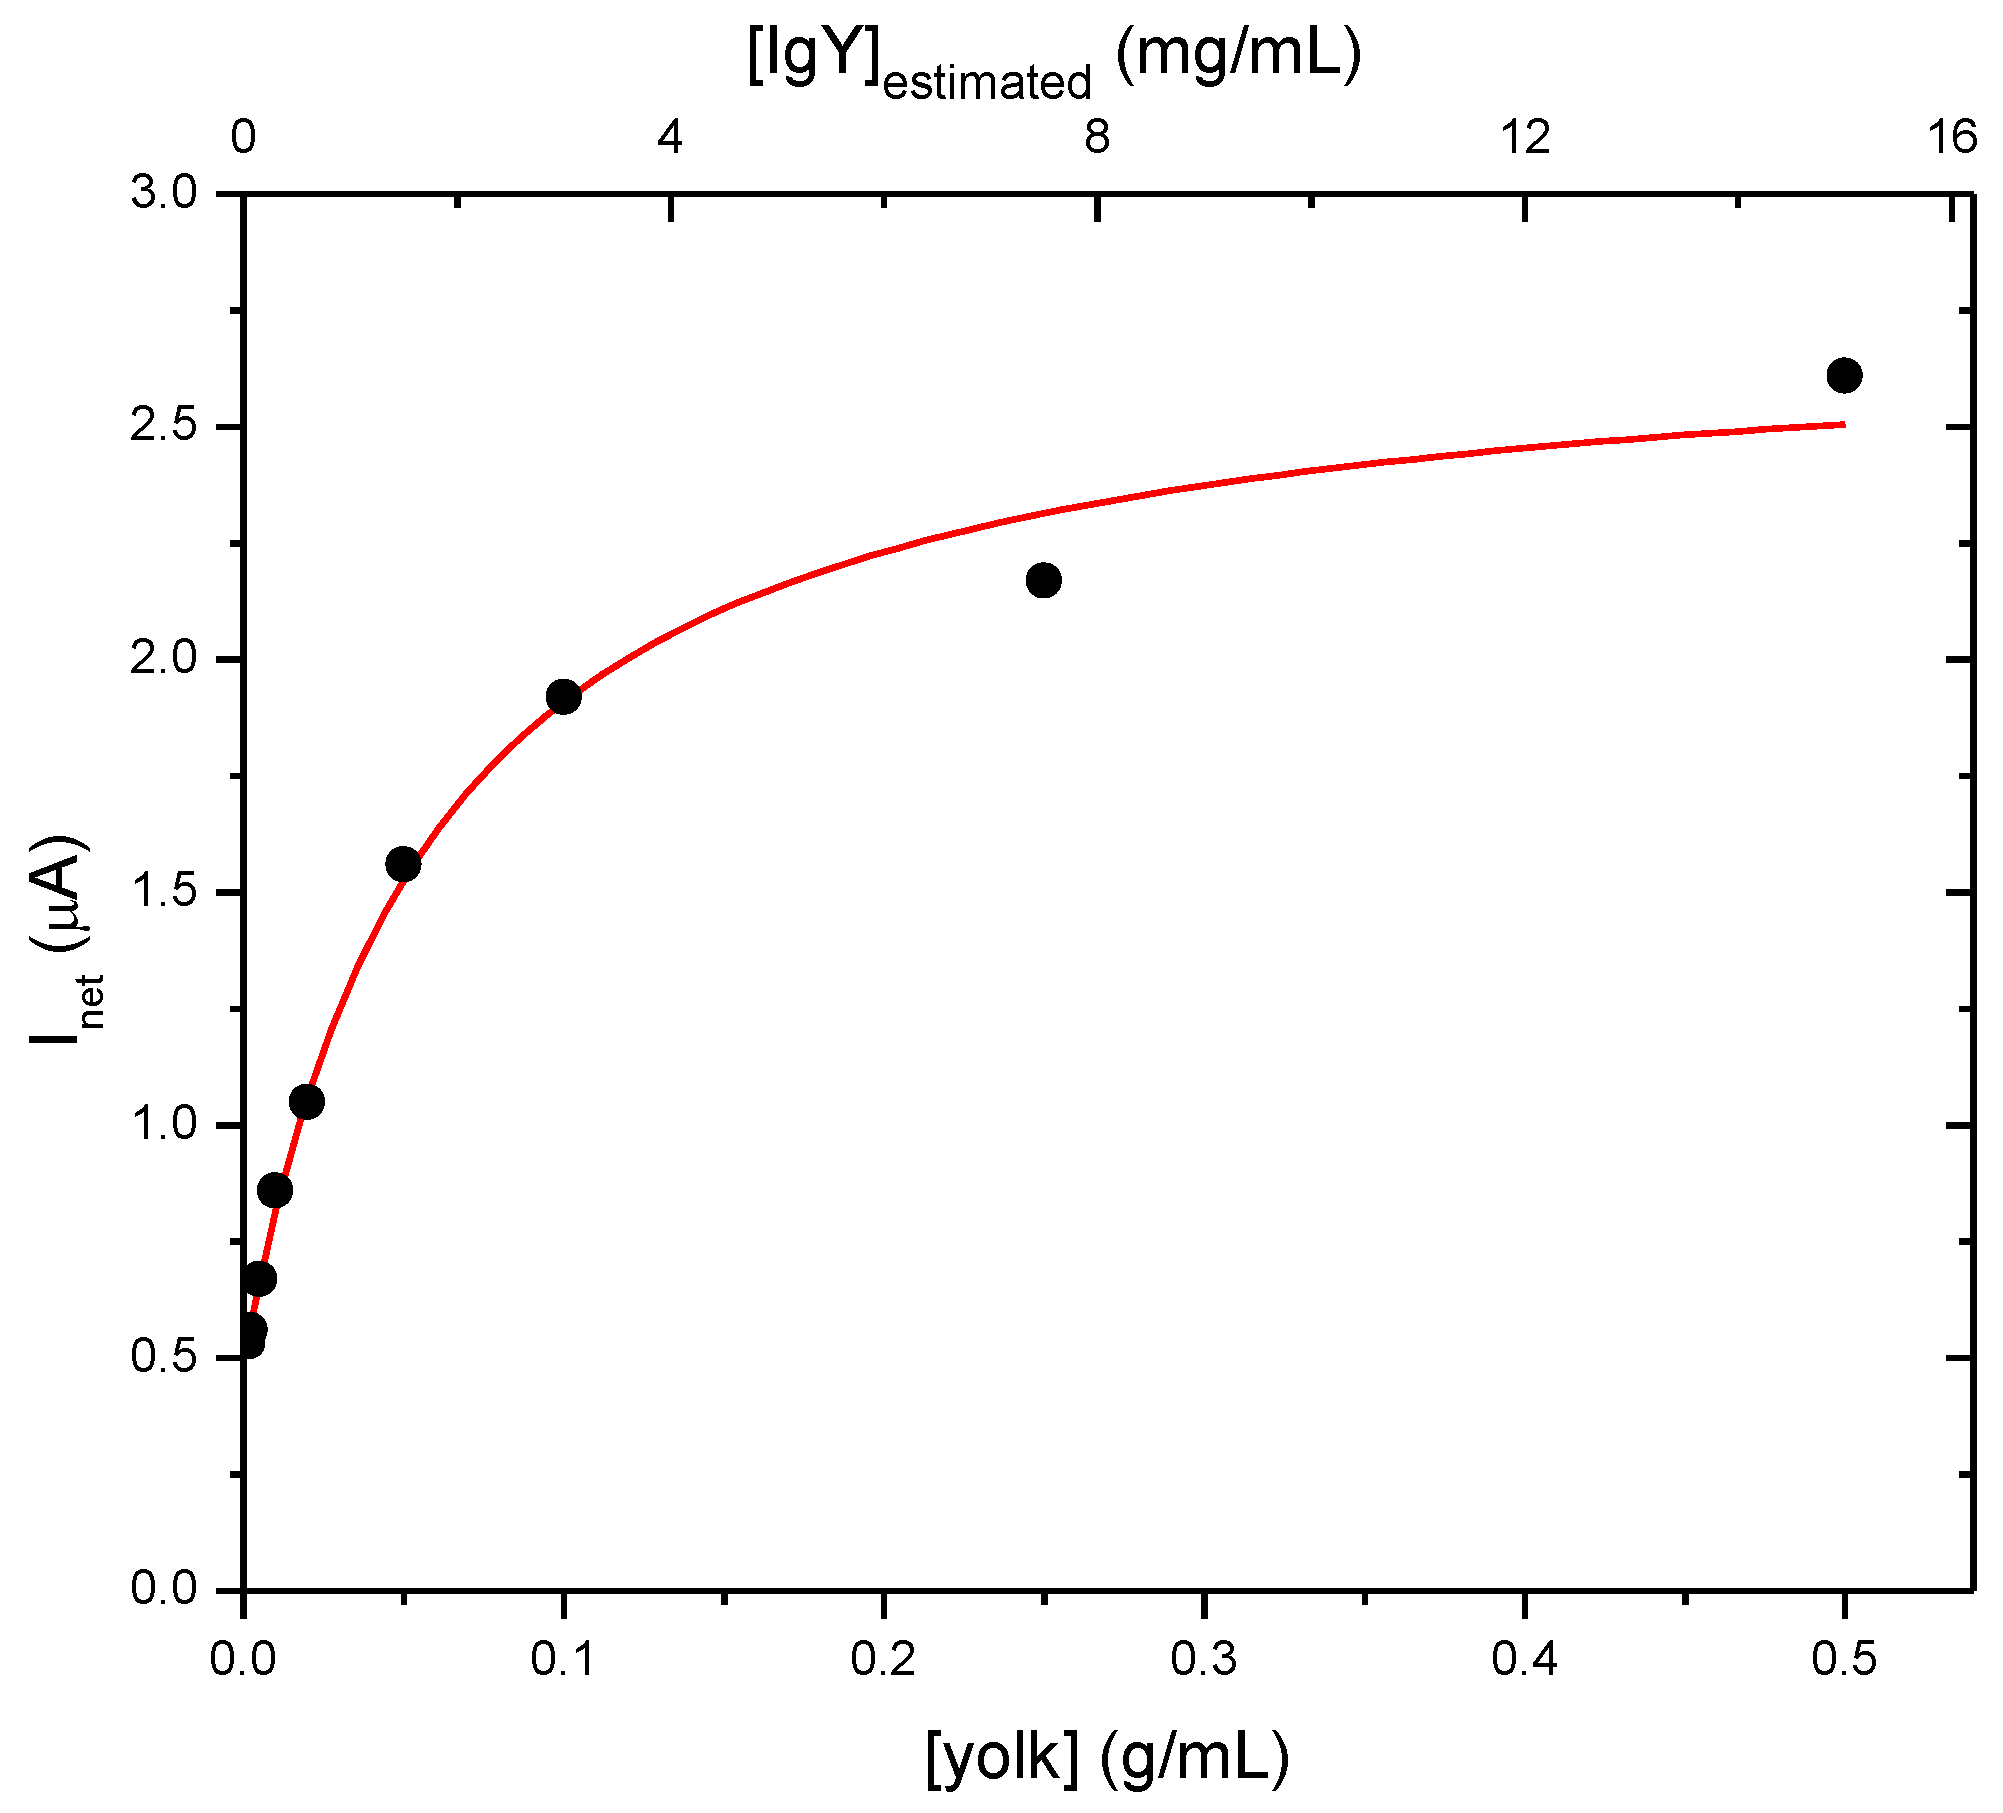
3.2. Determination of IgY in Egg

The immunosensor was applied to analyse samples of fresh eggs, investigating the correlation between the electrocatalytic current and the egg yolk concentration and amount of IgY. The samples described in Table 1 were analyzed and representative CVs are shown in Figure 3. The solid lines CVs, from yellow to red, were recorded in the presence of H2O2 at NEEs incubated in samples containing an increasing amount of IgY. A different NEE was used for each sample and the relative standard deviation of three measurements was 5%. The dotted line CV corresponds to the typical pattern of the mediator MB (at a NEE treated with egg yolk and HRP-anti-IgY) before addition of H2O2.
It is possible to observe that the electrocatalytic current increases with an increasing amount of IgY. Data in Figure 4 show that the dependence of the catalytic current is a function of the yolk content over the entire concentration range examined. It is important to note that the reported current values represent Inet, calculated by Equation (4):
Inet = IEcat − Icat
where Icat is the cathodic peak of MB in the absence of the substrate, IEcat is the electrocatalytic current recorded at −0.40 V, where the current achieved a plateau.
The pattern of the electrocatalytic current increment vs the amount of yolk fits a saturation-like curve, following Equation (5):
y =   a x b + x + c
where the fitting parameters are a = 2.25 µA; b = 0.06 g/mL; c = 0.49 µA, with an R2 value of 0.991. From this curve, it is also possible to define a linear range from 0.002 to 0.05 g/mL of yolk. This trend is in agreement with the one previously observed in Figure S1 of Reference [10]. To define the amount of IgY related to the yolk concentration, semi-quantitative comparison between preliminary SDS-PAGE assays carried out on pure IgY and the electrochemical immunosensor was performed (results not shown). This test suggests that for a yolk concentration of 0.02 g/mL (sample 4 in Table 1—the sample is included in the linear range in Figure 4, lower x-axis) the sensor is able to detect an IgY concentration of 0.06 mg/mL, indicating that almost 3% content of egg yolk can be attributed to IgY and recognized by the immunosensor. Therefore, the concentration of IgY in the linear range considered for the yolk concentration is between 0.06 mg/mL and 1.5 mg/mL. These data are shown also in the upper axis of Figure 4.

3.3. Determination of IgY in Food Integrators

The immunosensor was applied to determine IgY in matrices of industrialized food, by following the same procedure as above, but on freeze-dried food integrators containing only egg yolk or only egg white (see Table 2).
The cyclic voltammograms recorded after the complete procedure performed on the three samples are shown in Figure 5, namely egg white 0.06 g/mL, egg yolk 0.006 g/mL and 0.06 g/mL. In all the cases, an electrocatalytic current is observed. The catalytic current recorded in the presence of egg white (Figure 5 solid-yellow line) is very low and can be ascribed to aspecific adsorption. On the other hand, the same parameter increases dramatically for egg yolk powder, scaling with the amount of food supplement analysed.
By combining electrophoresis (see below) and voltammetric data (see Figure 4), it has been possible to estimate the amount of IgY detected by the immunosensor. Calculations carried out on the most diluted samples suggest a concentration of IgY close to 0.4 mg/mL, correlated to 0.005 g/mL of yolk, while the experimental concentration of the analysed sample is 0.006 g/mL of yolk. The industrial treatments of the eggs probably cause a little damage to the protein structure that involves 20% of the material.

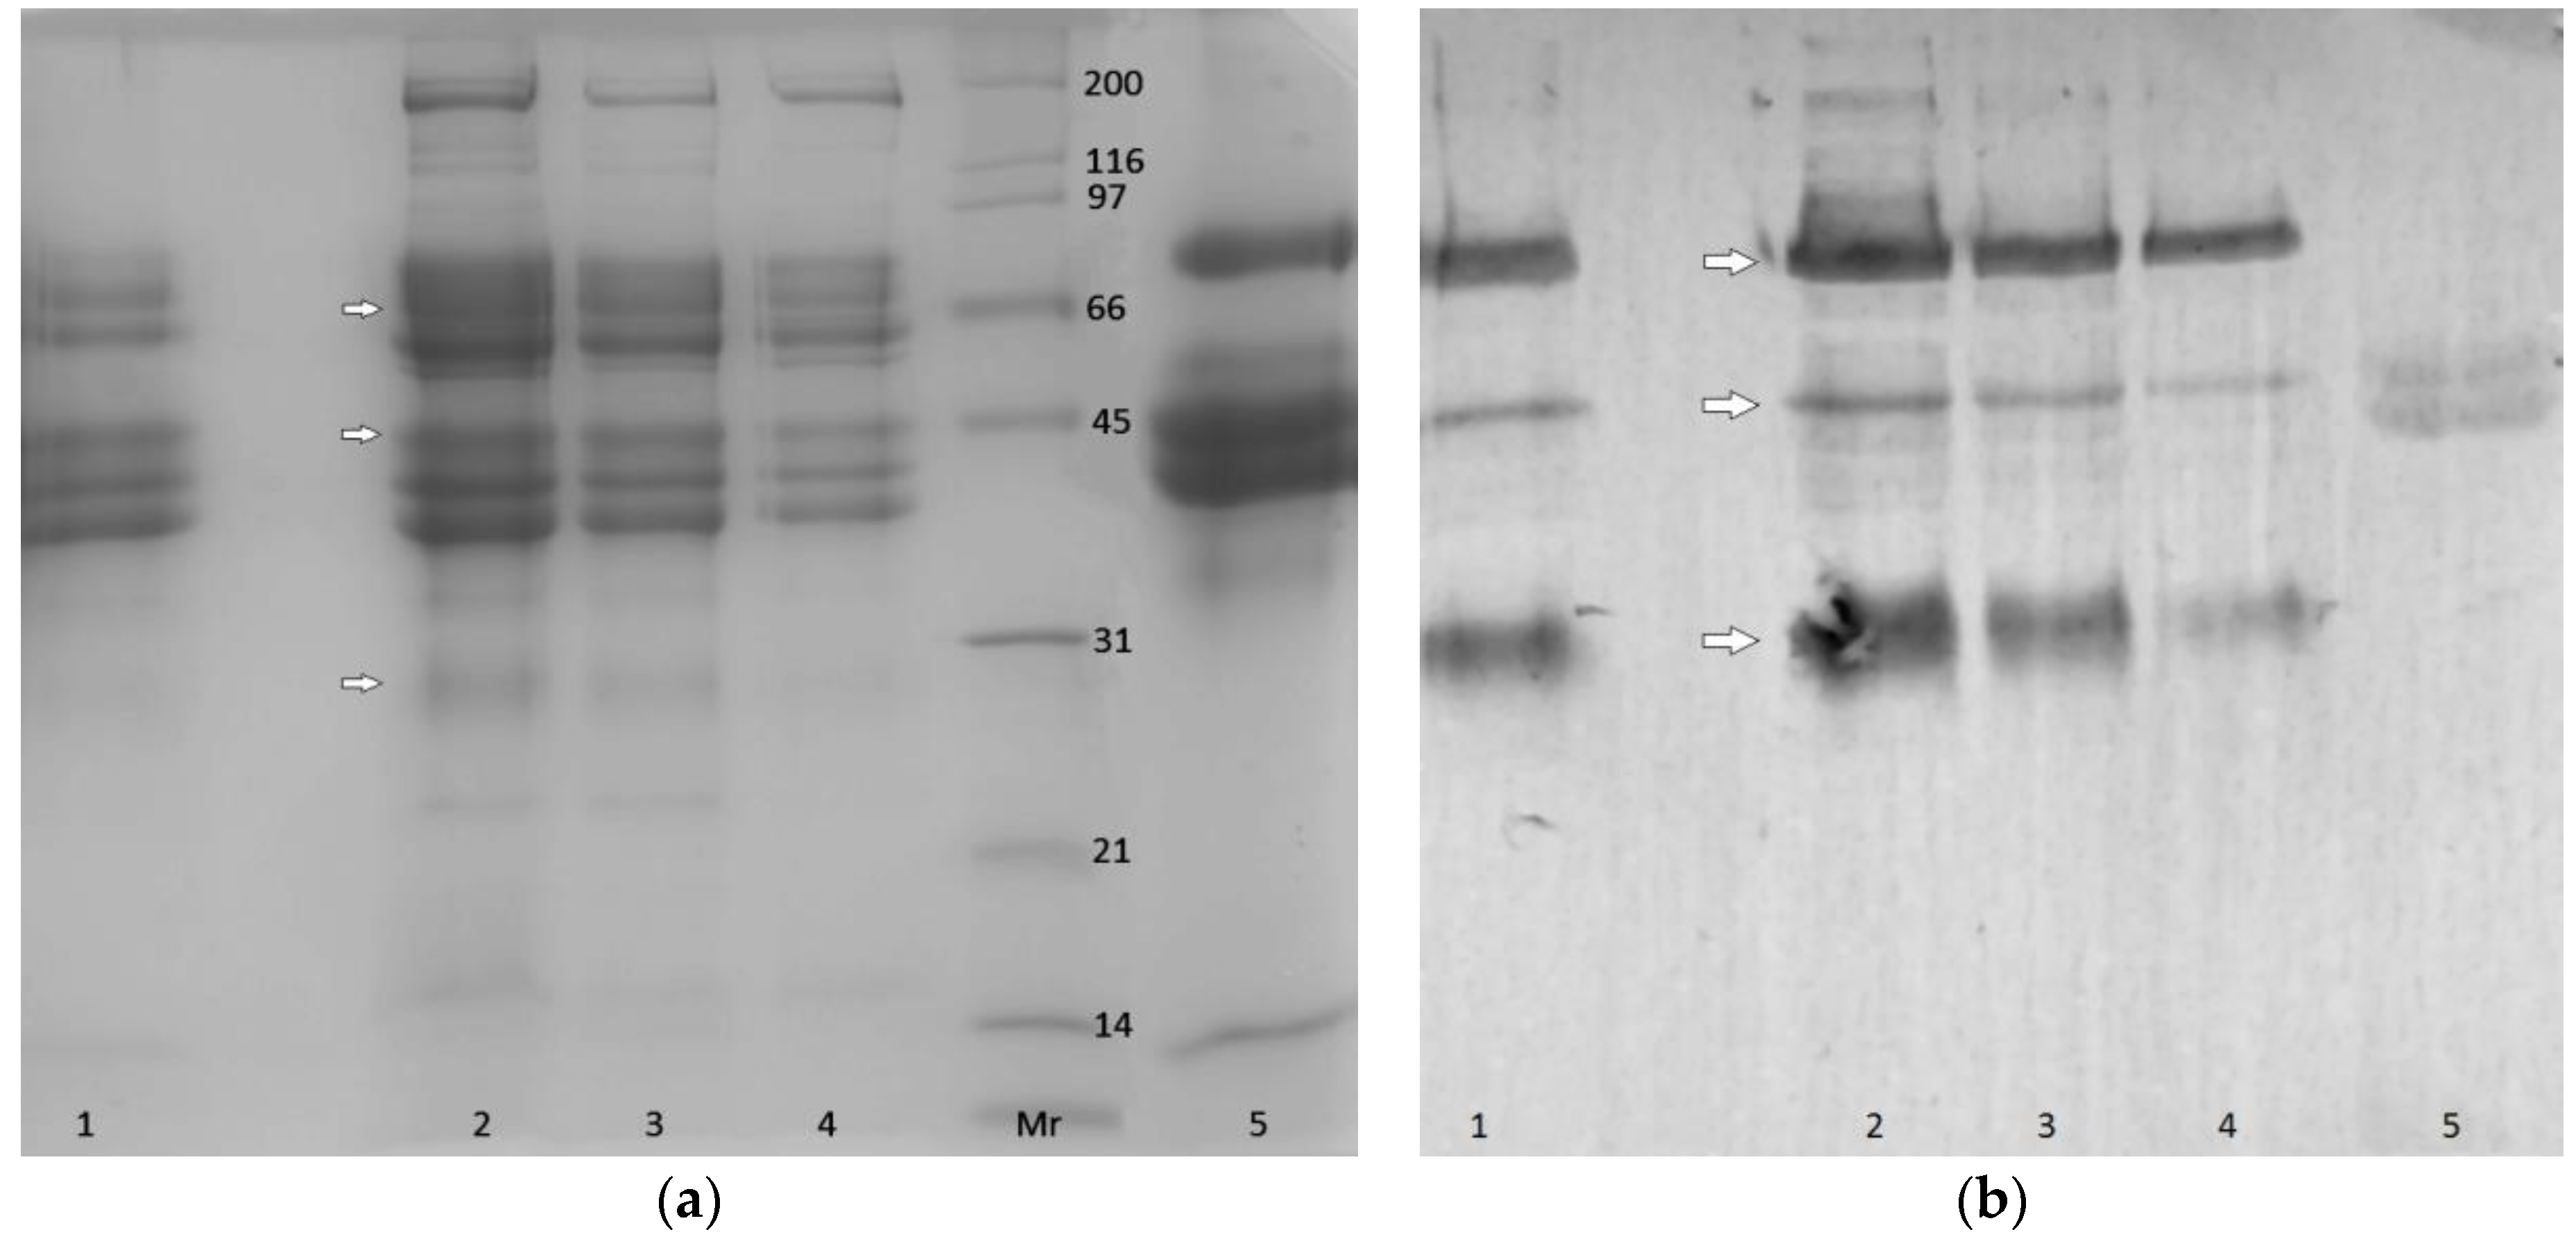
3.4. SDS-PAGE and WB Analysis

The validation of the results obtained with the electrochemical immunosensor was carried out with SDS-PAGE and WB assays. Figure 6a,b shows the SDS-PAGE and WB results, respectively, for some of the samples described in Table 1 and Table 2, containing fresh egg yolk and freeze-died egg yolk. Electrophoresis carried out in reducing conditions should provide two bands that can be correlated with IgY, one corresponding to the heavy chain (HC) and the other to the light chain (LC). Molecular weight of HC and LC of IgY according to literature are 68 and 27 kDa respectively [3]. Figure 6a, lanes 1–4, shows many protein bands, both in the samples containing fresh egg yolk and freeze-dried egg yolk. These bands represent the soluble proteins of the yolk, and considering the complexity of the matrices and the high numbers of proteins present in it, it is difficult to correlate and identify IgY bands. In order to obtain specific results, a WB assay was performed. Secondary antibody anti-IgY identified three IgY bands, as shown in Figure 6b, lanes 1–4. The first band is relevant to the heavy IgY chains and the third one is relevant to the light chains. The band that is intermediate to the first and third ones has not been associated to any fragment or chain of IgY, but is previously observed in the literature [21,22,23,24]. Verifying the correlation between WB and SDS-PAGE bands, it is possible to ascribe a molecular weight to these bands: the HC bands in WB correspond to the 67 kDa band in SDS-PAGE, the LC band corresponds to 28.6 kDa, in good agreement with literature data. The intermediate band corresponds to a Mw of 44 kDa, previously observed but not completely explained in the literature [24].
A sample of egg white was analysed by SDS-PAGE and WB as well. The results are shown in lane 5 in Figure 6a,b. The SDS-PAGE presents at least five bands (Figure 6a), but none of these can be correlated to IgY (since the molecular weight of the bands does not correspond with the ones observed in lanes 1–4), indicating the absence of IgY in egg white. Despite this, the secondary antibody recognises two bands, at Mw around 45 kDa (Figure 6b, lane 5), that can be ascribed to an aspecific interaction between the antibody and an egg white protein present in high concentration in the samples. It is worth noting that this aspecific interaction was observed also with the immunosensor (see Figure 3 in Section 3.2).
It is worth commenting some advantages of the electrochemical proposed method with respect to different methods present in the literature. The combination of NEEs’ high sensitivity and selectivity of the enzyme–substrate interaction allows the detection of IgY in low concentration both in simple and complex matrices. In fact, we have been able to detect 60 µg/mL of IgY in the egg yolk sample with just a simple one step extraction treatment and 0.4 mg/mL of IgY in the sample that has undergone industrial treatment such as freeze-drying. ELISA commercial kits offer the same sensibility (ng/mL), while SDS-PAGE is a bit less sensitive. Other advantages of the proposed method concern the time-consumption and costs of the techniques: the electrochemical procedure is, in fact, shorter than ELISA and definitely shorter than SDS-PAGE and WB procedures. Moreover, thanks to the low amount of chemicals required, the method has a very low cost. Other immunosensors [11,12] based on different principles present higher sensitivity, but are much more complex in the preparation and with high cost, and are not applicable to complex matrices.

4. Conclusions

The proposed electrochemical immunosensor based on gold nanoelectrodes ensemble is suitable to identify immunoglobulin Y in different samples such as fresh eggs and food supplements based on egg components. The reduction of the electrode size with respect to our previous work allowed us to exploit a wide range of analyte concentrations using small amounts of reagents. We observed that the electrocatalytic current generated by the reaction of the enzyme with its substrate follows a saturation-like trend, for a yolk concentration interval of 0.002 to 0.5 g/mL with the possibility of quantitative determination up to approximately 0.1 g/mL. The sensor is also able to identify IgY in complex matrices that have undergone an industrial treatment such as freeze-drying. The method was validated with SDS-PAGE and WB, all the results obtained with the immunosensor were verified, confirming its high sensitivity. The proposed method is fast, reliable and not expensive. Egg white analysed samples generated an almost negligible electrocatalytic current. Since these aspecific interactions were observed also with the Western blot analysis, they can be ascribed to partial aspecificity of the secondary antibody. The large concentration range analysed is comparable to those of other analytical techniques. Coupling the electrochemical immunosensor with SDS-PAGE improved the information obtained in a previous work, demonstrating the good performance of the EC immunosensor and the versatility of NEEs as a platform for different biosensors.

Supplementary Materials

The following are available online at www.mdpi.com/2227-9040/5/1/10/s1.

Author Contributions

C.G. performed all the electrochemical measurements, prepared and functionalized the nanoelectrodes ensembles, wrote the paper draft; E.A. performed the electrophoretic measurements; P.U. proposed the initial idea, discussed the results and corrected the paper draft; L.M.M. supervised the work, discussed the results and wrote the finale version of the paper.

Conflicts of Interest

The authors declare no conflict of interest.

References

  1. Ulrichs, T.; Drotleff, A.M.; Ternes, W. Determination of heat-induced changes in the protein secondary structure of reconstituted livetins (water-soluble proteins from hen’s egg yolk) by FTIR. Food Chem. 2015, 172, 909–920. [Google Scholar] [CrossRef] [PubMed]
  2. Rahman, S.; Nguyen, S.V.; Icatlo, F.C., Jr.; Umeda, K.; Kodama, Y. Oral passive IgY-based immunotherapeutics. Hum. Vaccines Immunother. 2013, 9, 1039–1048. [Google Scholar] [CrossRef] [PubMed]
  3. Santos, F.N.; Brum, B.C.; Cruz, P.B.; Molinaro, C.M.; Silva, V.L.; Chaves, S.A.M. Production and Characterization of IgY against Canine IgG: Prospect of a New Tool for the Immunodiagnostic of Canine Diseases. Braz. Arch. Biol. Technol. 2014, 57, 523–531. [Google Scholar] [CrossRef]
  4. Spillner, E.; Braren, I.; Greunke, K.; Seismann, H.; Blank, S.; du Plessis, D. Avian IgY antibodies and their recombinant equivalents in research, diagnostics and therapy. Biologicals 2012, 40, 313–322. [Google Scholar] [CrossRef] [PubMed]
  5. Kovacs-Nolan, J.; Mine, Y. Egg yolk Antibodies for Passive Immunity. Annu. Rev. Food Sci. Technol. 2012, 3, 163–182. [Google Scholar] [CrossRef] [PubMed]
  6. Murai, A.; Kakiuchi, M.; Hmano, T.; Kobayashi, M.; Tsudzuki, M.; Nakano, M.; Matsuda, Y.; Horio, F. An ELISA for quantifying quail IgY and characterizing maternal IgY transfer to egg yolk in several quail strains. Vet. Immunol. Immunop. 2016, 175, 16–23. [Google Scholar] [CrossRef] [PubMed]
  7. Fassbinder-Orth, C.A.; Wilcoxen, T.E.; Tran, T.; Boughton, R.K.; Fai, J.M.; Hofmeister, E.K.; Grindstaff, J.L.; Owen, G.C. Immunoglobulin detection in wild birds: Effectiveness of three secondary anti-avian IgY antibodies in direct ELISAs in 41 avian species. Methods Ecol. Evol. 2016, 7, 1174–1181. [Google Scholar] [CrossRef] [PubMed]
  8. Potenza, M.; Sabatino, G.; Giambi, F.; Rosi, L.; Papini, A.M.; Dei, L. Analysis of egg-based model wall painting by use of an innovative combined dot-ELISA and UPLC-based approach. Anal. Bioanal. Chem. 2013, 405, 691–701. [Google Scholar] [CrossRef] [PubMed]
  9. Scarano, S.; Carretti, E.; Dei, L.; Baglioni, P.; Minunni, M. Coupling non invasive and fast sampling of proteins from work of art surfaces to surface pasmon resonance biosensing: Differential and simultaneous detection of egg components for cultural heritage diagnosis and conservation. Biosens. Bioelectron. 2016, 85, 83–89. [Google Scholar] [CrossRef] [PubMed]
  10. Bottari, F.; Oliveri, P.; Ugo, P. Electrochemical immunosensor based on ensemble of nanoelectrodes for immunoglobulin IgY detection: Application to identify hen’s egg yolk in tempera paintings. Biosens. Bioelectron. 2014, 52, 403–410. [Google Scholar] [CrossRef] [PubMed] [Green Version]
  11. Wilson, M.S.; Nie, W. Electrochemical Multianalyte Immunoassays Using an Array-Based Sensor. Anal. Chem. 2006, 78, 2507–2513. [Google Scholar] [CrossRef] [PubMed]
  12. Wang, Q.; Fu, X.; Huang, X.; Wu, F.; Ma, M.; Cai, Z. A rapid triple-mode fluorescence switch assay for immunoglobulin detection by using quantum dots-gold nanoparticles nanocomposites. Sens. Actuators B 2016, 231, 779–786. [Google Scholar] [CrossRef]
  13. Wang, Q.; Wu, S.; Ma, M.; Cai, Z. Determination of Egg Yolk Immunoglobulin by Resonance Light Scattering of Affinity-Labeled Au Nanoparticles. Food Anal. Methods 2016, 9, 2052–2059. [Google Scholar] [CrossRef]
  14. Mucelli, S.P.; Zamuner, M.; Tormen, M.; Stanta, G.; Ugo, P. Nanoelectrode ensembles as recognition platform for electrochemical immunosensors. Biosens. Bioelectron. 2008, 23, 1900–1903. [Google Scholar] [CrossRef] [PubMed] [Green Version]
  15. Ongaro, M.; Ugo, P. Bioelectroanalysis with nanoelectrode ensembles and arrays. Anal. Bioanal. Chem. 2013, 405, 3715–3729. [Google Scholar] [CrossRef] [PubMed] [Green Version]
  16. Menon, V.P.; Martin, C.R. Fabrication and evaluation of nanoelectrode ensembles. Anal. Chem. 1995, 67, 1920–1928. [Google Scholar] [CrossRef]
  17. De Leo, M.; Pereira, F.C.; Moretto, L.M.; Scopece, P.; Polizzi, S.; Ugo, P. Towards a better understanding of gold electroless deposition in track-etched templates. Chem. Mater. 2007, 19, 5955–5964. [Google Scholar] [CrossRef] [Green Version]
  18. Gee, S.C.; Bate, I.M.; Thomas, T.M.; Rylatt, D.B. The purification of IgY from chicken egg yolk by preparative electrophoresis. Protein Expr. Purif. 2003, 30, 151–155. [Google Scholar] [CrossRef]
  19. Chang, H.M.; Lu, T.C.; Chen, C.C.; Tu, Y.Y.; Hwang, J.Y. Isolation of Immunoglobulin from Egg Yolk by Anionic Polysaccharides. J. Agric. Food Chem. 2000, 48, 995–999. [Google Scholar] [CrossRef] [PubMed]
  20. Sugita-Konishi, Y.; Shibata, K.; Yun, S.S.; Hara-Kudo, Y.; Yamaguchi, K.; Kumagai, S. Immune Functions of Immunoglobulin Y Isolated from Egg Yolk of Hens Immunized with Various Infectious Bacteria. Biosci. Biotechnol. Biochem. 1996, 60, 886–888. [Google Scholar] [CrossRef] [PubMed]
  21. Laemmli, U.K. Cleavage of structural proteins during the assembly of the head of bacteriophage T4. Nature 1970, 227, 680–685. [Google Scholar] [CrossRef] [PubMed]
  22. Hodek, P.; Trefil, P.; Simunek, J.; Hudecek, J.; Stiborova, M. Optimized Protocol of Chicken Antibody (IgY) PurificationProviding Electrophoretically Homogenous Preparations. Int. J. Electrochem. Sci. 2013, 8, 113–124. [Google Scholar]
  23. Borhani, K.; Mobarez, A.M.; Khabiri, A.R.; Behmanesh, M.; Khoramabadi, N. Production of specific IgY Helicobacter pylori recombinant OipA protein and assessment of its inhibitory effects towards attachment of H. pylori to AGS cell line. Clin. Exp. Vaccine Res. 2015, 4, 177–183. [Google Scholar] [CrossRef] [PubMed]
  24. Pauly, D.; Chacana, P.A.; Calzado, E.G.; Brembs, B.; Schade, R. IgY Technology: Extraction of Chicken Antibodies from Egg Yolk by Polyethylene Glycol (PEG) Precipitation. J. Vis. Exp. 2011. [Google Scholar] [CrossRef] [PubMed]
Scheme 1. Scheme of the immunosensor. IgY from the sample is captured by the PC surface. BSA is the blocking agent. The secondary antibody anti-IgY labeled with HRP recognizes IgY and reacts with the substrate (H2O2) and the redox mediator methylene blue (MB); leucomethylene blue (LB) is the reduced form of MB.
Chemosensors 05 00010 sch001
Figure 1. CVs of 0.1 mM MB in 0.01 M PBS before the functionalization (dotted-black line), after the complete functionalization of the NEE (dashed-blue line) and after the addition of 0.5 mM of the enzyme substrate (H2O2) (solid-red line). Scan rate 10 mV/s.
Chemosensors 05 00010 g001
Figure 2. CVs of 0.1 mM MB in 0.01 M PBS before the functionalization (dotted-black line), after the complete functionalization of the NEE with rabbit glue as the analyte (dashed-blue line) and after addition of 0.5 mM H2O2 (solid-red line). Scan rate: 10 mV/s.
Chemosensors 05 00010 g002
Figure 3. CVs of 0.1 mM MB in 0.01 M PBS in the absence (dashed-blue line) and in the presence of 0.5 mM H2O2 at NEEs incubated with egg yolk at a concentration from 0.002 g/mL to 0.5 g/mL of yolk (solid-lines from light yellow to red). Scan rate 10 mV/s.
Chemosensors 05 00010 g003
Figure 4. Electrocatalytic current vs. the concentration of yolk (lower x-axis) and versus the relevant estimated IgY concentration (upper x-axis), and best fitting curve. The curve can be used to quantify the IgY concentration.
Chemosensors 05 00010 g004
Figure 5. CVs of 0.1 mM MB in 0.01 M PBS recorded at 10 mV/s before (dashed-blue lines) and after addition (solid lines) of 0.5 mM H2O2 for the following samples: 0.06 g/mL egg white powder (full-yellow line), 0.006 g/mL egg yolk powder (full-orange line) and 0.06 g/mL egg yolk powder (full-red line).
Chemosensors 05 00010 g005
Figure 6. (a) SDS-PAGE results for the following samples: (1) freeze-dried yolk, 0.006 g/mL; (2–4) egg yolk samples 0.02 mg/mL, 0.01 mg/mL, 0.005 mg/mL, respectively; (5) egg white 0.02 mg/mL; Mr = marker. The values indicated in the marker lane correspond to the MW expressed in kDa; (b) Results of the WB, with the samples in the same order as in (a). The arrows indicate the lines considered.
Chemosensors 05 00010 g006
Table 1. Description of the analysed samples from fresh egg.
Sample(Egg Yolk) g/mL
Egg white //
Egg Yolk10.002
20.005
30.01
40.02
50.05
60.1
70.25
80.5
Table 2. Description of the freeze-dried samples.
SamplePowder (g)Acetate Buffer pH: 5 (mL)(Egg Yolk) g/mLProtein Content * (%)
Egg White Powder1.525079
Egg Yolk Powder1.5250.0635
Egg Yolk Powder1.52500.00635
* Protein content declared by the producer.

