Review

Label-Free Biosensors Based onto Monolithically Integrated onto Silicon Optical Transducers

by
Michailia Angelopoulou
,
Sotirios Kakabakos
and
Panagiota Petrou
*
Immunoassay/Immunosensors Lab, Institute of Nuclear & Radiological Sciences & Technology, Energy & Safety, NCSR “Demokritos”, 15310 Athens, Greece
*
Author to whom correspondence should be addressed.
Chemosensors 2018, 6(4), 52; https://doi.org/10.3390/chemosensors6040052
Submission received: 13 September 2018 / Revised: 2 November 2018 / Accepted: 6 November 2018 / Published: 12 November 2018
(This article belongs to the Special Issue Label-Free Biosensors and Chemical Sensors)

Abstract

:
The article reviews the current status of label-free integrated optical biosensors focusing on the evolution over the years of their analytical performance. At first, a short introduction to the evanescent wave optics is provided followed by detailed description of the main categories of label-free optical biosensors, including sensors based on surface plasmon resonance (SPR), grating couplers, photonic crystals, ring resonators, and interferometric transducers. For each type of biosensor, the detection principle is first provided followed by description of the different transducer configurations so far developed and their performance as biosensors. Finally, a short discussion about the current limitations and future perspectives of integrated label-free optical biosensors is provided.

1. Introduction

Starting more than 50 years ago from the report of Clark and Lyons [1], biosensors have been the subject of intensive research efforts, but also of numerous attempts of commercial exploitation aiming to overcome the limitations of classical analytical systems and provide solutions for on-site determinations. The research effort has generated over the years an enormous variety of biosensors considering the multiple variations of the more popular ones, such potentiometric or the surface plasmon resonance based sensors [2]. Nonetheless, with respect to the transduction principle, most of the biosensors reported in the literature can fall into one of the following categories: Mass-sensitive, electrochemical, or optical sensors.
Regardless of the transduction principle implemented, biosensors can also be divided into two categories depending on the implementation or not of labels for the analyte determination. Biosensors employing labels are in general more sensitive than the label-free ones, reaching, in some cases, the ultimate detection limit of a single analyte molecule [3]. They are also, generally, more suited for laboratory applications due to the size and complexity of the relative instrumentation. Even so, nowadays, taking advantage of the advances in microfluidic miniaturization and cell phone technology (especially of cell phones capabilities for illumination, imaging, and/or data transfer), portable instruments based on sensing systems employing labels have started to emerge [4,5]. Portable systems are no longer restricted to electrochemical transducers, for which miniaturization of both the sensing element and the instrumentation is more straightforward compared to other transducers, but has been extended to optical ones, the miniaturization of which is hindered by the need to use external light sources and detectors. Despite these advances, the portable systems so far that have been developed based on optical transduction principles are lacking in analytical sensitivity compared to the respective laboratory systems, a fact that restricts to a great extent the potential applications.
On the other hand, label-free optical biosensing systems have also evolved throughout the years, especially concerning their analytical performance, demonstrating, in some cases, detection sensitivities similar to those offered by optical biosensors employing labels [6,7]. This is mainly the result of the progress made the last two decades in the field of nanotechnology, which has given a significant boost in label-free biosensors since it provided viable solutions to long standing bottlenecks, such as the amplification of minute signal changes as well as the realization of compact devices encompassing the transducer along with all the necessary electrical and/or optical connections onto the same chip [6,7,8]. Apart from the quest for outstanding analytical performance, effort has also been devoted to the realization of multiplexed determinations due to the inherent advantage of optical biosensors of reduced cross-over signals as opposed to electrochemical ones [6,7]. This has led to efforts towards applying them for sensing of multiple targets simultaneously (multiplexed sensing), which can help their spread in diverse fields, including the commercial market [6,7,8].
Despite their versatility, the majority of the label-free optical biosensors rely on the same detection principle, namely the evanescent field optics. Therefore, prior to analysing the main current trends regarding label-free optical biosensors, a simplified description of the evanescent field optics principle will be provided. Then, after a short reference to surface plasmon resonance transduction approaches, the review will focus on the integrated optical sensors, especially those based on (a) grating couplers, (b) photonic crystals, (c) ring resonators, and (d) interferometers, including Mach–Zehnder, Young, and bi-modal interferometers. In the last section, monolithically integrated broad-band interferometric transducers will be presented in more detail, and the review will conclude with a comparison of the presented sensors and a brief discussion about the future of integrated optical transducers.

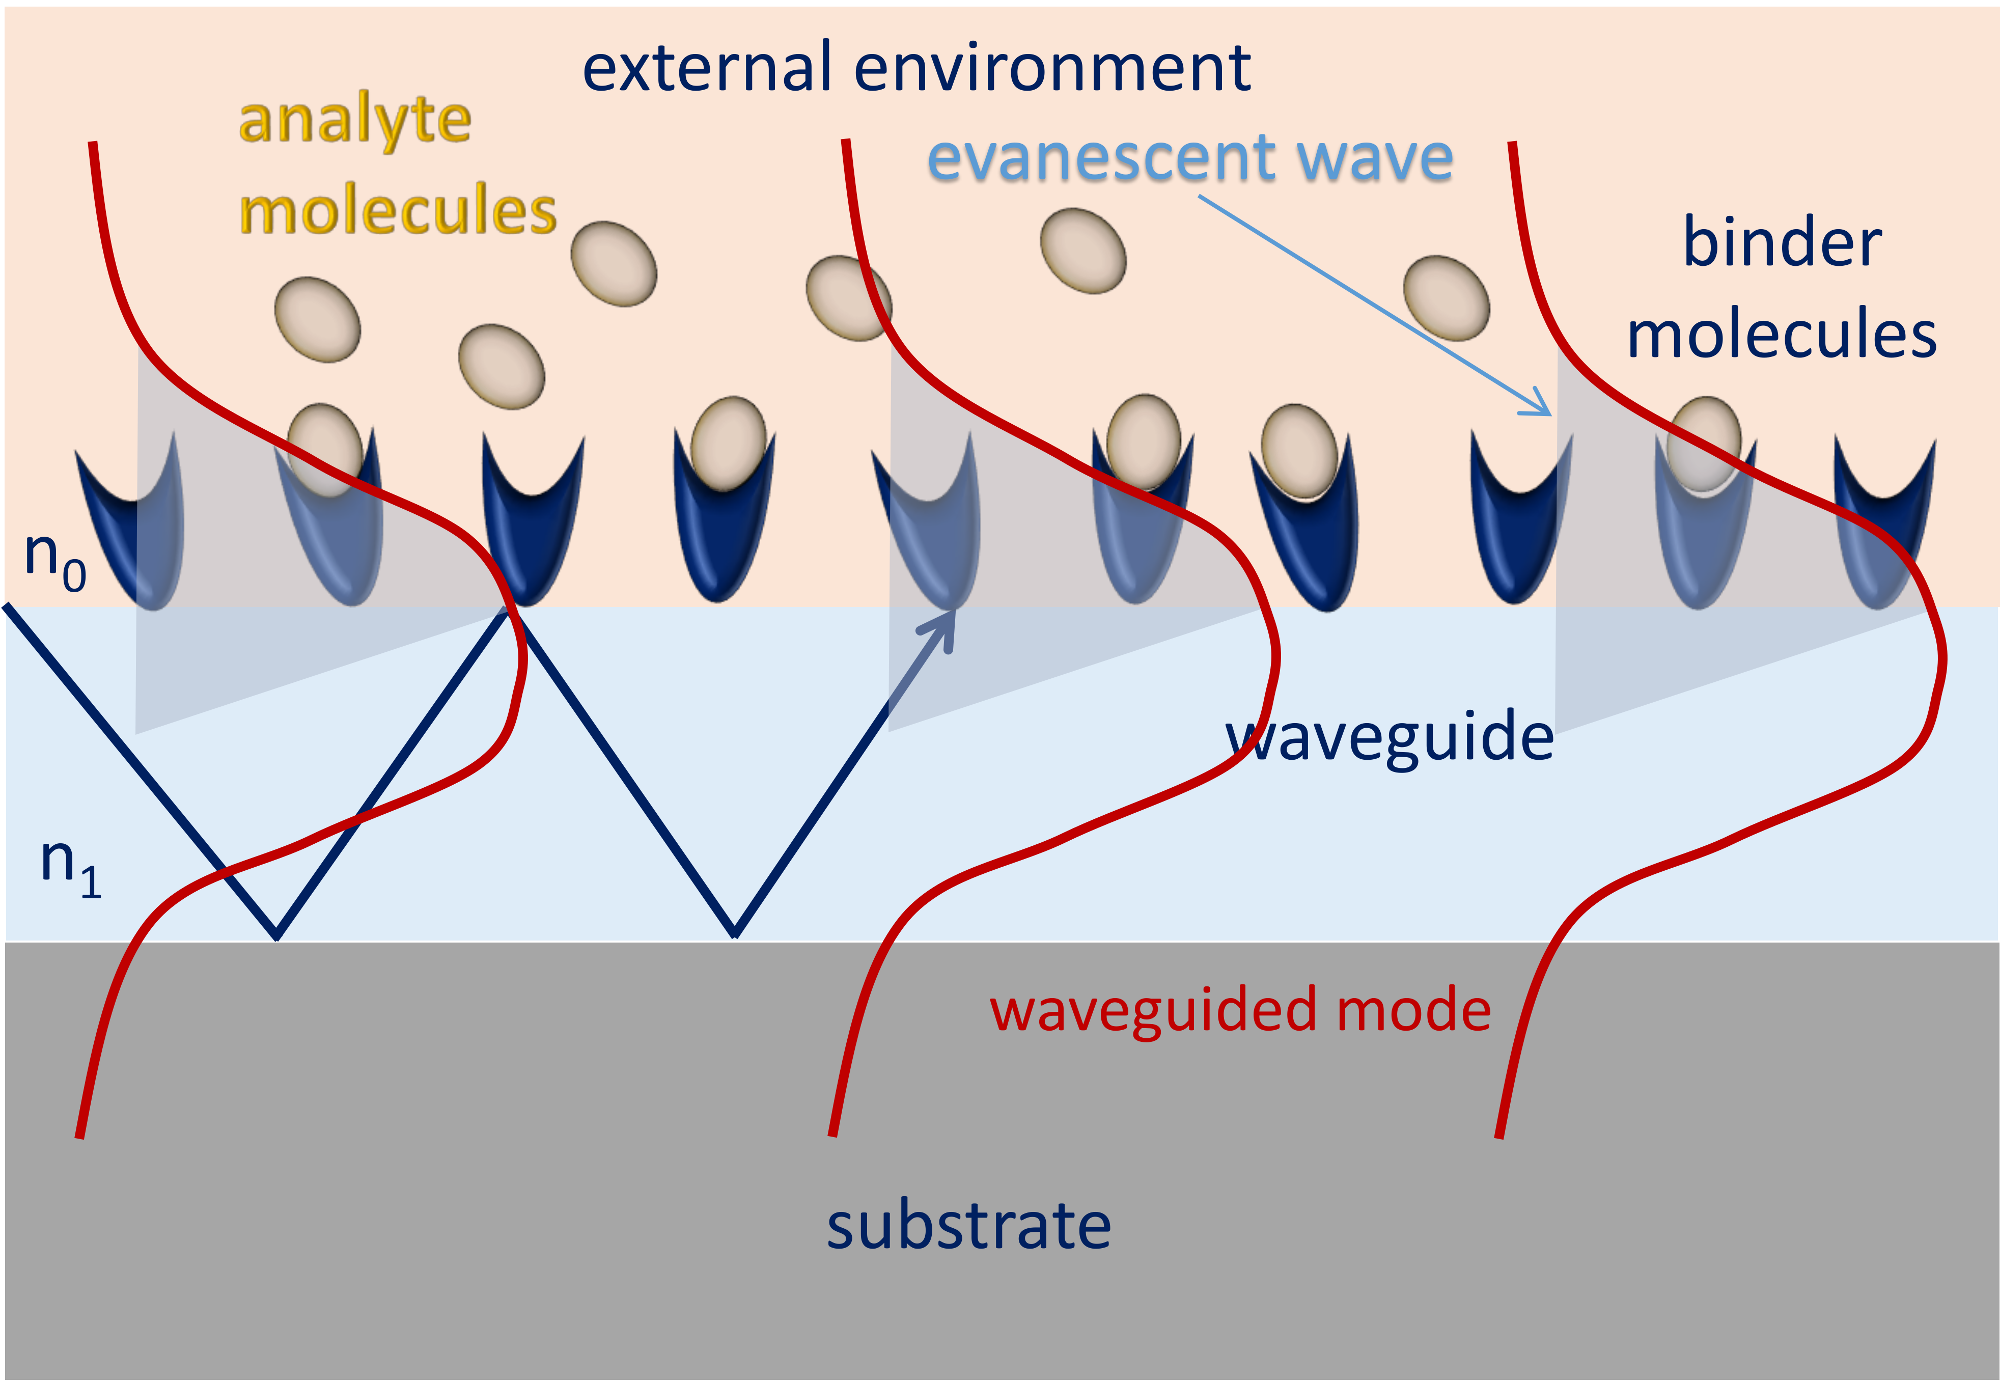
2. Evanescent Field Optics

The evanescent field is generated by the electromagnetic field of light as it transverses a waveguide by means of total internal reflection. The main characteristic of the evanescent field (Figure 1) is that its effect decays exponentially in the medium above the transducer surface. Usually, the evanescent field effect extends to a depth ranging from a few tens to a few hundreds of nanometers depending on the material and the waveguide geometry. Nonetheless, this field is very sensitive to alterations in the refractive index on the transducer surface and can thus “sense” the interaction of a binder immobilized onto the transducer surface with its counterpart molecule/analyte present on the medium over the transducer. More specifically, the binding of the analyte to the immobilized binder molecules induces a change in the effective refractive index on top of the optical transducer, which affects the light guiding properties of the transducer, resulting in some change of the output beam in terms of intensity, polarization, phase, etc. Thus, it is feasible to monitor binding interactions without the need for labels taking advantage of the evanescent field sensitivity to effective refractive index alterations.
Transducers based on evanescent wave field optics have acquired over the years various formats. Nonetheless, the major categories of these sensors include sensor plasmon resonance (SPR), fiber optic, grating coupler, photonic crystal, ring resonator, and interferometric sensors.
SPR is the most widely explored label-free detection principle [8]. Surface plasmons are generated when an electromagnetic wave propagates at the interface between a noble metal thin layer (usually gold) and a dielectric with oppositely signed optical constants. This electromagnetic field creates evanescent waves that penetrate into both adjacent layers. Plasmons are usually excited by means of a light beam guided to the metal/dielectric through a coupling prism, a grating coupler, or a dielectric waveguide (Figure 2a). By changing the angle or the wavelength of the incident light, resonance is achieved when the propagation constant of the evanescent filed matches that of the surface plasmon wave. This angle is influenced by changes in the refractive index of the medium over the dielectric surface. Thus, by monitoring the change of resonance angle or wavelength when binding reactions are taking place onto the dielectric layer, the course of the reaction can be monitored in real-time. Nonetheless, the need for input and output light coupling elements limits considerably the ability for miniaturization and multi-analyte determinations of the classical SPR set-ups. Although multiplexity has to some extent been fulfilled by the development of imaging SPR, miniaturization remains a great challenge.
To this end, sensing approaches based on localized SPR (LSPR) might provide the desired solution [5]. In LSPR, instead of a continuous noble element layer, metallic nanostructures of a sub-wavelength size (in the form of nanospheres, nanorods, or nanodisks) are created on the dielectric layer. Thus, when the light beam strikes at these nanostructures, the free electrons oscillate collectively, scattering light of a specific wavelength range for which resonance is achieved. A schematic of the LSPR detection is provided in Figure 2b. As in the classical SPR, binding reactions can be monitored in real-time, since the associated changes in the refractive index of medium over the nanostructures causes a shift at the extinction peak wavelength [6]. Due to the fact that each nanostructure is potentially an individual sensing element, the multiplexing capabilities of LSPR sensors become apparent. Even so, LSPR sensors still lack in sensitivity compared to classical SPR [9,10,11] that has demonstrated sensitivity resolution in the range between 10−5 to 10−7 of refractive index units (RIU), while LSPR sensors has so far demonstrated a sensitivity resolution in the 10−4 to 10−6 range [12], regarding bulk refractive index changes detection. Despite that, reports show that LSPR can demonstrate the same detection sensitivity as classical SPR in certain biosensing applications [13,14,15], especially at low analyte concentrations, a finding that might be related to the strong confinement of the LSPR field in the proximity of the nanostructures. Thus, while in classical SPR the evanescent wave field expands a few hundreds of nanometers into the sensor surrounding medium; in the case of LSPR, the electromagnetic field is limited to only a few nanometers from the surface [16]. As a result, SPR might be more sensitive to bulk refractive index changes, but LSPR might be equally efficient in monitoring changes that occur in the close proximity of the surface [16]. As LSPR is a sensing technique widely explored currently, the full capabilities and limitations of this technique are still to be witnessed in the future.
Another configuration of sensors based on the SPR phenomenon relies on metal layers with nanohole arrays [17,18,19]. Although this configuration did not provide for higher detection resolution as compared to standard SPR, it offers increased potential for multiplexing and miniaturization [18,19]. In addition, it facilitates fluidic integration since the nanoholes can act as nanochannels or a “nano-drain”, allowing the flow-through of the reagents and the concentration of biomolecules in the nanoholes, thus improving detection sensitivity [20,21,22]. Another advantage of these sensors is the fact that they can be fabricated with mass-production compatible processes, such as nanoimprint lithography [19,20,21,22], leading to highly reproducible structures that fulfil the requirements of a commercial product. Regarding their application as biosensors, plasmonic nanohole arrays have been used for the determination of the binding kinetics of cholera toxin b to sensors coated with a biomimetic supported lipid membrane containing ganglioside receptors using toxin concentrations as low as 8.4 nM [19], as well as for the direct detection of different types of live viruses (vesicular stomatitis virus, PT-Ebola, and Vaccinia) using sensors functionalized with specific antiviral antibodies [23] (see Figure 3). The latter sensor provided a dynamic range over three orders of magnitude (106–109 PFU/mL) and a projected detection limit of 105 PFU/mL in biologically relevant media, proving the feasibility of its application for detection of viruses directly in human blood.
Looking at the other categories of evanescent field based sensors, i.e., grating coupler, photonic crystal, ring resonator, and interferometric sensors, one can deduce that those based on integrated optics can be more easily down-sized and integrated with the necessary external optical components and fluidics. To the advantages of these sensors, one could count the compatibility of the materials used (silicon, glass, quartz, polymers, etc.) with well-established microfabrication procedures that allow the creation of arrays of sensors with repeatable operational characteristics suitable for multiplex analyses without excessive increase of the complexity and cost of the fabrication.
In the following section, the main categories of integrated optical sensors i.e., grating-couplers, photonic crystals, microring resonators, and interferometers, will be discussed, focusing on the progress and the achievements reported in the last years rather than the particulars of their detection principles. Thus, the improvements of the analytical performance for each sensor category will be presented along with the challenges faced in their application in real-life scenarios as well as the capabilities of each approach for multiplexed analysis and evolution to analytical platforms for on-site determinations. Due to the fact that in each report, a different binding reaction might be used to evaluate the analytical performance of the presented sensor, the detection limit expressed as RIU or as surface mass density (g/mm2) will be used as comparison criterion whenever possible.

3. Integrated Optical Sensors

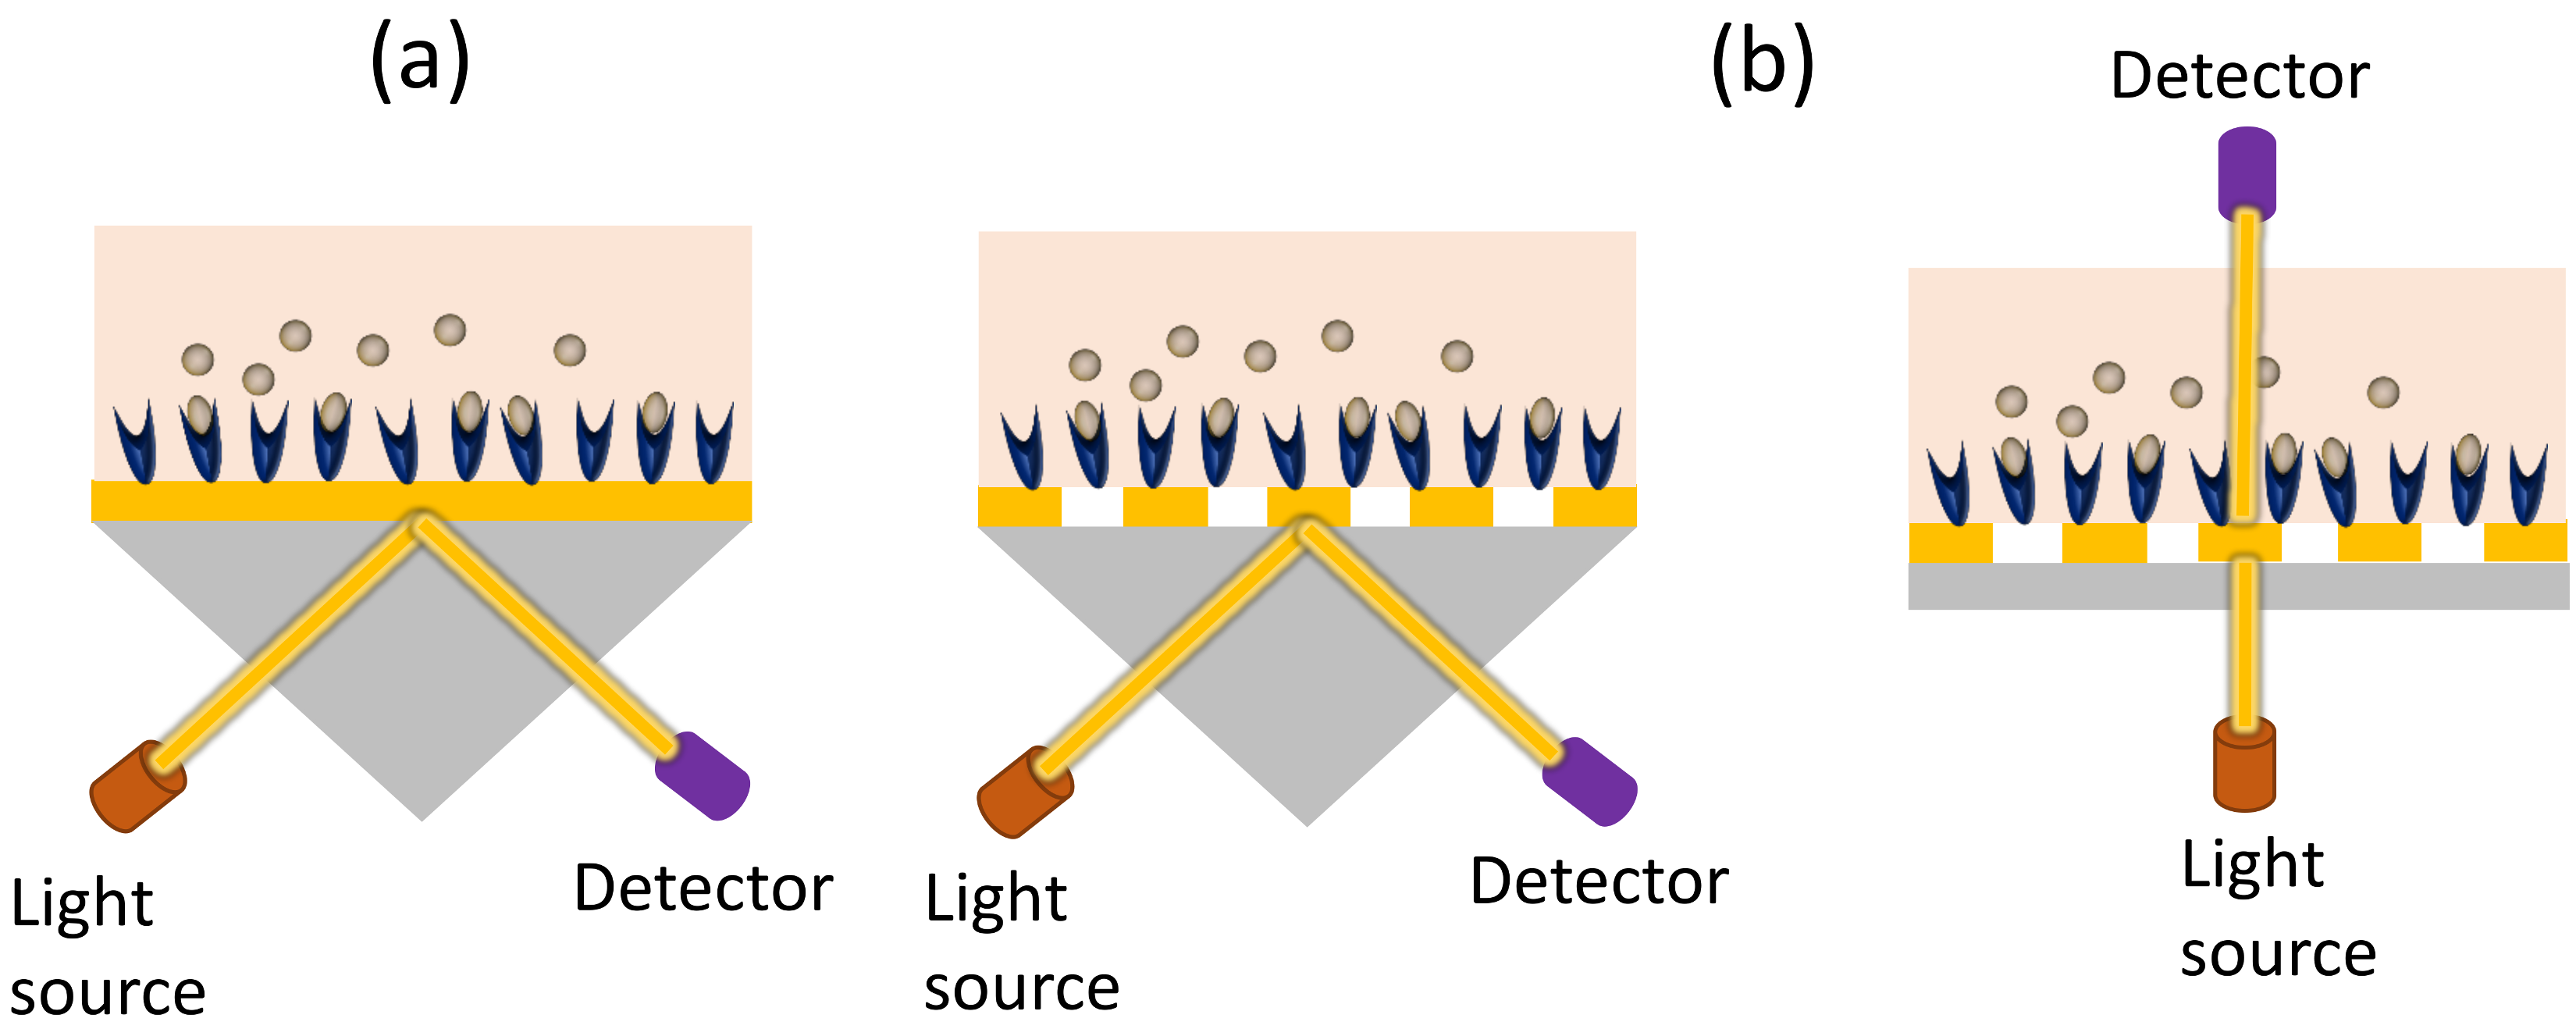
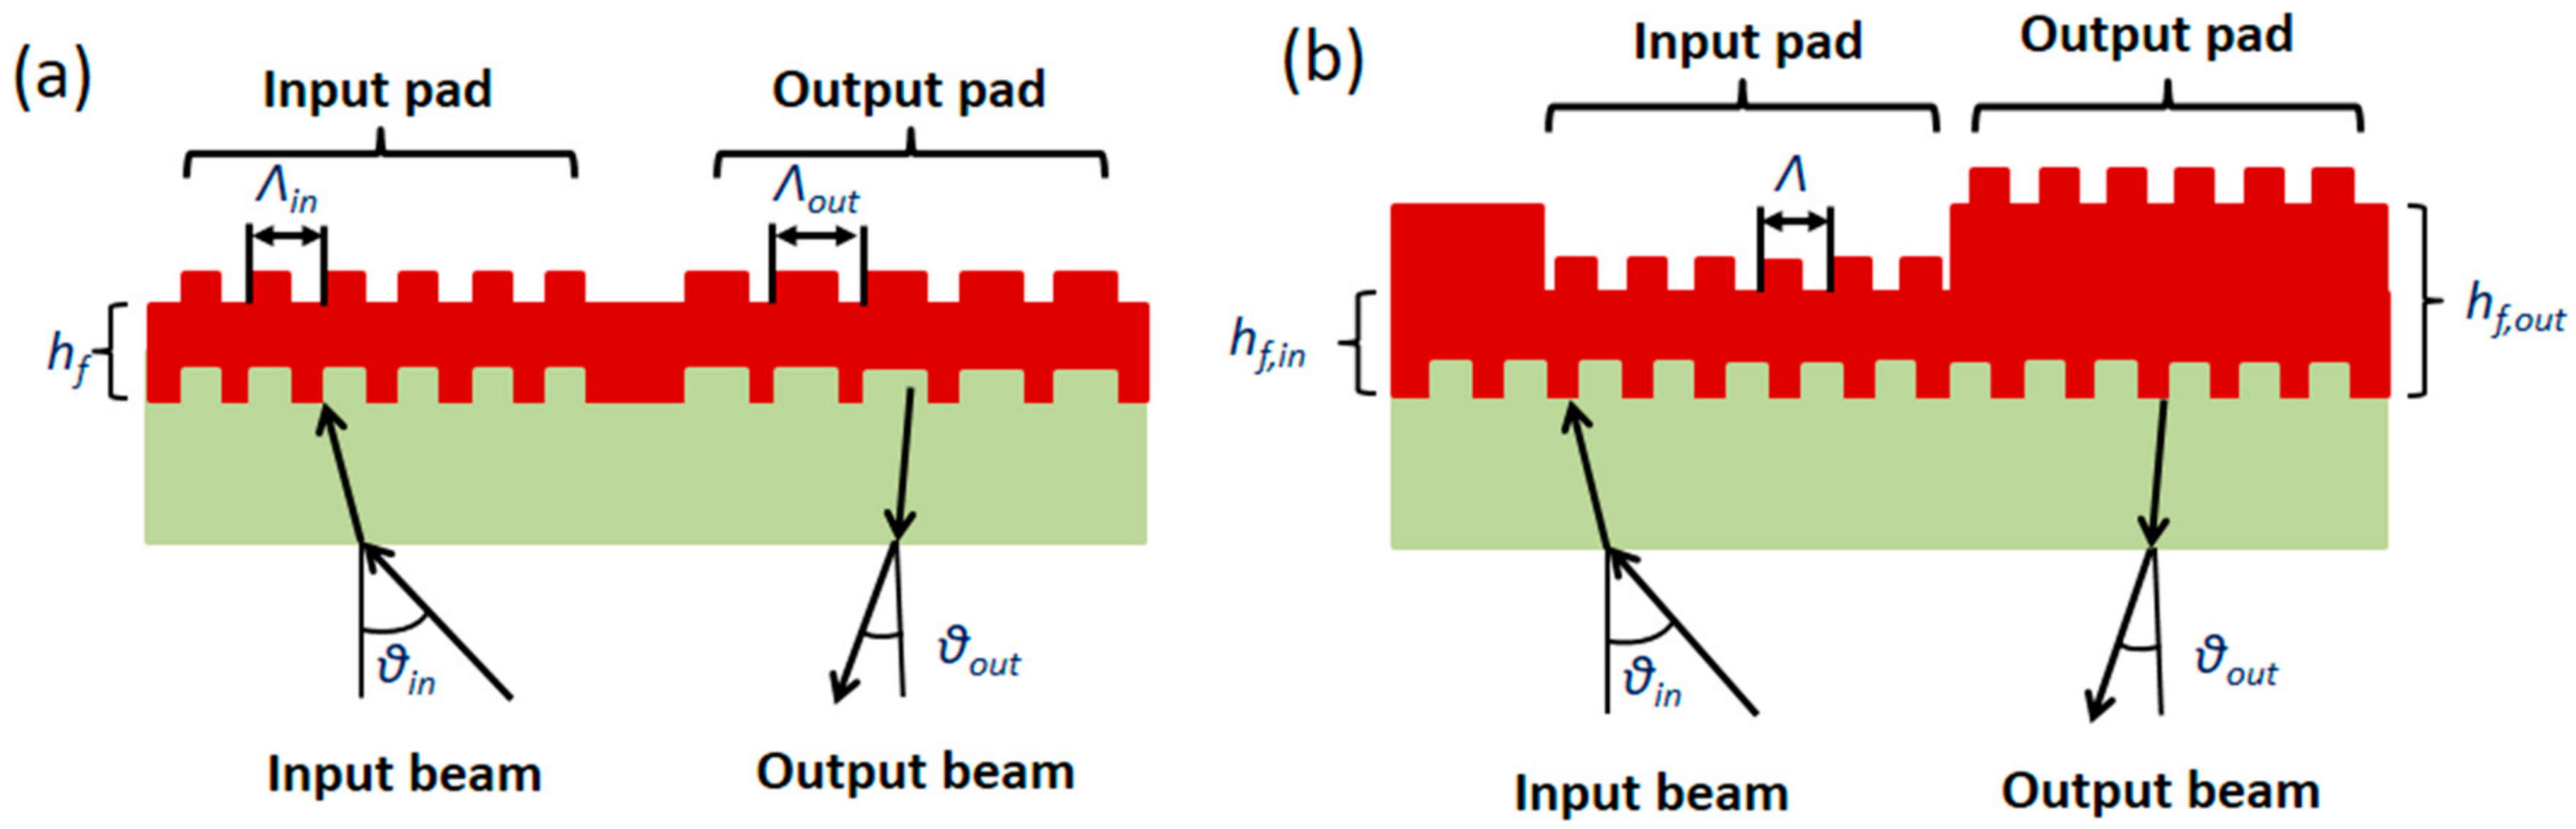
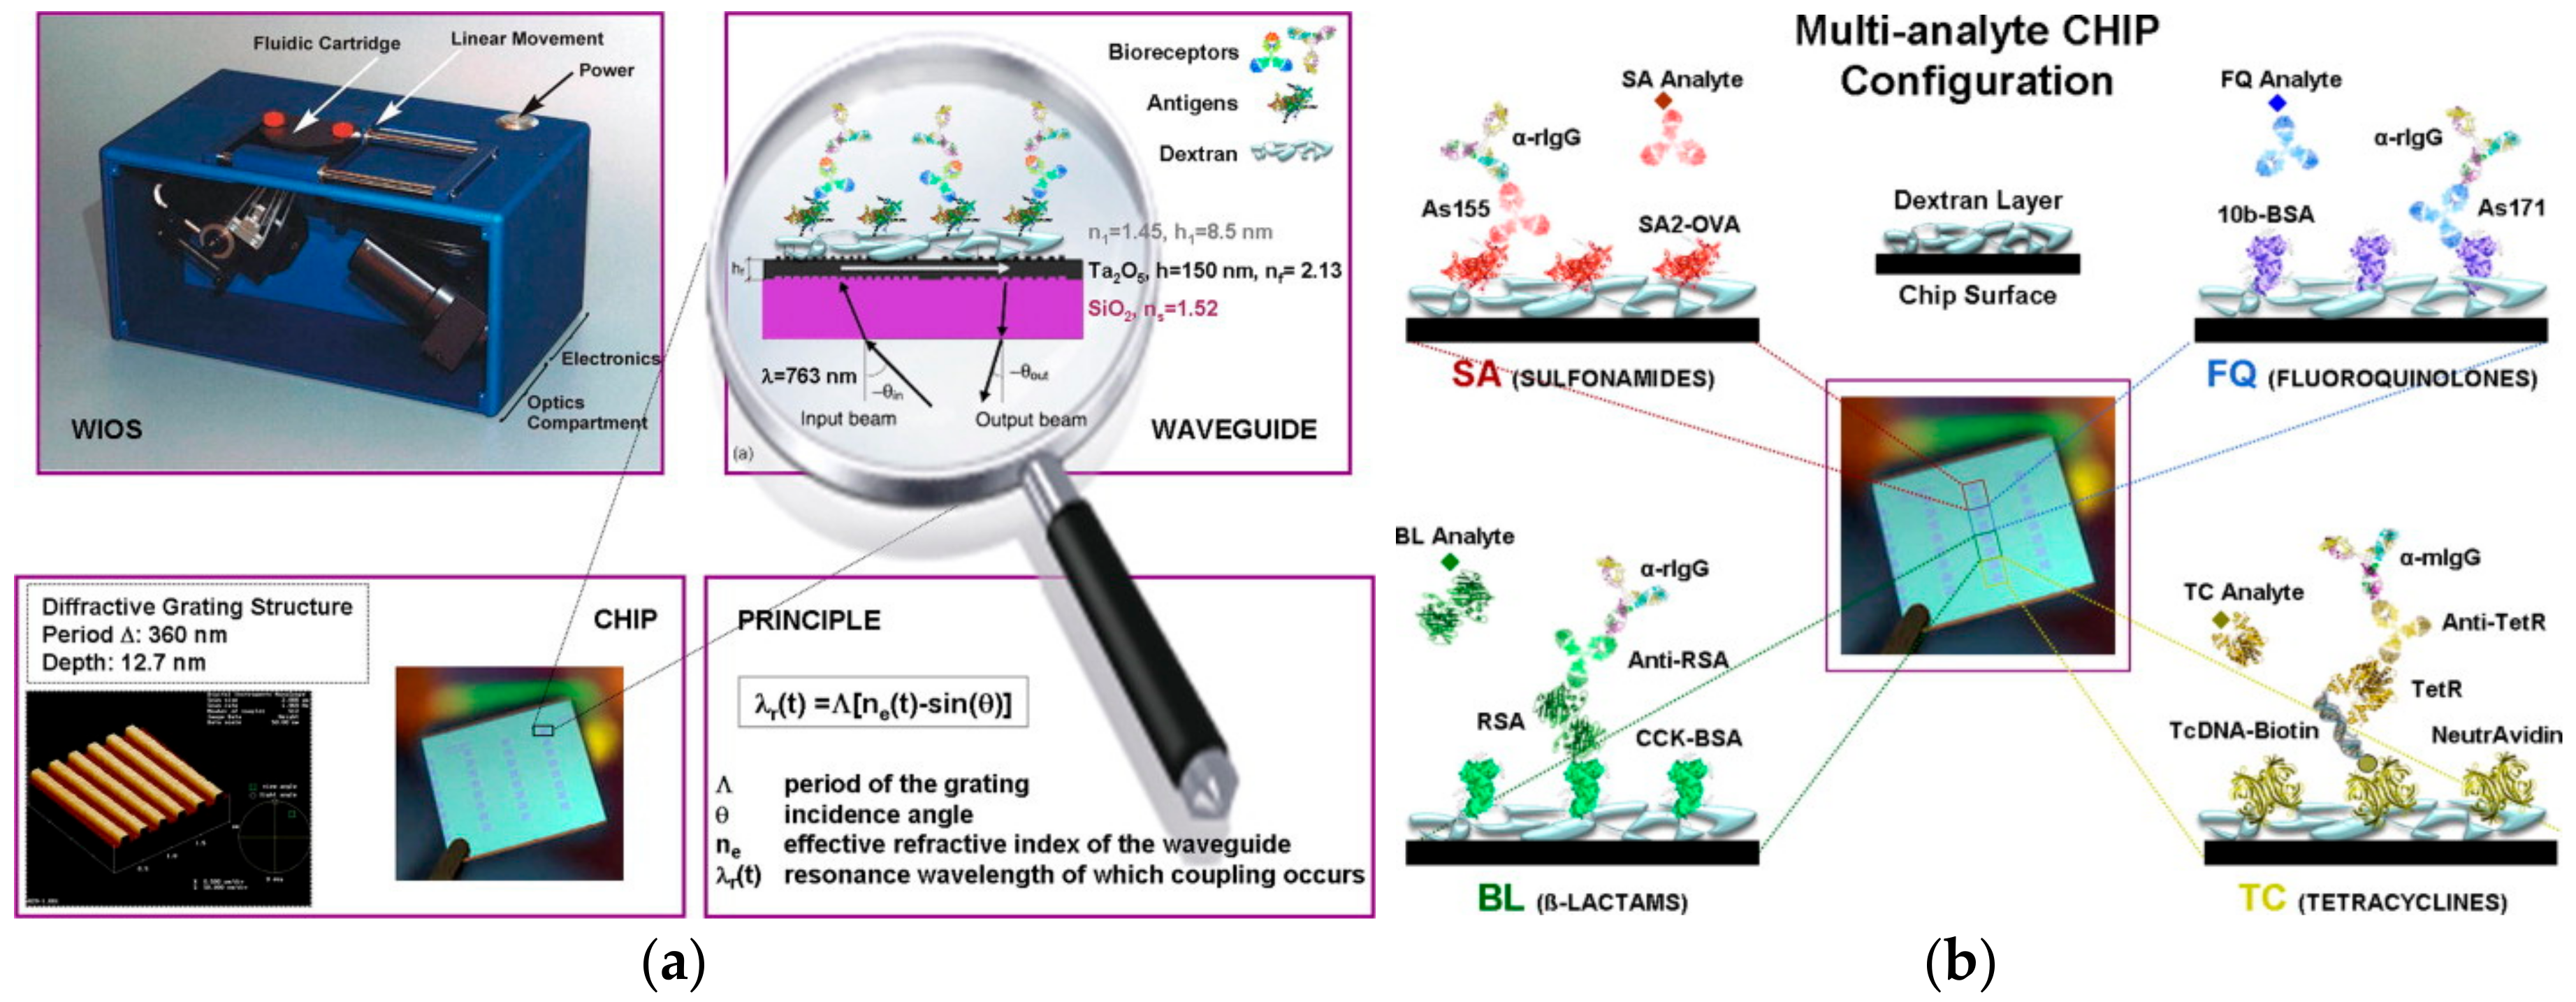
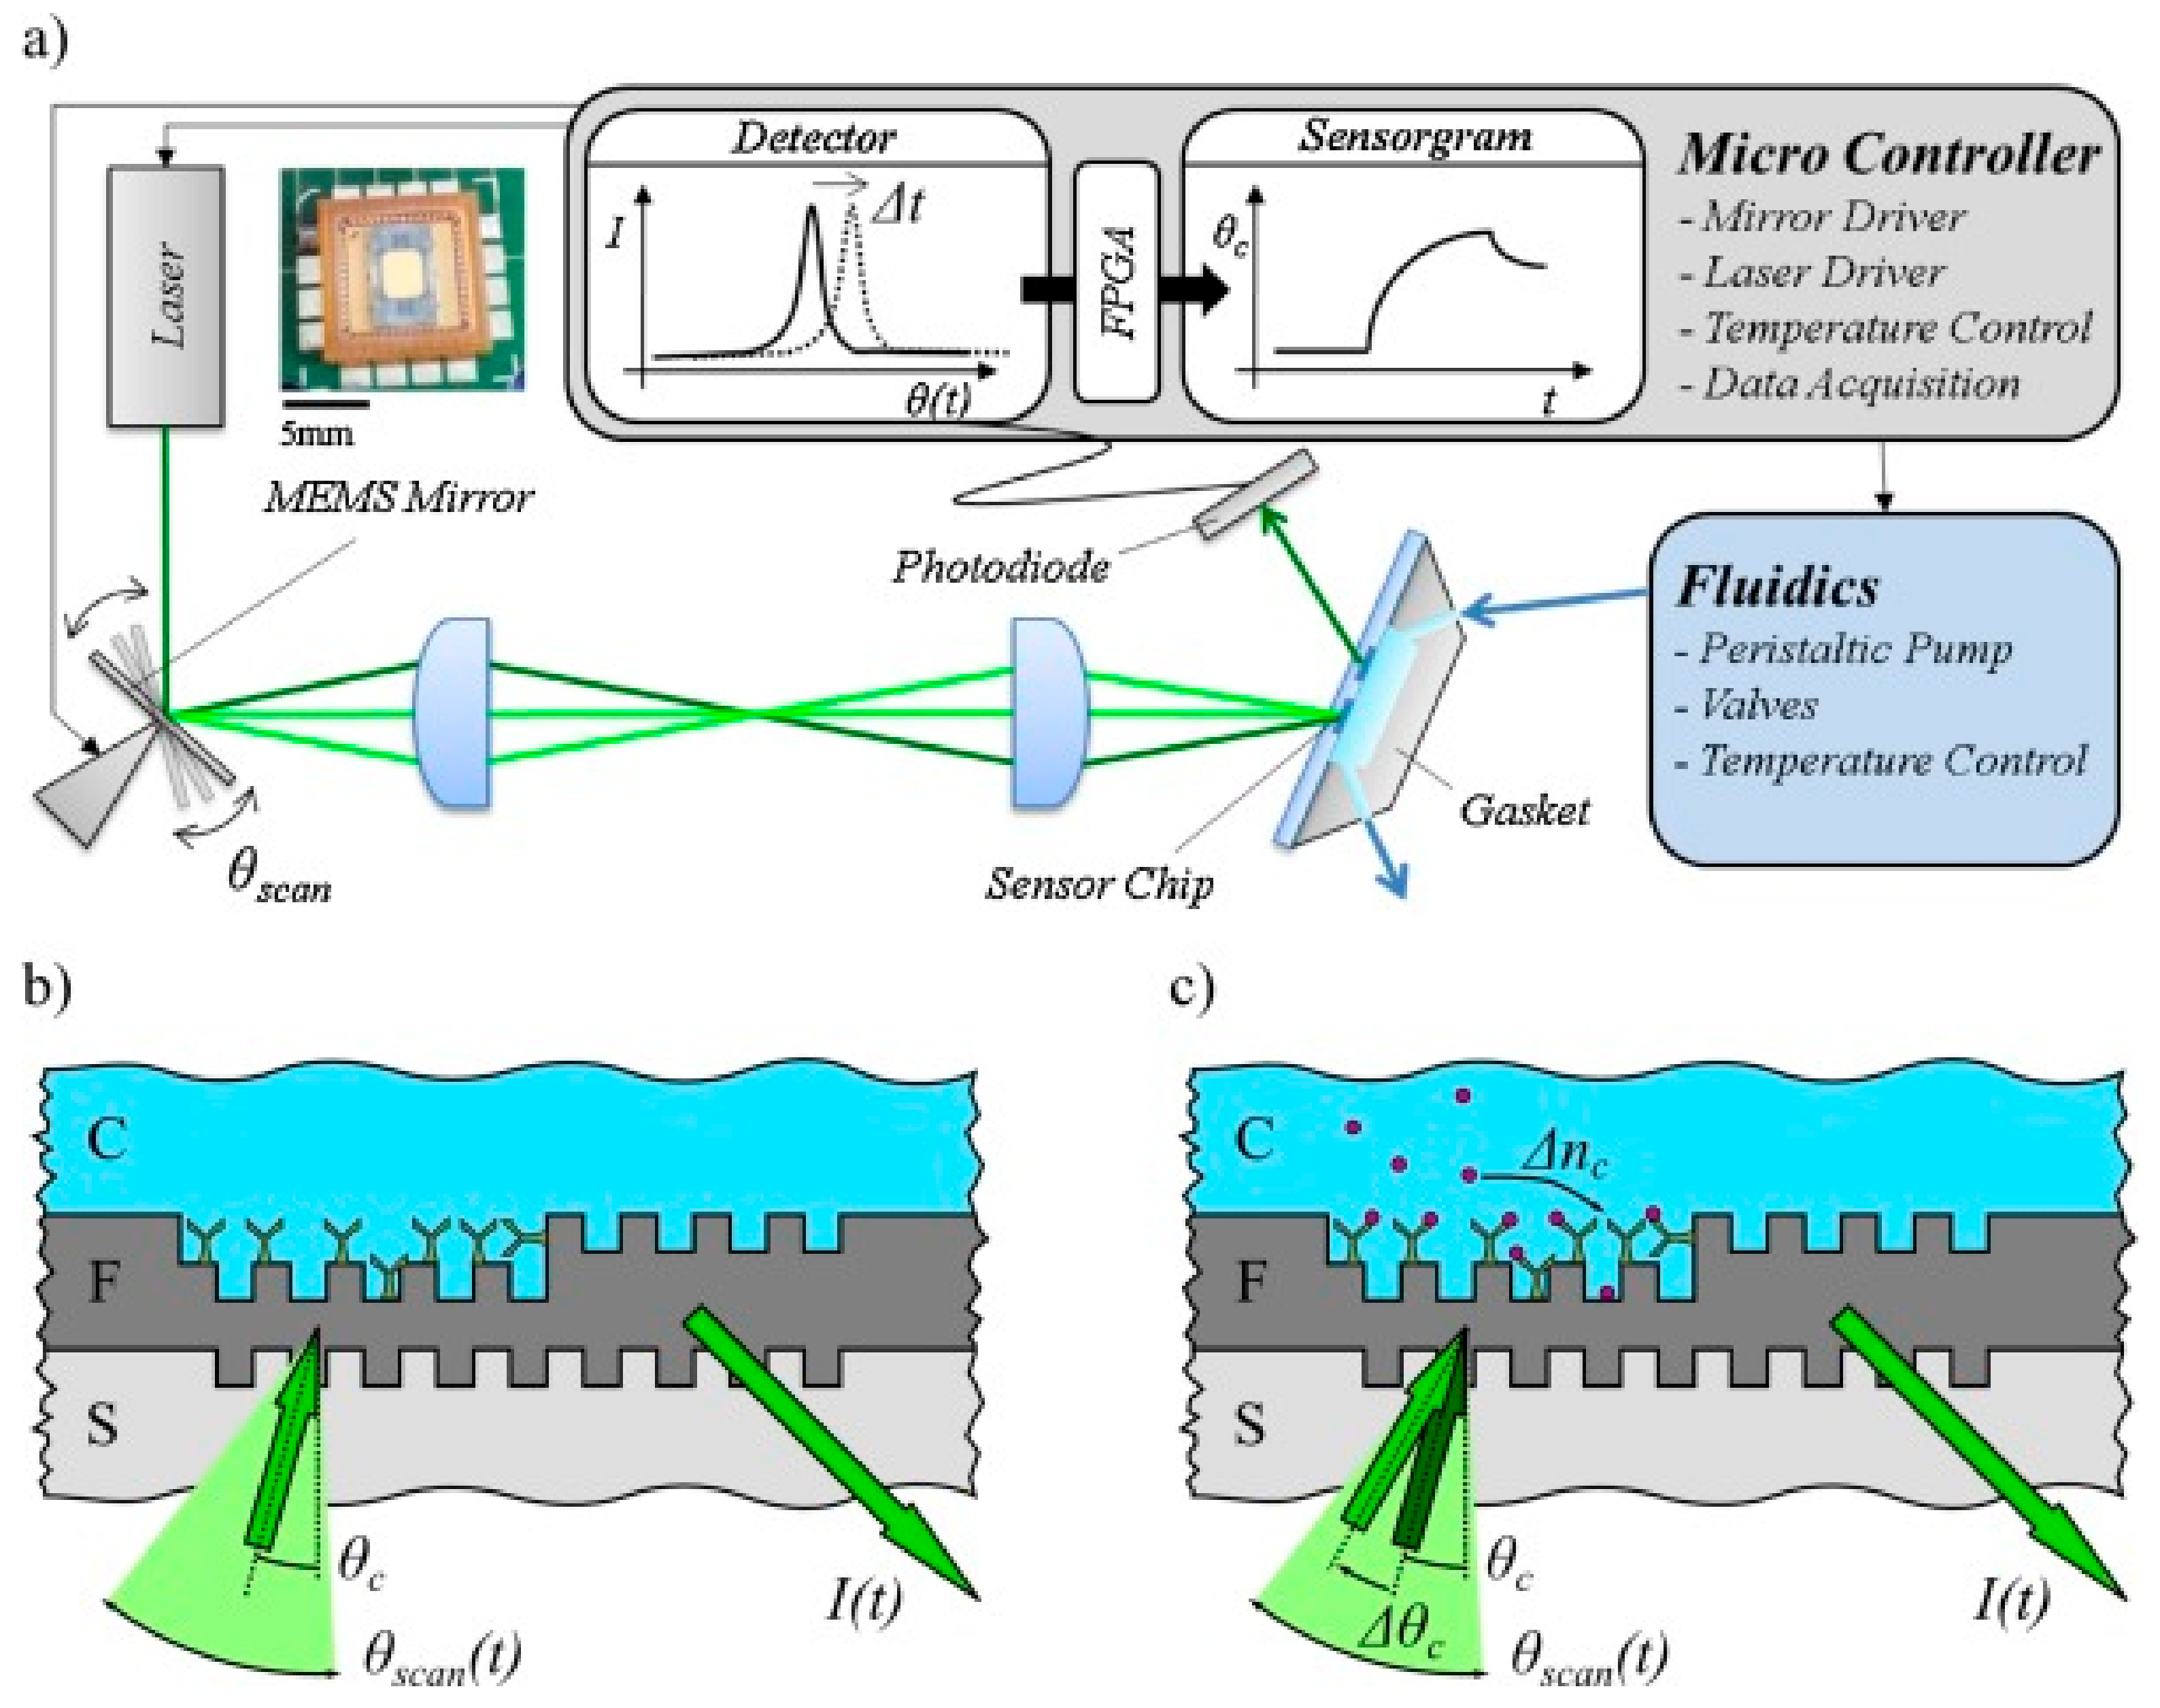
3.1. Grating-Coupled Waveguide Sensors

Grating coupler sensors are based on planar waveguides with a grating on their surface, i.e., a periodic pattern, that enables the excitation by the incident light of a mode guided in the waveguide when the following condition is satisfied:
n e f f = n a i r s i n α + l ( Λ λ ) ,
where neff is the effective refractive index of the waveguide, nair is the refractive index of air, α is the angle of the incident light, l is the diffraction order, Λ is the grating period, and λ the incident light wavelength. According to this equation, the angle for light in-coupling depends on the effective refractive index of the medium over the waveguide surface (neff). Thus, one can monitor binding reactions that take place onto the waveguide surface by monitoring the changes in the incident light in-coupling angle. In an analogous manner, the light out-coupling angle can also be used to monitor reactions that occur at the waveguide surface.
The coupling of the incident light to the waveguide is achieved by guiding polarized laser beams to the gratings at different angles. This process requires precise mechanical movements to achieve alignment of the sensor with both the light source and the photodetector when the in-coupling light angle is monitored [24,25,26]. However, there is no need for precision alignment when the light out-coupling angle is monitored, leading to a simpler experimental set-up that can be used for determinations beyond the laboratory limits [27,28]. The basic configurations of a grating-coupled waveguide sensor are provided in Figure 4.
Grating-coupled waveguide sensors are amongst the first label-free optical biosensor configurations explored. In fact, the first grating coupling set-ups developed during the early ‘90s [25] exhibited sensitivities in the range of 10−6 RIU as defined through the implementation of model binding assays, such as IgG/anti-IgG or biotin/streptavidin reaction [25,26,27,28]. Soon afterwards, in an attempt to avoid moving optical components, a set-up based on reflection-mode operation was developed, exhibiting similar limits of detection (LOD) in terms of RIU with the previous ones [29]. The analytical performance of the specific set-up was evaluated, implementing both competitive immunoassays [30] and DNA hybridization reactions [31]. To improve the analytical performance of grating coupler sensors, different microfabrication techniques (like imprint lithography) have been employed to create two-dimensional grating structures, resulting in two-fold enhancement of detection sensitivity as compared to one-dimensional grating sensors [32].
Another interesting configuration developed was the so-called wavelength interrogated optical sensor (WIOS), shown in Figure 5a, according to which two gratings were fabricated onto a single mode waveguide, one for light in-coupling and the other for out-coupling [33,34]. The two gratings were designed so that the in- and out-coupling angles differ. Thus, for a fixed angle of incident light, the changes in the refractive index over the waveguide caused by the binding reactions could be monitored by scanning the resonance peak using a tunable laser diode while a multimode fiber was used to collect the emitted light and transfer it to the photodiodes. This configuration allowed for multi-analyte determination by combining four channels, leading to up to 24 sensing areas.
The analytical evaluation of this multiplexed device was performed employing both low molecular weight analytes, e.g., biotin, as well as large biomolecules, demonstrating its ability to reach detection limits as low as 0.3 pg/mm2. The device was also implemented for the detection of sulphonamides, a family of widely used veterinary antibiotics, following a competitive immunoassay format according to which the antigen was covalently linked to the sensor surface by means of reaction with a photopolymerized dextran layer [35]. By employing a secondary antibody for signal enhancement, antigen concentrations as low as 0.5 ng/mL could be detected, covering the requirements for detection of these antibiotics in milk samples. Following the same detection principle, a multiplexed sensor for the simultaneous detection of four different classes of antibiotics (34 in total) in milk samples with detection limits similar to that of the sulphonamides sensor was also demonstrated [36]. Furthermore, through a redesign of the microfluidics cartridge [37], an attempt to develop a lab-on-chip device for on-site determinations was reported using the same sensor configuration, which was then applied to the semi-quantitative detection of three families of veterinary antibiotics. The same sensor has been also applied for the multiplexed detection of three cytokines in cell cultures [38].
These reports set the borderline to what has been so far achieved with grating-coupled waveguide biosensors to the direction of multiplexed on-site determinations, since there is not any further significant development reported for most of the last decade, with the exception of a biosensor system that used a micro-electro-mechanical system (MEMS) micro-mirror to interrogate the grating regions of a waveguide by scanning the angle of the incident coherent light (Figure 6). This angle-tunable MEMS sensor allows measurements at various wavelengths and optical powers, thus enabling multiplexed detection in a compact format [39], as the so-called angle interrogated optical sensor (ARGOS) system. Moreover, the sensor demonstrated an LOD of 2 × 10⁻⁷ in terms of refractive index and ability to detect the binding of both high and low molecular weight analytes.
In addition to the several research set-ups, the company, Microvacuum Ltd. [40], commercializes instruments based on the grating coupler principle called Optical Waveguide Light-mode Spectroscopy (OWLS). OWLS immunosensors have been employed for the detection of pesticides, mycotoxins, and bacteria, while using cells as binders, and the detection of antibiotics and pesticides has also been reported [41].

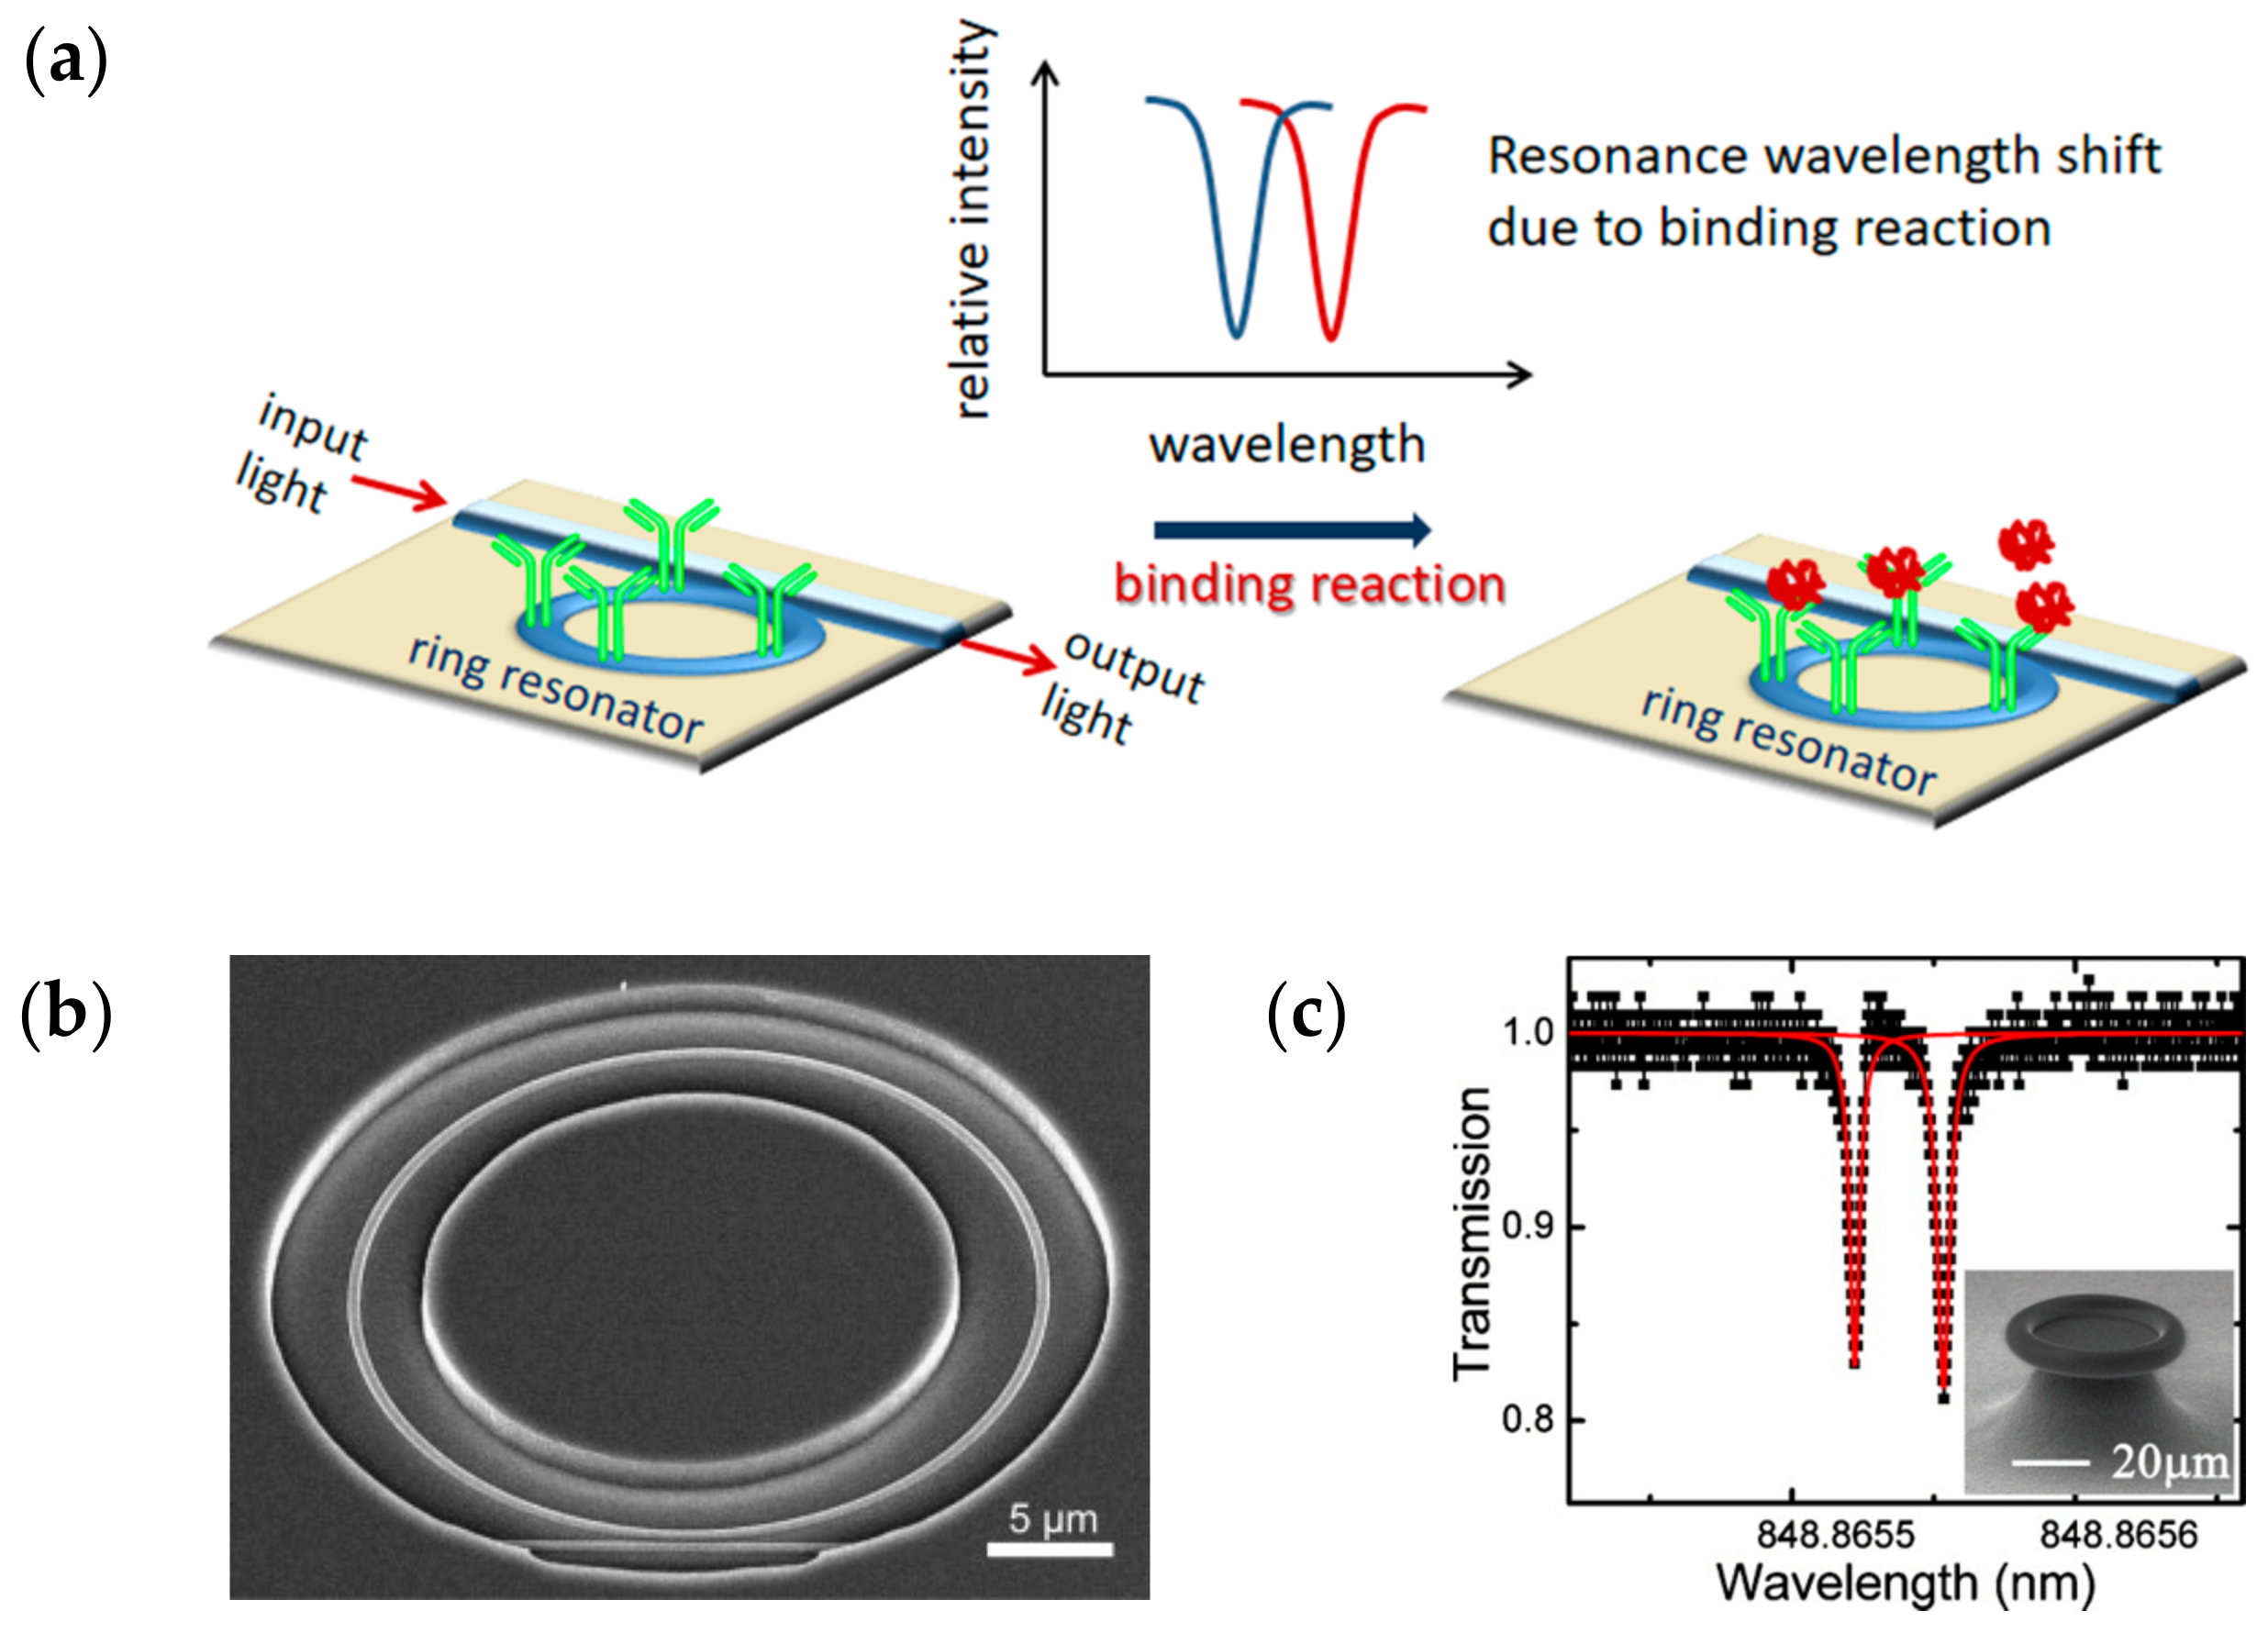
3.2. Microring Resonators

Ring-resonators are amongst the label-free optical transducers with the higher detection sensitivity and increased potential for multiplexed analysis. The basic configuration of a ring resonator is depicted in Figure 7a. As shown, the light propagating to the input waveguide is coupled through the evanescent field to a circular one, on which is propagates in the form of whispering-gallery modes. Changes in the effective refractive index in the vicinity of the ring surface, via, for example, a binding event, affects the spectral position of the whispering-gallery modes and resonance is achieved when the incident light wavelength, λ, is:
λ = 2 π n e f f r m   ,
where m is an integer describing the whispering-gallery modes’ angular momentum, r is the radius of the ring, and neff is the effective refractive index. Thus, binding reactions occurring at the ring surface could be monitored by recording the shift in the resonance either through scanning of the output spectrum or by measuring the output light intensity at a fixed wavelength.
Contrary to linear waveguides, in ring waveguides, the interaction of the waveguided light with the surrounding medium is independent of the waveguide length and is determined by the number of revolutions within the ring, which is expressed by the resonator quality factor (Q factor). High Q values (in the order of 106) mean low optical losses and long photon lifetimes, which in turn signify narrow line widths and high peak resolutions, thus leading to high sensitivity. This superior performance with respect to linear waveguides is indicated by the fact that the aforementioned Q values can be provided by ring resonators with a light propagation path ranging between 50 and 200 μm, while for linear waveguides, a length of several cm will be required to achieve a similar performance. This practically means that in the case of ring resonators, high detection sensitivities can be achieved employing devices of a smaller size as compared to linear waveguides, with the concomitant advantages of the realization of resonator arrays in a relatively small surface area.
To take advantage of the inherent advantages of the ring resonators sensors, several configurations have been realized and evaluated as biosensors over the years, including both planar resonators in the form of microdisks [42,43,44] or microrings (Figure 7b) [45,46] as well as 3D resonators in the form of microtoroids (Figure 7c) [47,48,49,50]. Although such structures have been made of glass [51], SixNy-SiO2 [52] or polymers [53], ring-resonators based on silicon-on-insulator (SOI) are the most widely explored [54].
To this end, SOI microring resonators, with a bulk refractive index LOD of 10−5 RIU [45], have been reported to provide detection limits around 10 ng/mL in terms of avidin binding to a biotinylated surface [45,54], reaching detection limits comparable to those achieved by other label-free biosensors, such as SPR. An advanced version of this sensor included an array composed of three series of four rings, each series connected to a single input and output waveguide [55]. To discriminate between the four resonators of the same series, each one of them had a different circumference ratio and thus a resonance spectrum that did not overlap with those of the rest of the three resonators. To couple the in-coming and out-coming light, a grating was employed, while the output signal of the 12 resonators was imaged by an infrared camera. To realize multiplexed determinations, the 12-ring resonators’ chip was combined with a suitable microfluidic module [55]. The detection sensitivity achieved in terms of surface mass LOD was calculated at 3.4 pg/mm2 and the array was implemented for the multiplexed detection of antibodies against human immunoglobulins (IgG), human serum albumin, and bovine serum albumin.
In another attempt for multiplexed determination, 32 ring resonators were integrated onto the same chip all of them accessed via a bus waveguide; the cladding layer was removed from 24 out of the 32 resonators to create windows for interaction with the sample, while the rest of the eight resonators that remained fully covered with the cladding layer were used as reference in order to compensate for signal drifts caused by temperature variations [46]. A microfluidic module with all the necessary fluid inlets and outlets, channels and reservoirs, as well as gaskets for fluidic isolation of each individual sensor, was fabricated to provide for fluid delivery to the 32 sensors of the array, and consequently allowing for the simultaneous monitoring of 24 reactions taking place onto the respective sensing elements. The device was evaluated at first implementing model binding assays, such as anti-IgG/IgG and biotin/streptavidin reactions, as well as real-time multiplexed analysis of DNA hybridization reactions, demonstrating a bulk refractive index LOD of 7.6 × 10⁻⁷ RIU, which corresponded to a mass LOD of 1.5 pg/mm2 [46]. Then, the device was exploited for the multiplexed detection of cytokines through modification of the different sensors of the assay with the respective specific antibodies. Using a secondary antibody for signal enhancement detection limits lower than 0.1 ng/mL in the assay buffer has been reported [56].
The same sensor configuration has also been applied for the single-analyte detection of the cancer marker, a carcinoembryonic antigen (CEA) in serum with an LOD of 25 ng/mL [57], and the multiplexed detection of five markers, namely of prostate-specific antigen (PSA), α-fetoprotein (AFP) CEA, α-tumor necrosis factor (TNF-α), and interleukin-8 (IL-8) [58], with LODs appropriate for detection of these markers in clinical samples. Finally, multiplexed detection of four micro-RNAs was achieved by modification of the microrings with the respective single-strand DNA probes. The detection was completed in about 10 min with LODs in the sub-nM range [59]. Multiplexed label-free detection of human immunoglobulin E (IgE) and human thrombin has been also presented using DNA aptamer modified silicon microring resonators. The surface sensitivity and the limit of detection of the sensor in water were found to be 0.24 nm/ng mm−2 and 38 pg/mm2, respectively, while the detection limit for human IgE and thrombin were 33 pM and 1.4, respectively [60].
A slightly different biosensor based on a silicon dual-microring resonator that comprises one resonator as a sensing element and the other integrated with an electrical controller as a tracing element has also been developed [61] (Figure 8a,b). This configuration allows the detection of resonance wavelength shifts of the sensing microring due to refractive index changes caused by the binding reaction to be performed by the voltage applied to the tracing microring. The advantage of this sensor is that the laser light source can be replaced by a broad-band one, leading to less expensive and compact instruments. The sensor was combined with isothermal solid-phase DNA amplification for the rapid detection of Mycobacterium tuberculosis in less than 20 min using the device shown in Figure 8c [62].
In addition to microring resonators, toroidal-shaped microcavities based on the same detection principle have been developed and exploited as biosensors. Toroids, as planar ring resonators, could be integrated onto arrays while exhibiting much higher Q factors (in the range of 108) than the planar ones [63,64], and were therefore expected to be endowed with a higher detection sensitivity. Thus, toroids fabricated on silicon wafer by standard lithography techniques have been used for the detection of cytokines through immobilization of specific anti-cytokine antibodies onto a protein G functionalized surface [47]. The LODs achieved using cytokine solutions prepared in buffer were in the range of 5 aM (5 × 10⁻¹⁸ M), whereas the working range extended up to 12 orders of magnitude. This impressive performance led to single-molecule [46] or single particle detection [65]. At the same time, the detection of the bacteria, Helicobacter hepaticus, at a density of 1 × 10⁴ cells/mL within 750 s has been demonstrated using an optical microcavity-based sensor [66]. Toroidal structures have also been fabricated on low-loss polymer [40] or polymer-silica hybrid materials [67]. These devices are expected to have lower Q factors (105–107) as compared to silicon based ones, but still their sensitivity should be higher compared to planar ring resonators. This, however, is still to be proved.

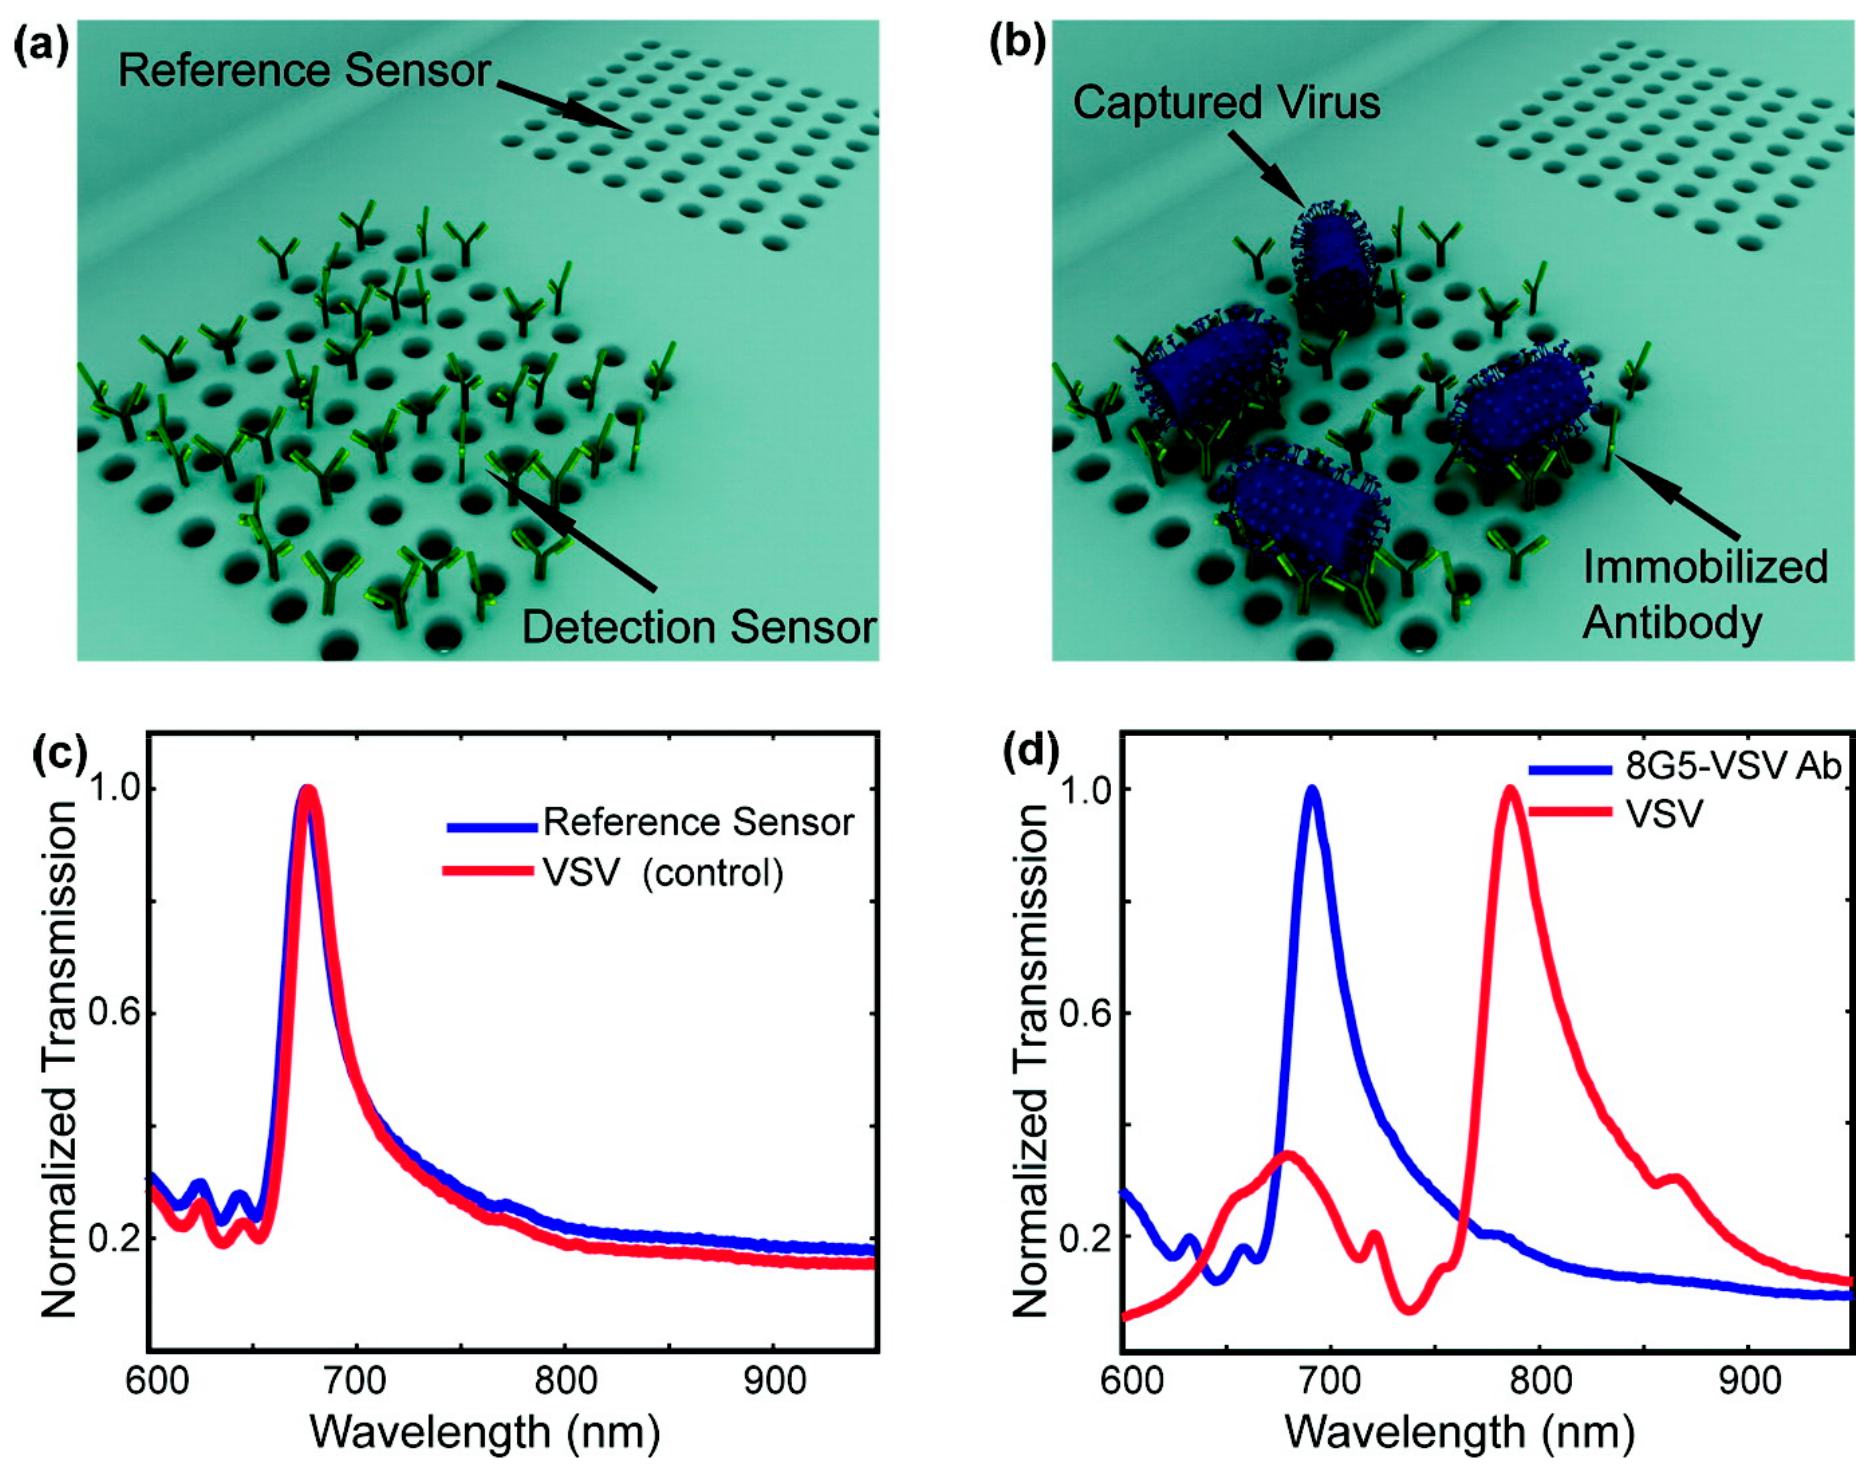
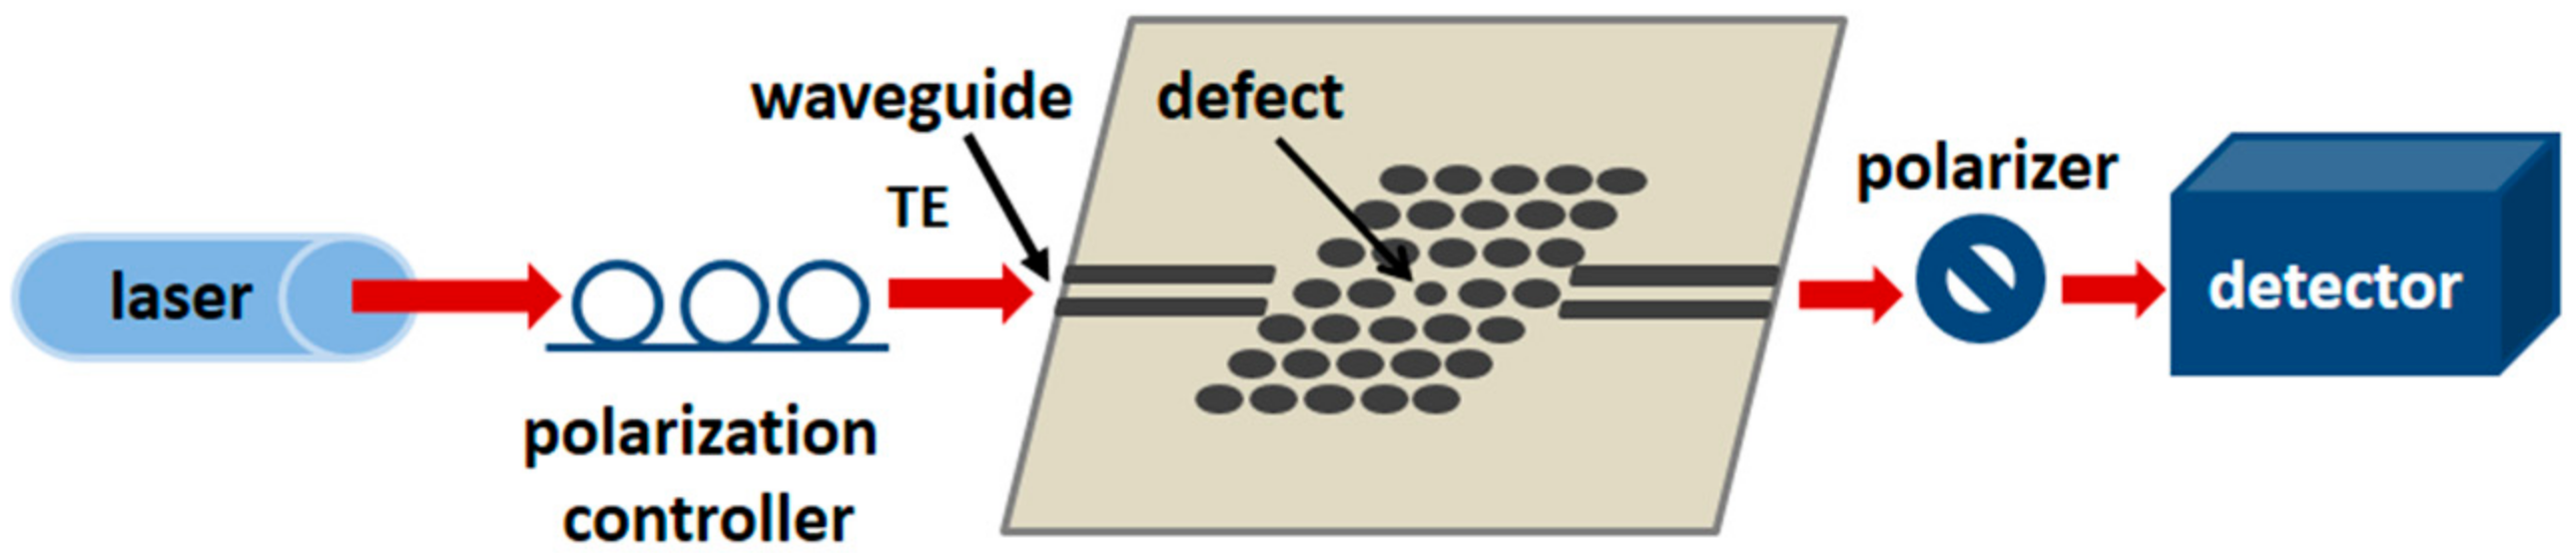
3.3. Photonic Crystal Waveguides

Photonic crystals are nanostructures with a periodicity of the order of a wavelength in one, two, or three dimensions (1D, 2D, or 3D photonic crystals, respectively). This periodicity creates photonic bandgaps where light cannot propagate in the crystal. Defects in the periodic structure induce a “defect mode” within the bandgap, which has as a result the propagation of the incident light in the photonic crystal when resonance with the defect mode is achieved. The spectral position of the defect mode is influenced by the refractive-index changes in the vicinity of the defect, thus, offering a way to exploit the photonic crystal as a biosensor. This is, in practice, achieved through careful design of the nanostructure to define the photonic bandgap and the defect mode wavelength, and thus, define the sensitivity of the transducer to refractive index changes [60]. The structures more usually implemented are linear or 2D gratings on which discrete or line defects are introduced to create the transduction sites (Figure 9). Due to their operation principle, photonic crystal sensors can have a very small size, since the light should be confined in the periodic pattern in the proximity of the defects.
The first photonic crystal biosensors [68,69,70,71] were based in 1D polymer gratings covered with a layer of TiO2, and the binding reactions could be monitored through the recording of the shift of light reflected from the sensor surface when probed perpendicularly with white light. Multiplexed detection is easily achieved since different areas of the transducer can be interrogated at the same time without any cross-talk effects [72]. Practically, this is achieved through integration of the transducer to microtiter wells or microarray slides [72], or through combination with microfluidics. The latter approach provides a shorter analysis time and higher detection sensitivity as compared to static assays [73]. These sensors have been applied to cell-based assays, protein and virus detection, drug screening, and protein-protein interactions [74]. Moreover, a commercially available system based on this technology has been launched by SRU Biosystems [75]. (www.srubiosystems.com).
In addition to gratings, waveguides with 1D and 2D arrays of holes are also popular planar photonic crystal structures, on which the guided wave is generated by missing holes on the pattern, as shown in Figure 10a [76]. Thus, hexagonal lattices of holes with a single missing row line defect and point cavities in different arrangements were fabricated on silicon-on-insulator (SOI) photonic-crystal waveguides, demonstrating a bulk refractive index LOD of 10−3 RIU, a mass sensitivity of 24.7 nm/pg, and a LOD of 500 pg/mm2 for direct adsorption of bovine serum albumin (BSA) or avidin onto the sensor surface [77]. Another configuration consisted of a photonic crystal waveguide with a length of 20 μm, lattice constant of 390 nm, and holes radius of 111 nm [78,79]. This transducer was combined with an appropriate microfluidic module to monitor the binding of an anti-BSA antibody to BSA immobilized onto the transducer surface, demonstrating a mass LOD of 2.1 pg/mm2 [78] as well as hybridization reactions with LODs in the nM range [79].
Another research group exploited the fact that the resonant wavelength can be tuned by changing the defect cavity spacing, and created the nanoscale optofluidic sensor array (NOSA), a microcavity structure evanescently coupled to an adjacent single-mode silicon waveguide [80]. Through adjustment of the cavity spacing, resonator arrays of different Q factors were realized on a single waveguide, allowing for multiplexed detection when combined with an appropriate microfluidic module, and providing a bulk refractive index LOD of 7 × 10⁻⁵ RIU [80]. The particular transducer has been applied to hybridization experiments, as well as for the multiplexed determination of interleukins 4, 6, and 8 [81].
A two-dimensional photonic crystal-based transducer was also fabricated on SOI (Figure 10b) and evaluated using the biotin-streptavidin binding reaction, providing a mass LOD of about 2.5 fg [82]. An alternative design of SOI-photonic crystal sensors employed the creation of the defect line adjacent to the photonic microcavities, resulting in a multichannel sensor [74] with a bulk refractive index LOD of about 10−2 RIU. Regarding the detection of biomolecular interactions, an LOD of 67 nM was determined for an anti-IgG/IgG reaction [83].
Another interesting design combined a photonic crystal with a ridge waveguide, allowing the detection of anti-biotin antibodies binding to sensor-immobilized biotin-BSA with an LOD of 20 pM, corresponding to a mass sensitivity of about 4.5 fg [84]. A photonic crystal sensor based on total-internal-reflection was employed for the label-free detection of the cardiac biomarker, Troponin I, in human plasma samples with a detection limit of 0.1 ng/ mL [85], whereas the shifts in the wavelength of photonic crystal nanolasers created on GaInAsP (Figure 10c) have been implemented to monitor the Limulus amebocyte lysate reaction to detect endotoxin at a concentration of 0.0001 EU/mL within 33 min [86].
In conclusion, photonic crystal sensors are characterized in general by lower detection sensitivities compared to other types of integrated optical sensors. To improve their analytical performance, instead of bulk fictionalisation with binding molecules, their confinement onto the holes where the light confinement is also maximum has been exploited as a mean to increase the resonance shifts to a binding event. This way, the detection of single particles, virus, or pathogen cells has been achieved [87,88].

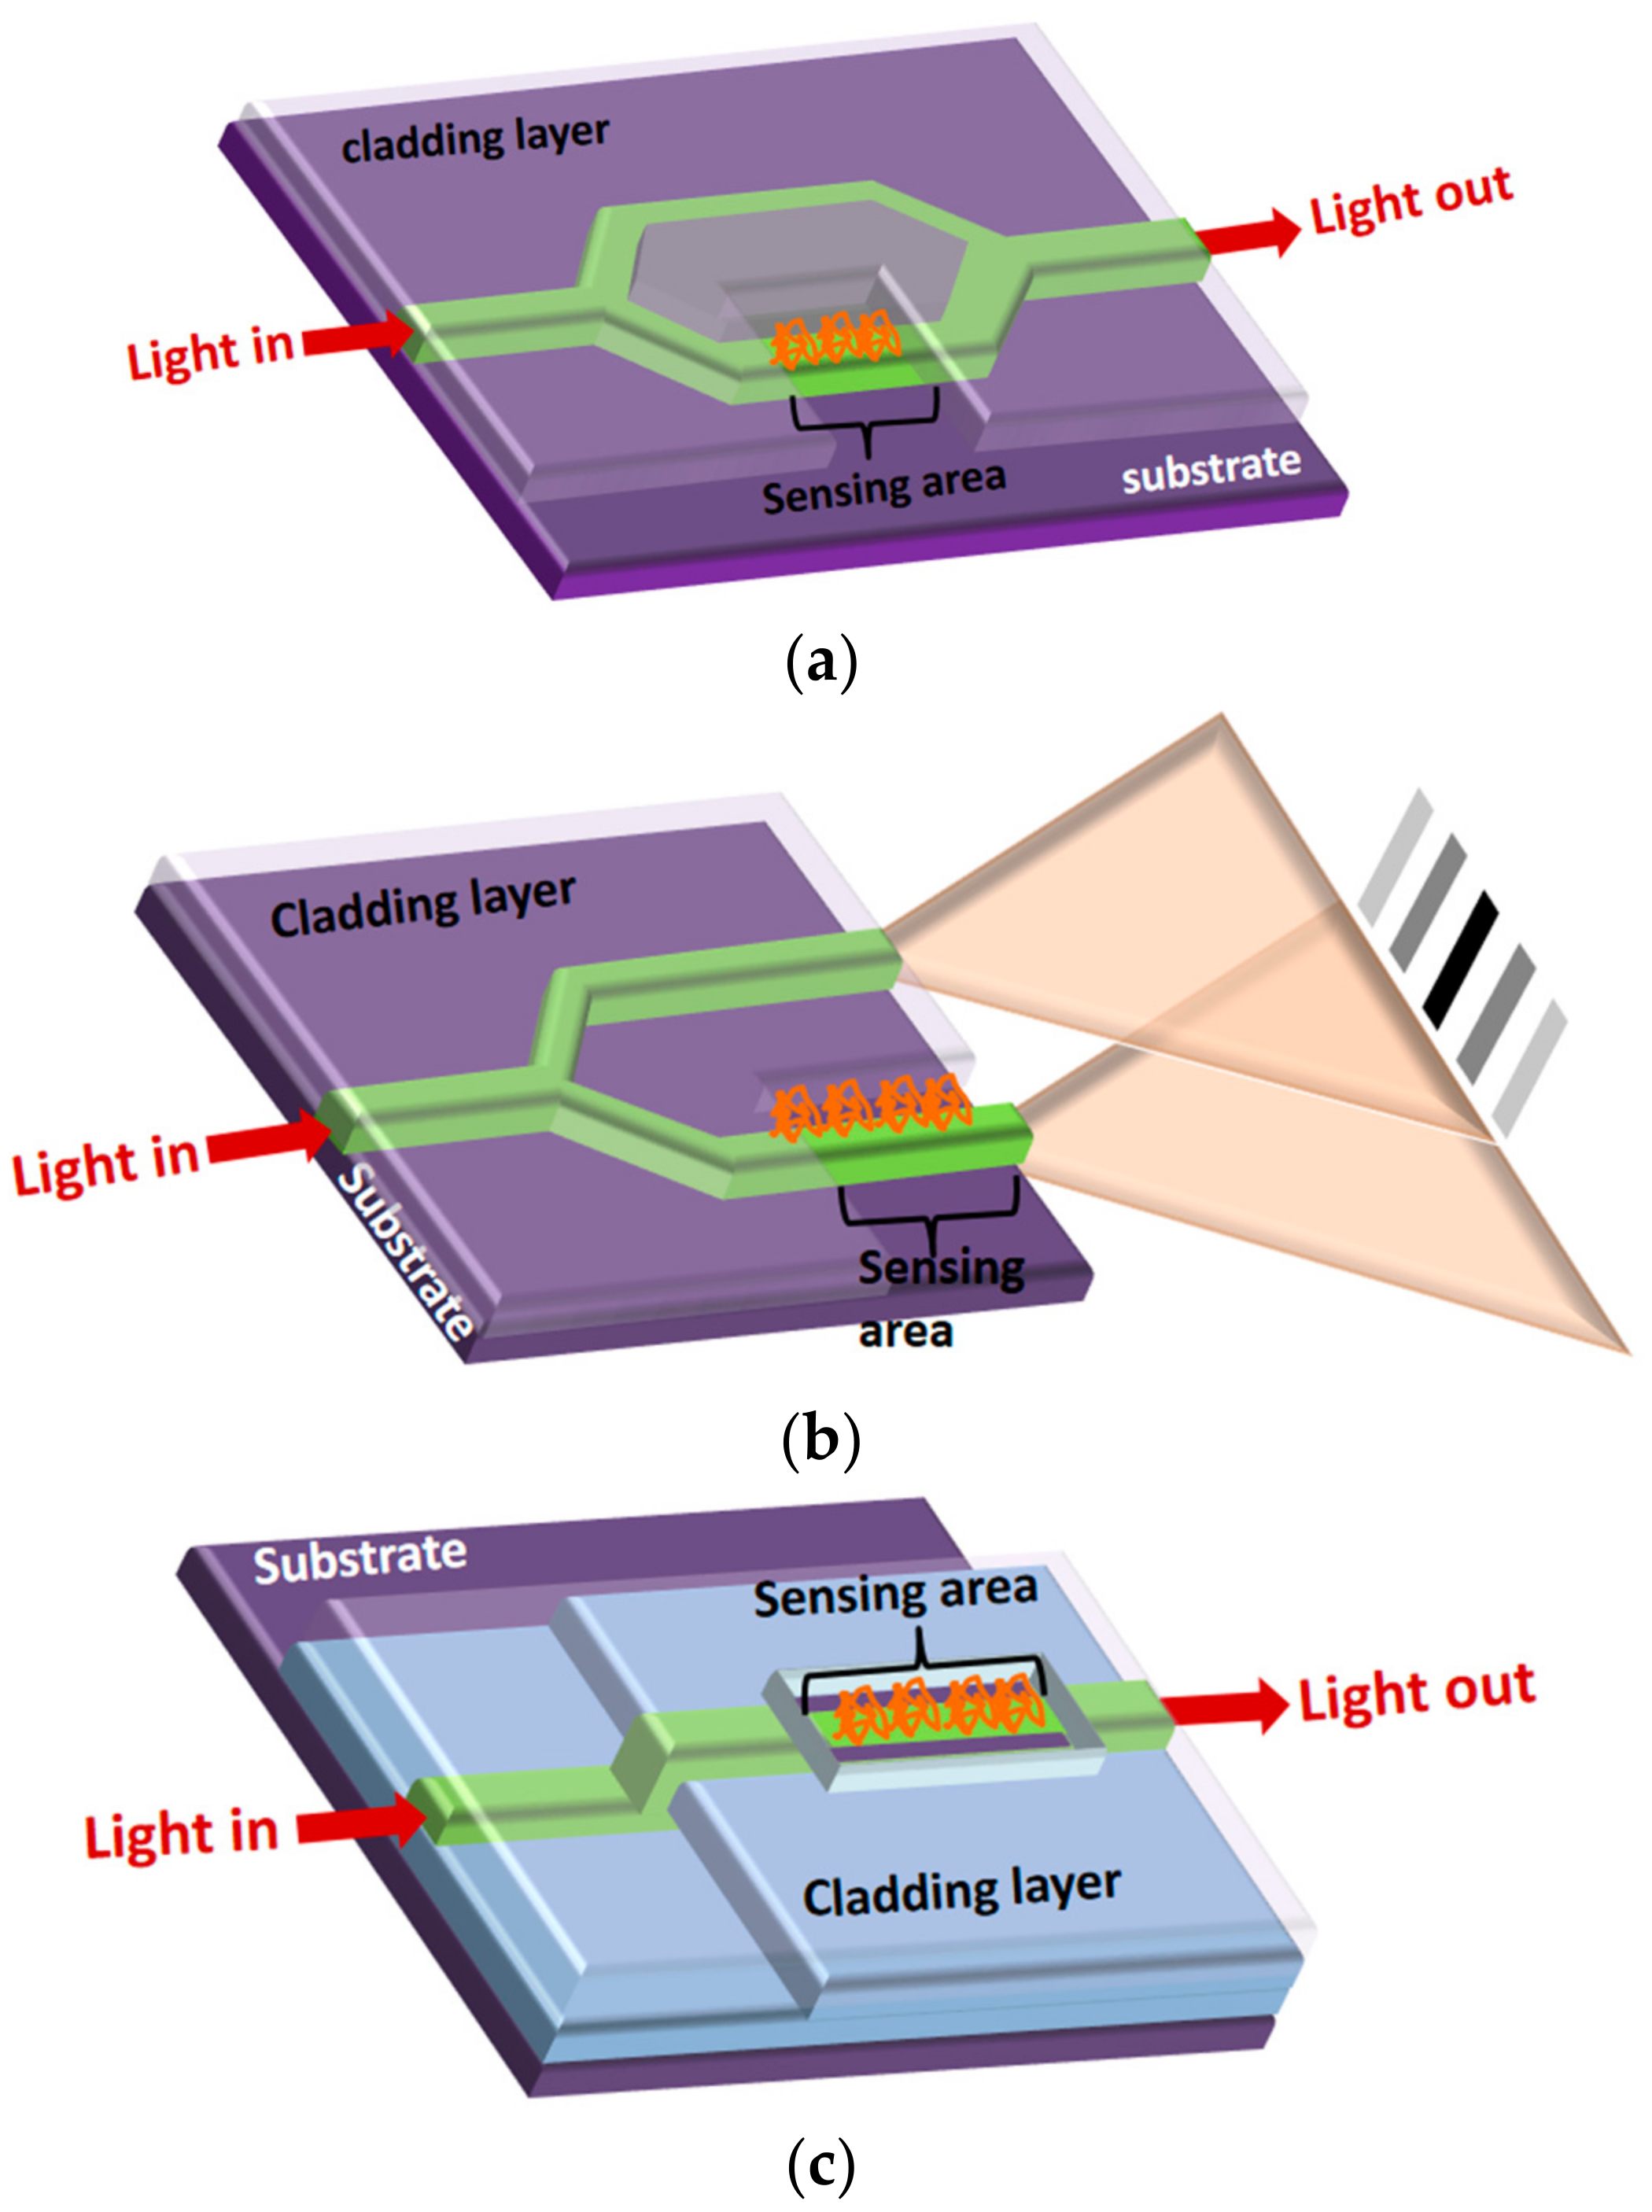
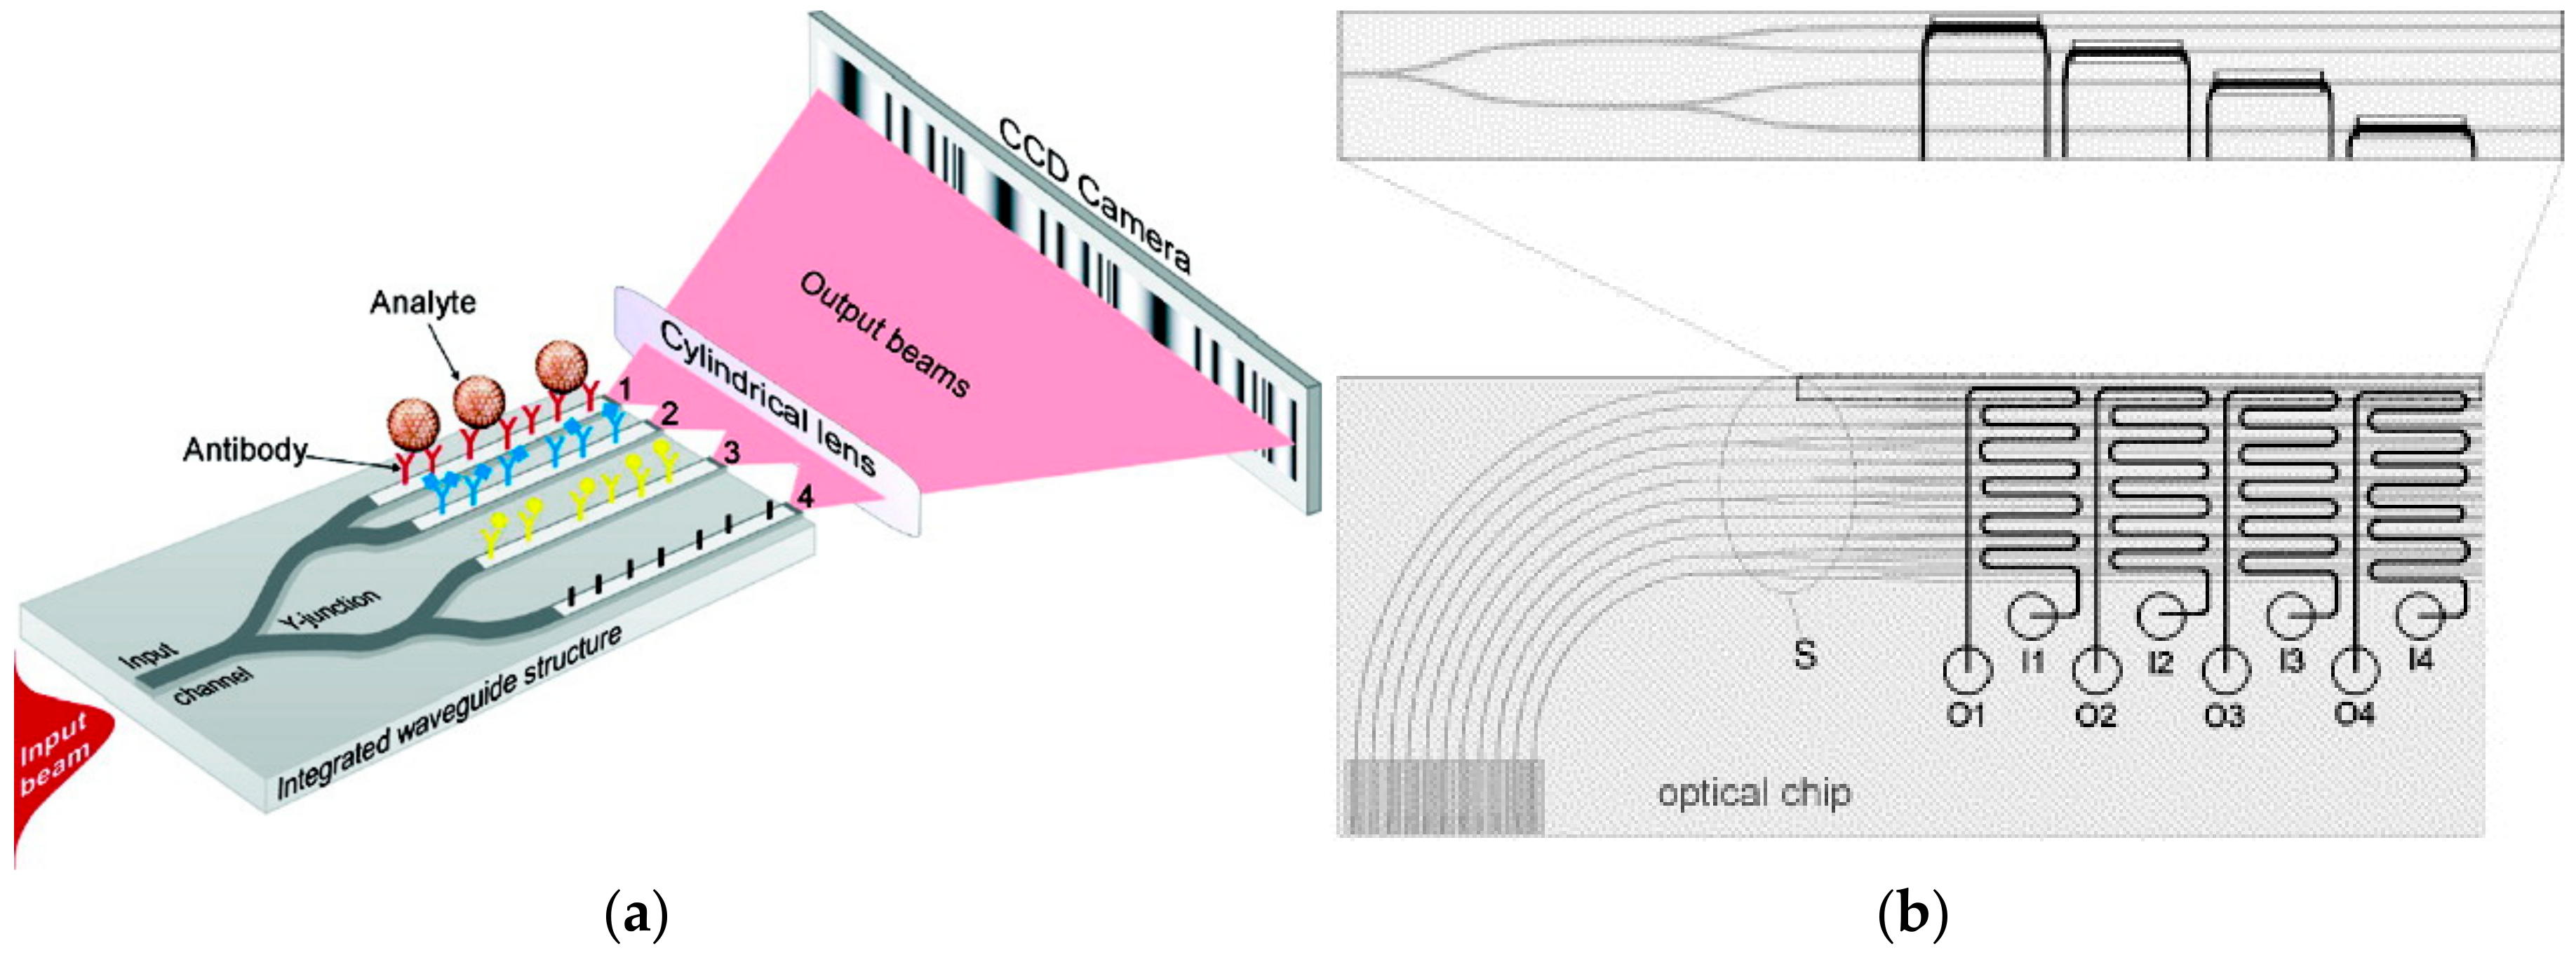
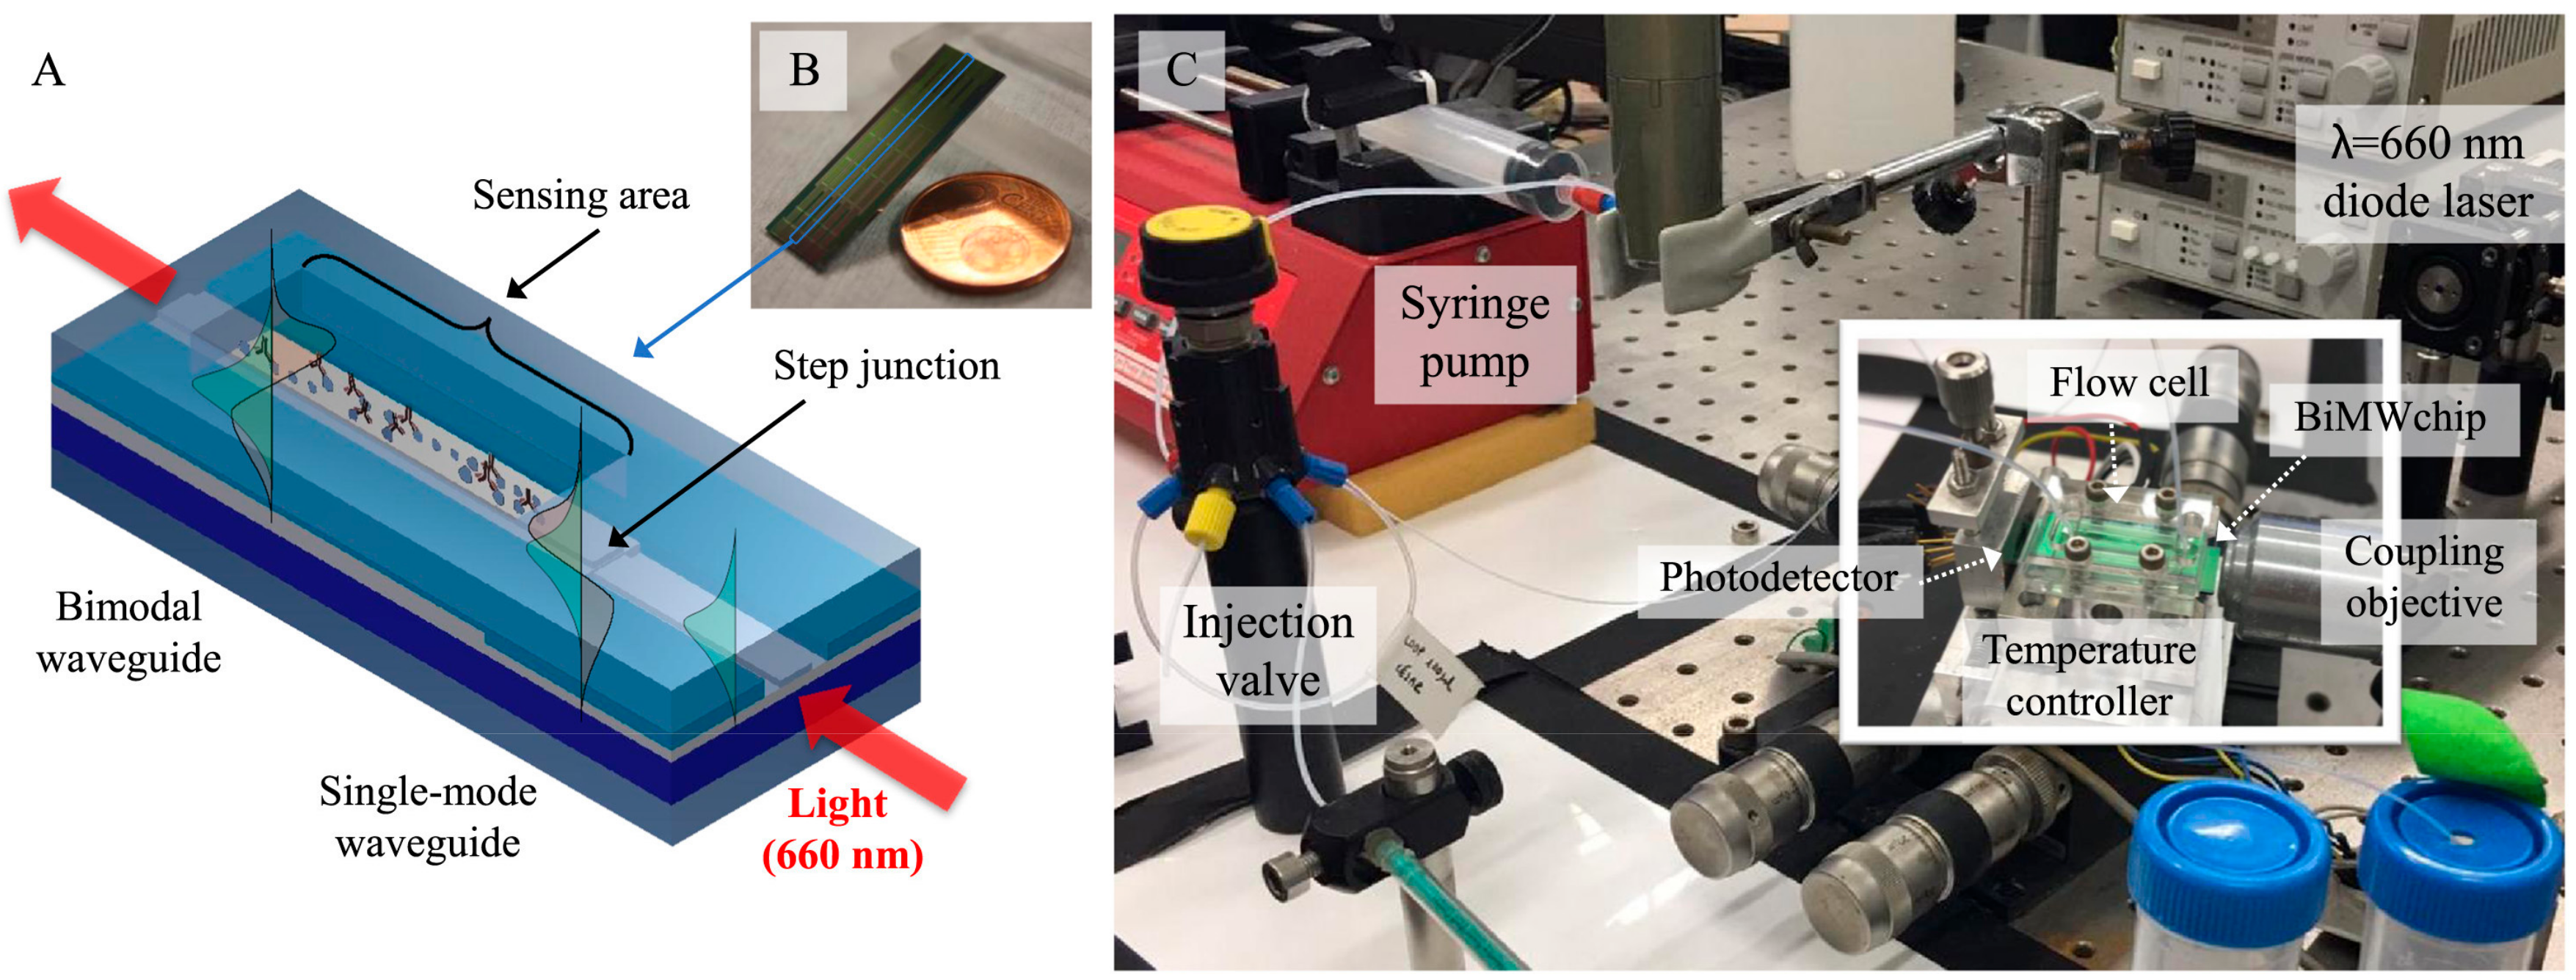
3.4. Integrated Interferometers

Interferometric sensors are the most abundant class of integrated optical sensors with a variety of configurations employed in biosensing applications. The most popular amongst the different interfererometric traducers are: Mach-Zehnder (MZI; Figure 11a), Young (YI; Figure 11b), and bi-modal interferometers (Figure 11c) [89].
An integrated MZI is essentially an integrated waveguide (made almost exclusively from silicon nitride or silicon oxynitride) that at some point splits into two arms, the sensing and the reference, which recombine again after a certain distance (Figure 11a). The reference arm is either covered by a cladding layer or appropriately passivated to minimize non-specific binding of the analyte, while the sensing arm is exposed to the analyte solution and modified with binder molecules specific for the analyte. Thus, in the sensing arm, the waveguided light could interact through the evanescent field with the adlayer formed during the binding reaction, which induces a change in the effective refractive index, resulting in a phase difference between the light propagating in the sensing and the reference arm. For the integrated MZI to be used as a sensor, the waveguides should be monomodal, otherwise, due to the differences in the propagation velocities of multiple modes, the output signal will be impossible to correlate to effective reactive index changes. In monomodal waveguides, when the two arms recombine, the output light intensity, I, and the phase difference, ΔΦ, are provided by Equations (3) and (4), respectively:
  I = I 0 2 [ E S 2 +   E R 2 + 2 E S E R c o s Δ Φ ]   ,    
  Δ Φ = 2 π L λ [ n e f f , S n e f f , R ] ,  
where I0 and I are the light intensity at the input and output, respectively, E is the electric field propagating along the waveguide, neff is the effective refractive index, Φ is the phase, L is the interaction length in the sensing arm, λ is the light wavelength, and S and R refer to the sensing and the reference arm, respectively. According to Equation (3), the output light intensity has a cosine dependence with the phase difference, which means that the sensitivity to effective refractive index changes would be maximum at the quadrature points and minimum in the vicinity of the extrema. In addition, according to Equation (4), it is expected that an increase of the sensing arm interaction length would result also in a sensitivity increase.
Additional parameters that regulate the MZI performance as a refractive index sensor are the geometrical characteristics of the waveguide and the difference in the refractive index of the materials used for the waveguide and the cladding layer. To this end, the waveguides were, almost from the first MZI sensor, made of glass, SiO2, Si3N4, and, in some cases, of polymers, whereas the cladding layer is usually SiO2 [90,91,92,93,94].
Integrated MZIs have been evaluated as biosensors from the first reports [90,91], in which antibody-functionalized transducers have been used to detect human chorionic gonadotropin at concentrations as low as 50 pM within 20 min. The LOD was reduced to 30 nM when an MZI sensor based on thinner waveguides was fabricated [92]. Another research group developed an MZI sensor based on rib SiON waveguides and applied them to the determination of 2,4-dichlorophenoxyacetic acid (2,4-D) with an LOD of 1 mg/mL following a competitive immunoassay format [93]. In another, design, a 3 × 3 coupler was integrated to the MZI output, improving the signal-to-noise ratio by a factor of 10, and allowing the detection of the pesticide, simazine, with an LOD of 0.1 ng/mL [94]. Silicon MZIs based on total internal reflection [95] or anti-resonant reflecting optical waveguide MZIs (ARROW-based MZI) [96] have also been reported by the same group. The first configuration provided a bulk refractive index LOD of 8 × 10⁻⁶ RIU, which corresponded to a surface sensitivity of around 2 × 10⁻⁴ nm−1, and an LOD of 0.06 pg/mm2, when evaluated through DNA hybridization experiments. On the other hand, ARROW-based MZI provided a refractive-index detection limit of 2.5 × 10⁻⁶ RIU when applied for the detection of the insecticide, carbaryl, following a competitive immunoassay format [96]. In an attempt to minimize the optical transmission losses and optimize the MZI performance, the divisors that split and recombine the two arms were redesigned and the sensor was applied to the detection of L. monocytogenes at a concentration of 2.8 × 10⁵ colony forming units (CFU)/mL, which is lower that the infective dosage for humans, and a dynamic range of five orders of magnitude [97].
In all the above reports, the MZIs were symmetric, as shown in Figure 11a, i.e., the sensing and the reference arms had equal lengths; nonetheless, asymmetric MZIs with small path differences between the two arms have been also fabricated. Such an MZI has been employed for the immunochemical detection of aflatoxin M1 (AFM1) in milk samples [98]. The sensor LOD for AFM1 was 3 mg/L, which is orders of magnitude higher than the maximum allowable limit in the EU (0.05 mg/mL), thus requiring a sample pre-concentration.
Another MZI sensor design that was exploited for biosensing was based on a silicon nitride slot waveguide, in which the sensing arm of the sensor consists of a slot waveguide while the reference arm consists of a strip waveguide. A slot waveguide consists of two slabs of high refractive index material separated by a nanometer-scale low refractive index slot region and surrounded by low refractive index cladding materials [99] (Figure 12a). A bulk refractive index sensitivity of 1864π/RIU was recorded, which translated to an LOD of 18.9 fM in terms of streptavidin in a biotin/streptavidin model binding reaction experiment [100]. The same sensor was applied for the quantification of the methylation of the death-associated protein kinase (DAPK) gene, a biomarker for human cancers, at a concentration as low as 1 nM [99]. An array of such MZIs was also fabricated and applied for the detection of multiple microRNAs in urine samples. It was shown that the sensor could discriminate single nucleotide polymorphism of the let-7 family of miRNAs from synthetic and cell line samples in an assay time of 15 min [101]. Moreover, an instrument was built around the slot MZIs array, as shown in Figure 12b, which could be evolved to a point-of-care device.
Although the majority of integrated MZI sensors depend on devices fabricated on silicon materials, polymers have also been implemented due to their lower cost compared with silicon-based ones. Thus, a polyimide-based MZI modified with streptavidin to couple a biotinylated anti-human IgG antibody was applied for the determination of human IgG with an LOD of 3.1 nM for direct binding, which was reduced to 30 pM when a second anti-human IgG antibody was employed [102]. Considering the LODs achieved so far, polymer-based MZIs could evolve to low-cost, disposable immunosensors.
In addition to the various research efforts, there is an MZI-based system commercialized by Optiqua Technologies Pte Ltd (http://www.optiqua.com), indicating the potential of MZI-based sensing systems for real-world applications.
Young interferometers (YI) are also based on waveguides that split into two arms through a Y-junction; nonetheless, the two arms do not recombine, but the respective light beams interfere in free space, as in Young’s famous two-slit experiment (Figure 11b). Thus, the output signal consists of an interferogram that can be depicted onto a CCD camera. As in MZIs, changes in the effective refractive index over the sensing arm due to binding reactions result in a phase difference between the two interfering beams that is recorded as a spatial shift of the interference fringes according to Equation (5):
I ( λ ) = I 1 + I 2 + 2 I 1 I 2 cos [ 2 π b λ L x + Δ φ ] = I 1 + I 2 + 2 I 1 I 2 cos [ b k L x + Δ φ ] ,
where I1 and I2 are the light intensities of the two beams, b is the distance between the two arms, L is the distance between the waveguide end and the readout camera, and x is the position of the fringe pattern on the camera. The phase difference, Δφ, between the two arms is provided by the same equation with the MZIs (Equation (4)).
Despite the fact that YIs have evolved almost in parallel with MZIs [103], their development was not so widespread, although they are characterized by a simpler read-out as compared to MZIs, and are less sensitive to temperature and wavelength drifts. Amongst the first YIs developed, the same group presented two devices, one based on silicon nitride waveguides [104] and the second on Ta2O5 waveguides [105]. Both sensors were at first evaluated with model binding assays, and the LODs achieved in terms of refractive index changes were 9 × 10⁻⁸ and 9 × 10⁻⁹, respectively. Then, the second device was modified with antibodies and used to detect proteins and pharmaceutical substances (methotrexate) in serum [106] to monitor the production of a recombinant protein in cell lysates [107], and to detect tuberculosis-specific antibodies in serum samples from infected patients [108]. It should be noticed that the YI-based sensor was found to be more sensitive than an SPR, a grating coupler, and a commercially available reflectometric interference spectroscopy (RIfS) sensor.
Another research group developed a four-channel integrated YI that allowed for independent multiplexed detections (Figure 13a), through combination with an appropriately designed microfluidic module (Figure 13b), while using one of the sensors as a reference [109]. The devise demonstrated a bulk refractive index LOD of 8.5 × 10⁻⁸ RIU, which is one of the lowest LODs in terms of mass coverage resolution (20 fg/mm2) [110]. In addition, the same configuration was employed in the immunochemical detection of herpes simplex virus type 1 (HSV-1), demonstrating an LOD of 850 particles/mL in buffer, which was a bit more elevated in serum [111].
In addition to silicon-based YIs, polymeric integrated YI sensor chips, with roll-to-roll mass-manufactured waveguides, have also been reported, which were able to detect a refractive index difference of 6.4 × 10⁻⁶ RIU [112]. The polymeric YI were functionalized with a molecularly imprinted polymer (MIP) as the binder and used for the detection of melamine, whereas the multi-analyte capabilities have been demonstrated through the detection of C-reactive protein (CRP) and human chorionic gonadotropin (hCG) using YIs functionalized with specific antibodies [113]. Nonetheless, the evaluation of the analytical performance of the specific sensors was not complete.
Bimodal waveguide interferometers are most recently developed, and consist of a single waveguide with two different zones; a first one with single-mode behaviour and a second one supporting two modes (zero- and first-order modes). These two modes propagate at different velocities depending on the refractive index of the cladding layer, and thus, when the refractive index changes as a result of a binding reactions occurring at the waveguide surface, the interference pattern at the waveguide output also changes (Figure 14A). The sensor exhibited a bulk refractive index LOD of about 5 × 10⁻⁷ RIU, which is similar to those achieved using other interferometric configurations [114].
Bi-modal interferometric sensors have been used for the immunochemical detection of clinically relevant protein analytes, such as human thyroid stimulating hormone (hTSH) [115] and human growth hormone (hGH), in undiluted urine matrix [116] at the picomolar range; of Bacillus Cereus Escherichia Coli to densities down to 12 CFU/mL and 4 CFU/mL, respectively [117]; of micro-RNAs related to bladder cancer at attomolar concentrations [118]; as well as of the pollutant Irgarol 1051 in seawater with an LOD of 3 ng/L that is below the maximum allowable concentration in a seawater set by the EU (16 ng/L) [119].
In general, the analytical performance of bi-modal interferometers is comparable to that of other interferometric transducers and in particular to single-wavelength MZIs. Moreover, the sensor chip (Figure 14B) was combined with a valve-based microfluidic module appropriate of automating complex fluid handling (Figure 14C). The module was fabricated on a poly(dimethylsiloxane) (PDMS) following an injection moulding technique that enabled the creation of integrated pneumatically actuated elastomeric valves in a mass production compatible way. The module was designed so as to achieve the movement of the reagents required for the performance of competitive immunoassays, and the device was applied for the detection of the antibiotic, tetracycline, as a proof-of-concept assay [120].

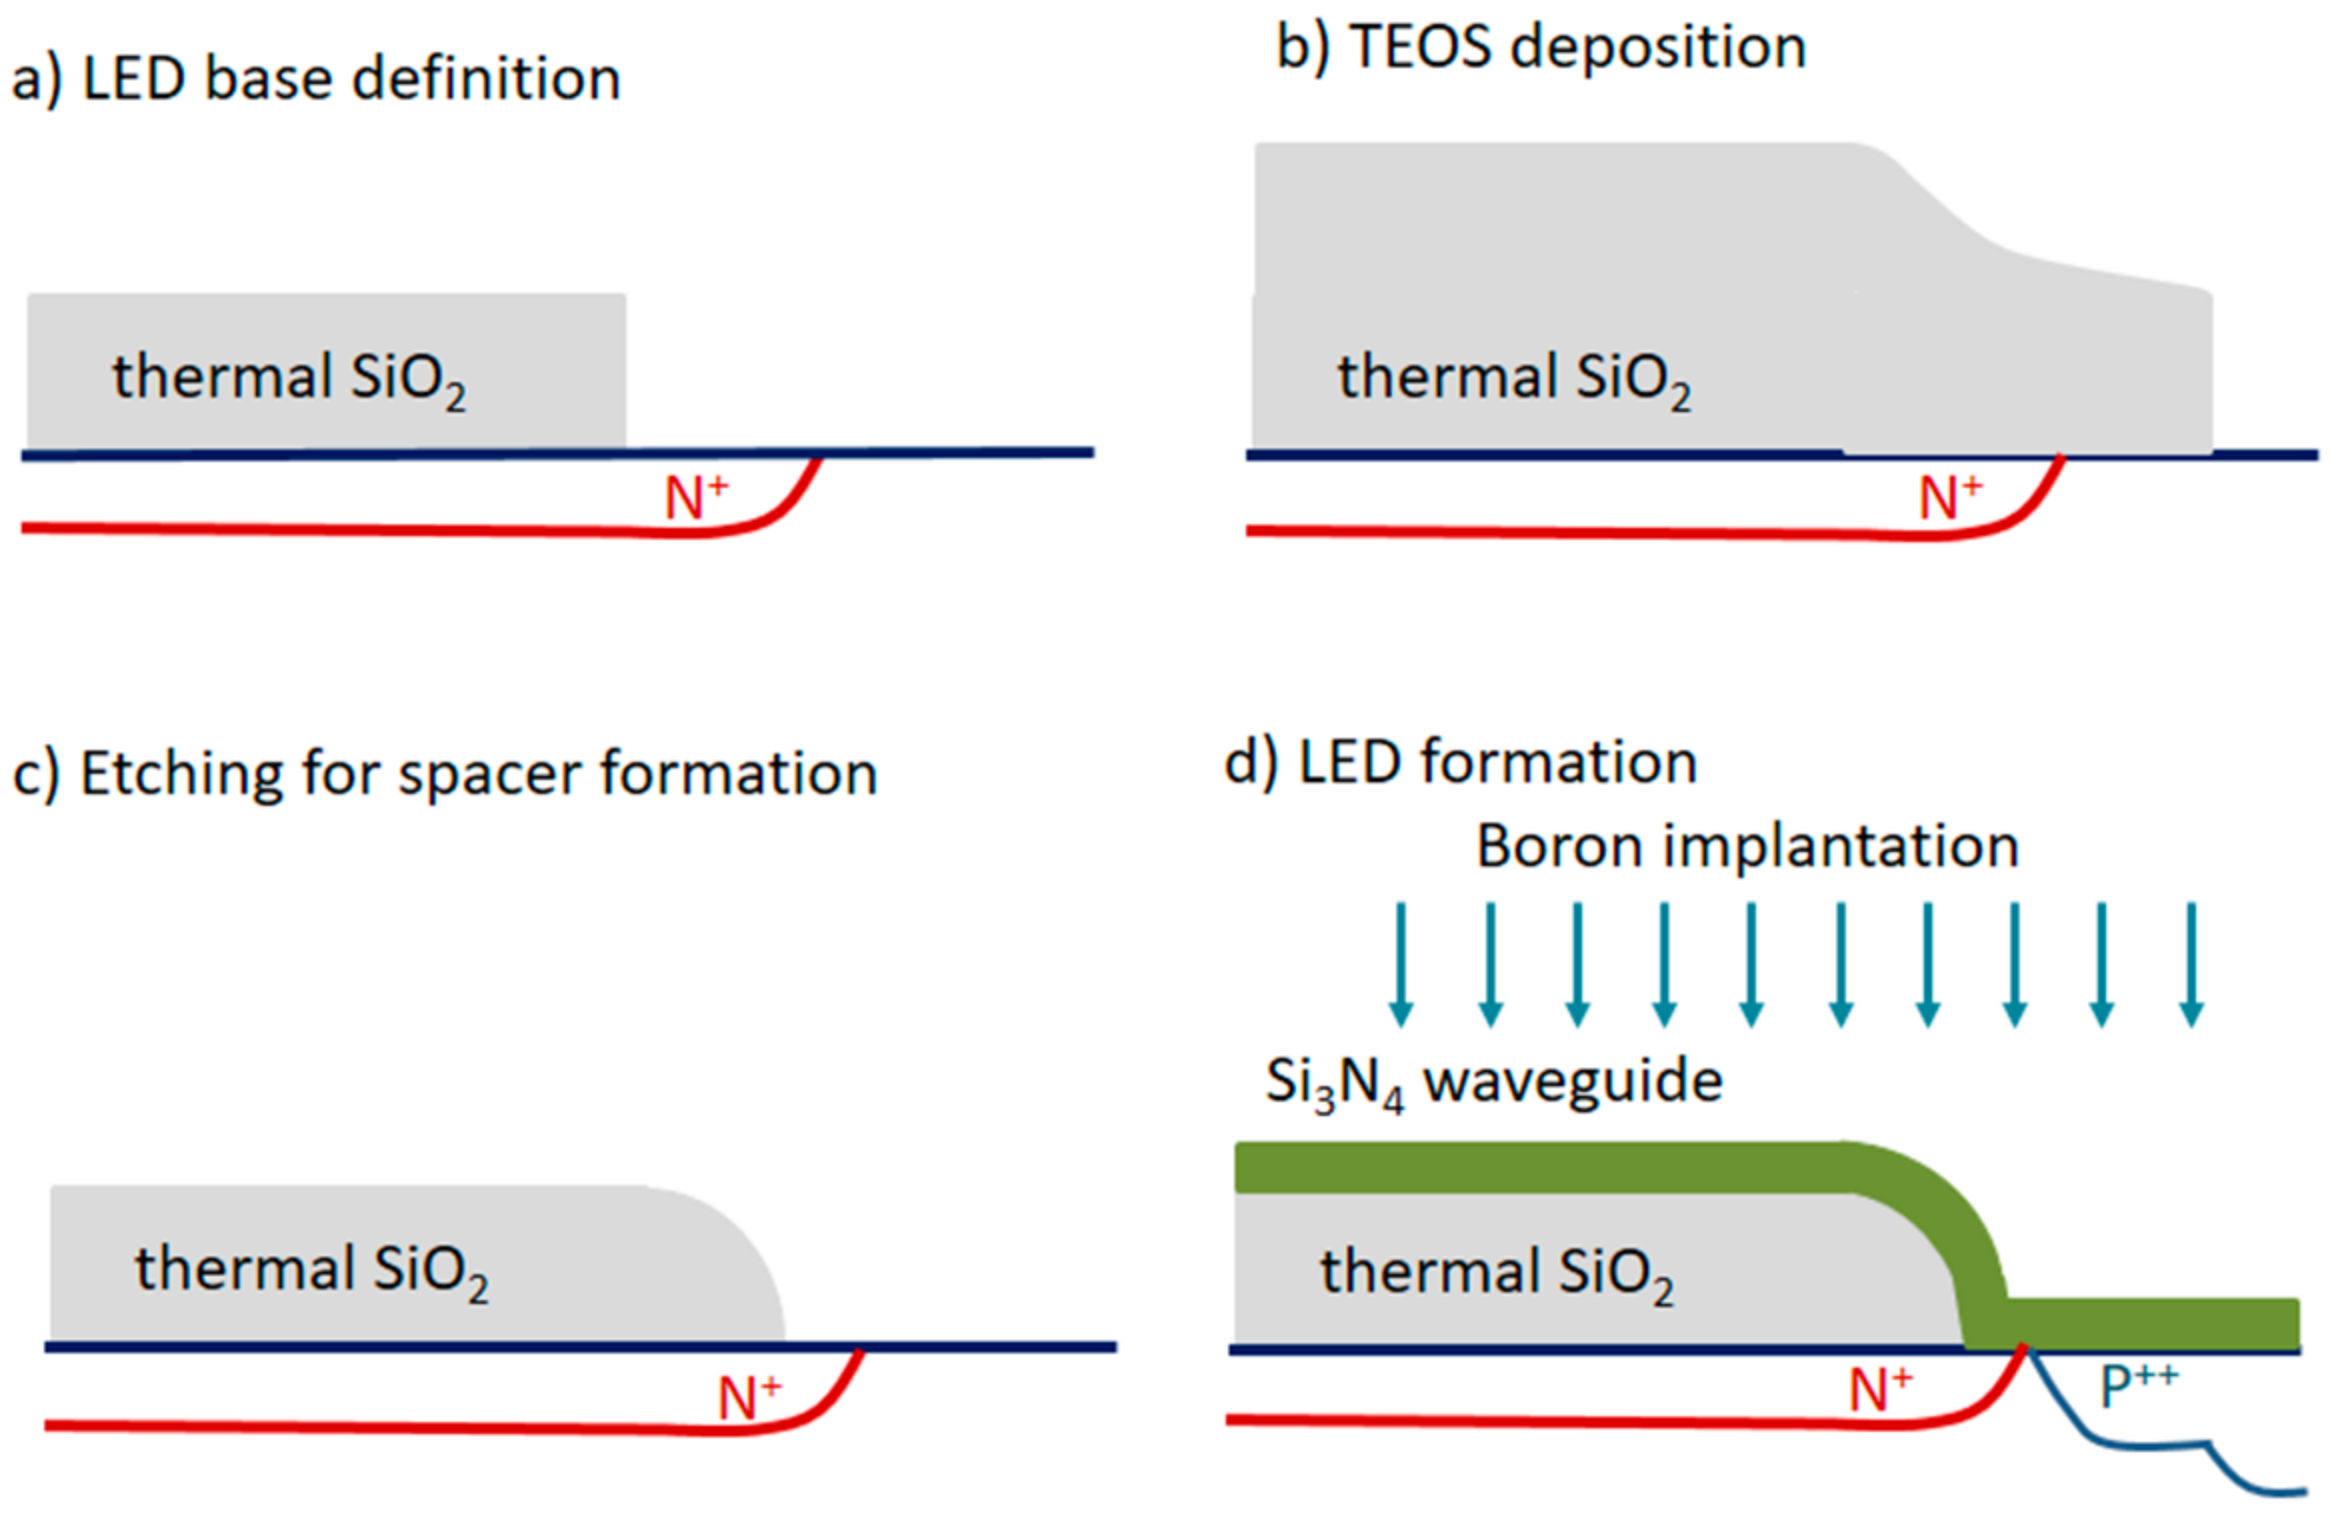
4. Monolithically Integrated Broad-Band Optoelectronic Transducers

The integrated optical transducers described so far employed in their majority monochromatic light sources, i.e., lasers. The replacement of the bulky and energy consuming lasers by broad-band light sources was explored in an attempt to realize sensors suitable for on-site determinations, but also as a solution to the phase ambiguity that limited the MZI performance. Therefore, the first efforts to replace the laser light source by a polychromatic one were performed with MZIs.
In the first reports [121,122], a broad-band light source was coupled to an MZI, and the output light was recorded by an external optical spectrum analyzer in the 1200–1700 nm spectral window. The detection sensitivities achieved were rather moderate, but the potential to overcome the phase ambiguity issue was demonstrated. In an effort to create a low-cost integrated nanophotonic lab-on-a-chip platform, a silicon chip that included multiple Mach–Zehnder interferometers along with an on-chip optical spectral analyser consisting of an arrayed-waveguide grating as well as a grating for the coupling of broad-band light was fabricated [123]. The sensor exhibited a refractive index LOD of 6 × 10⁻⁶ RIU that is comparable to those of LODs achieved with standard MZIs. In addition, the bioanalytical capabilities of the device have been demonstrated through the direct detection of an antigen related to tuberculosis in urine samples as well as the detection of the inflammation marker, C-reactive protein, in buffer.
Similarly to MZIs, it was expected that a broad-band source will enhance the analytical capabilities of the Young interferometers. Thus, it was proven through simulations that since the evanescent field is smaller for shorter wavelengths and more expanded for longer ones, it is possible, through the implementation of broad-band sources to discriminate between biomolecules and bulk RI changes or larger particles, thus offering the ability to distinguish specific binding from non-specific binding and bulk RI changes. The predicted LOD was about 10−6 RIU; nonetheless, these set-ups have not yet been evaluated with binding reactions [124].
Despite the aforementioned efforts for the integration of optical components onto the same chip with the transducer, the light source was not integrated and, even with the more compact broad-band sources, the device size remained substantial. Moreover, the light coupled to the device was just a little fraction of the incident light [125]. The only reliable solution provided so far to this problem was the implementation of silicon light emitting diodes (LED) integrated onto the same silicon chip with planar silicon nitride waveguides [126] as light sources. The LEDs were silicon avalanche diodes that emitted polychromatic light covering all the visible and near IR spectrum when biased beyond their breakdown point [127]. To take full advantage of the integrated light source and due to the low intensity of the emitted light as compared to laser sources, the coupling efficiency had to be maximized and the propagating light losses to be minimized. This was achieved by careful design of the waveguide bending from the horizontal to the vertical direction towards both the light source and the detector, and the alignment of the up-going waveguide segment with the integrated LED. The smooth bending was achieved through the creation of SiO2 spacers with a curvature radius much larger than the waveguide thickness, as shown in Figure 15, where the main steps for the fabrication of LED are presented. The alignment of the LED to the up going segment of the waveguide was realized using the waveguide as a mask during the procedure for the creation of the LED. In detail, the steps followed to realize the integrated LED included: (i) A 2-μm thick thermally grown oxide layer was deposited on the silicon substrate; (ii) the base (N+) side of the avalanche junction was formed by phosphorus implantation in lithographically defined windows in the thermally grown oxide; (iii) a 2-μm silicon dioxide layer was created over the thermal oxide by tetraethyl orthosilicate (TEOS) deposition followed by lithographic patterning, and anisotropic reactive ion etching in CHF3, to end-up with an overall oxide thickness of 2.5 μm; (iv) a nitride film was deposited by low pressure chemical vapour deposition (LPCVD) in a mixture of NH3 and SiH2Cl2, and lithographically patterned and etched in CHF3 anisotropic reactive ion plasma to create the strip waveguides, the one end of which was just above the avalanche diode base area. The thickness of waveguides ranged between 100–150 nm, aiming to increase the sensitivity due to multiple interactions of the evanescent field with the analyte; (v) boron was implanted through the nitride film to form the avalanche junction by phosphorus compensation followed by rapid thermal annealing of the boron implant; and (vi) the cladding layer was formed by silicon oxide deposition and etched away from the middle of the waveguides to create the sensing window. Following this procedure, the misalignment of the avalanche diode emitter to the base was restricted to less than 1 micron, resulting in a light coupling efficiency of about 40% [118]. In addition, the LED was found to be very stable in long-term use, facilitating the implementation of the integrated transducers for biosensing applications.
The first editions of the fully integrated devices described above included arrays of linear waveguides on which signal transduction was based on the modulation of the optical coupling efficiency due to the binding from the immobilized binder molecules of counterpart ones labelled with light absorbing (e.g., fluorescent molecules) or scattering moieties (e.g., gold nanoparticles) [126]. Label-free detection was attempted with the particular transducer through engineering of the waveguide surface with gold nanoparticles [128] or through the creation of a gradient of binder molecules onto the waveguide surface [129]. In the first approach, signal transduction was based on surface plasmon resonance of the surface-immobilized metal nanoparticles. On the second one, transduction was based on the creation through photolithography and plasma etching of one-dimensional pattern of alternating lines of protein-adsorbing and non-adsorbing areas. Binding reactions with the immobilized onto the pattern protein resulted in the filtering-out of resonant photons, providing a mean to monitor them in real-time without using labels.
Nonetheless, the label-free detection capabilities of the integrated transducer were fully exploited, then the integrated waveguide was patterned as a Mach-Zehnder interferometer [130,131,132]. The polychromatic nature of the integrated LED led to the establishment of a new detection principle defined as Frequency-Resolved Mach-Zehnder interferometry [131]. It was shown that the new detection principle was able to surpass the phase ambiguity and signal fading limitations of standard single wavelength MZIs. This resulted from the fact that the phase change is different for each wavelength, and thus the effect of the effective refractive index change due to the binding reactions taking place on the sensing arm of the MZI can be easily deduced from the full transmission spectrum as opposed to a single wavelength. Regarding the fabrication of the integrated MZIs, the LED and the silicon oxide spacers were the same as in the linear transducer; nonetheless, a mode filter was introduced prior to the waveguide to ensure that the light transmitted was monomodal.
Two transducer configurations have been realized; the first described as “fully-integrated” (Figure 16a) and the second as “semi-integrated” (Figure 16b). The fully integrated version incorporated on a single-chip the emitting source, the MZI, and the detector in the form of a photodiode, and provided an LOD of 1 × 10⁻⁵ RIU in terms of the refractive index, while using model binding reactions, the detection of 1 nM of streptavidin and 10 nM of anti-mouse IgG was demonstrated [133]. In the semi-integrated version, the whole output spectrum was recorded, employing an external spectrophotometer, and the spectral shifts over the entire LED spectrum were monitored in real-time. In addition, the two arms of the MZI have been engineered so their phase difference has a linear dependence on the wavelength [132]. Under this condition, the transmission spectrum contains two characteristic frequencies, one for the TE and one for the TM, which can be deconvoluted through signal splitting in the Fourier transform domain, offering the ability to discriminate between cover refractive index changes and binding events occurring at the MZI sensing arm. Regarding the analytical performance of the semi-integrated device, a bulk refractive index LOD of 5 × 10⁻⁶ was determined, while for the model binding assays of biotinylated bovine serum albumin-streptavidin and anti-mouse IgG-mouse IgG, LODs of 5 pM and 32 pM, respectively, were demonstrated, which were considerably lower than that achieved with the fully-integrated device [133].
Due to the superior performance of the semi integrated configuration, the sensor was applied for single- and multi-analyte immunoassays. Thus, the detection of bovine milk in goat milk at levels as low as 0.04% (v/v) and with a dynamic range that varied from 0.1 to 1.0% (v/v) for application to goat milk adulteration was reported [134]. The device was also applied for the detection of mycotoxin ochratoxin A in beer samples with a detection limit of 2.0 ng/mL and a dynamic range of 4.0–100 ng/mL, demonstrating the potential for applications of the device in food analysis [135]. Another single analyte application concerned the determination of CRP, a widely used inflammation marker, in human serum samples with an LOD of 2.1 ng/mL and a quantification limit of 4.2 ng/mL [136]. The CRP concentrations determined in human serum samples were in agreement with those determined for the same samples by a standard clinical laboratory method run in a clinical analyser, further supporting the accuracy of the measurements performed with the developed device.
In addition to single analyte determinations, multiplexed determinations were also performed through appropriate functionalization of the different MZIs of a single chip with the different biomolecules. Thus, the multiplexed detection of mycotoxins, aflatoxin B1, fumonisin B1, and deoxynivalenol in beer samples was presented following a competitive immunoassay format with LODs of 0.8, 5.6, and 24 ng/mL for aflatoxin B1, fumonisin B1, and deoxynivalenol, respectively, and an overall assay duration of 12 min [137]. Through the analysis of beers of different types and origin, the sensor performance was compared with those provided by established instrumental laboratory methods [138]. In addition, the simultaneous, label-free immunochemical detection of four allergens, bovine milk protein, peanut protein, soy protein, and gliadin, in 6.5 min, with LODs of 0.04, 1.0, 0.80, and 0.10 μg/mL, respectively, has been reported. The sensor was evaluated by analysing samples from the cleaning in the place system of a dairy industry and the results obtained were in good agreement with those received by commercial Enzyme-Linked ImmunoSorbent Assays (ELISAs). Apart from the excellent analytical performance, the sensor due to the small chip size (a 10-MZI array is accommodated in a chip of 4.25 × 8.0 cm2) is suitable for the development of a portable instrument for accurate point-of-care applications.
In addition to polychromatic MZIs, the broad-band interferometry principle was also explored in polychromatic YI [139]. It was demonstrated that the use of a broadband source led to an interferogram consisting of two distinct fringe packets, one for each polarization, making feasible the independent determination of the phase signal for the two polarizations over a range of wavelengths. The dual polarization detection ability makes possible the deconvolution of the effect due to cover medium changes from that due to a binding reaction. In the first experimental set-up, an interference filter was employed and only the selected region of the wide emission spectrum of the integrated LED was monitored [140]. Using this set-up, the simultaneous monitoring of biotin-streptavidin and rabbit IgG-anti-rabbit IgG binding reactions was demonstrated. Concentrations of 1 nM streptavidin and 10 nM anti-rabbit IgG resulted in peak shifts of more than one period, suggesting that LODs down to the sub-nM range are feasible, making broad-band YI a competitive sensing approach to other label-free transduction principles.

5. Conclusions and Outlook

In Table 1, the types of biosensors reviewed are compared in terms of detection resolution, expressed in RIU, multiplexing capability, portability, and overall cost of transducer fabrication and instrumentation.
From the information provided in Table 1, as well as at the previous sections it is obvious that amongst the biosensors developed so far, those based on integrated optical transducers demonstrate a high detection resolution that it is translated to excellent analytical performance in different application fields ranging from biodiagnostics to environmental monitoring and food safety. This is to a great extent the result of the great versatility in transducer design enabled by the flexibility of the available principles of operation. Moreover, integrated optical transducers seem to be the only viable solution towards the development of portable platforms that could be used for analysis outside the analytical laboratory, i.e., at the points of need. To this end, an additional asset is the fact that these transducers are fabricated with techniques compatible with large-scale production at a reasonable cost. Despite these advantages, for the time-being, only a few commercial instruments are currently available and the majority of the research efforts has resulted in prototypes that work efficiently only in a laboratory environment. The limiting factor is no longer the integration of all components in a compact device, but the standardization of all the biosensor components as well as of the on-chip assay procedures, the handling of the sample and liquids in general, in a manner that will retain the small size and the portability benefits without affecting the sensor performance. Provided that these challenges will be addressed, this versatile class of optical biosensors could be proved to be the ideal solution for a wide range applications where on-site analytical determinations of high accuracy at short times are required. These applications are expected to expand beyond the already identified ones in food and beverage safety assessment, environmental monitoring, and quantification of disease markers in biological samples. Taking into account the continuing research effort as well as the companies that show an interest in developing or commercializing relevant systems, the label-free biosensors based on integrated optical transducers seem to have not only an interesting past, but a very promising future too.

Author Contributions

S.K. and P.P. conceived, structured, and edited the paper. M.A. wrote Section 3. S.K. and P.P wrote Section 1, Section 2, Section 4 and Section 5.

Acknowledgement

M.A. was supported by the program of Industrial Postdoctoral Scholarships of Stavros Niarchos Foundation.

Conflicts of Interest

The authors declare no conflict of interest.

References

  1. Clark, L., Jr.; Lyons, C. Electrode systems for continuous monitoring in cardiovascular surgery. Ann. N. Y. Acad. Sci. 1962, 102, 29–45. [Google Scholar] [CrossRef] [PubMed]
  2. Anthony, P.F.; Turner, A.P.F. Biosensors: Sense and sensibility. Chem. Soc. Rev. 2013, 42, 3184–3196. [Google Scholar]
  3. Walt, D.R. Optical methods for single molecule detection and analysis. Anal. Chem. 2013, 85, 1258–1263. [Google Scholar] [CrossRef] [PubMed]
  4. Estevez, M.-C.; Alvarez, M.; Lechuga, L.M. Integrated optical devices for lab-on-a-chip biosensing applications. Laser Photonics Rev. 2011, 6, 463–487. [Google Scholar] [CrossRef] [Green Version]
  5. Vashist, S.K.; Luppa, P.B.; Yeo, L.Y.; Ozcan, A.; Luong, J.H.T. Emerging technologies for next-generation point-of-care testing. Trend Biotechnol. 2015, 33, 692–705. [Google Scholar] [CrossRef] [PubMed]
  6. Lopez, G.A.; Estevez, M.-C.; Solera, M.; Lechuga, L.M. Recent advances in nanoplasmonic biosensors: Applications and lab-on-a-chip integration. Nanophotonic 2017, 6, 123–136. [Google Scholar] [CrossRef]
  7. Makarona, E.; Petrou, P.; Kakabakos, S.; Misiakos, K.; Raptis, I. Point-of-Need bioanalytics based on planar optical interferometry. Biotechnol. Adv. 2016, 34, 209–233. [Google Scholar] [CrossRef] [PubMed]
  8. Homola, J. Surface plasmon resonance sensors for detection of chemical and biological species. Chem. Rev. 2008, 108, 462–493. [Google Scholar] [CrossRef] [PubMed]
  9. Piliarik, M.; Sipova, H.; Kvasnicka, P.; Galler, N.; Krenn, J.R.; Homola, J. High-resolution biosensor based on localized surface plasmons. Opt. Express 2012, 20, 672–680. [Google Scholar] [CrossRef] [PubMed]
  10. Sipova, H.; Vrba, D.; Homola, J. Analytical value of detecting an individual molecular binding event: The case of the surface plasmon resonance biosensor. Anal. Chem. 2012, 84, 30–33. [Google Scholar] [CrossRef] [PubMed]
  11. Svedendahl, M.; Chen, S.; Dmitriev, A.; Kall, M. Refractometric sensing using propagating versus localized surface plasmons: A direct comparison. Nano Lett. 2009, 9, 4428–4433. [Google Scholar] [CrossRef] [PubMed]
  12. Estevez, M.C.; Otte, M.A.; Sepulveda, B.; Lechuga, L.M. Trends and challenges of refractometric nanoplasmonic biosensors: A review. Anal. Chim. Acta 2014, 806, 55–73. [Google Scholar] [CrossRef] [PubMed] [Green Version]
  13. Otte, M.A.; Sepulveda, B.; Ni, W.H.; Juste, J.P.; Liz-Marzan, L.M.; Lechuga, L.M. Identification of the optimal spectral region for plasmonic and nanoplasmonic sensing. ACS Nano 2010, 4, 349–357. [Google Scholar] [CrossRef] [PubMed]
  14. Yockell-Lelievre, H.; Bukar, N.; McKeating, K.S.; Arnaud, M.; Cosin, P.; Guo, Y.; Dupret-Carruel, J.; Mougin, B.; Masson, J.F. Plasmonic sensors for the competitive detection of testosterone. Analyst 2015, 140, 5105–5111. [Google Scholar] [CrossRef] [PubMed]
  15. Soler, M.; Estevez, M.C.; Alvarez, M.; Otte, M.A.; Sepulveda, B.; Lechuga, L.M. Direct detection of protein biomarkers in human fluids using site-specific antibody immobilization strategies. Sensors 2014, 14, 2239–2258. [Google Scholar] [CrossRef] [PubMed]
  16. Mazzotta, F.; Johnson, T.W.; Dahlin, A.B.; Shaver, J.; Oh, S.-H.; Höök, F. Influence of the evanescent field decay length on the sensitivity of plasmonic nanodisks and nanoholes. ACS Photonics 2015, 2, 256–262. [Google Scholar] [CrossRef]
  17. Brolo, A.G.; Gordon, R.; Leathem, B.; Kavanagh, K.L. Surface plasmon sensor based on the enhanced light transmission through arrays of nanoholes in gold films. Langmuir 2004, 20, 4813–4815. [Google Scholar] [CrossRef] [PubMed]
  18. Stewart, M.E.; Mack, N.H.; Malyarchuk, V.; Soares, J.A.; Lee, T.W.; Gray, S.K.; Nuzzo, R.G.; Rogers, J.A. Quantitative multispectral biosensing and 1D imaging using quasi-3D plasmonic crystals. Proc. Natl. Acad. Sci. USA 2006, 103, 17143–17148. [Google Scholar] [CrossRef] [PubMed] [Green Version]
  19. Lee, S.H.; Lindquist, N.C.; Wittenberg, N.J.; Jordan, L.R.; Oh, S.H. Real-time full-spectral imaging and affinity measurements from 50 microfluidic channels using nanohole surface plasmon resonance. Lab Chip 2012, 12, 3882–3890. [Google Scholar] [CrossRef] [PubMed]
  20. Eftekhari, F.; Escobedo, C.; Ferreira, J.; Duan, X.; Girotto, E.M.; Brolo, A.G.; Gordon, R.; Sinton, D. Nanoholes as nanochannels: Flow-through plasmonic sensing. Anal. Chem. 2009, 81, 4308–4311. [Google Scholar] [CrossRef] [PubMed]
  21. Kumar, S.; Wittenberg, N.J.; Oh, S.H. Nanopore-induced spontaneous concentration for optofluidic sensing and particle assembly. Anal. Chem. 2012, 85, 971–977. [Google Scholar] [CrossRef] [PubMed]
  22. Kumar, S.; Cherukulappurath, S.; Johnson, T.W.; Oh, S.H. Millimeter-sized suspended plasmonic nanohole arrays for surface-tension-driven flow-through SERS. Chem. Mater. 2014, 26, 6523–6530. [Google Scholar] [CrossRef] [PubMed]
  23. Yanik, A.A.; Huang, M.; Kamohara, O.; Artar, A.; Geisbert, T.W.; Connor, J.H.; Altug, H. An optofluidic nanoplasmonic biosensor for direct detection of live viruses from biological media. Nano Lett. 2010, 10, 4962–4969. [Google Scholar] [CrossRef] [PubMed]
  24. Voros, J.; Ramsden, J.J.; Csucs, G.; Szendro, I.; De Paul, S.M.; Textor, M.; Spencer, N.D. Optical grating coupler biosensors. Biomaterials 2002, 23, 3699–3710. [Google Scholar] [CrossRef]
  25. Nellen, P.M.; Tiefenthaler, K.; Lukosz, W. Integrated optical input grating couplers as biochemical sensors. Sens. Actuators 1988, 15, 285–295. [Google Scholar] [CrossRef]
  26. Nellen, P.M.; Lukosz, W. Integrated optical input grating couplers as chemo- and immunosensors. Sens. Actuators B: Chem. 1990, 1, 592–595. [Google Scholar] [CrossRef]
  27. Lukosz, W.; Clerc, D.; Nellen, P.M.; Stamm, C.; Weiss, P. Output grating couplers on planar optical waveguides as direct immunosensors. Biosens. Bioelectron. 1991, 6, 227–232. [Google Scholar] [CrossRef]
  28. Lukosz, W.; Nellen, P.M.; Stamm, C.; Weis, P. Output grating couplers on planar waveguides as integrated optical chemical sensors. Sens. Actuators B: Chem. 1990, 1, 585–588. [Google Scholar] [CrossRef]
  29. Brandenburg, A.; Polzius, R.; Bier, F.; Bitewski, U.; Wagner, E. Direct observation of affinity reactions by reflected-mode operation of integrated optical grating coupler. Sens. Actuators B: Chem. 1996, 30, 55–59. [Google Scholar] [CrossRef]
  30. Piehler, J.; Brandenburg, A.; Brecht, A.; Wagner, E.; Gauglitz, G. Characterization of grating couplers for affinity-based pesticide sensing. Appl. Opt. 1997, 36, 6554–6562. [Google Scholar] [CrossRef] [PubMed]
  31. Bier, F.F.; Kleinjung, F.; Scheller, F.W. Real-time measurement of nucleic-acid hybridization using evanescent-wave sensors: Steps towards the genosensor. Sens. Actuators B: Chem. 1997, 38, 78–82. [Google Scholar] [CrossRef]
  32. Grego, S.; McDaniel, J.R.; Stoner, B.R. Wavelength interrogation of grating-based optical biosensors in the input coupler configuration. Sens. Actuators B: Chem. 2008, 131, 347–355. [Google Scholar] [CrossRef]
  33. Wiki, M.; Kunz, R.E. Wavelength-interrogated optical sensor for biochemical applications. Opt. Lett. 2000, 25, 463–465. [Google Scholar] [CrossRef] [PubMed]
  34. Cottier, K.; Wiki, M.; Voirin, G.; Gao, H.; Kunz, R.E. Label-free highly sensitive detection of (small) molecules by wavelength interrogation of integrated optical chips. Sens. Actuators B: Chem. 2003, 91, 241–251. [Google Scholar] [CrossRef]
  35. Adrian, J.; Pasche, S.; Diserens, J.M.; Sanchez-Baeza, F.; Gao, H.; Marco, M.P.; Voirin, G. Waveguide interrogated optical immunosensor (WIOS) for detection of sulfonamide antibiotics in milk. Biosens. Bioelectron. 2009, 24, 3340–3346. [Google Scholar] [CrossRef] [PubMed]
  36. Adrian, J.; Pasche, S.; Pinacho, D.G.; Font, H.; Diserens, J.M.; Sanchez-Baeza, J.; Granier, B.; Voirin, G.; Marco, M.P. Wavelength-interrogated optical biosensor for multi-analyte screening of sulfonamide, fluoroquinolone, β-lactam and tetracycline antibiotics in milk. TrAC Trends Anal. Chem. 2009, 28, 769–777. [Google Scholar] [CrossRef]
  37. Suarez, G.; Jin, Y.H.; Auerswald, J.; Berchtold, S.; Knapp, H.F.; Diserens, J.M.; Leterrier, Y.; Manson, J.A.E.; Voirin, G. Lab-on-a-chip for multiplexed biosensing of residual antibiotics in milk. Lab Chip 2009, 9, 1625–1630. [Google Scholar] [CrossRef] [PubMed]
  38. Pasche, S.; Giazzon, M.; Wenger, B.; Franc, G.; Ischer, R.; Oostingh, G.J.; Voirin, G. Monitoring of cellular immune responses with an optical biosensor: A new tool to assess nanoparticle toxicity. Procedia Chem. 2009, 1, 738–741. [Google Scholar] [CrossRef]
  39. Kehl, F.; Etlinger, G.; Gartmann, T.E.; Tscharner, N.S.R.U.; Heub, S.; Follonier, S. Introduction of an angle interrogated, MEMS-based, optical waveguide grating system for label-free biosensing. Sens. Actuators B: Chem. 2016, 226, 135–143. [Google Scholar] [CrossRef]
  40. OWL Sensors. Available online: http://www.owls-sensors.com/ (accessed on 2 November 2018).
  41. Chocarro-Ruiz, B.; Fernandez-Gavela, A.; Sonia Herranz, S.; Lechuga, L.M. Nanophotonic label-free biosensors for environmental monitoring. Curr. Opin. Biotechnol. 2017, 45, 175–183. [Google Scholar] [CrossRef] [PubMed]
  42. Lee, S.; Eom, S.C.; Chang, J.S.; Huh, C.; Sung, G.Y.; Shin, J.H. Label-free optical biosensing using a horizontal air-slot SiNx microdisk resonator. Opt. Exp. 2010, 18, 20638–20644. [Google Scholar] [CrossRef] [PubMed]
  43. Lee, S.; Eom, S.C.; Chang, J.S.; Huh, C.; Sung, G.Y.; Shin, J.H. A silicon nitride microdisk resonator with a 40-nm-thin horizontal air slot. Opt. Exp. 2010, 18, 11209–11215. [Google Scholar] [CrossRef] [PubMed]
  44. Schweinsberg, A.; Hocde, S.; Lepeshkin, N.N.; Boyd, R.W.; Chase, C.; Fajardo, J.E. An environmental sensor based on an integrated optical whispering gallery mode disk resonator. Sens. Actuators B: Chem. 2007, 123, 727–732. [Google Scholar] [CrossRef]
  45. DeVos, K.; Bartolozzi, I.; Schacht, E.; Bienstman, P.; Baets, R. Silicon-on-Insulator microring resonator for sensitive and label-free biosensing. Opt. Exp. 2007, 15, 7610–7615. [Google Scholar] [CrossRef]
  46. Luchansky, M.S.; Washburn, A.L.; Martin, T.A.; Iqbal, M.; Gunn, L.C.; Bailey, R.C. Characterization of the evanescent field profile and bound mass sensitivity of a label-free silicon photonic microring resonator biosensing platform. Biosens. Bioelectron. 2010, 26, 1283–1291. [Google Scholar] [CrossRef] [PubMed] [Green Version]
  47. Armani, A.M.; Kulkarni, R.P.; Fraser, S.E.; Flagan, R.C.; Vahala, K.J. Label-free, single-molecule detection with optical microcavities. Science 2007, 317, 783–786. [Google Scholar] [CrossRef] [PubMed]
  48. Armani, A.M.; Srinivasan, A.; Vahala, K.J. Soft lithographic fabrication of high Q polymer microcavity arrays. Nano Lett. 2007, 7, 1823–1826. [Google Scholar] [CrossRef] [PubMed]
  49. Hunt, H.K.; Soteropulos, C.; Armani, A.M. Bioconjugation strategies for microtoroidal optical resonators. Sensors 2010, 10, 9317–9336. [Google Scholar] [CrossRef] [PubMed]
  50. Zhang, X.M.; Choi, H.S.; Armani, A.M. Ultimate quality factor of silica microtoroid resonant cavities. Appl. Phys. Lett. 2010, 96, 153304. [Google Scholar] [CrossRef]
  51. Ramachandran, A.; Wang, S.; Clarke, J.; Ja, S.J.; Goad, D.; Wald, L.; Flood, E.M.; Knobbe, E.; Hryniewicz, J.V.; Chu, S.T.; et al. A universal biosensing platform based on optical micro-ring resonators. Biosens. Bioelectron. 2008, 23, 939–944. [Google Scholar] [CrossRef] [PubMed]
  52. Ksendzov, A.; Lin, Y. Integrated optics ring-resonator sensors for protein detection. Opt. Lett. 2005, 30, 3344–3346. [Google Scholar] [CrossRef] [PubMed]
  53. Chao, C.-Y.; Guo, L.J. Biochemical sensors based on polymer microrings with sharp asymmetrical resonance. Appl. Phys. Lett. 2003, 83, 1527. [Google Scholar] [CrossRef]
  54. DeVos, K.; Girones, J.; Popelka, S.; Schacht, E.; Baets, R.; Bienstman, P. SOI optical microring resonator with poly(ethylene glycol) polymer brush for label-free biosensor applications. Biosens. Bioelectron. 2009, 24, 2528–2533. [Google Scholar] [CrossRef] [PubMed]
  55. DeVos, K.; Girones, J.; Claes, T.; DeKoninck, Y.; Popelka, S.; Schacht, E.; Baets, R.; Bienstman, P. Multiplexed antibody detection with an array of silicon-on-insulator microring resonators. IEEE Photonics J. 2009, 1, 225–235. [Google Scholar] [CrossRef]
  56. Luchansky, M.S.; Bailey, R.C. Silicon photonic microring resonators for quantitative cytokine detection and T-cell secretion analysis. Anal. Chem. 2010, 82, 1975–1981. [Google Scholar] [CrossRef] [PubMed]
  57. Washburn, A.L.; Gunn, L.C.; Bailey, R.C. Label-free quantitation of a cancer biomarker in complex media using silicon photonic microring resonators. Anal. Chem. 2009, 81, 9499–9506. [Google Scholar] [CrossRef] [PubMed]
  58. Washburn, A.L.; Luchansky, M.S.; Bowman, A.L.; Bailey, R.C. Quantitative label-free detection of five protein biomarkers using multiplexed arrays of silicon photonic microring resonators. Anal. Chem. 2010, 82, 69–72. [Google Scholar] [CrossRef] [PubMed]
  59. Qavi, A.J.; Bailey, R.C. Multiplexed detection and label-free quantitation of microRNAs using arrays of silicon photonic microring resonators. Angew. Chem. Int. Ed. 2010, 49, 4608–4611. [Google Scholar] [CrossRef] [PubMed]
  60. Park, M.K.; Kee, J.S.; Quah, J.Y.; Vivian Netto, V.; Song, J.; Fang, Q.; La Fosse, E.M.; Lo, G.-Q. Label-free aptamer sensor based on silicon microring resonators. Sens. Actuators B: Chem. 2013, 176, 552–559. [Google Scholar] [CrossRef]
  61. Kim, K.W.; Song, J.; Kee, J.S.; Liu, Q.; Lo, G.-Q. Label-free biosensor based on an electrical tracing-assisted silicon microring resonator with a low-cost broad band source. Biosens. Bioelectron. 2013, 46, 15–21. [Google Scholar] [CrossRef] [PubMed]
  62. Shin, Y.; Perera, A.P.; Tang, W.Y.; Fu, D.L.; Liu, Q.; Sheng, J.K.; Gu, Z.; Lee, T.Y.; Barkham, T.; Park, M.K. A rapid amplification/detection assay for analysis of Mycobacterium tuberculosis using an isothermal and silicon bio-photonic sensor complex. Biosens. Bioelectron. 2015, 68, 390–396. [Google Scholar] [CrossRef] [PubMed]
  63. Armani, D.K.; Kippenberg, T.J.; Spillane, S.M.; Vahala, K.J. Ultra-high-Q toroid microcavity on a chip. Nature 2003, 421, 925–928. [Google Scholar] [CrossRef] [PubMed]
  64. Armani, A.M.; Armani, D.K.; Min, B.; Vahala, K.J.; Spillane, S.M. Ultra-high-QQ microcavity operation in H2O and D2O. Appl. Phys. Lett. 2005, 87, 151118. [Google Scholar] [CrossRef]
  65. Knapper, K.A.; Heylman, K.D.; Horak, E.H.; Goldsmith, R.H. Chip-scale fabrication of high-Q all-glass toroidal microresonators for single-particle label-free imaging. Adv. Mater. 2016, 28, 2945–2950. [Google Scholar] [CrossRef] [PubMed]
  66. Choi, H.S.; Zhang, X.M.; Armani, A.M. Hybrid silica-polymer ultra-high-Q microresonators. Opt. Lett. 2010, 35, 459–461. [Google Scholar] [CrossRef] [PubMed]
  67. Anderson, M.E.; O’Brien, E.C.; Grayek, E.N.; Hermansen, J.K.; Hunt, H.K. The detection of Helicobacter hepaticus using whispering-gallery mode microcavity optical sensors. Biosensors 2015, 5, 562–576. [Google Scholar] [CrossRef] [PubMed]
  68. Cunningham, B.; Li, P.; Lin, B.; Pepper, J. Colorimetric resonant reflection as a direct biochemical assay technique. Sens. Actuators B: Chem. 2002, 81, 316–328. [Google Scholar] [CrossRef]
  69. Cunningham, B.; Lin, B.; Qiu, J.; Li, P.; Pepper, J.; Hugh, B. A plastic colorimetric resonant optical biosensor for multiparallel detection of label-free biochemical interactions. Sens. Actuators B: Chem. 2002, 85, 219–226. [Google Scholar] [CrossRef]
  70. Cunningham, B.; Qiu, J.; Li, P.; Lin, B. Enhancing the surface sensitivity of colorimetric resonant optical biosensors. Sens. Actuators B: Chem. 2002, 87, 365–370. [Google Scholar] [CrossRef]
  71. Block, I.D.; Chan, L.L.; Cunningham, B.T. Photonic crystal optical biosensor incorporating structured low-index porous dielectric. Sens. Actuators B: Chem. 2006, 120, 187–193. [Google Scholar] [CrossRef]
  72. Cunningham, B.T.; Li, P.; Schulz, S.; Lin, B.; Baird, C.; Gerstenmaier, J.; Genick, C.; Wang, F.; Fine, E.; Laing, L. Label-Free Assays on the BIND System. J. Biomol. Screen. 2004, 9, 481–489. [Google Scholar] [CrossRef] [PubMed]
  73. Choi, C.J.; Cunningham, B.T. A 96-well microplate incorporating a replica molded microfluidic network integrated with photonic crystal biosensors for high throughput kinetic biomolecular interaction analysis. Lab Chip 2007, 7, 550–556. [Google Scholar] [CrossRef] [PubMed]
  74. Cunningham, B.T.; Laing, L. Microplate-based, label-free detection of biomolecular interactions: Applications in proteomics. Expert Rev. Proteom. 2006, 3, 271–281. [Google Scholar] [CrossRef] [PubMed]
  75. Srubio Systems. Available online: www.srubiosystems.com (accessed on 2 November 2018).
  76. Foresi, J.S.; Villeneuve, P.R.; Ferrera, J.; Thoen, E.R.; Steinmeyer, G.; Fan, S.; Joannopoulos, J.D.; Kimerling, L.C.; Smith, H.I.; Ippen, E.P. Photonic-bandgap microcavities in optical waveguides. Nature 1997, 390, 143–145. [Google Scholar] [CrossRef]
  77. Dorfner, D.; Zabel, T.; Hurlimann, T.; Hauke, N.; Frandsen, L.; Rant, U.; Abstreiter, G.; Finley, J. Photonic crystal nanostructures for optical biosensing applications. Biosens. Bioelectron. 2009, 24, 3688–3692. [Google Scholar] [CrossRef] [PubMed]
  78. Garcıa-Ruperez, J.; Toccafondo, V.; Banuls, M.J.; Castello, J.G.; Griol, A.; Peransi-Llopis, S.; Maquieira, A. Label-free antibody detection using band edge fringes in SOI planar photonic crystal waveguides in the slow-light regime. Opt. Exp. 2010, 18, 24276–24286. [Google Scholar] [CrossRef] [PubMed]
  79. Toccafondo, V.; Garcıa-Ruperez, J.; Banuls, M.J.; Griol, A.; Castello, J.G.; Peransi-Llopis, S.; Maquieira, A. Single-strand DNA detection using a planar photonic-crystal-waveguide-based sensor. Opt. Lett. 2010, 35, 3673–3675. [Google Scholar] [CrossRef] [PubMed]
  80. Mandal, S.; Erickson, D. Nanoscale optofluidic sensor arrays. Opt. Exp. 2008, 16, 1623–1631. [Google Scholar] [CrossRef]
  81. Mandal, S.; Goddard, J.M.; Erickson, D. A multiplexed optofluidic biomolecular sensor for low mass detection. Lab Chip 2009, 9, 2924–2932. [Google Scholar] [CrossRef] [PubMed]
  82. Lee, M.; Fauchet, P.M. Two-dimensional silicon photonic crystal based biosensing platform for protein detection. Opt. Exp. 2007, 15, 4530–4535. [Google Scholar] [CrossRef]
  83. Pal, S.; Guillermain, E.; Sriram, R.; Miller, B.L.; Fauchet, P.M. Silicon photonic crystal nanocavity-coupled waveguides for error-corrected optical biosensing. Biosens. Bioelectron. 2011, 26, 4024–4031. [Google Scholar] [CrossRef] [PubMed] [Green Version]
  84. Zlatanovic, S.; Mirkarimi, L.W.; Sigalas, M.M.; Bynum, M.A.; Chow, E.; Robotti, K.M.; Burr, G.W.; Esener, S.; Grot, A. Photonic crystal microcavity sensor for ultracompact monitoring of reaction kinetics and protein concentration. Sens. Actuators B: Chem. 2009, 141, 13–19. [Google Scholar] [CrossRef]
  85. Zhang, B.; Morales, A.W.; Peterson, R.; Tang, L.; Ye, J.Y. Label-free detection of cardiac troponin I with a photonic crystal biosensor. Biosens. Bioelectron. 2014, 58, 107–113. [Google Scholar] [CrossRef] [PubMed] [Green Version]
  86. Takahashi, D.; Hachuda, S.; Watanabe, T.; Nishijima, Y.; Baba, T. Detection of endotoxin using a photonic crystal nanolaser. Appl. Phys. Lett. 2015, 106, 131112. [Google Scholar] [CrossRef]
  87. Mandal, S.; Serey, X.; Erickson, D. Nanomanipulation using silicon photonic crystal resonators. Nano Lett. 2010, 10, 99–104. [Google Scholar] [CrossRef] [PubMed]
  88. Erickson, D.; Serey, X.; Chen, Y.-F.; Mandal, S. Nanomanipulation using near field photonics. Lab Chip 2011, 11, 995–1009. [Google Scholar] [CrossRef] [PubMed]
  89. Kozma, P.; Kehl, F.; Ehrentreich-Förster, E.; Stamm, C.; Bier, F.F. Integrated planar optical waveguide interferometer biosensors: A comparative review. Biosens. Bioelectron. 2014, 58, 287–307. [Google Scholar] [CrossRef] [PubMed]
  90. Heideman, R.G.; Kooyman, R.P.H.; Greve, J. Development of an optical waveguide interferometric immunosensor. Sens. Actuators B: Chem. 1991, 4, 297–299. [Google Scholar] [CrossRef] [Green Version]
  91. Heideman, R.G.; Kooyman, R.P.H.; Greve, J. Performance of a highly sensitive optical waveguide Mach-Zehnder interferometer immunosensor. Sens. Actuators B: Chem. 1993, 10, 209–217. [Google Scholar] [CrossRef] [Green Version]
  92. Schipper, E.F.; Brugman, A.M.; Dominguez, C.; Lechuga, L.M.; Kooyman, R.P.H.; Greve, J. The realization of an integrated Mach-Zehnder waveguide immunosensor in silicon technology. Sens. Actuators B: Chem. 1997, 40, 147–153. [Google Scholar] [CrossRef] [Green Version]
  93. Brosinger, F.; Freimuth, H.; Lacher, M.; Ehrfeld, W.; Gedig, E.; Katerkamp, A.; Spener, F.; Cammann, K. A label-free affinity sensor with compensation of unspecific protein interaction by a highly sensitive integrated optical Mach-Zehnder interferometer on silicon. Sens. Actuators B: Chem. 1997, 44, 350–355. [Google Scholar] [CrossRef]
  94. Drapp, B.; Piehler, J.; Brecht, A.; Gauglitz, G.; Luff, B.J.; Wilkinson, J.S.; Ingenhoff, J. Integrated optical Mach-Zehnder interferometers as simazine immunoprobes. Sens. Actuators B: Chem. 1997, 38–39, 277–282. [Google Scholar] [CrossRef]
  95. Prieto, F.; Sepulveda, B.; Calle, A.; Llobera, A.; Dominguez, C.; Abad, A.; Montoya, A.; Lechuga, L.M. An integrated optical interferometric nanodevice based on silicon technology for biosensor applications. Nanotechnology 2003, 14, 907–912. [Google Scholar] [CrossRef]
  96. Prieto, F.; Sepulveda, B.; Calle, A.; Llobera, A.; Domınguez, C.; Lechuga, L.M. Integrated Mach-Zehnder interferometer based on ARROW structures for biosensor applications. Sens. Actuators B: Chem. 2003, 92, 151–158. [Google Scholar] [CrossRef]
  97. Sarkar, D.; Gunda, N.S.K.; Jamal, I.; Mitra, S.K. Optical biosensors with an integrated Mach-Zehnder Interferometer for detection of Listeria monocytogenes. Biomed. Microdevices 2014, 16, 509–520. [Google Scholar] [CrossRef] [PubMed]
  98. Chalyan, T.; Guider, R.; Pasquardini, L.; Zanetti, M.; Falke, F.; Schreuder, E.; Heideman, R.G.; Pederzolli, C.; Pavesi, L. Asymmetric Mach-Zehnder interferometer based biosensors for aflatoxin M1 detection. Biosensors 2016, 6, 1–10. [Google Scholar] [CrossRef] [PubMed]
  99. Barrios, C.A. Optical slot-waveguide based biochemical sensors. Sensors 2009, 9, 4751–4765. [Google Scholar] [CrossRef] [PubMed]
  100. Liu, Q.; Tu, X.; Kim, K.W.; Kee, J.S.; Shin, Y.; Han, K.; Yoon, Y.-J.; Lo, G.-Q.; Park, M.K. Highly sensitive Mach–Zehnder interferometer biosensor based on silicon nitride slot waveguide. Sens. Actuators B: Chem. 2013, 188, 681–688. [Google Scholar] [CrossRef]
  101. Liu, Q.; Shin, Y.; Kee, J.S.; Kim, K.W.; Rafei, S.R.M.; Perera, A.P.; Tu, X.; Lo, G.-Q.; Ricci, E.; Colombel, M.; et al. Mach–Zehnder interferometer (MZI) point-of-care system for rapid multiplexed detection of microRNAs in human urine specimens. Biosens. Bioelectron. 2015, 71, 365–372. [Google Scholar] [CrossRef] [PubMed]
  102. Melnik, E.; Bruck, R.; Muellner, P.; Schlederer, T.; Hainberger, R.; Lammerhofer, M. Human IgG detection in serum on polymer based Mach-Zehnder interferometric biosensors. J. Biophotonics 2016, 9, 218–223. [Google Scholar] [CrossRef] [PubMed]
  103. Ymeti, A.; Greve, J.; Lambeck, P.V.; Wink, T.; van Hovell, S.W.F.M.; Beumer, T.A.M.; Wijn, R.R.; Heideman, R.G.; Subramaniam, V.; Kanger, J.S. Fast, Ultrasensitive virus detection using a Young Interferometer sensor. Nano Lett. 2007, 7, 394–397. [Google Scholar] [CrossRef] [PubMed]
  104. Brandenburg, A.; Krauter, R.; Kunzel, C.; Stefan, M.; Schulte, H. Interferometric sensor for detection of surface-bound bioreactions. Appl. Opt. 2000, 39, 6396–6405. [Google Scholar] [CrossRef] [PubMed]
  105. Schmitt, K.; Schirmer, B.; Hoffmann, C.; Brandenburg, A.; Meyrueis, P. Interferometric biosensor based on planar optical waveguide sensor chips for label-free detection of surface bound bioreactions. Biosens. Bioelectron. 2007, 22, 2591–2597. [Google Scholar] [CrossRef] [PubMed]
  106. Brynda, E.; Houska, M.; Brandenburg, A.; Wikerstal, A. Optical biosensors for real-time measurement of analytes in blood plasma. Biosens. Bioelectron. 2002, 17, 665–675. [Google Scholar] [CrossRef]
  107. Hoffmann, C.; Schmitt, K.; Brandenburg, A.; Hartmann, S. Rapid protein expression analysis with an interferometric biosensor for monitoring protein production. Anal. Bioanal. Chem. 2007, 387, 1921–1932. [Google Scholar] [CrossRef] [PubMed]
  108. Nagel, T.; Ehrentreich-Forster, E.; Singh, M.; Schmitt, K.; Brandenburg, A.; Berka, A.; Bier, F.F. Direct detection of tuberculosis infection in blood serum using three optical label-free approaches. Sens. Actuators B: Chem. 2008, 129, 934–940. [Google Scholar] [CrossRef]
  109. Ymeti, A.; Kanger, J.S.; Greve, J.; Lambeck, P.V.; Wijn, R.; Heideman, R.G. Realization of a multichannel integrated Young interferometer chemical sensor. Appl. Opt. 2003, 42, 5649–5660. [Google Scholar] [CrossRef] [PubMed]
  110. Ymeti, A.; Greve, J.; Lambeck, P.V.; Wijn, R.; Heideman, R.G.; Kanger, J.S. Drift correction in a multichannel integrated optical Young interferometer. Appl. Opt. 2005, 44, 3409–3412. [Google Scholar] [CrossRef] [PubMed]
  111. Ymeti, A.; Kanger, J.S.; Greve, J.; Besselink, G.A.J.; Lambeck, P.V.; Wijn, R.; Heideman, R.G. Integration of microfluidics with a four-channel integrated optical Young interferometer immunosensor. Biosens. Bioelectron. 2005, 20, 1417–1421. [Google Scholar] [CrossRef] [PubMed]
  112. Hiltunen, M.; Hiltunen, J.; Stenberg, P.; Aikio, S.; Kurki, L.; Vahimaa, P.; Karioja, P. Polymeric slot waveguide interferometer for sensor applications. Opt Exp. 2014, 22, 7229–7237. [Google Scholar] [CrossRef] [PubMed]
  113. Aikio, S.; Zeilinger, M.; Hiltunen, J.; Hakalahti, L.; Hiitola-Keinanen, J.; Hiltunen, M.; Kontturi, V.; Siitonen, S.; Puustinen, J.; Lieberzeit, P.; et al. Disposable (bio)chemical integrated optical waveguide sensors implemented on roll-to-roll produced platforms. RSC Adv. 2016, 6, 50414–50422. [Google Scholar] [CrossRef] [Green Version]
  114. Zinoviev, K.E.; Gonzalez-Guerrero, A.B.; Domınguez, C.; Lechuga, L.M. Integrated bimodal waveguide interferometric biosensor for label-free analysis. J. Lightwave Technol. 2011, 29, 1926–1930. [Google Scholar] [CrossRef]
  115. Duval, D.; Gonzalez-Guerrero, A.B.; Dante, S.; Osmond, J.; Monge, R.; Fernandez, L.J.; Zinoviev, K.E.; Domınguez, C.; Lechuga, L.M. Nanophotonic lab-on-a-chip platforms including novel bimodal interferometers, microfluidics and grating couplers. Lab Chip 2012, 12, 1987–1994. [Google Scholar] [CrossRef] [PubMed]
  116. González-Guerrero, A.B.; Maldonado, J.; Dante, S.; Grajales, D.; Lechuga, L.M. Direct and label-free detection of the human growth hormone in urine by an ultrasensitive bimodal waveguide biosensor. J. Biophotonics 2016, 10, 61–67. [Google Scholar] [CrossRef] [PubMed] [Green Version]
  117. Maldonado, J.; González-Guerrero, A.B.; Domínguez, C.; Lechuga, L.M. Label-free bimodal waveguide immunosensor for rapid diagnosis of bacterial infections in cirrhotic patients. Biosens. Bioelectron. 2016, 85, 310–316. [Google Scholar] [CrossRef] [PubMed] [Green Version]
  118. Huertas, C.S.; Fariña, D.; Lechuga, L.M. Direct and label-free quantification of micro-RNA-181a at attomolar level in complex media using a nanophotonic biosensor. ACS Sens. 2016, 1, 748–756. [Google Scholar] [CrossRef]
  119. Chocarro-Ruiz, B.; Herranz, S.; Fernández Gavela, A.; Sanchís, J.; Farré, M.; Marco, M.P.; Lechuga, L.M. Interferometric nanoimmunosensor for label-free and real-time monitoring of Irgarol 1051 in seawater. Biosens. Bioelectron. 2018, 117, 47–52. [Google Scholar] [CrossRef] [PubMed]
  120. Szydzik, C.; Gavela, A.F.; Herranz, S.; Roccisano, J.; Knoerzer, M.; Thurgood, P.; Khoshmanesh, K.; Mitchell, A.; Lechuga, L.M. An automated optofluidic biosensor platform combining interferometric sensors and injection moulded microfluidics. Lab Chip 2017, 17, 2793–2804. [Google Scholar] [CrossRef] [PubMed]
  121. Luo, D.H.; Levy, R.A.; Hor, Y.F.; Federici, J.F.; Pafchek, R.M. An integrated photonic sensor for in situ monitoring of hazardous organics. Sens Actuator B 2003, 92, 121–126. [Google Scholar] [CrossRef]
  122. Li, Y.; Harris, E.; Chen, L.; Bao, X. Application of spectrum differential integration method in an in-line fiber Mach-Zehnder refractive index sensor. Opt Express 2010, 18, 8135–8143. [Google Scholar] [CrossRef] [PubMed]
  123. Martens, D.; Ramirez-Priego, P.; Murib, M.S.; Elamin, A.A.; Gonzalez-Guerrero, A.B.; Stehr, M.; Jonas, F.; Anton, B.; Hlawatsch, N.; Soetaert, P.; et al. A low-cost integrated biosensing platform based on SiN nanophotonics for biomarker detection in urine. Anal. Method 2018, 10, 3066–3073. [Google Scholar] [CrossRef]
  124. Mulder, H.K.P.; Ymeti, A.; Subramaniam, V.; Kanger, J.S. Size-selective detection in integrated optical interferometric biosensors. Opt. Exp. 2012, 20, 20934. [Google Scholar] [CrossRef] [PubMed] [Green Version]
  125. Nagata, T.; Namba, T.; Kuroda, Y.; Miyake, K.; Miyamoto, T.; Yokoyama, S.; Miyazaki, S.; Koyanagi, M.; Hirose, M. Single-chip integration of light-emitting diode, waveguide and micromirrors. Jpn. J. Appl. Phys. 1995, 34, 1282–1285. [Google Scholar] [CrossRef]
  126. Misiakos, K.; Kakabakos, S.E.; Petrou, P.S.; Ruf, H.H. A monolithic silicon optoelectronic transducer as a real-time affinity biosensor. Anal. Chem. 2004, 76, 1366–1373. [Google Scholar] [CrossRef] [PubMed]
  127. Chynoweth, A.G.; McKay, K.G. Photon emission from avalanche breakdown in silicon. Phys. Rev. 1956, 102, 369–376. [Google Scholar] [CrossRef]
  128. Petrou, P.S.; Kakabakos, S.E.; Misiakos, K. Silicon optocouplers for biosensing. Int. J. Nanotechnol. 2009, 6, 4–17. [Google Scholar] [CrossRef]
  129. Misiakos, K.; Petrou, P.S.; Kakabakos, S.E.; Yannoukakos, D.; Contopanagos, H.; Knoll, T.; Velten, T.; DeFazio, M.; Schiavo, L.; Passamano, M.; et al. Fully integrated monolithic optoelectronic transducer for real-time protein and DNA detection: The NEMOSLAB approach. Biosens. Bioelectron. 2010, 26, 1528–1535. [Google Scholar] [CrossRef] [PubMed]
  130. Kitsara, M.; Raptis, I.; Misiakos, K.; Makarona, E. Broad-band mach-zehnder interferometry as a detection principle for label-free biochemical sensing. In Proceedings of the IEEE Sensor 2008, Lecce, Italy, 26–29 October 2008; pp. 934–937. [Google Scholar]
  131. Misiakos, K.; Raptis, I.; Salapatas, A.; Makarona, E.; Botsialas, A.; Hoekman, M.; Stoffer, R.; Jobst, G. Broad-band Mach-Zehnder interferometers as high performance refractive index sensors: Theory and monolithic implementation. Opt. Exp. 2014, 22, 8856–8870. [Google Scholar] [CrossRef] [PubMed]
  132. Misiakos, K.; Raptis, I.; Makarona, E.; Botsialas, A.; Salapatas, A.; Oikonomou, P.; Psarouli, A.; Petrou, P.S.; Kakabakos, S.E.; Tukkiniemi, K.; et al. All-silicon monolithic Mach-Zehnder interferometer as a refractive index and biochemical sensor. Opt. Exp. 2014, 22, 26803–26813. [Google Scholar] [CrossRef] [PubMed]
  133. Psarouli, A.; Salapatas, A.; Botsialas, A.; Petrou, P.S.; Raptis, I.; Makarona, E.; Jobst, G.; Tukkiniemi, K.; Sopanen, M.; Stoffer, R.; et al. Monolithically integrated broad-band Mach-Zehnder interferometers for highly sensitive label-free detection of biomolecules through dual polarization optics. Sci. Rep. 2015, 5, 17600. [Google Scholar] [CrossRef] [PubMed] [Green Version]
  134. Angelopoulou, Μ.; Botsialas, A.; Salapatas, A.; Petrou, P.S.; Haasnoot, W.; Makarona, E.; Jobst, G.; Goustouridis, D.; Siafaka-Kapadai, A.; Raptis, I.; et al. Assessment of goat milk adulteration with a label-free monolithically integrated optoelectronic biosensor. Anal. Bioanal. Chem. 2015, 407, 3995–4004. [Google Scholar] [CrossRef] [PubMed]
  135. Pagkali, V.; Petrou, P.S.; Salapatas, A.; Makarona, E.; Peters, J.; Haasnoot, W.; Jobst, G.; Economou, A.; Misiakos, K.; Raptis, I.; et al. Detection of ochratoxin A in beer samples with a label-free monolithically integrated optoelectronic biosensor. J. Hazard. Mater. 2017, 323, 75–83. [Google Scholar] [CrossRef] [PubMed]
  136. Psarouli, A.; Botsialas, A.; Salapatas, A.; Stefanitsis, G.; Nikita, D.; Jobst, G.; Chaniotakis, N.; Goustouridis, D.; Makarona, E.; Petrou, P.S.; et al. Fast label-free detection of C-reactive protein using broad-band Mach Zehnder interferometers integrated on silicon chips. Talanta 2017, 165, 458–465. [Google Scholar] [CrossRef] [PubMed]
  137. Pagkali, V.; Petrou, P.S.; Makarona, E.; Peters, J.; Haasnoot, W.; Jobst, G.; Moser, I.; Gajos, K.; Budkowski, A.; Economou, A.; et al. Simultaneous determination of aflatoxin B1, fumonisin B1 and deoxynivalenol in beer samples with a label-free monolithically integrated optoelectronic biosensor. J. Hazard. Mater. 2018, 359, 445–453. [Google Scholar] [CrossRef] [PubMed]
  138. Angelopoulou, M.; Petrou, P.S.; Makarona, E.; Haasnoot, W.; Moser, I.; Jobst, G.; Goustouridis, D.; Lees, M.; Kalatzi, K.; Raptis, I.; et al. Ultrafast multiplexed-allergen detection through advanced fluidic design and monolithic interferometric silicon chips. Anal. Chem. 2018, 90, 9559–9567. [Google Scholar] [CrossRef] [PubMed]
  139. Makarona, E.; Salapatas, A.; Raptis, I.; Petrou, P.; Kakabakos, S.; Stavra, E.; Malainou, A.; Misiakos, K. Broadband Young interferometry for simultaneous dual polarization bioanalytics. J. Opt. Soc. Am. B: Opt. Phys. 2017, 34, 1691–1698. [Google Scholar] [CrossRef]
  140. Savra, E.; Malainou, A.; Salapatas, A.; Botsialas, A.; Petrou, P.; Raptis, I.; Makarona, E.; Kakabakos, S.E.; Misiakos, K. Monolithically-integrated Young interferometers for label-free and multiplexed detection of biomolecules. Proc. SPIE 2016, 9752, 97520N. [Google Scholar]
Figure 1. Schematic of the evanescent field sensing principle. The binding of analyte by the immobilized onto the waveguide binder molecules occurring within the evanescent field leads to a change in the effective refractive index of the transmitted light mode that is proportional to the amount of bound analyte molecules.
Chemosensors 06 00052 g001
Figure 2. Schematic depiction of the most common configurations for (a) Surface Plasmon Resonance (SPR) and (b) Localized Surface Plasmon Resonance (LSPR) sensors.
Chemosensors 06 00052 g002
Figure 3. Image of three-dimensional nanohole arrays either functionalized with specific antiviral antibodies or non-functionalized to serve as a reference (a) prior to and (b) after the binding of viruses. (c) Response of the reference sensor where no observable shift is detected. (d) Response of an antiviral antibody functionalized sensor indicating a strong red-shift of the plasmonic resonances (~100 nm). Reprinted with permission from [23] copyright (2010) American Chemical Society. VSV: vesicular stomatitis virus.
Chemosensors 06 00052 g003
Figure 4. Basic configurations of grating coupler-based optical sensors employing (a) gratings with different periods for light input and output or (b) a single grating with a different thickness layer.
Chemosensors 06 00052 g004
Figure 5. (a) The wavelength-interrogated optical system (WIOS). The chip contains 24 sensing sites, which are excited by a laser (763 nm) incident on the first grating. The waveguided mode propagates into the metal layer and the guided light is sent out by the second grating and collected by large plastic optical fibers. (b) Schematic of assay configurations for the simultaneous detection of sulfonamide, fluoroquinolone, b-lactam, and tetracycline, showing the reagents and the reactions taking place on each sensor pad. Reprinted with permission from [35] copyright (2009) Elsevier Ltd.
Chemosensors 06 00052 g005
Figure 6. Angle interrogated optical sensor (ARGOS) main components (a) and principle of operation (b,c). The angle of the incident laser light is constantly scanned by a micro-electro-mechanical system mirror. Refractive index changes due to the binding reaction onto the sensor surface change the in-coupling light angle. Thus, by plotting the resonance peak position over time, the desired sensorgram is obtained. Reprinted with permission from [39] copyright (2015) Elsevier Ltd.
Chemosensors 06 00052 g006
Figure 7. (a) Basic configuration of a microring resonator. (b) Scanning electron micrograph of a Si microring resonator adjacent to a linear waveguide. Reprinted with permission from [46] copyright (2010) Elsevier Ltd. (c) Optical micrograph of a silica microtoroid fabricated on a silicon wafer along with a typical resonance spectra. Reproduced from [49], with the permission of AIP Publishing.
Chemosensors 06 00052 g007
Figure 8. Schematic of the electrical tracing-assisted dual-microring resonator optical sensor system (a) and of the expected shift in the resonance wavelength after a binding reaction (b). Reprinted with permission from [61] copyright (2013) Elsevier Ltd. (c) Image of the device used for the detection of Mycobacterium tuberculosis. Reprinted with permission from [62] copyright (2015) Elsevier Ltd.
Chemosensors 06 00052 g008
Figure 9. Schematic of a photonic crystal operational principle. TE: Transverse Electric mode.
Chemosensors 06 00052 g009
Figure 10. (a) Optical microscope (left) and scanning electron microscope images (right) of a photonic crystal structure showing the nanocavity in the vicinity of the photonic crystal waveguide and a waveguide nanocavity formed by shifting holes perpendicular to its direction. Reprinted with permission from [77] copyright (2009) Elsevier Ltd. (b) Scanning electron microscope image of a fabricated photonic crystal nanocavity device. Reprinted with permission from [83] copyright (2011) Elsevier Ltd. (c) Scanning electron micrograph of a photonic crystal nanolaser device (left) and its use in a measurement (right). Reproduced from [86], with the permission of AIP Publishing. WMC: width modulated cavity.
Chemosensors 06 00052 g010
Figure 11. Schematic presentations of the basic configuration of integrated (a) Mach-Zehnder, (b) Young, and (c) bi-modal interferometers.
Chemosensors 06 00052 g011
Figure 12. (a) Schematic of the slot-waveguide based Mach-Zehnder Interferometer (MZI) biosensor in which the reference arm is a silicon nitride strip waveguide while the sensing arm is a silicon nitride slot waveguide. Reprinted with permission from [100] copyright (2013) Elsevier Ltd. (b) Schematic of a slot-waveguide based MZI biosensor array used for RNA detection. Shown at the bottom are: (right) Transmission Electron Microscope images of the cross section of a slot waveguide, Scanning Electron Microscope images of (middle) the slot-waveguide and (left) of the silicon nitride grating used for light in-coupling. At the upper part, images of the experimental set-up are included. Reprinted with permission from [101] copyright (2015) Elsevier Ltd.
Chemosensors 06 00052 g012
Figure 13. (a) Schematic of the four-channel integrated optical Young Interferometer (YI) sensor. The numbers, 1, 2, and 3, indicate the measuring channels, and 4 is the reference channel. Reprinted with permission from [103] copyright (2007) American Chemical Society. (b) Top-view of the microfluidic system aligned on a four-channel integrated optical YI chip. Reprinted with permission from [111] copyright (2004) Elsevier Ltd.
Chemosensors 06 00052 g013
Figure 14. (A) Schematic of the bimodal interferometer sensing principle. Light is coupled in the single mode rib waveguide and after a modal splitter; two modes are excited and propagate until the device output. (B) Photograph of the chip containing 16 bimodal interferometric sensors. (C) Photograph of the experimental set-up for the evaluation of the bimodal interferometric sensors. Reprinted with permission from [119] copyright (2018) Elsevier Ltd.
Chemosensors 06 00052 g014
Figure 15. The basic steps of the integrated transducer fabrication: Avalanche diode base formation (a), spacer formation through dioxide deposition (b) and plasma etching (c), and self-aligned emitter formation by implantation through the waveguide nitride film (d). LED: light emmiting diode; TEOS: tetraethyl orthosilicate.
Chemosensors 06 00052 g015
Figure 16. (a) The fully-integrated broad-band MZI configuration. (a1) Cross-view schematic of a single MZI sensor. (a2) Image of chip accommodating 10 integrated MZIs with the fluidic cover on top (upper part) and a top-view schematic of the chip (bottom part). The pads on the left are the 10 LED emitter contacts and grounds, and the 10 MZIs converge on the same detector (right contact pads). The chip dimensions are 4 × 9 mm2. Reprinted with permission from [132] copyright (2014) OSA publishing. (b) The semi-integrated broad-band MZI configuration. (b1) Cross-view schematic of a single MZI sensor showing the position of the optical fiber that guides the transmitted light to the spectrometer. (b2) Image of the chip accommodating 10 integrated MZIs with the fluidic cover on top (upper part) and a top-view schematic of the chip (bottom part). The chip dimensions are 4 × 8.4 mm2. Reprinted with permission from [138] copyright (2014) Springer Nature Switzerland AG.
Chemosensors 06 00052 g016
Table 1. Comparison of label-free integrated optical biosensors.
Sensor TypeDetection Resolution
(RIU)
Multiplexing
Capability
PortabilityOverall Cost
SPR10−5 to 10−7+++++
LSPR10−4 to 10−6+++++++
Nanohole arrays10−4 to 10−6+++++++
Grating couplers10−6 to 10−7++++++
Microring resonators10−6 to 10−8+++++++
Photonic crystals10−5 to 10−7+++++++
MZIs10−5 to 10−7+++++++
YIs10−8 to 10−9+++++++
Bimodal Interferometers5 × 10−7+++++++
BB-MZIs (semi-integrated)5 × 10⁻⁶+++++++
+ low, ++ medium, +++ high.

