
Population Pharmacokinetic Model of Adalimumab Based on Prior Information Using Real World Data
 , and
, and
Abstract
:1. Introduction
2. Materials and Methods
2.1. Study Design
2.2. Patients and Data Collection
2.3. Model Development and Evaluation
2.4. Covariate Analysis
2.5. Model Selection
2.6. Model Validation
2.7. Clinical Impact
2.8. Software
3. Results
3.1. Patient Characteristics
3.2. Model Development, Covariate Analysis and Evaluation
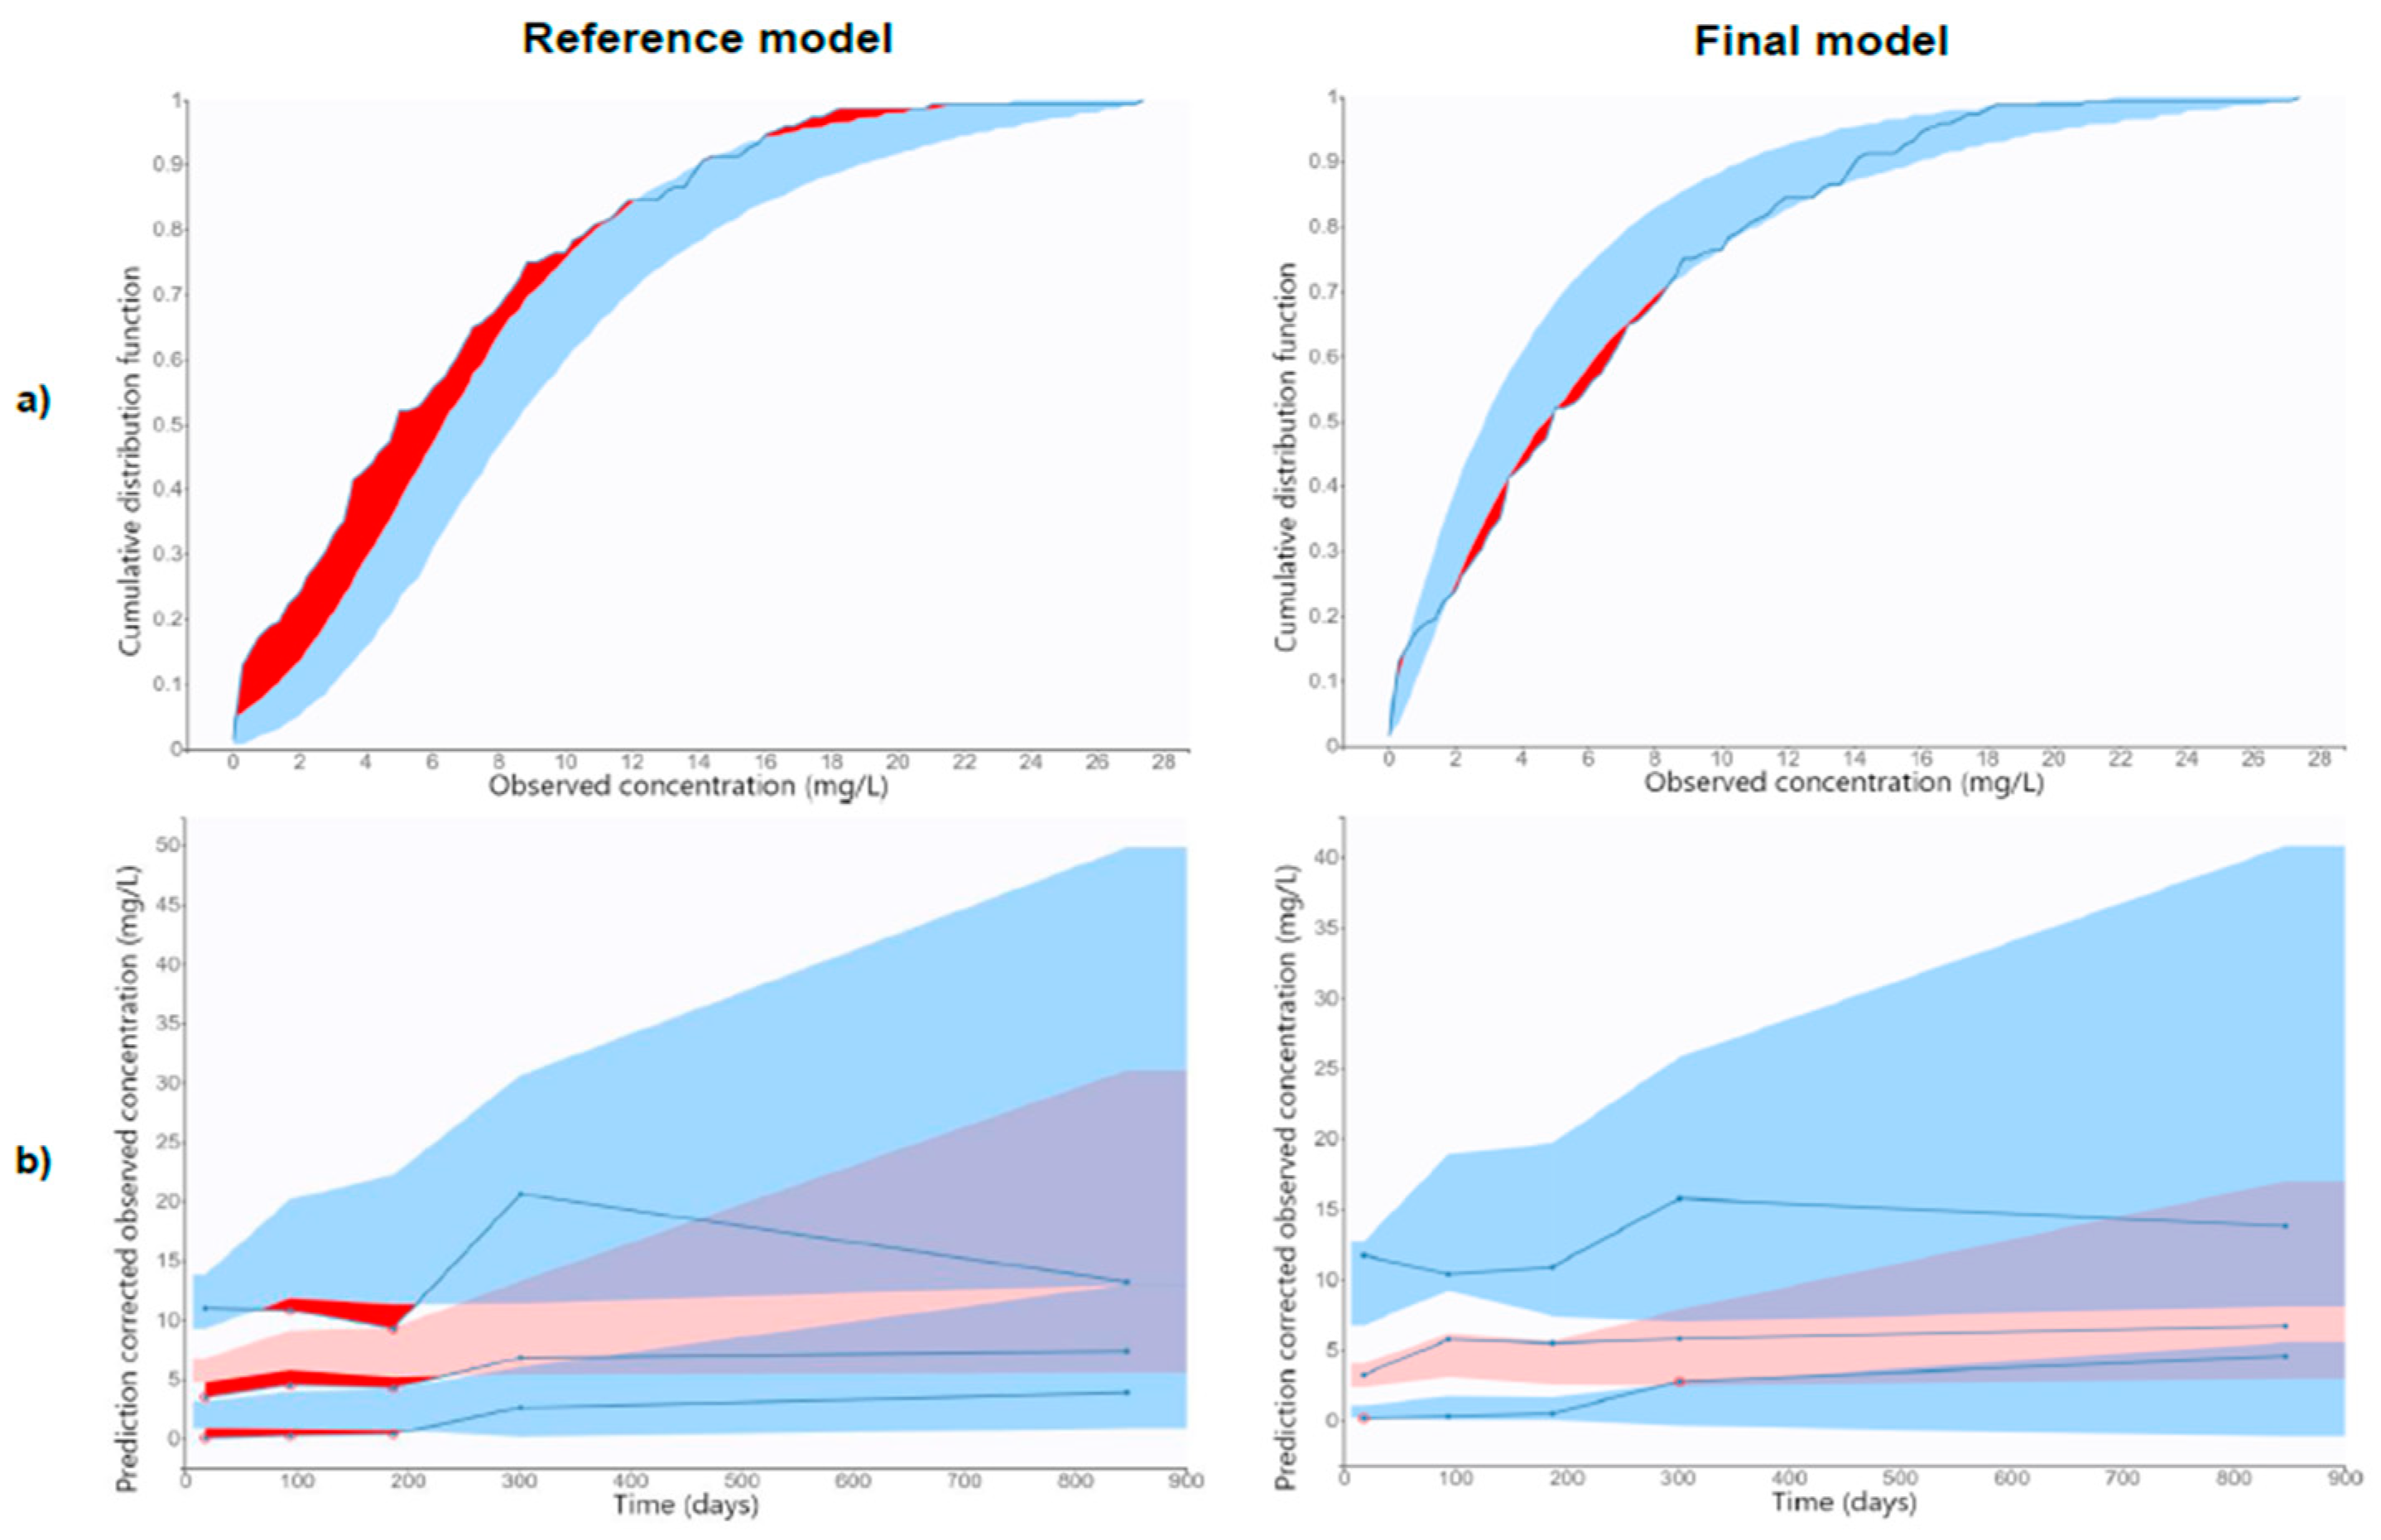
3.3. Model Validation
3.4. Clinical Impact
4. Discussion
Supplementary Materials
Author Contributions
Funding
Institutional Review Board Statement
Informed Consent Statement
Data Availability Statement
Conflicts of Interest
References
- European Medicines Agency (EMA). HUMIRA: Summary of Product Characteristics. EMA. 2023. Available online: https://www.ema.europa.eu/en/medicines/human/EPAR/humira (accessed on 10 February 2023).
- Food and Drug Administration (FDA). Adalimumab Product Approval Information. FDA. 2023. Available online: https://www.accessdata.fda.gov/drugsatfda_docs/label/2018/125057s410lbl.pdf (accessed on 10 February 2023).
- Aguas, M.; Bosó, V.; Navarro, B.; Marqués-Miñana, M.R.; Bastida, G.; Beltrán, B.; Iborra, M.; Sáez-González, E.; Monte-Boquet, E.; Poveda-Andrés, J.L.; et al. Serum Adalimumab Levels Predict Successful Remission and Safe Deintensification in Inflammatory Bowel Disease Patients in Clinical Practice. Inflamm. Bowel Dis. 2017, 23, 1454–1460. [Google Scholar] [CrossRef] [PubMed]
- Sanchez-Hernandez, J.G.; Rebollo, N.; Munoz, F.; Martin-Suarez, A.; Calvo, M.V. Therapeutic drug monitoring of tumour necrosis factor inhibitors in the management of chronic inflammatory diseases. Ann. Clin. Biochem. 2019, 56, 28–41. [Google Scholar] [CrossRef]
- Juncadella, A.; Papamichael, K.; Vaughn, B.P.; Cheifetz, A.S. Maintenance Adalimumab Concentrations Are Associated with Biochemical, Endoscopic, and Histologic Remission in Inflammatory Bowel Disease. Dig. Dis. Sci. 2018, 63, 3067–3073. [Google Scholar] [CrossRef]
- Ungar, B.; Levy, I.; Yavne, Y.; Yavzori, M.; Picard, O.; Fudim, E.; Loebstein, R.; Chowers, Y.; Eliakim, R.; Kopylov, U.; et al. Optimizing anti-TNF therapy: Serum levels of infliximab and adalimumab associate with mucosal healing in patients with inflammatory bowel diseases. Clin. Gastroenterol. Hepatol. 2016, 14, 550–557. [Google Scholar] [CrossRef] [PubMed]
- Ma, C.; Huang, V.; Fedorak, D.K.; Kroeker, K.I.; Dieleman, L.A.; Halloran, B.P.; Fedorak, R.N. Adalimumab dose escalation is effective for managing secondary loss of response in Crohn’s disease. Aliment. Pharmacol. Ther. 2014, 40, 1044–1055. [Google Scholar] [CrossRef]
- Yanai, H.; Lichtenstein, L.; Assa, A.; Mazor, Y.; Weiss, B.; Levine, A.; Ron, Y.; Kopylov, U.; Bujanover, Y.; Rosenbach, Y.; et al. Levels of drug and antidrug antibodies are associated with outcome of interventions after loss of response to infliximab or adalimumab. Clin. Gastroenterol. Hepatol. 2015, 13, 522–530. [Google Scholar] [CrossRef]
- Lopetuso, L.R.; Gerardi, V.; Papa, V.; Scaldaferri, F.; Rapaccini, G.L.; Gasbarrini, A.; Papa, A. Can we predict the efficacy of anti-TNF-α agents? Int. J. Mol. Sci. 2017, 18, 1973. [Google Scholar] [CrossRef]
- Papamichael, K.; Gils, A.; Rutgeerts, P.; Levesque, B.G.; Vermeire, S.; Sandborn, W.J.; Vande Casteele, N. Role for therapeutic drug monitoring during induction therapy with TNF antagonists in IBD: Evolution in the definition and management of primary nonresponse. Inflamm. Bowel Dis. 2015, 21, 182–197. [Google Scholar] [CrossRef] [PubMed]
- Roda, G.; Jharap, B.; Neeraj, N.; Colombel, J.F. Loss of response to anti-TNFs: Definition, epidemiology, and management. Clin. Transl. Gastroenterol. 2016, 7, e135. [Google Scholar] [CrossRef]
- Papamichael, K.; Vande Casteele, N.; Ferrante, M.; Gils, A.; Cheifetz, A.S. Therapeutic drug monitoring during induction of antitumor necrosis factor therapy in inflammatory bowel disease: Defining a therapeutic drug window. Inflamm. Bowel Dis. 2017, 23, 1510–1515. [Google Scholar] [CrossRef]
- Reinhold, I.; Blümel, S.; Schreiner, J.; Boyman, O.; Bögeholz, J.; Cheetham, M.; Rogler, G.; Biedermann, L.; Scharl, M. Clinical Relevance of Anti-TNF Antibody Trough Levels and Anti-Drug Antibodies in Treating Inflammatory Bowel Disease Patients. Inflamm. Intest. Dis. 2021, 6, 38–47. [Google Scholar] [CrossRef] [PubMed]
- Fine, S.; Papamichael, K.; Cheifetz, A.S. Etiology and management of lack or loss of response to anti-tumor necrosis factor therapy in patients with inflammatory bowel disease. Gastroenterol. Hepatol. 2019, 15, 656–665. [Google Scholar]
- Verstockt, B.; Moors, G.; Bian, S.; Van Stappen, T.; Van Assche, G.; Vermeire, S.; Gils, A.; Ferrante, M. Influence of early adalimumab serum levels on immunogenicity and long-term outcome of anti-TNF naive Crohn’s disease patients: The usefulness of rapid testing. Aliment. Pharmacol. Ther. 2018, 48, 731–739. [Google Scholar] [CrossRef] [PubMed]
- Darwich, A.S.; Ogungbenro, K.; Vinks, A.A.; Powell, J.R.; Reny, J.L.; Marsousi, N.; Daali, Y.; Fairman, D.; Cook, J.; Lesko, L.J.; et al. Why has model-informed precision dosing not yet become common clinical reality? Lessons from the past and a roadmap for the future. Clin. Pharmacol. Ther. 2017, 101, 646–656. [Google Scholar] [CrossRef]
- Papamichael, K.; Juncadella, A.; Wong, D.; Rakowsky, S.; Sattler, L.A.; Campbell, J.P.; Vaughn, B.P.; Cheifetz, A.S. Proactive therapeutic drug monitoring of adalimumab is associated with better long-term outcomes compared to standard of care in patients with inflammatory bowel disease. J. Crohn’s Colitis 2019, 13, 976–981. [Google Scholar] [CrossRef] [PubMed]
- Ternant, D.; Karmiris, K.; Vermeire, S.; Desvignes, C.; Azzopardi, N.; Bejan-Angoulvant, T.; van Assche, G.; Paintaud, G. Pharmacokinetics of adalimumab in Crohn’s disease. Eur. J. Clin. Pharmacol. 2015, 71, 1155–1157. [Google Scholar] [CrossRef]
- Sharma, S.; Eckert, D.; Hyams, J.S.; Mensing, S.; Thakkar, R.B.; Robinson, A.M.; Rosh, J.R.; Ruemmele, F.M.; Awni, W.M. Pharmacokinetics and exposure-efficacy relationship of adalimumab in pediatric patients with moderate to severe Crohn’s disease: Results from a randomized, multicenter, phase-3 study. Inflamm. Bowel Dis. 2015, 21, 783–792. [Google Scholar] [CrossRef]
- Berends, S.E.; Strik, A.S.; Van Selm, J.C.; Löwenberg, M.; Ponsioen, C.Y.; D’Haens, G.R.; Mathôt, R.A. Explaining interpatient variability in adalimumab pharmacokinetics in patients with Crohn’s disease. Ther. Drug Monit. 2018, 40, 202–211. [Google Scholar] [CrossRef]
- Vande Casteele, N.; Baert, F.; Bian, S.; Dreesen, E.; Compernolle, G.; Van Assche, G.; Ferrante, M.; Vermeire, S.; Gils, A. Subcutaneous absorption contributes to observed interindividual variability in adalimumab serum concentrations in Crohn’s disease: A prospective multicentre study. J. Crohn’s Colitis 2019, 27, 1248–1256. [Google Scholar] [CrossRef]
- Sánchez-Hernández, J.G.; Pérez-Blanco, J.S.; Rebollo, N.; Muñoz, F.; Prieto, V.; Calvo, M.V. Biomarkers of disease activity and other factors as predictors of adalimumab pharmacokinetics in inflammatory bowel disease. Eur. J. Pharm. Sci. 2020, 150, 105369. [Google Scholar] [CrossRef]
- Marquez-Megias, S.; Ramon-Lopez, A.; Más-Serrano, P.; Diaz-Gonzalez, M.; Candela-Boix, M.R.; Nalda-Molina, R. Evaluation of the Predictive Performance of Population Pharmacokinetic Models of Adalimumab in Patients with Inflammatory Bowel Disease. Pharmaceutics 2021, 13, 1244. [Google Scholar] [CrossRef] [PubMed]
- Monolix 2023R1. Lixoft. Antony, France. Available online: http://lixoft.com (accessed on 15 February 2023).
- R Core Team. R: A Language and Environment for Statistical Computing; R Foundation for Statistical Computing. 2023. Available online: http://www.R-project.org/ (accessed on 15 February 2023).
- RStudio. Integrated Development Environment for R. 2023. Available online: http://www.rstudio.org/ (accessed on 15 February 2023).
- Arias, M.T.; Vande Casteele, N.; Vermeire, S.; de Buck van Overstraeten, A.; Billiet, T.; Baert, F.; Wolthuis, A.; Van Assche, G.; Noman, M.; Hoffman, I.; et al. A panel to predict long-term outcome of infliximab therapy for patients with ulcerative colitis. Clin. Gastroenterol. Hepatol. 2015, 13, 531–538. [Google Scholar] [CrossRef] [PubMed]
- Angelison, L.; Almer, S.; Eriksson, A.; Karling, P.; Fagerberg, U.; Halfvarson, J.; Thörn, M.; Björk, J.; Hindorf, U.; Löfberg, R.; et al. Long-term outcome of infliximab treatment in chronic active ulcerative colitis: A Swedish multicentre study of 250 patients. Aliment. Pharmacol. Ther. 2017, 45, 519–532. [Google Scholar] [CrossRef] [PubMed]
- Ribaldone, D.G.; Dileo, I.; Pellicano, R.; Resegotti, A.; Fagoonee, S.; Vernero, M.; Saracco, G.; Astegiano, M. Severe ulcerative colitis: Predictors of response and algorithm proposal for rescue therapy. Ir. J. Med. Sci. 2018, 187, 385–392. [Google Scholar] [CrossRef] [PubMed]
- Morita, Y.; Bamba, S.; Takahashi, K.; Imaeda, H.; Nishida, A.; Inatomi, O.; Sasaki, M.; Tsujikawa, T.; Sugimoto, M.; Andoh, A. Prediction of clinical and endoscopic responses to anti-tumor necrosis factor-α antibodies in ulcerative colitis. Scand. J. Gastroenterol. 2016, 51, 934–941. [Google Scholar] [CrossRef]
- Fasanmade, A.A.; Adedokun, O.J.; Ford, J.; Hernandez, D.; Johanns, J.; Hu, C.; Davis, H.M.; Zhou, H. Population pharmacokinetic analysis of infliximab in patients with ulcerative colitis. Eur. J. Clin. Pharmacol. 2009, 65, 1211–1228. [Google Scholar] [CrossRef]
- Fasanmade, A.A.; Adedokun, O.J.; Olson, A.; Strauss, R.; Davis, H.M. Serum albumin concentration: A predictive factor of infliximab pharmacokinetics and clinical response in patients with ulcerative colitis. Int. J. Clin. Pharmacol. Ther. 2010, 48, 297–308. [Google Scholar] [CrossRef]
- Brandse, J.F.; Mould, D.; Smeekes, O.; Ashruf, Y.; Kuin, S.; Strik, A.; van den Brink, G.R.; DʼHaens, G.R. A real-life population pharmacokinetic study reveals factors associated with clearance and immunogenicity of infliximab in inflammatory bowel disease. Inflamm. Bowel Dis. 2017, 23, 650–660. [Google Scholar] [CrossRef]
- Hemperly, A.; Vande Casteele, N. Clinical Pharmacokinetics and Pharmacodynamics of Infliximab in the Treatment of Inflammatory Bowel Disease. Clin. Pharmacokinet. 2018, 57, 929–942. [Google Scholar] [CrossRef]
- Schräpel, C.; Kovar, L.; Selzer, D.; Hofmann, U.; Tran, F.; Reinisch, W.; Schwab, M.; Lehr, T. External model performance evaluation of twelve infliximab population pharmacokinetic models in patients with inflammatory bowel disease. Pharmaceutics 2021, 13, 1368. [Google Scholar] [CrossRef]
- Lin, J.F.; Chen, J.M.; Zuo, J.H.; Yu, A.; Xiao, Z.J.; Deng, F.H.; Nie, B.; Jiang, B. Meta-analysis: Fecal calprotectin for assessment of inflammatory bowel disease activity. Inflamm. Bowel Dis. 2014, 20, 1407–1415. [Google Scholar] [CrossRef] [PubMed]
- Mumolo, M.G.; Bertani, L.; Ceccarelli, L.; Laino, G.; Di Fluri, G.; Albano, E.; Tapete, G.; Costa, F. From bench to bedside: Fecal calprotectin in inflammatory bowel diseases clinical setting. World J. Gastroenterol. 2018, 24, 3681–3694. [Google Scholar] [CrossRef] [PubMed]
- Mosli, M.H.; Zou, G.; Garg, S.K.; Feagan, S.G.; MacDonald, J.K.; Chande, N.; Sandborn, W.J.; Feagan, B.G. C-reactive protein, fecal calprotectin, and stool lactoferrin for detection of endoscopic activity in symptomatic inflammatory bowel disease patients: A systematic review and meta-analysis. Am. J. Gastroenterol. 2015, 110, 802–819. [Google Scholar] [CrossRef] [PubMed]
- Brill, M.J.E.; Svensson, E.M.; Pandie, M.; Maartens, G.; Karlsson, M.O. Confirming model-predicted pharmacokinetic interactions between bedaquiline and lopinavir/ritonavir or nevirapine in patients with HIV and drug-resistant tuberculosis. Int. J. Antimicrob. Agents 2017, 49, 212–217. [Google Scholar] [CrossRef] [PubMed]
- Knøsgaard, K.R.; Foster, D.J.R.; Kreilgaard, M.; Sverrisdóttir, E.; Upton, R.N.; van den Anker, J.N. Pharmacokinetic models of morphine and its metabolites in neonates: Systematic comparisons of models from the literature, and development of a new metamodel. Eur. J. Pharm. Sci. 2016, 92, 117–130. [Google Scholar] [CrossRef]
- Magnusson, M.O.; Samtani, M.N.; Plan, E.L.; Jonsson, E.N.; Rossenu, S.; Vermeulen, A.; Russu, A. Population pharmacokinetics of a novel once-every 3 months intramuscular formulation of paliperidone palmitate in patients with schizophrenia. Clin. Pharmacokinet. 2017, 56, 421–433. [Google Scholar] [CrossRef]
- Edlund, H.; Steenholdt, C.; Ainsworth, M.A.; Goebgen, E.; Brynskov, J.; Thomsen, O.Ø.; Huisinga, W.; Kloft, C. Magnitude of increased infliximab clearance imposed by anti-infliximab antibodies in Crohn’s disease is determined by their concentration. AAPS J. 2017, 19, 223–233. [Google Scholar] [CrossRef]
- Cella, M.; de Vries, F.G.; Burger, D.; Danhof, M.; Pasqua, O.D. A Model-Based Approach to Dose Selection in Early Pediatric Development. Clin. Pharmacol. Ther. 2010, 87, 294–302. [Google Scholar] [CrossRef]

| Characteristics | Population of the Reference Model | Population of the Final Model |
|---|---|---|
| Patients | 65 | 54 |
| Age (yr) † | 37 (17–61) | 43.5 (11–89) |
| Sex, male, n (%) | 16 (25%) | 30 (55.6%) |
| Weight (kg) † | 68 (43–109) | 66.5 (34.8–94.0) |
| Body mass index (kg/m2) † | NA | 22.84 (14.1–32.03) |
| Albumin (g/dL) † | NA | 3.86 (1.97–4.96) |
| Prealbumin (mg/dL) † | NA | 24.2 (9.0–37.0) |
| CRP (mg/L) † | NA | 0.770 (0.0575–6.680) |
| FCP (mg/kg) † | NA | 513 (25–3600) |
| IBD type, CD, n (%) | 65 (100%) | 46 (85.2%) |
| Adalimumab originator (Humira®), n (%) | NA | 38 (70.4%) |
| Prior treatment with infliximab | NA | 35 (64.8%) |
| Concomitant immunomodulator, n (%) | NA | 22 (40.7%) |
| 6-Mercaptopurine | NA | 1 (4.6%) |
| Aminosalicylate | NA | 3 (13.6%) |
| Azathioprine | NA | 6 (27.3%) |
| Corticosteroids | NA | 5 (22.7%) |
| Methotrexate | NA | 2 (9.1%) |
| Combined | NA | 5 (22.7%) |
| Adalimumab serum samples | 341 | 148 |
| Adalimumab serum concentrations (mg/L) † | NA | 4.90 (0.10–27.4) |
| AAA positive, n (%) | 9 (13.8%) | 9 (16.7%) |
| AAA serum concentrations (mg/L) †,‡ | NA | 115 (15–459) |
| Models | Bootstrap Results (n = 500) | |||
|---|---|---|---|---|
| Model | Bias (95% CI) | Imprecision (95% CI) | Bias (95% CI) | Imprecision (95% CI) |
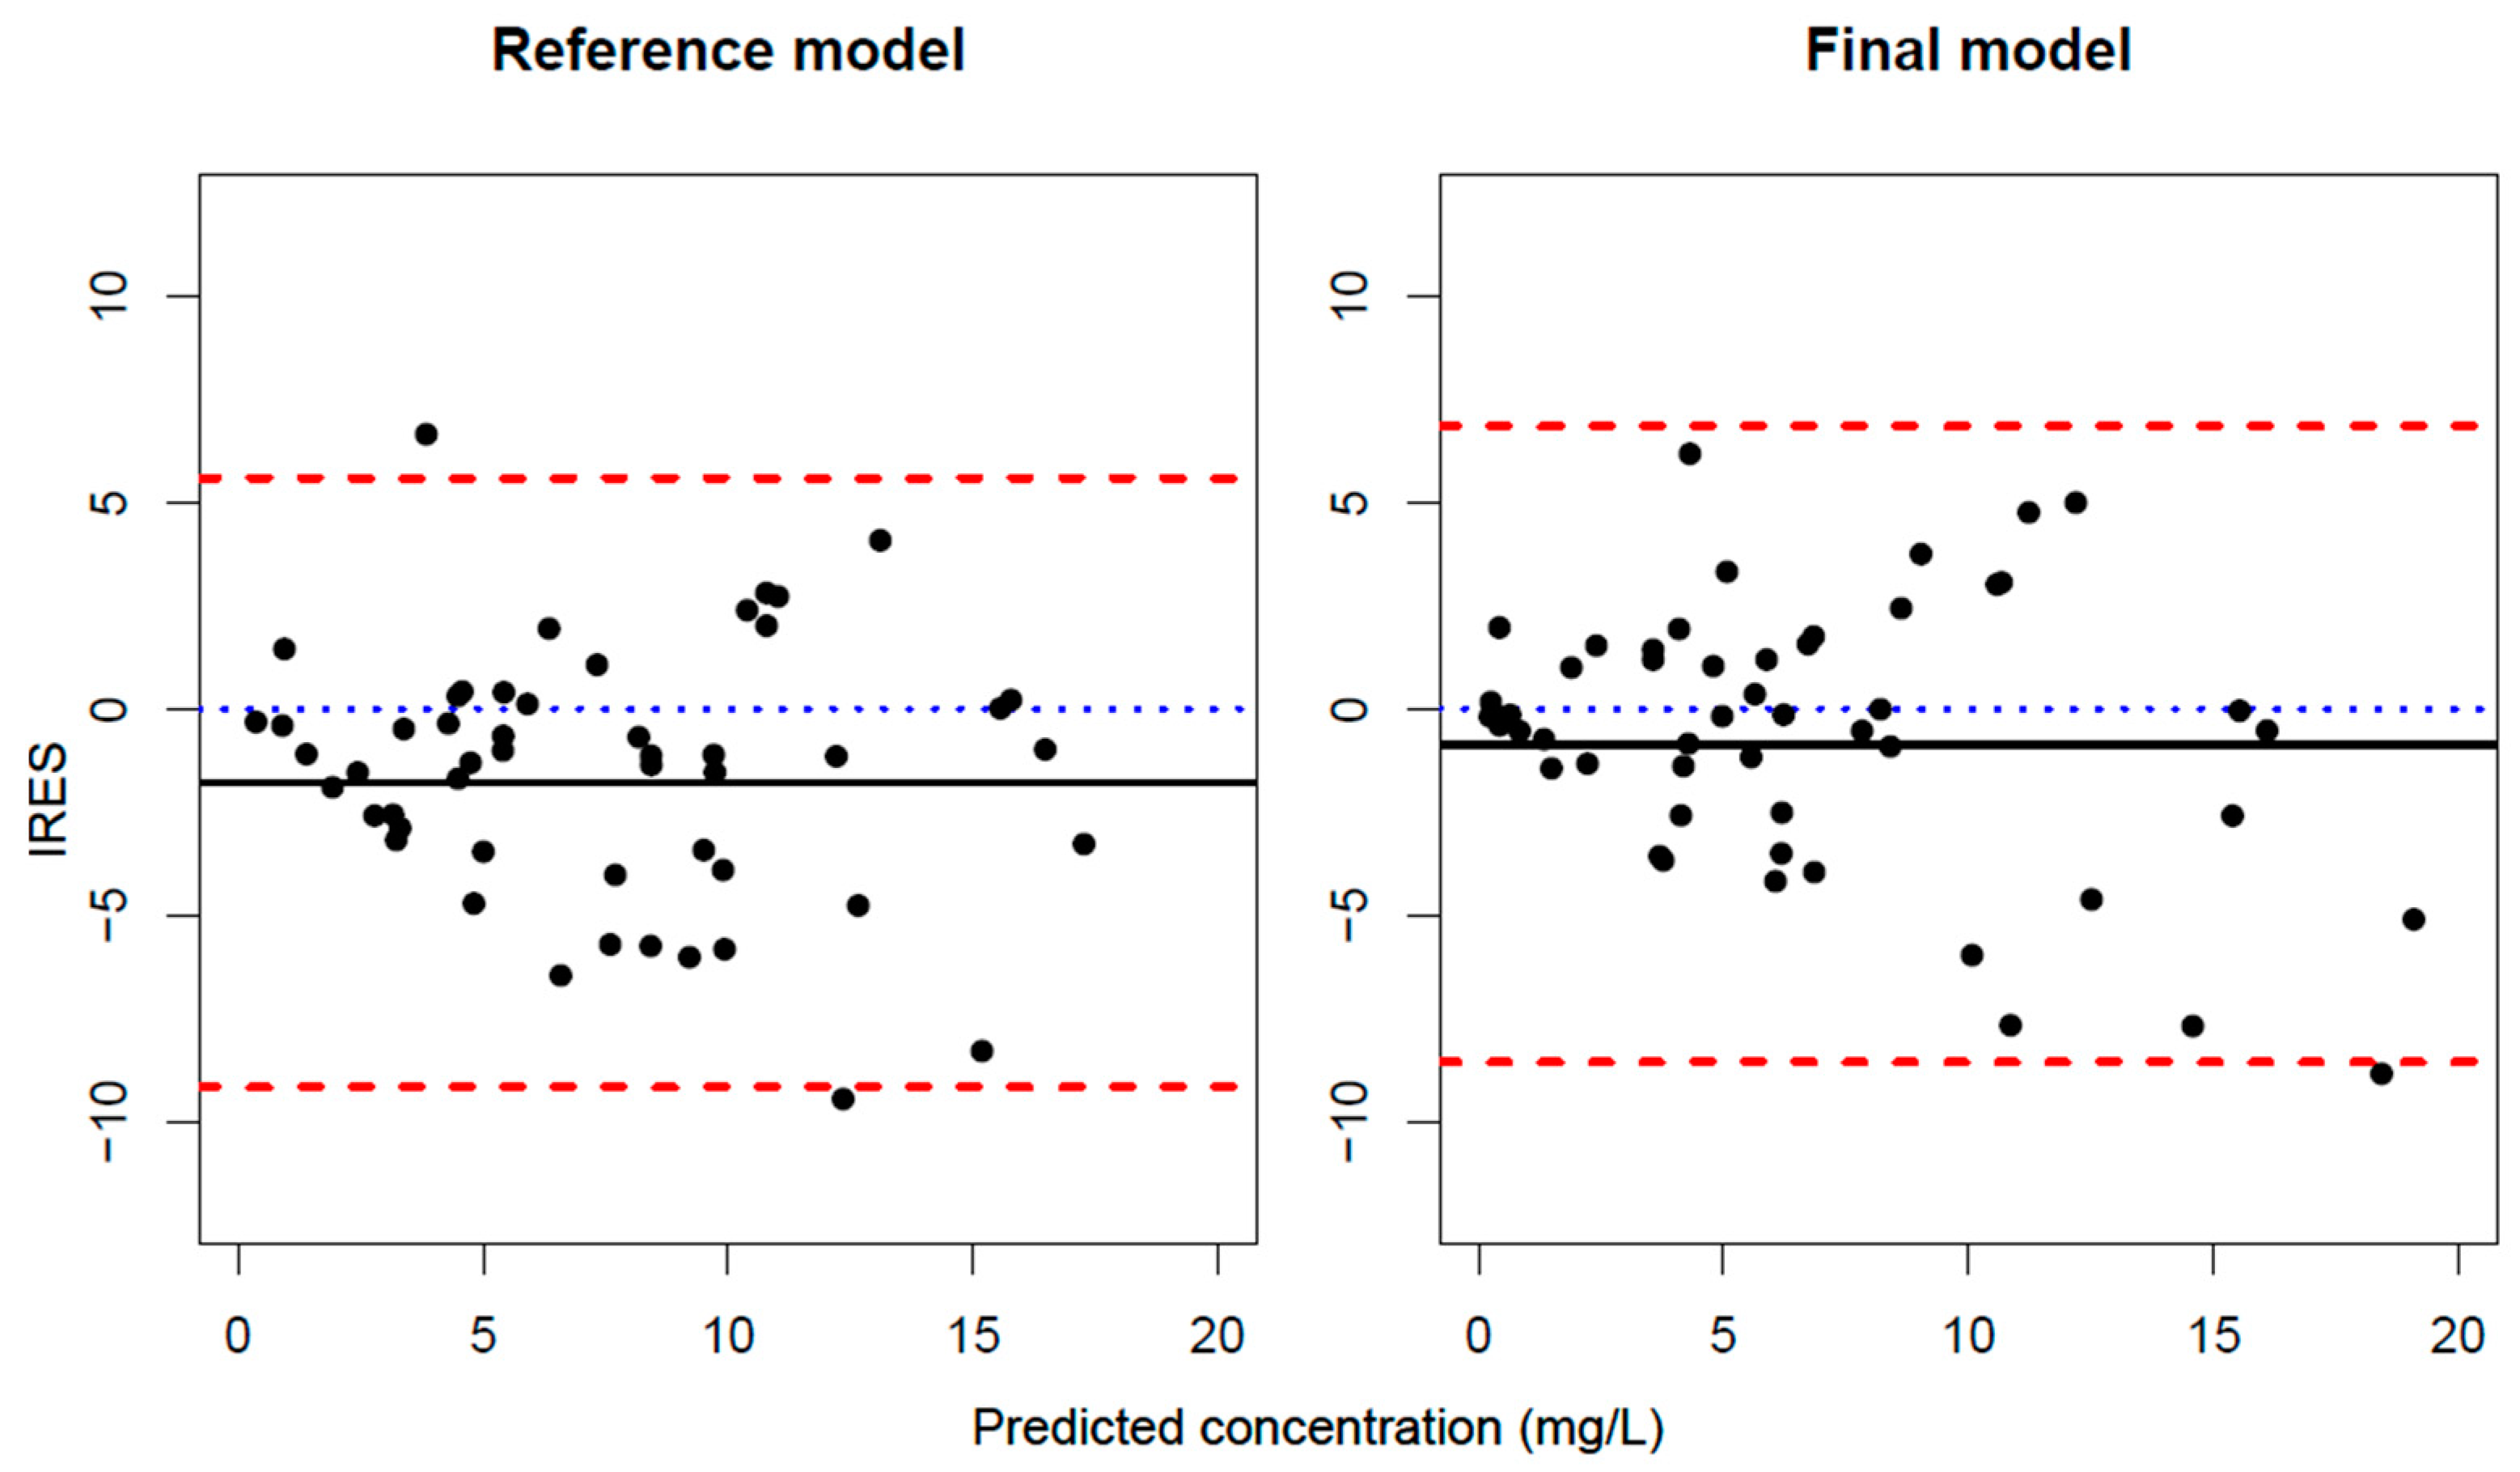
| Reference Model | −1.79 (−2.82 : −0.793) | 4.14 (3.11 : 5.09) | −1.78 (−2.76 : −0.804) | 4.10 (3.12 : 5.09) |
| Final Model | −0.849 (−1.86 : 0.160) | 3.99 (2.43 : 5.33) | −0.854 (−1.87 : 0.160) | 3.90 (2.52 : 5.28) |
| Difference | −0.939 | 0.150 | 0.927 (0.353 : 1.46) | 0.200 (−0.670 : 1.08) |
| Reference Model | Final Model | Bootstrap Results (n = 500) | |||
|---|---|---|---|---|---|
| Estimate (%RSE) | Estimate (%RSE) | 95% CI | Mean Value (%RSE) | 95% CI | |
| CL/F (L/h) | 0.0175 (9%) | 0.0312 (10.9%) | 0.0246 : 0.0378 | 0.0314 (12.4%) | 0.0234 : 0.0391 |
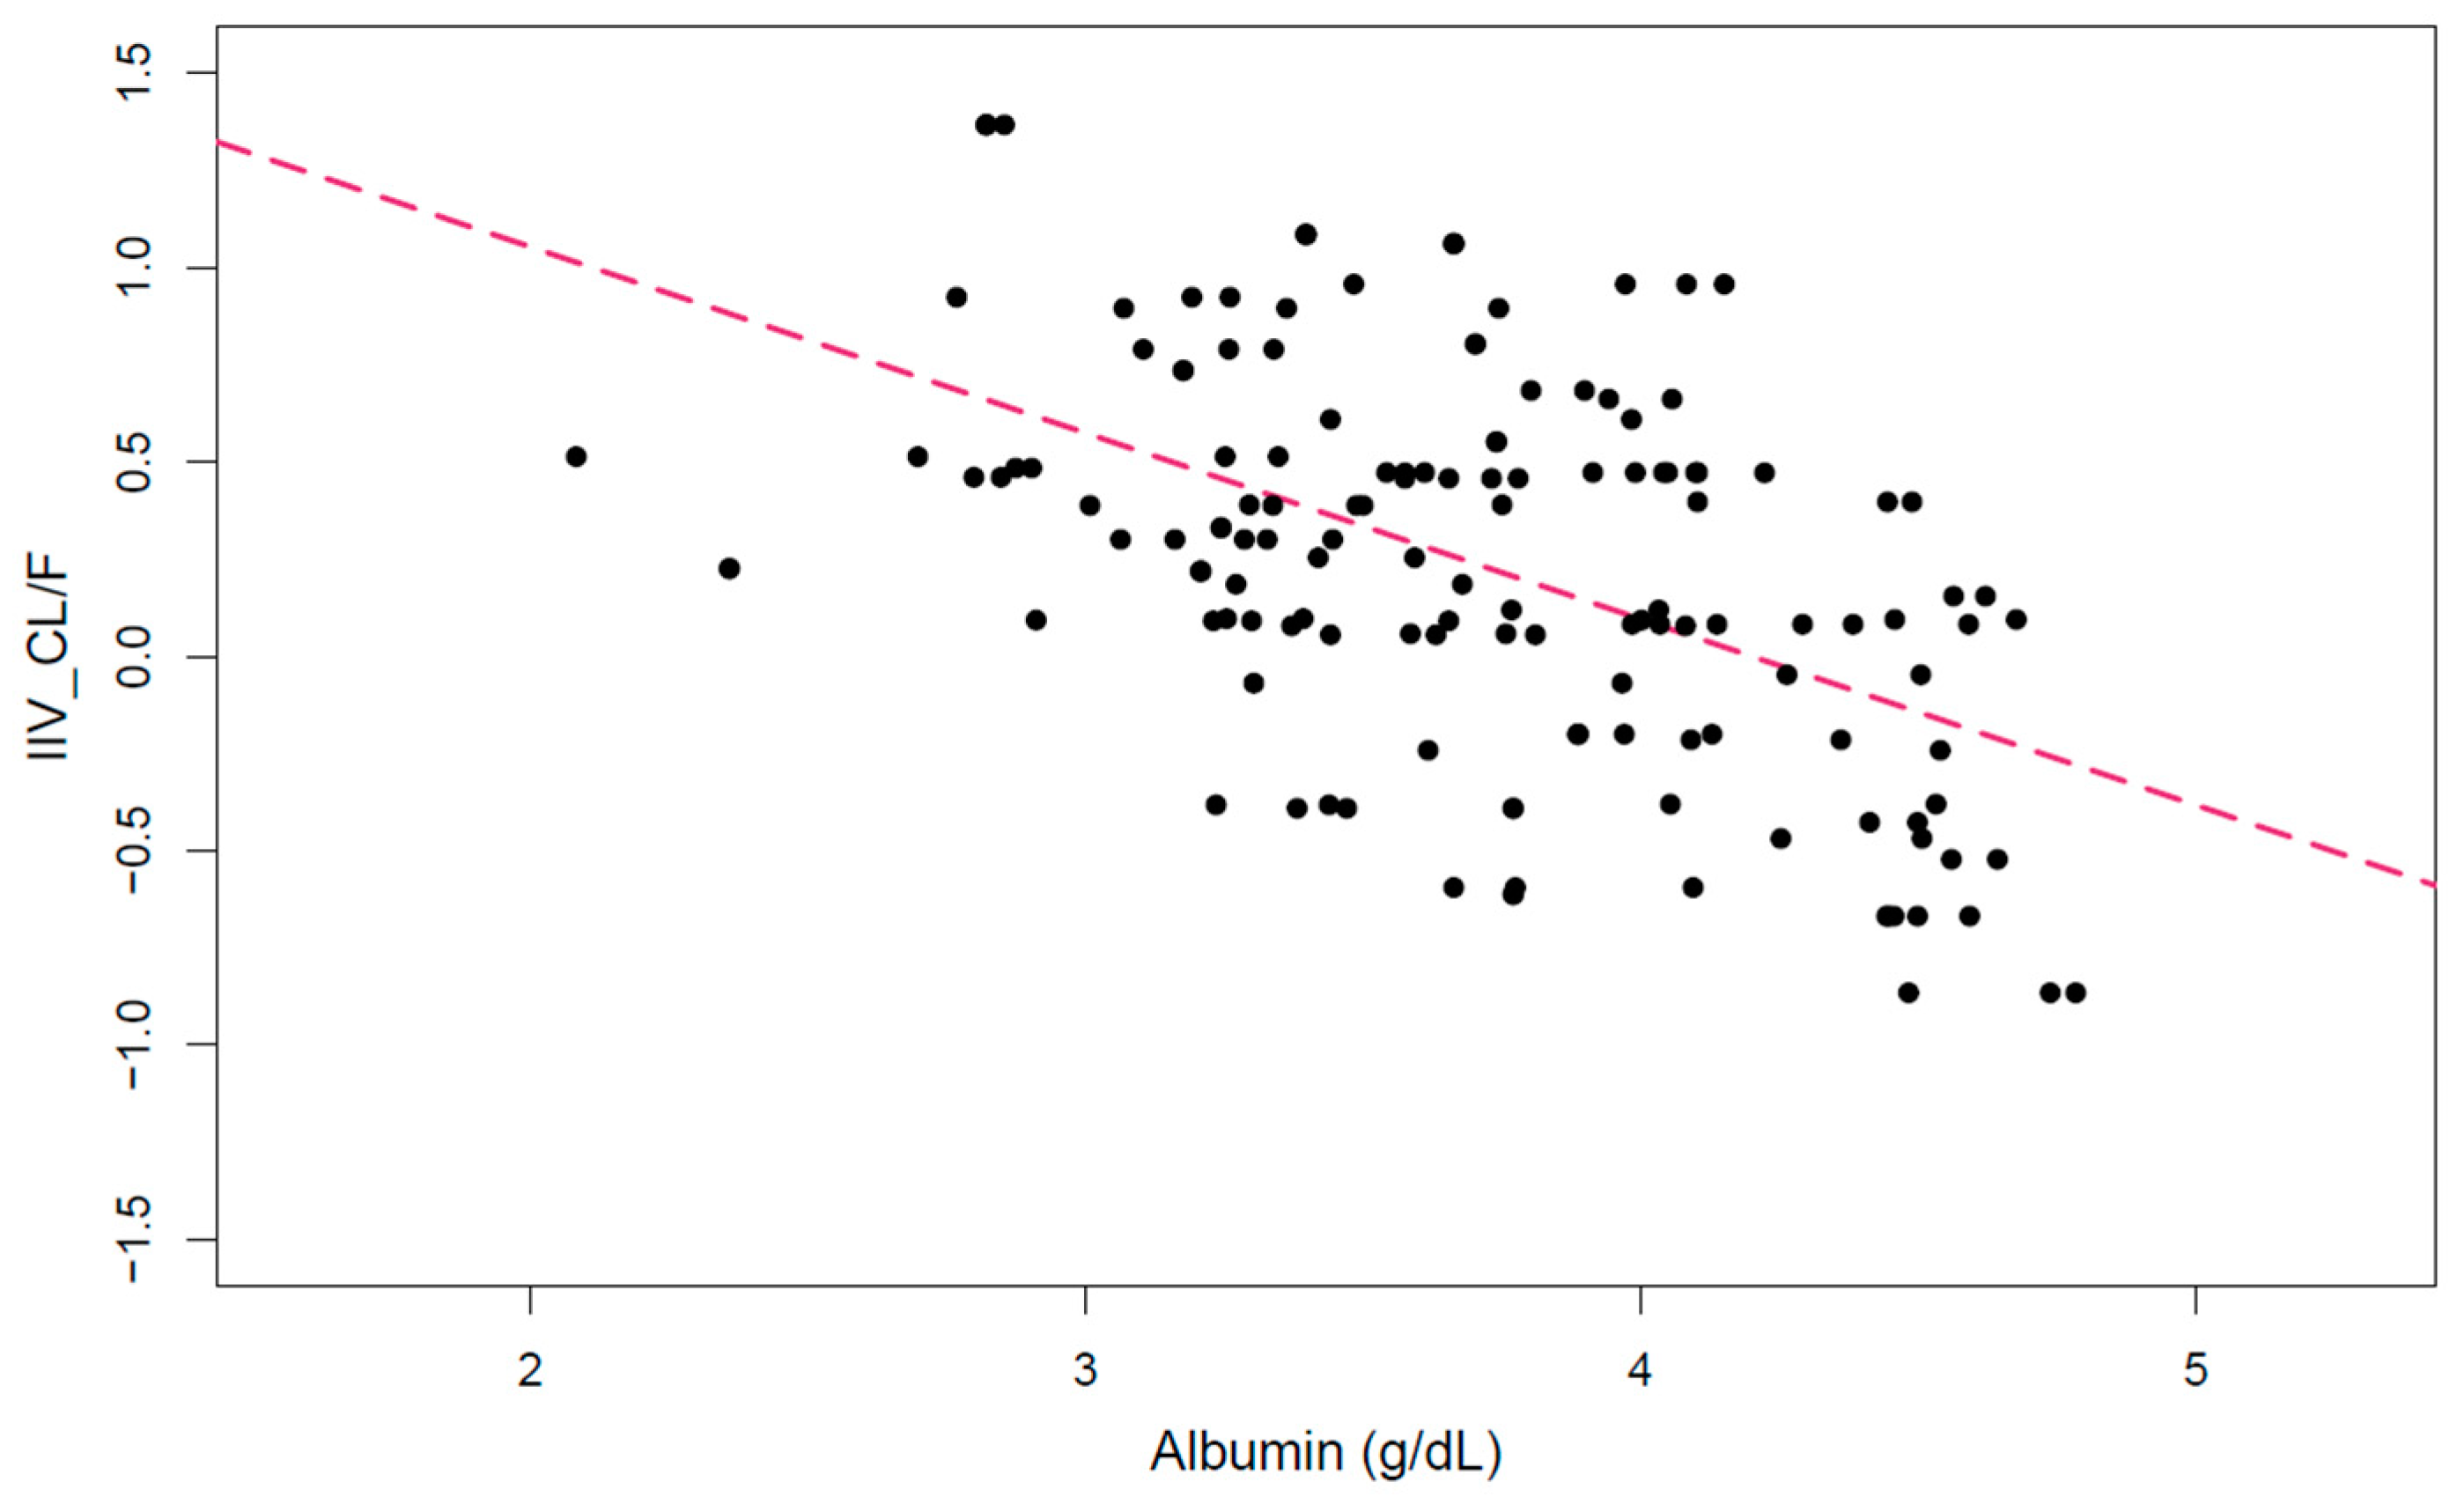
| ALB_CL/F | - | −2.33 (2.8%) | −2.46 : −2.21 | −2.36 (43.8%) | −4.39 : −0.335 |
| V/F (L) | 13.5 (10%) | 7.76 (24.1%) | 4.09 : 11.42 | 7.70 (19.9%) | 4.69 : 10.7 |
| IIV_CL/F | 0.65 (10%) | 0.667 (15.5%) | 0.464 : 0.869 | 0.666 (3.4%) | 0.623 : 0.710 |
| IIV_V/F | 0.48 (19%) | 0.477 (33.9%) | 0.160 : 0.794 | 0.474 (1.4%) | 0.460 : 0.487 |
| Proportional error | 0.15 (16%) | 0.547 (8.4%) | 0.458 : 0.637 | 0.543 (8.7%) | 0.451 : 0.636 |
| Additive error (mg/L) | 1.8 (8%) | - | - | - | - |
| TSC < 8 mg/L | TSC = 8–12 mg/L | TSC > 12 mg/L | ||||
|---|---|---|---|---|---|---|
| True Positives | False Positives | True Positives | False Positives | True Positives | False Positives | |
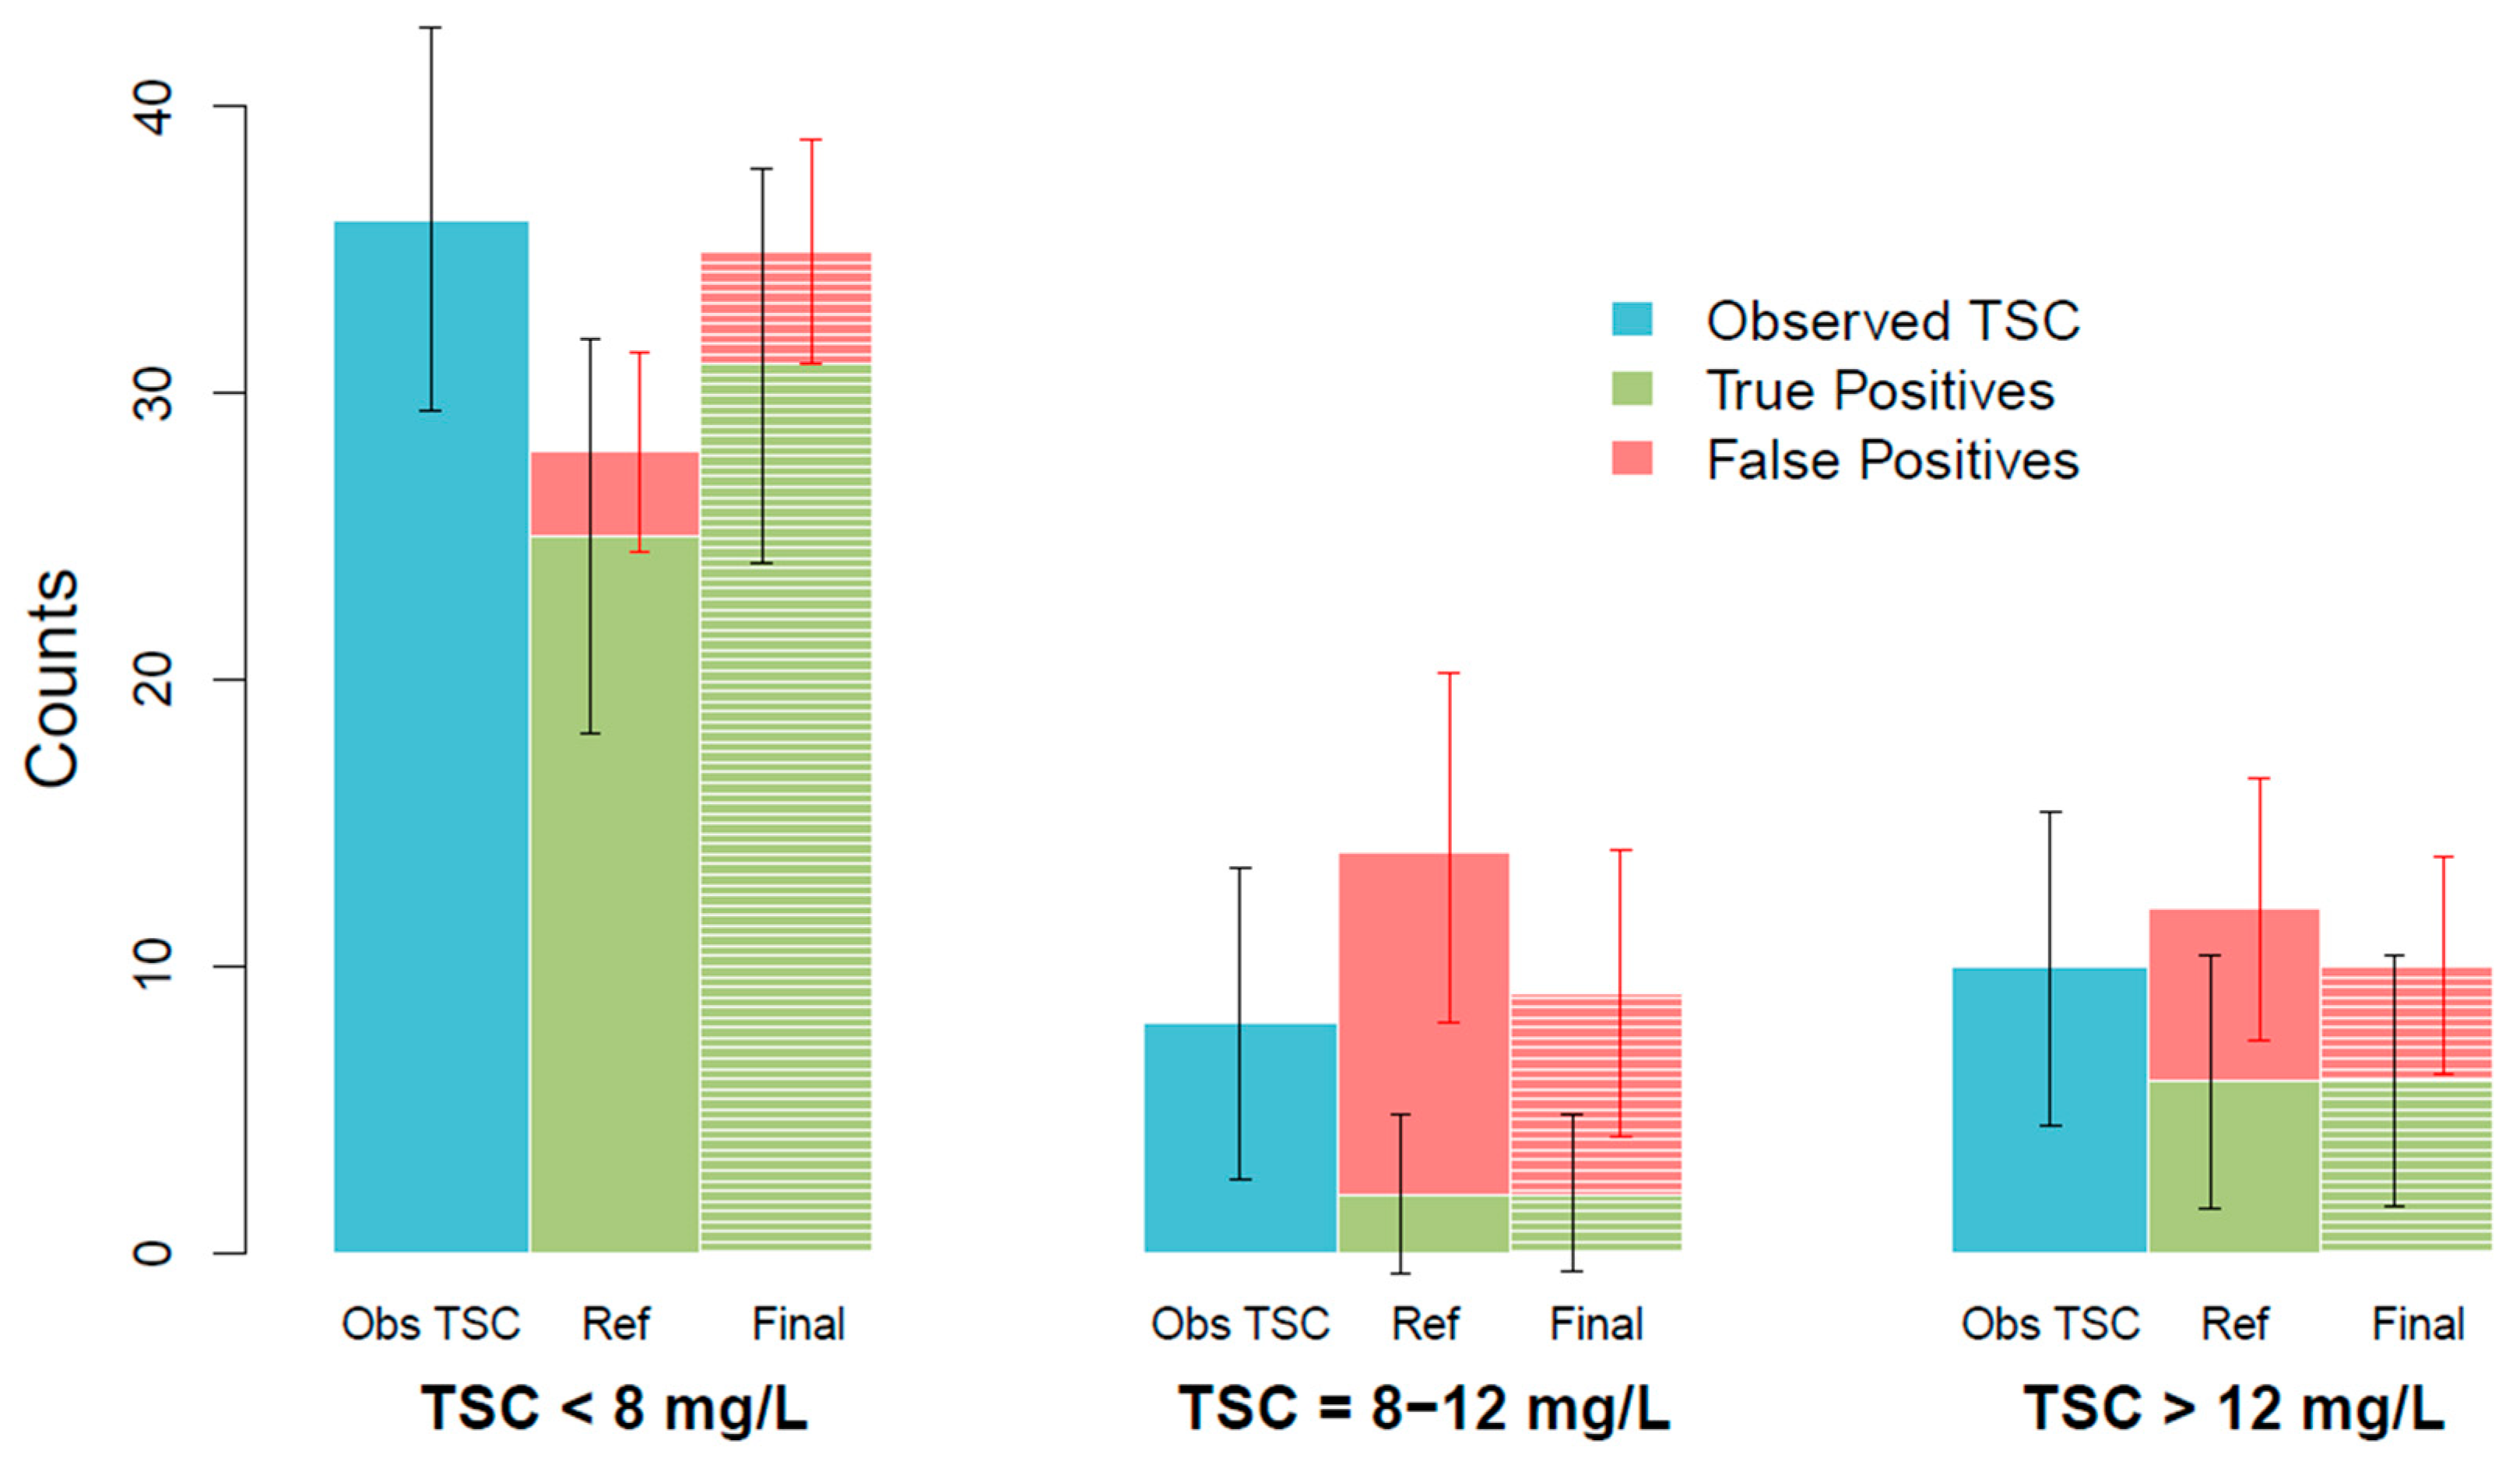
| Reference model | 25.0 (18.1 : 31.9) | 2.95 (−0.50 : 6.41) | 2.04 (−0.71 : 4.80) | 12.1 (5.95 : 18.1) | 5.93 (1.53 : 10.3) | 6.04 (1.47 : 10.6) |
| Final model | 30.9 (24.0 : 37.8) | 3.99 (0.0720 : 7.90) | 2.07 (−0.676 : 4.81) | 7.00 (1.99 : 12.0) | 6.01 (1.62 : 10.4) | 3.99 (0.189 : 7.80) |
| Difference | 5.90 (1.50 : 10.4) | 1.04 (−0.836 : 2.90) | 0.0300 (−2.80 : 2.85) | −5.05 (−10.0 : −0.102) | −0.0800 (−2.71 : 2.87) | −2.04 (−4.74 : 0.660) |
Disclaimer/Publisher’s Note: The statements, opinions and data contained in all publications are solely those of the individual author(s) and contributor(s) and not of MDPI and/or the editor(s). MDPI and/or the editor(s) disclaim responsibility for any injury to people or property resulting from any ideas, methods, instructions or products referred to in the content. |
© 2023 by the authors. Licensee MDPI, Basel, Switzerland. This article is an open access article distributed under the terms and conditions of the Creative Commons Attribution (CC BY) license (https://creativecommons.org/licenses/by/4.0/).
Share and Cite
Marquez-Megias, S.; Nalda-Molina, R.; Más-Serrano, P.; Ramon-Lopez, A. Population Pharmacokinetic Model of Adalimumab Based on Prior Information Using Real World Data. Biomedicines 2023, 11, 2822. https://doi.org/10.3390/biomedicines11102822
Marquez-Megias S, Nalda-Molina R, Más-Serrano P, Ramon-Lopez A. Population Pharmacokinetic Model of Adalimumab Based on Prior Information Using Real World Data. Biomedicines. 2023; 11(10):2822. https://doi.org/10.3390/biomedicines11102822
Chicago/Turabian StyleMarquez-Megias, Silvia, Ricardo Nalda-Molina, Patricio Más-Serrano, and Amelia Ramon-Lopez. 2023. "Population Pharmacokinetic Model of Adalimumab Based on Prior Information Using Real World Data" Biomedicines 11, no. 10: 2822. https://doi.org/10.3390/biomedicines11102822