
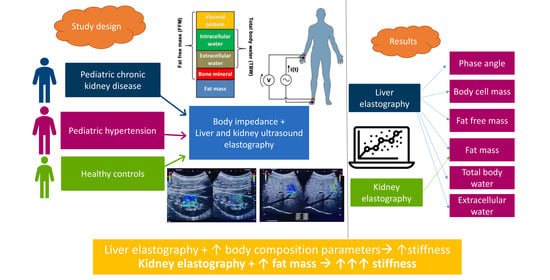
Obesity and Body Composition in Relation to Liver and Kidney Ultrasound Elastography in Paediatric Patients with Either Hypertension or Chronic Kidney Disease

Abstract
:
1. Introduction
2. Materials and Methods
2.1. Subjects
2.2. Investigations
2.3. Statistical Analysis
3. Results
4. Discussion
5. Conclusions
Author Contributions
Funding
Institutional Review Board Statement
Informed Consent Statement
Data Availability Statement
Conflicts of Interest
References
- Sigrist, R.M.S.; Liau, J.; Kaffas, A.E.; Chammas, M.C.; Willmann, J.K. Ultrasound elastography: Review of techniques and cinical applications. Theranostics 2017, 7, 1303–1329. [Google Scholar] [CrossRef] [PubMed]
- Thumar, V.; Squires, J.H.; Spicer, P.J.; Robinson, A.L.; Chan, S.S. Ultrasound elastography applications in pediatrics. Ultrasound Q. 2018, 34, 199–205. [Google Scholar] [CrossRef] [PubMed]
- Ozturk, A.; Grajo, J.R.; Dhyani, M.; Anthony, B.W.; Samir, A.E. Principles of ultrasound elastography. Abdom. Radiol. 2018, 43, 773–785. [Google Scholar] [CrossRef] [PubMed]
- Brunnert, L.; Puasa, I.D.; Garten, A.; Penke, M.; Gaul, S.; Grafe, N.; Karlas, T.; Kiess, W.; Flemming, G.; Vogel, M. Pediatric percentiles for transient elastography measurements—Effects of age, sex, weight status and pubertal stage. Front. Endocrinol. 2022, 13, 1030809. [Google Scholar] [CrossRef] [PubMed]
- Bailey, S.S.; Youssfi, M.; Patel, M.; Hu, H.H.; Shaibi, G.Q.; Towbin, R.B. Shear-wave ultrasound elastography of the liver in normal-weight and obese children. Acta Radiol. 2017, 58, 1511–1518. [Google Scholar] [CrossRef]
- Song, S.H.; Wong, Y.C.; Wu, T.C.; Huang, C.F. Pediatric non-alcoholic fatty liver disease predicted by anthropometric values through transient elastography. Pediatr. Int. 2021, 63, 183–188. [Google Scholar] [CrossRef]
- D’Hondt, A.; Rubesova, E.; Xie, H.; Shamdasani, V.; Barth, R.A. Liver fat quantification by ultrasound in children: A prospective study. AJR Am. J. Roentgenol. 2021, 217, 996–1006. [Google Scholar] [CrossRef]
- Karaman, Z.F.; Hatipoğlu, N.; Kardaş, F.; Saraçoğlu, S.; Direk, G.; Kendirci, M.; Coşkun, A. Identifying the effects of excess weight, metabolic syndrome and insulin resistance on liver stiffness using ultrasound elastography in children. Turk. J. Pediatr. 2022, 64, 671–682. [Google Scholar] [CrossRef]
- Isoura, Y.; Cho, Y.; Fujimoto, H.; Hamazaki, T.; Tokuhara, D. Effects of obesity reduction on transient elastography-based parameters in pediatric non-alcoholic fatty liver disease. Obes. Res. Clin. Pract. 2020, 14, 473–478. [Google Scholar] [CrossRef]
- Alves, V.P.V.; Trout, A.T.; Dewit, M.; Mouzaki, M.; Arce-Clachar, A.C.; Bramlage, K.S.; Dillman, J.R.; Xanthakos, S.A. Clinical performance of transient elastography with comparison to quantitative magnetic resonance imaging, ultrasound, and biopsy in children and adolescents with known or suspected fatty liver disease. Child. Obes. 2023, 19, 461–469. [Google Scholar] [CrossRef]
- Desvignes, C.; Dabadie, A.; Aschero, A.; Ruocco, A.; Garaix, F.; Daniel, L.; Ferlicot, S.; Villes, V.; Loundou, A.D.; Gorincour, G.; et al. Technical feasibility and correlations between shear-wave elastography and histology in kidney fibrosis in children. Pediatr. Radiol. 2021, 51, 1879–1888. [Google Scholar] [CrossRef] [PubMed]
- Karaman, Z.F.; Kardas, F. Determining the effects of excess weight on renal cortical stiffness in children and adolescents with point shear wave elastography. Med. Ultrason. 2021, 23, 271–276. [Google Scholar] [CrossRef] [PubMed]
- Khan, S.; Xanthakos, S.A.; Hornung, L.; Arce-Clachar, C.; Siegel, R.; Kalkwarf, H.J. Relative Accuracy of Bioelectrical Impedance Analysis for Assessing Body Composition in Children with Severe Obesity. J. Pediatr. Gastroenterol. Nutr. 2020, 70, e129–e135. [Google Scholar] [CrossRef] [PubMed]
- Chula de Castro, J.A.; Lima, T.R.; Silva, D.A.S. Body composition estimation in children and adolescents by bioelectrical impedance analysis: A systematic review. J. Bodyw. Mov. Ther. 2018, 22, 134–146. [Google Scholar] [CrossRef] [PubMed]
- Močnik, M.; Golob Jančič, S.; Marčun Varda, N. Liver and kidney ultrasound elastography in children and young adults with hypertension or chronic kidney disease. Pediatr. Nephrol. 2023, 38, 3379–3387. [Google Scholar] [CrossRef] [PubMed]
- Lurbe, E.; Agabiti-Rosei, E.; Cruickshank, J.K.; Dominiczak, A.; Erdine, S.; Hirth, A.; Invitti, C.; Litwin, M.; Mancia, G.; Pall, D.; et al. 2016 European Society of Hypertension guidelines for the management of high blood pressure in children and adolescents. J. Hypertens. 2016, 34, 1887–1920. [Google Scholar] [CrossRef] [PubMed]
- Cole, T.J.; Bellizzi, M.C.; Flegal, K.M.; Dietz, W.H. Establishing a standard definition for child overweight and obesity worldwide: International survey. BMJ 2000, 320, 1240–1243. [Google Scholar] [CrossRef]
- Brady, T.M. Obesity-related hypertension in children. Front. Pediatr. 2017, 5, 197. [Google Scholar] [CrossRef]
- Corica, D.; Bottari, A.; Aversa, T.; Morabito, L.A.; Curatola, S.; Alibrandi, A.; Ascenti, G.; Wasniewska, M. Prospective assessment of liver stiffness by shear wave elastography in childhood obesity: A pilot study. Endocrine 2022, 75, 59–69. [Google Scholar] [CrossRef]
- Baldini, F.; Khalil, M.; Bartolozzi, A.; Vassalli, M.; Di Ciaula, A.; Portincasa, P.; Vergani, L. Relationship between Liver Stiffness and Steatosis in Obesity Conditions: In Vivo and In Vitro Studies. Biomolecules 2022, 12, 733. [Google Scholar] [CrossRef]
- Unalp-Arida, A.; Ruhl, C.E. Transient elastography measures of hepatic steatosis and fibrosis are associated with body composition among US adolescents. J. Pediatr. Gastroenterol. Nutr. 2022, 75, 497–505. [Google Scholar] [CrossRef] [PubMed]
- Banc-Husu, A.M.; Bass, L.M. Transient elastography in pediatric liver disease. J. Pediatr. Gastroenterol. Nutr. 2021, 73, 141–144. [Google Scholar] [CrossRef] [PubMed]
- Yadav, A.K.; Sherwani, P.; Yhoshu, E.; Dhingra, V.K.; Bhat, N.K. Diagnostic accuracy of shear wave elastography in evaluating renal fibrosis in children with chronic kidney disease: A comparative study with nuclear scan. Egypt. J. Radiol. Nucl. Med. 2023, 54, 110. [Google Scholar] [CrossRef]
- Liu, Q.; Wang, Z. Diagnostic value of real-time shear wave elastography in children with chronic kidney disease. Clin. Hemorheol. Microcirc. 2021, 77, 287–293. [Google Scholar] [CrossRef] [PubMed]
- Yang, T.; Jin, Y.; Neogi, A. Acoustic attenuation and dispersion in fatty tissues and tissue phantoms influencing ultrasound biomedical imaging. ACS Omega 2022, 8, 1319–1330. [Google Scholar] [CrossRef] [PubMed]
- Cho, Y.S.; Lim, S.; Kim, Y.; Kim, T.Y.; Jeong, W.K.; Sohn, J.H. Abdominal wall thickness affects liver stiffness measurements by 2-d shear wave elastography in patients with chronic liver disease. Ultrasound Med. Biol. 2019, 45, 2697–2703. [Google Scholar] [CrossRef] [PubMed]
- Varol, U.; Valera-Calero, J.A.; Fernández-de-Las-Peñas, C.; Buffet-García, J.; Plaza-Manzano, G.; Navarro-Santana, M.J. Body Composition and Demographic Features Do Not Affect the Diagnostic Accuracy of Shear Wave Elastography. Bioengineering 2023, 10, 904. [Google Scholar] [CrossRef]
- Dietrich, C.F.; Ferraioli, G.; Sirli, R.; Popescu, A.; Sporea, I.; Pienar, C.; Kunze, C.; Taut, H.; Schrading, S.; Bota, S.; et al. General advice in ultrasound based elastography of pediatric patients. Med. Ultrason. 2019, 21, 315–326. [Google Scholar] [CrossRef]
- Lewindon, P.J.; Balouch, F.; Pereira, T.N.; Puertolas-Lopez, M.V.; Noble, C.; Wixey, J.A.; Ramm, G.A. Transient liver elastography in unsedated control children: Impact of age and intercurrent illness. J. Paediatr. Child. Health 2016, 52, 637–642. [Google Scholar] [CrossRef]
- Eiler, J.; Kleinholdermann, U.; Albers, D.; Dahms, J.; Hermann, F.; Behrens, C.; Luedemann, M.; Klingmueller, V.; Alzen, G.F. Standard value of ultrasound elastography using acoustic radiation force impulse imaging (ARFI) in healthy liver tissue of children and adolescents. Ultraschall Med. 2012, 33, 474–479. [Google Scholar] [CrossRef]
- Hanquinet, S.; Courvoisier, D.; Kanavaki, A.; Dhouib, A.; Anooshiravani, M. Acoustic radiation force impulse imaging-normal values of liver stiffness in healthy children. Pediatr. Radiol. 2013, 43, 539–544. [Google Scholar] [CrossRef] [PubMed]
- Huang, Z.; Zheng, J.; Zeng, J.; Wang, X.; Wu, T.; Zheng, R. Normal liver stiffness in healthy adults assessed by real-time shear wave elastography and factors that influence this method. Ultrasound Med. Biol. 2014, 40, 2549–2555. [Google Scholar] [CrossRef] [PubMed]
- Mentzel, H.J.; Glutig, K.; Gräger, S.; Krüger, P.C.; Waginger, M. Ultrasound elastography in children—Nice to have for scientific studies or arrived in clinical routine? Mol. Cell. Pediatr. 2022, 9, 11. [Google Scholar] [CrossRef] [PubMed]
- Zhang, Y.N.; Fowler, K.J.; Ozturk, A.; Potu, C.K.; Louie, A.L.; Montes, V.; Henderson, W.C.; Wang, K.; Andre, M.P.; Samir, A.E.; et al. Liver fibrosis imaging: A clinical review of ultrasound and magnetic resonance elastography. J. Magn. Reason. Imaging 2020, 51, 25–42. [Google Scholar] [CrossRef] [PubMed]
- Tahmasebi, A.; Wessner, C.E.; Guglielmo, F.F.; Wang, S.; Vu, T.; Liu, J.B.; Civan, J.; Lyshchik, A.; Forsberg, F.; Li, H.; et al. Comparison of Magnetic Resonance-Based Elastography and Ultrasound Shear Wave Elastography in Patients with Suspicion of Nonalcoholic Fatty Liver Disease. Ultrasound Q. 2023, 39, 100–108. [Google Scholar] [CrossRef]
- Talma, H.; Chinapaw, M.J.; Bakker, B.; Hira Sing, R.A.; Terwee, C.B.; Altenburg, T.M. Bioelectrical impedance analysis to estimate body composition in children and adolescents: A systematic review and evidence appraisal of validity, responsiveness, reliability and measurement error. Obes. Rev. 2013, 14, 895–905. [Google Scholar] [CrossRef]
- Clasey, J.L.; Easley, E.A.; Murphy, M.O.; Kiessling, S.G.; Stromberg, A.; Schadler, A.; Huang, H.; Bauer, J.A. Body mass index percentiles versus body composition assessments: Challenges for disease risk classifications in children. Front. Pediatr. 2023, 11, 1112920. [Google Scholar] [CrossRef]
- Seo, Y.G.; Kim, J.H.; Kim, Y.; Lim, H.; Ju, Y.S.; Kang, M.J.; Lee, K.; Lee, H.J.; Jang, H.B.; Park, S.I.; et al. Validation of body composition using bioelectrical impedance analysis in children according to the degree of obesity. Scand. J. Med. Sci. Sports 2018, 28, 2207–2215. [Google Scholar] [CrossRef]
- Kyle, U.G.; Earthman, C.P.; Pichard, C.; Coss-Bu, J.A. Body composition during growth in children: Limitations and perspectives of bioelectrical impedance analysis. Eur. J. Clin. Nutr. 2015, 69, 1298–1305. [Google Scholar] [CrossRef]
- Luque, V.; Closa-Monasterolo, R.; Rubio-Torrents, C.; Zaragoza-Jordana, M.; Ferré, N.; Gispert-Llauradó, M.; Escribano, J. Bioimpedance in 7-year-old children: Validation by dual X-ray absorptiometry—Part 1: Assessment of whole body composition. Ann. Nutr. Metab. 2014, 64, 113–121. [Google Scholar] [CrossRef]
- Näsänen-Gilmore, P.; Kumwenda, C.; Nurhonen, M.; Hallamaa, L.; Mangani, C.; Ashorn, P.; Ashorn, U.; Kajantie, E. Body composition among Malawian young adolescents: Cross-validating predictive equations for bioelectric impedance analysis using deuterium dilution method. PLoS ONE 2023, 18, e0284158. [Google Scholar] [CrossRef] [PubMed]
- Barreira, T.V.; Staiano, A.E.; Katzmarzyk, P.T. Validity assessment of a portable bioimpedance scale to estimate body fat percentage in white and African-American children and adolescents. Pediatr. Obes. 2013, 8, e29–e32. [Google Scholar] [CrossRef] [PubMed]
- Meredith-Jones, K.A.; Williams, S.M.; Taylor, R.W. Bioelectrical impedance as a measure of change in body composition in young children. Pediatr. Obes. 2015, 10, 252–259. [Google Scholar] [CrossRef] [PubMed]
- Mainous, A.G., 3rd; Rooks, B.J.; Medley, J.F.; Dickmann, S.B. Body composition among adults at a healthy body mass index and association with undetected non-alcoholic fatty liver. Int. J. Obes. 2022, 46, 1403–1405. [Google Scholar] [CrossRef]


| Variable | Group 1 (N = 37) “CKD Group” | Group 2 (N = 46) “HTN Group” | Healthy Subjects (N = 31) | Group 1 vs. Group 2 | Kruskal–Wallis Test |
|---|---|---|---|---|---|
| Age (years) | 16 (6) p = 0.250 | 15 (6) p = 0.806 | 14 (4) | p = 0.364 | p = 0.488 |
| M/F | 23/14 | 37/9 | 13/18 | ||
| Height (cm) | 170 (16.3) p = 0.108 | 169 (22.5) p = 0.085 | 163 (16) | p = 0.780 | p = 0.165 |
| Weight (kg) | 60 (21.90.146) p = 0.146 | 76.8 (27.8) p < 0.001 | 53 (19.5) | p = 0.001 | p < 0.001 |
| BMI (kg/m2) | 20.8 (4.7) p = 0.252 | 26.5 (6) p < 0.001 | 19.9 (3) | p < 0.001 | p < 0.001 |
| Overweight/obese | 8 (21.6%) | 35 (76%) | 0 | ||
| Waist circumference (cm) | 73 (10) p = 0.250 | 89 (15) p < 0.001 | 70 (9) | p < 0.001 | p < 0.001 |
| Hip circumference (cm) | 83.5 (17) p = 0.792 | 96 (17) p < 0.001 | 85 (10) | p = 0.001 | p < 0.001 |
| Systolic pressure (mmHg) | 119 (11) p = 0.032 | 130 (11) p < 0.001 | 116 (15) | p < 0.001 | p < 0.001 |
| Diastolic pressure (mmHg) | 70 (13) p = 0.878 | 71 (10) p = 0.735 | 69 (10) | p = 0.660 | p = 0.891 |
| LE (m/s) | 1.51 (0.18) p = 0.008 | 1.52 (0.16) p < 0.001 | 1.41 (0.18) | p = 0.125 | p < 0.001 |
| LE (kPa) | 6.7 (1.7) p = 0.007 | 6.7 (1.6) p < 0.001 | 5.9 (1.5) | p = 0.176 | p < 0.001 |
| Left KE (m/s) * | 1.77 (0.21) p = 0.041 | 1.9 (0.26) p = 0.224 | 1.84 (0.26) | p = 0.001 | p = 0.003 |
| Left KE (kPa) * | 9.35 (2.23) p = 0.058 | 11.1 (3) p = 0.156 | 10.1 (2.9) | p = 0.001 | p = 0.002 |
| Right KE (m/s) | 1.79 (0.16) p = 0.074 | 1.9 (0.21) p = 0.079 | 1.85 (0.11) | p = 0.001 | p = 0.002 |
| Right KE (kPa) | 9.5 (1.7) p = 0.084 | 10.9 (2.5) p = 0.073 | 10.3 (1.1) | p = 0.001 | p = 0.002 |
| PA (°) | 6.7 (1.3)0.003 p = 0.003 | 7.0 (1.4) p < 0.001 | 6 (1) | p = 0.190 | p < 0.001 |
| FM (kg/m) | 10.5 (8.6) p = 0.631 | 20.9 (14.1) p < 0.001 | 11.8 (5.7) | p < 0.001 | p < 0.001 |
| FFM (kg/m) | 48.2 (19.1) p = 0.016 | 55.6 (18.8) p < 0.001 | 40.9 (10.7) | p = 0.086 | p < 0.001 |
| BCM (kg/m) | 27.6 (15.5) p = 0.047 | 32.8 (12.1) p < 0.001 | 22.8 (6.8) | p = 0.080 | p < 0.001 |
| TBW (L/m) | 37.4 (14.5) p = 0.027 | 41.9 (13.1) p < 0.001 | 32.6 (7.2) | p = 0.082 | p < 0.001 |
| ECW (L/m) | 16.3 (4.9) p = 0.021 | 17.2 (6.2) p = 0.001 | 13.8 (4) | p = 0.122 | p = 0.002 |
| LE (m/s) | LE (kPa) | Left KE (m/s) | Left KE (kPa) | Right KE (m/s) | Right KE (kPa) | |
|---|---|---|---|---|---|---|
| PA (°) | r = 0.284 p = 0.002 | r = 0.277 p = 0.003 | r = 0.019 p = 0.845 | r = 0.045 p = 0.636 | r = −0.024 p = 0.801 | r = −0.001 p = 0.995 |
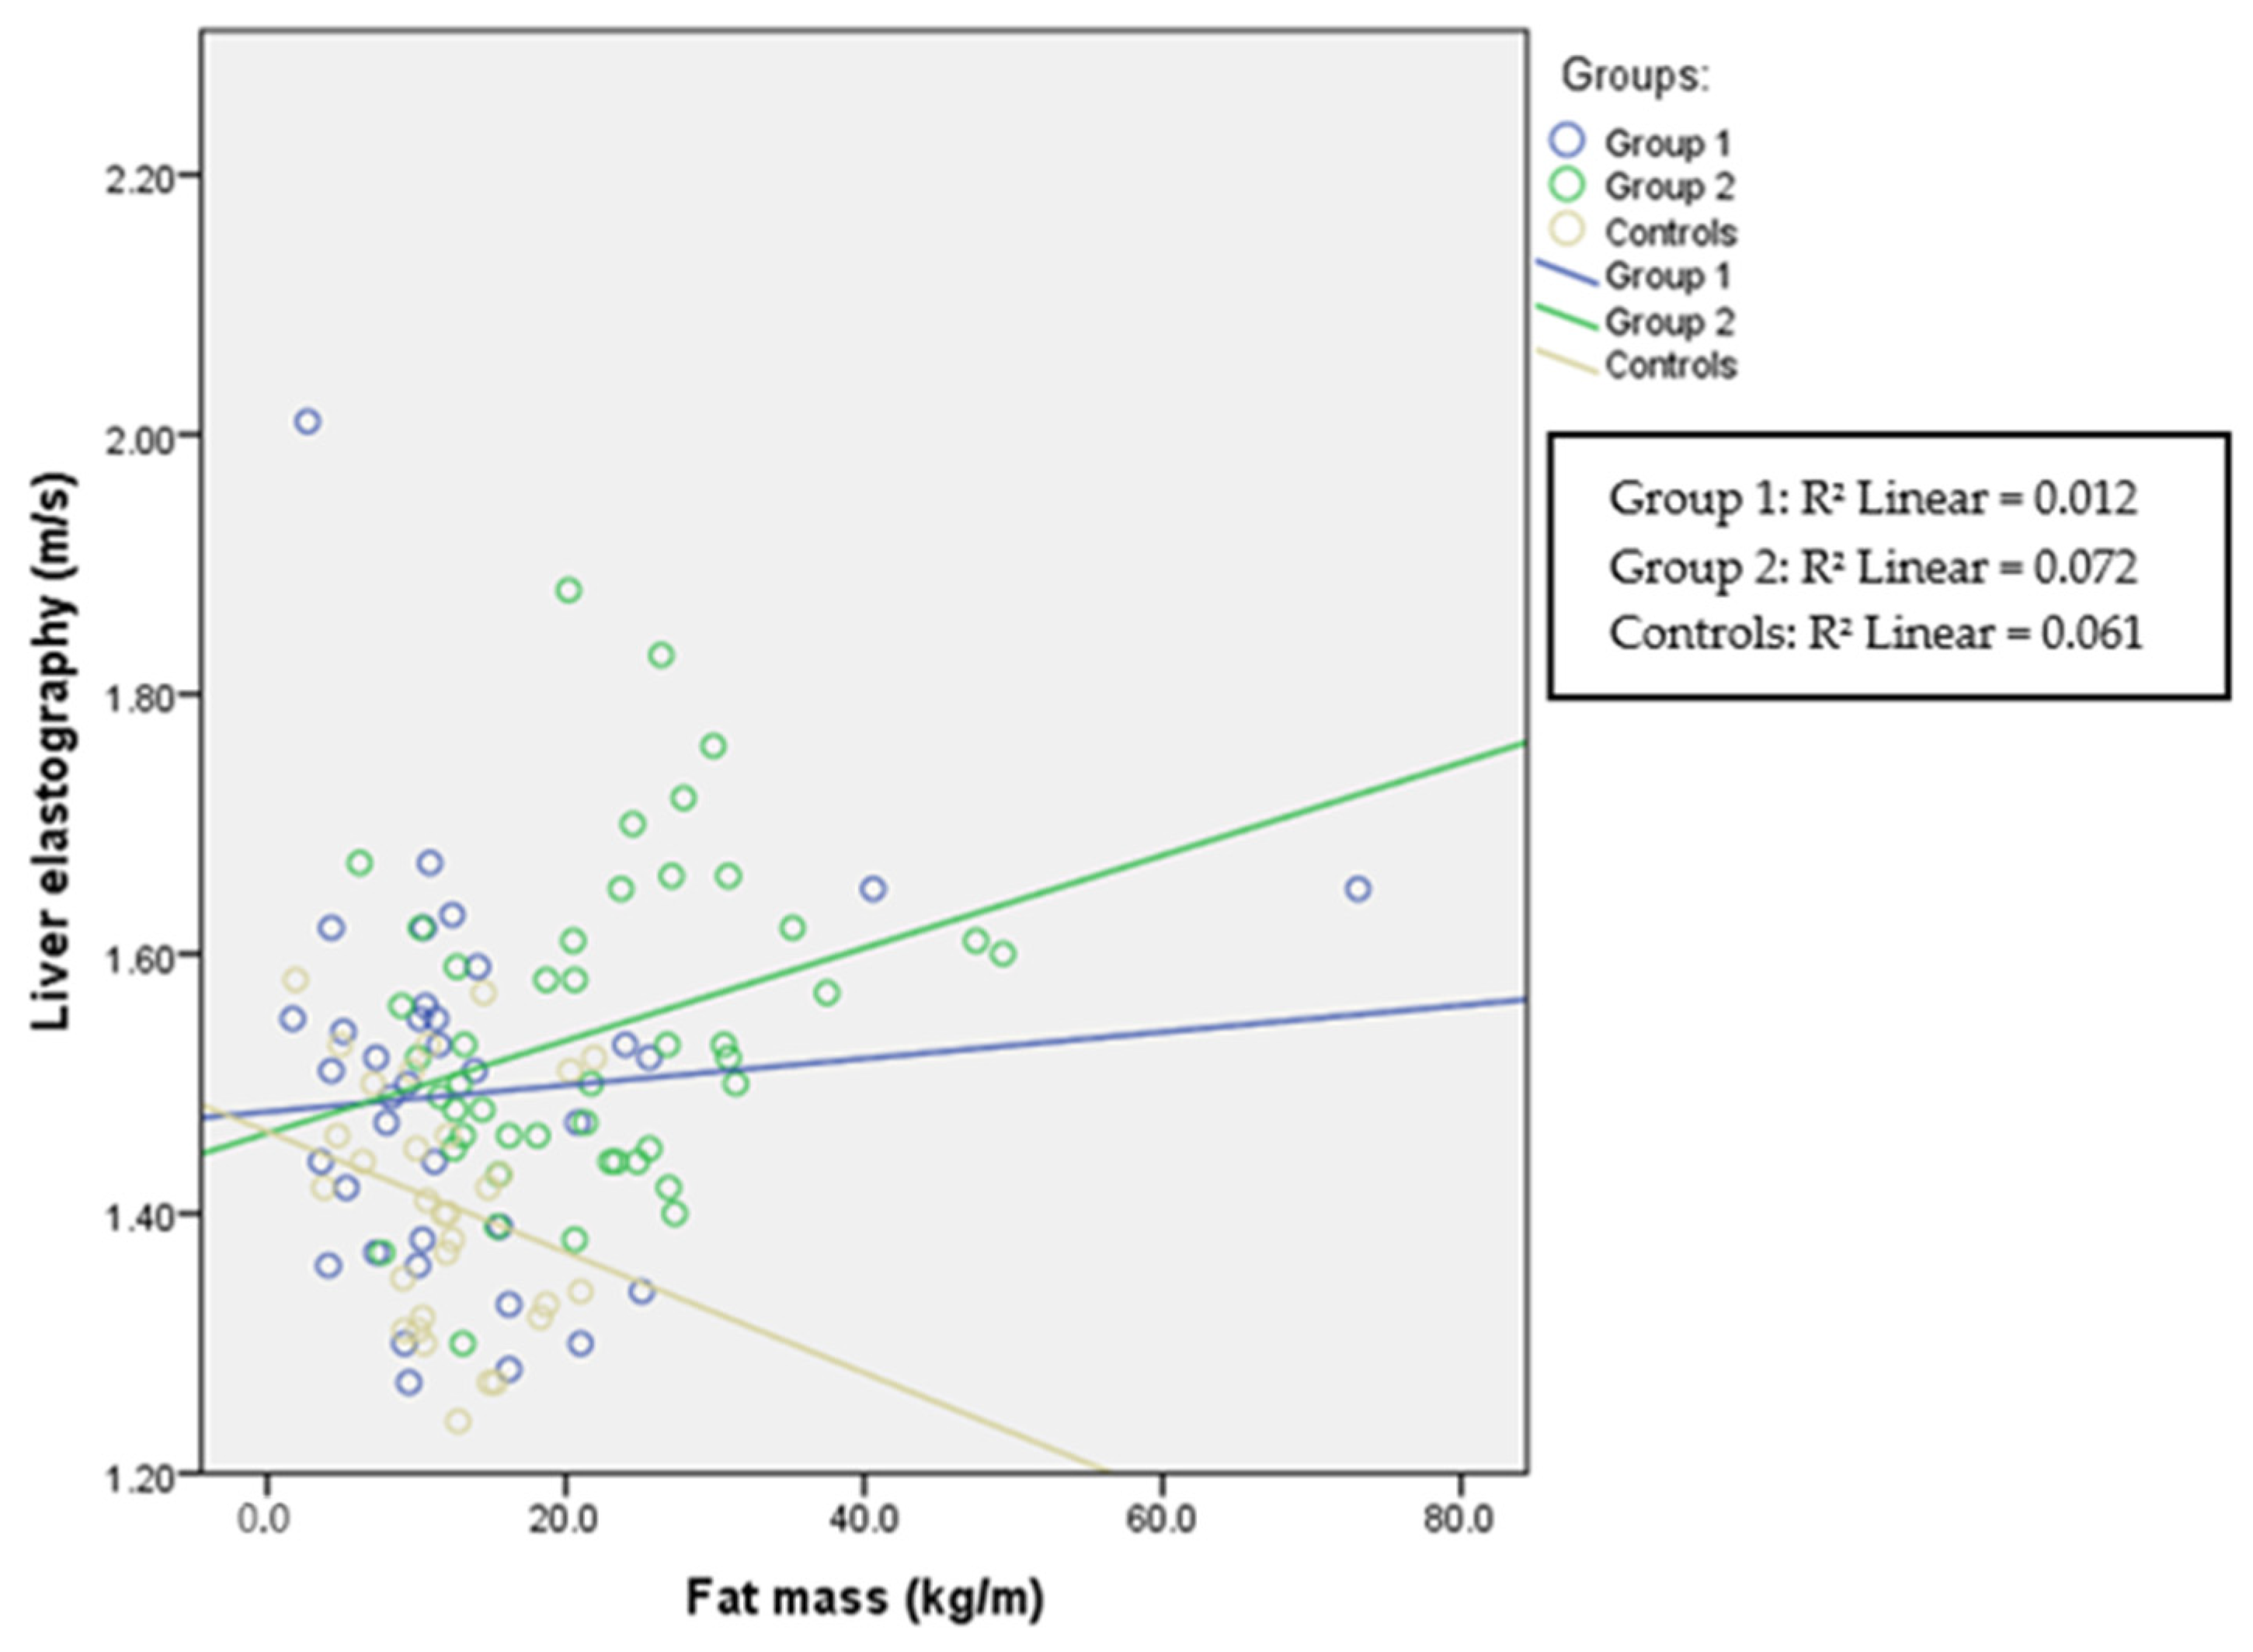
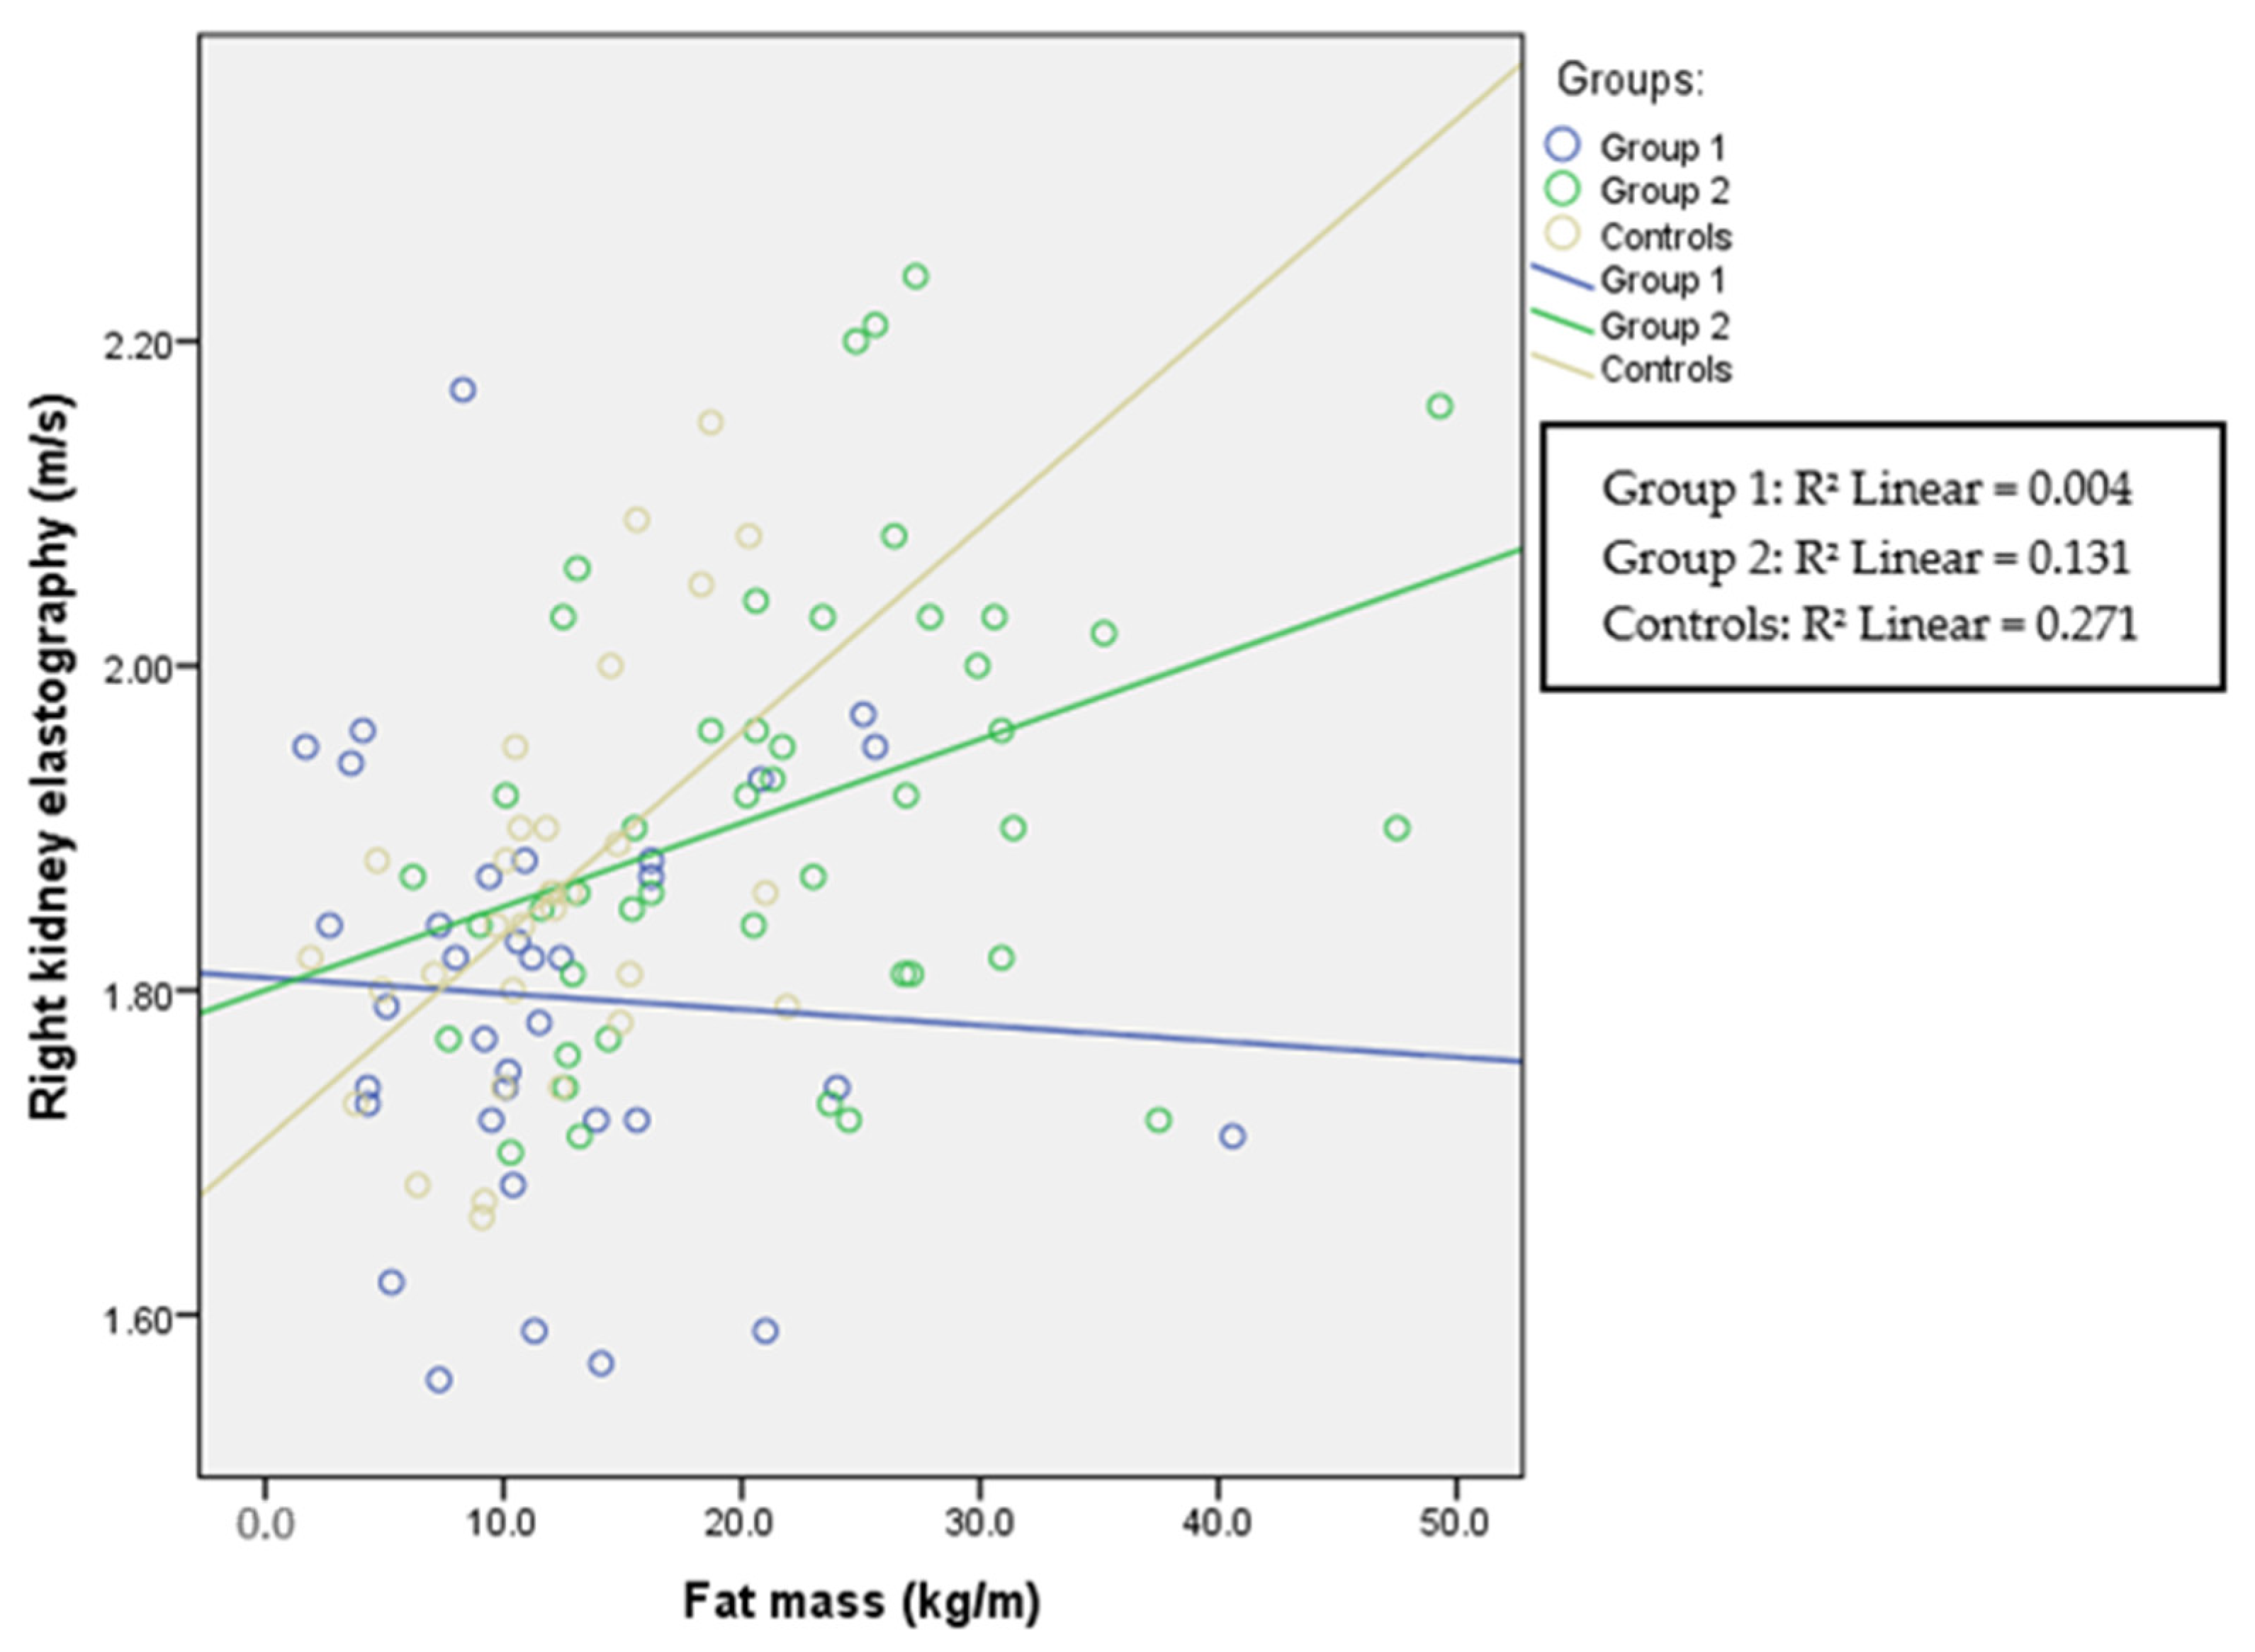
| FM (kg/m) | r = 0.191 p = 0.041 | r = 0.178 p = 0.058 | r = 0.514 p < 0.001 | r = 0.541 p < 0.001 | r = 0.367 p < 0.001 | r = 0.392 p < 0.001 |
| FFM (kg/m) | r = 0.294 p = 0.001 | r = 0.288 p = 0.002 | r = −0.032 p = 0.739 | r = 0.005 p = 0.961 | r < 0.001 p = 0.998 | r = 0.027 p = 0.781 |
| BCM (kg/m) | r = 0.303 p = 0.001 | r = 0.296 p = 0.001 | r = −0.023 p = 0.814 | r = 0.013 p = 0.892 | r = −0.006 p = 0.947 | r = 0.021 p = 0.829 |
| TBW (L/m) | r = 0.307 p = 0.001 | r = 0.299 p = 0.001 | r = −0.060 p = 0.535 | r = −0.022 p = 0.819 | r = −0.017 p = 0.860 | r = 0.008 p = 0.932 |
| ECW (L/m) | r = 0.254 p = 0.006 | r = 0.246 p = 0.008 | r = −0.103 p = 0.282 | r = −0.069 p = 0.470 | r = −0.066 p = 0.491 | r = −0.043 p = 0.654 |
| Variable | Group with Obesity (N = 43) | Group with Normal Weight (N = 71) | Comparison |
|---|---|---|---|
| Age (years) | 15 (7) | 15 (5) | p = 0.649 |
| M/F | 35/8 | 38/33 | |
| Height (cm) | 169 (17) | 168 (17) | p = 0.684 |
| Weight (kg) | 80 (27) | 59 (18.5) | p < 0.001 |
| BMI (kg/m2) | 27.9 (5.5) | 20 (3.2) | p < 0.001 |
| Waist circumference (cm) | 91.5 (14) | 72 (11) | p < 0.001 |
| Hip circumference (cm) | 99 (14) | 84 (11) | p < 0.001 |
| Systolic pressure (mmHg) | 129 (14) | 118 (17) | p < 0.001 |
| Diastolic pressure (mmHg) | 70 (10) | 70 (11) | p = 0.619 |
| LE (m/s) | 1.53 (0.17) | 1.44 (0.16) | p < 0.001 |
| LE (kPa) | 6.9 (1.6) | 6.1 (1.4) | p < 0.001 |
| Left KE (m/s) | 1.96 (0.21) | 1.81 (0.21) | p < 0.001 |
| Left KE (kPa) | 11.8 (2.5) | 9.8 (2.4) | p < 0.001 |
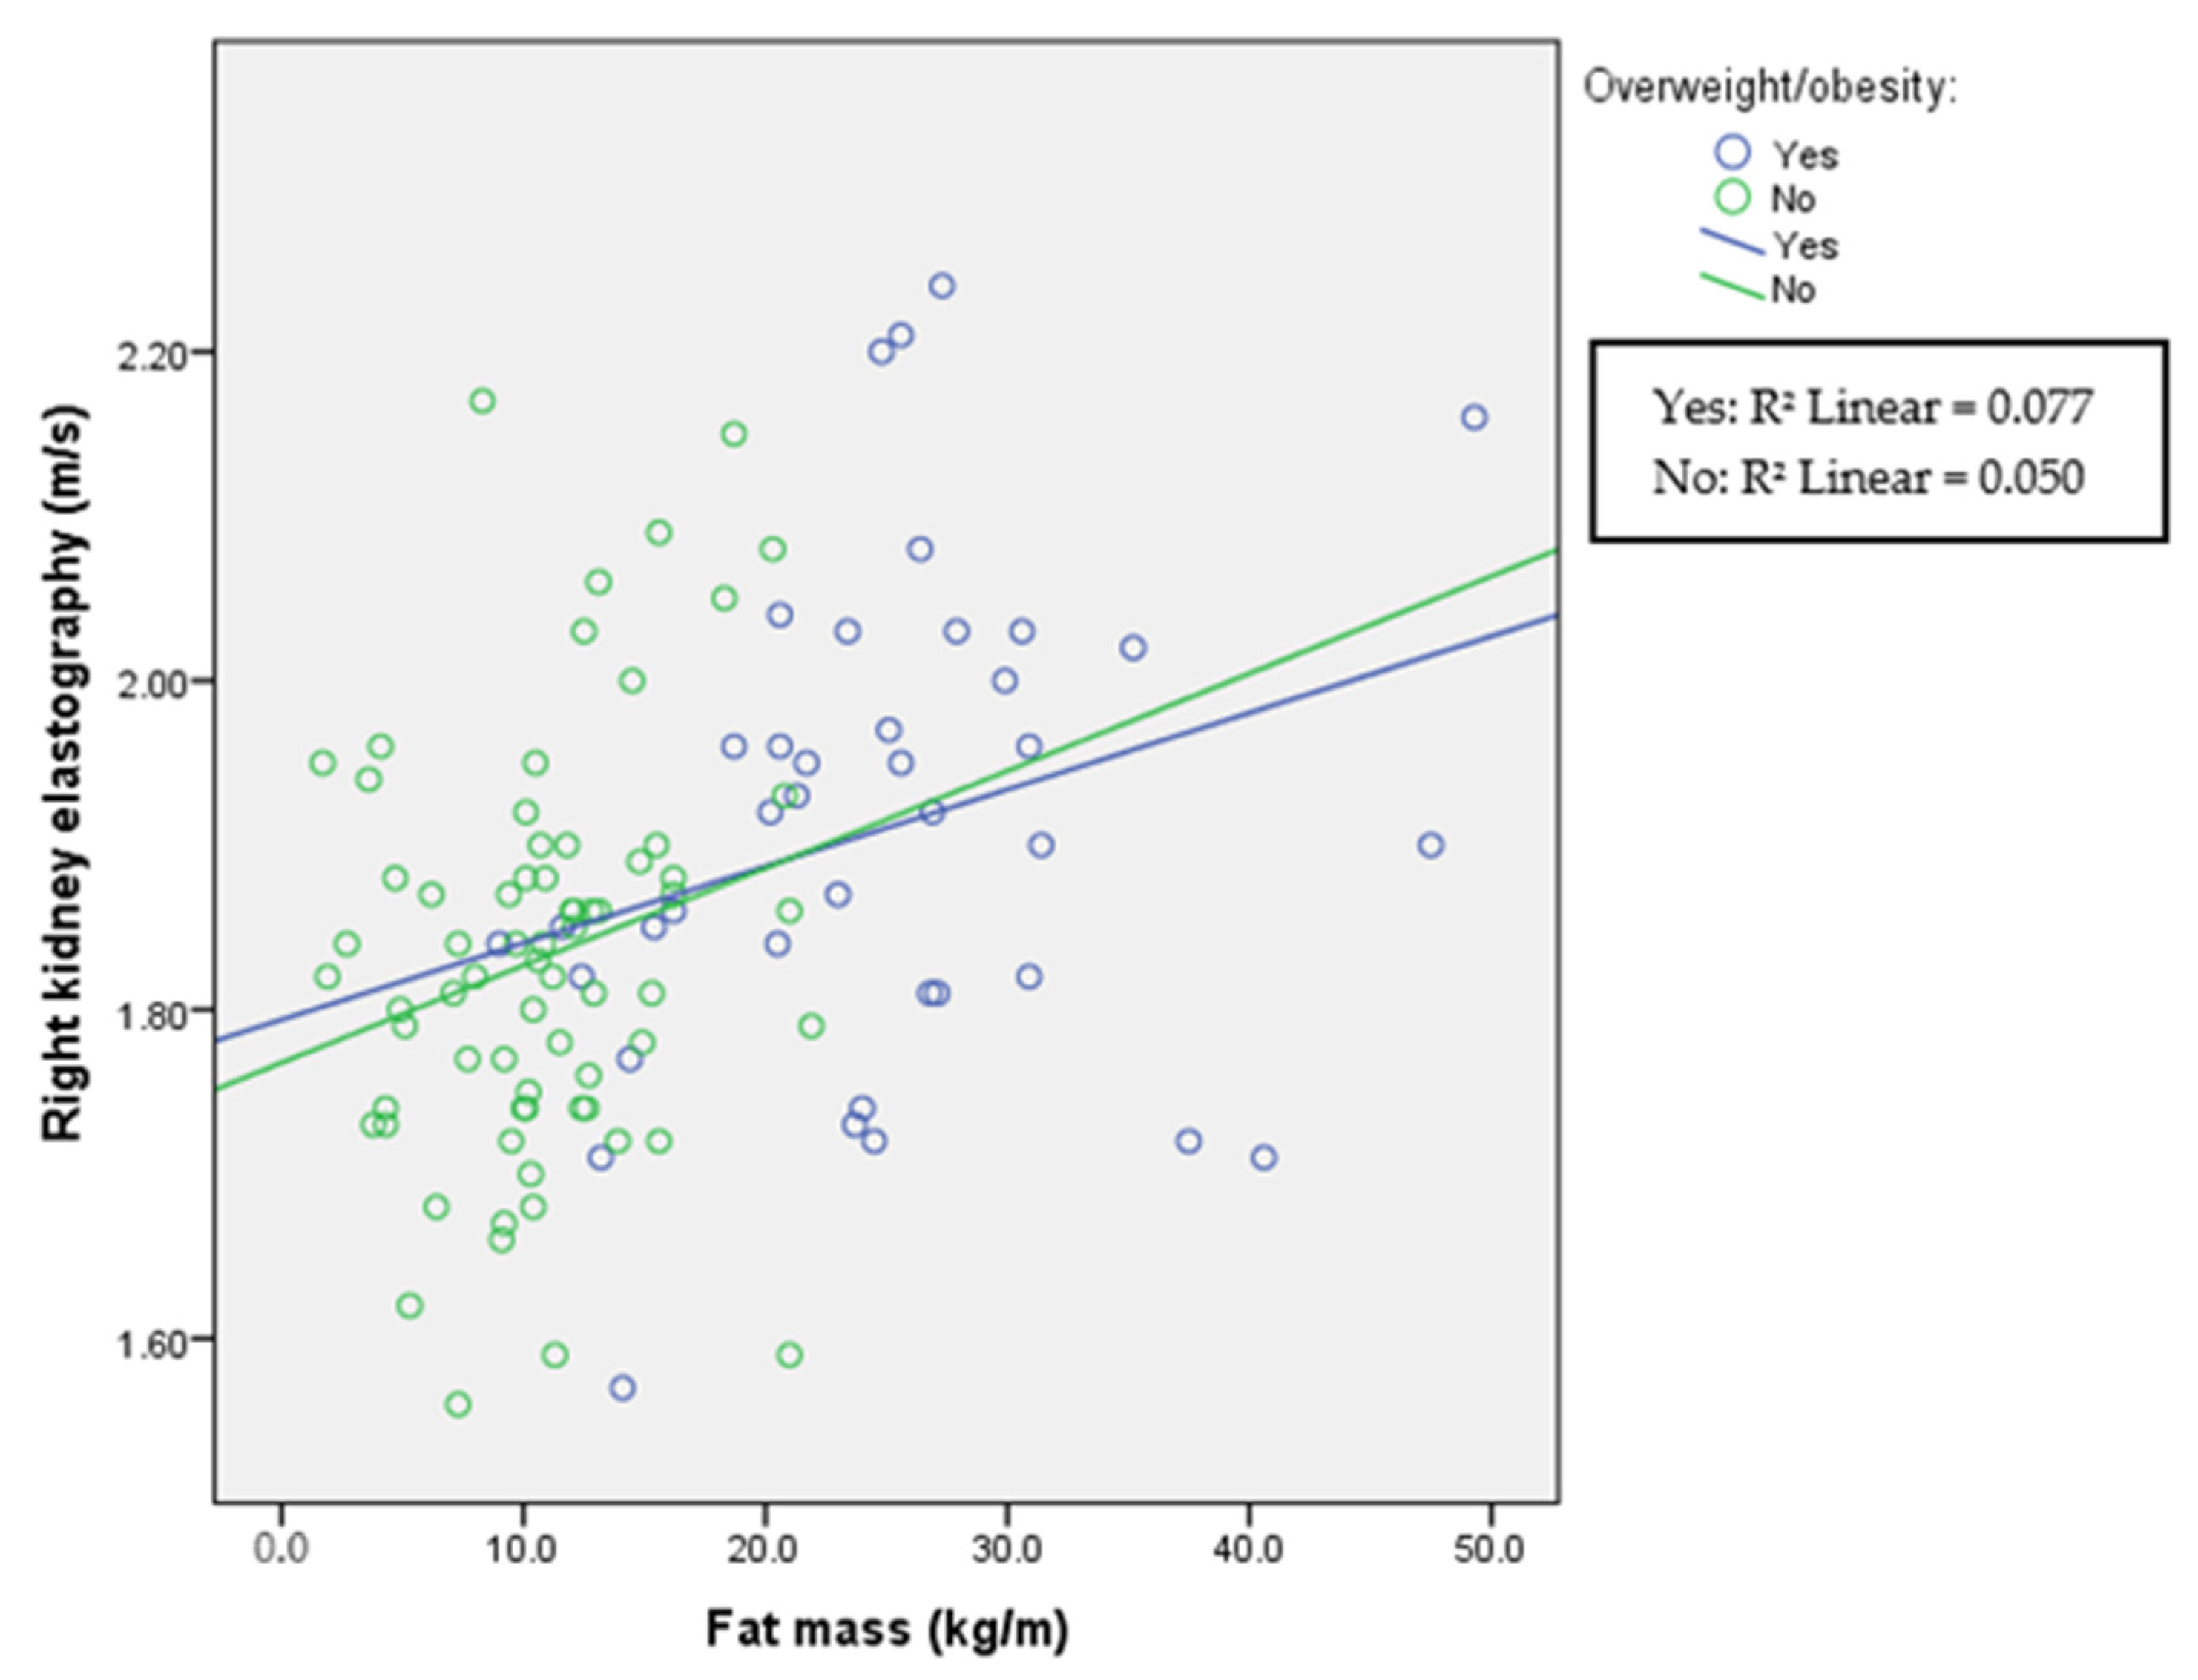
| Right KE (m/s) | 1.91 (0.2) | 1.83 (0.15) | p = 0.007 |
| Right KE (kPa) | 11.1 (2.3) | 10 (1.6) | p = 0.003 |
| PA (°) | 7 (1.4) | 6.3 (1.2) | p < 0.001 |
| FM (kg/m) | 24.5 (11.2) | 10.6 (5.4) | p < 0.001 |
| FFM (kg/m) | 58.6 (21.9) | 45 (15.5) | p < 0.001 |
| BCM (kg/m) | 33.4 (15.1) | 10.6 (5.4) | p < 0.001 |
| TBW (L/m) | 42.5 (14.4) | 33.7 (11.2) | p < 0.001 |
| ECW (L/m) | 17.2 (6.3) | 15.1 (5) | p = 0.006 |
| Liver Elastography | Left Kidney Elastography | Right Kidney Elastography | |
|---|---|---|---|
| Age (years) | t = −0.520, p = 0.604 | t = 1.770, p = 0.080 | t = 0.248, p = 0.805 |
| Height (cm) | t = −1.807, p = 0.074 | t = −2.069, p = 0.041 | t = −2.526, p = 0.013 |
| Weight (kg) | t = −0.519, p = 0.605 | t = 1.497, p = 0.138 | t = 1.504, p = 0.136 |
| BMI (kg/m2) | t = −1.374, p = 0.173 | t = −1.453, p = 0.150 | t = −1.060, p = 0.292 |
| Waist circumference (cm) | t = 1.915, p = 0.059 | t = 1.173, p = 0.244 | t = −0.236, p = 0.814 |
| Hip circumference (cm) | t = −1.675, p = 0.097 | t = 2.106, p = 0.038 | t = 0.913, p = 0.364 |
| Systolic pressure (mmHg) | t = 2.529, p = 0.013 | t = 0.999, p = 0.321 | t = 1.376, p = 0.172 |
| Diastolic pressure (mmHg) | t = −1.208, p = 0.230 | t = −0.220, p = 0.826 | t = −1.539, p = 0.127 |
| PA (°) | t = 1.078, p = 0.284 | t = 1.949, p = 0.054 | t = 2.535, p = 0.013 |
| FM (kg/m) | t = 1.047, p = 0.298 | t = −0.842, p = 0.402 | t = −0.893, p = 0.374 |
| FFM (kg/m) | t = 1.130, p = 0.261 | t = 1.147, p = 0.254 | t = 2.387, p = 0.019 |
| BCM (kg/m) | t = −1.082, p = 0.282 | t = −2.272, p = 0.025 | t = −3.030, p = 0.003 |
| TBW (L/m) | t = 2.005, p = 0.048 | t = 0.308, p = 0.759 | t = −0.807, p = 0.422 |
| ECW (L/m) | t = −1.066, p = 0.289 | t = −1.225, p = 0.224 | t = −1.137, p = 0.259 |
| F-test | 3.083, p = 0.001 | 4.652, p < 0.001 | 2.983, p = 0.001 |
| R2 | 0.315 | 0.414 | 0.312 |
| Adjusted R2 | 0.213 | 0.325 | 0.208 |
Disclaimer/Publisher’s Note: The statements, opinions and data contained in all publications are solely those of the individual author(s) and contributor(s) and not of MDPI and/or the editor(s). MDPI and/or the editor(s) disclaim responsibility for any injury to people or property resulting from any ideas, methods, instructions or products referred to in the content. |
© 2023 by the authors. Licensee MDPI, Basel, Switzerland. This article is an open access article distributed under the terms and conditions of the Creative Commons Attribution (CC BY) license (https://creativecommons.org/licenses/by/4.0/).
Share and Cite
Marčun Varda, N.; Golob Jančič, S.; Močnik, M. Obesity and Body Composition in Relation to Liver and Kidney Ultrasound Elastography in Paediatric Patients with Either Hypertension or Chronic Kidney Disease. Children 2024, 11, 18. https://doi.org/10.3390/children11010018
Marčun Varda N, Golob Jančič S, Močnik M. Obesity and Body Composition in Relation to Liver and Kidney Ultrasound Elastography in Paediatric Patients with Either Hypertension or Chronic Kidney Disease. Children. 2024; 11(1):18. https://doi.org/10.3390/children11010018
Chicago/Turabian StyleMarčun Varda, Nataša, Sonja Golob Jančič, and Mirjam Močnik. 2024. "Obesity and Body Composition in Relation to Liver and Kidney Ultrasound Elastography in Paediatric Patients with Either Hypertension or Chronic Kidney Disease" Children 11, no. 1: 18. https://doi.org/10.3390/children11010018