Fat Intake Reduction Strategies among Children and Adults to Eliminate Obesity and Non-Communicable Diseases in the Eastern Mediterranean Region

Abstract
:1. Introduction
Impacts of Reducing SFAs and TFAs Intake among Children and Adults
2. Objective of the Review and Methodology Used
2.1. Objective
- Providing baseline information on dietary intakes and dietary sources of SFAs and TFAs in countries of the Eastern Mediterranean Regional Office (EMRO) region.
- Providing an overview of national initiatives for the reduction of the intakes of specific types of dietary fat (SFAs and TFAs) in countries of the region.
- Set up recommendations to accelerate the implementation of WHO’s evidence-based recommendations on SFAs and TFAs intake reduction.
2.2. Methods
3. Fat Intake in the EMR
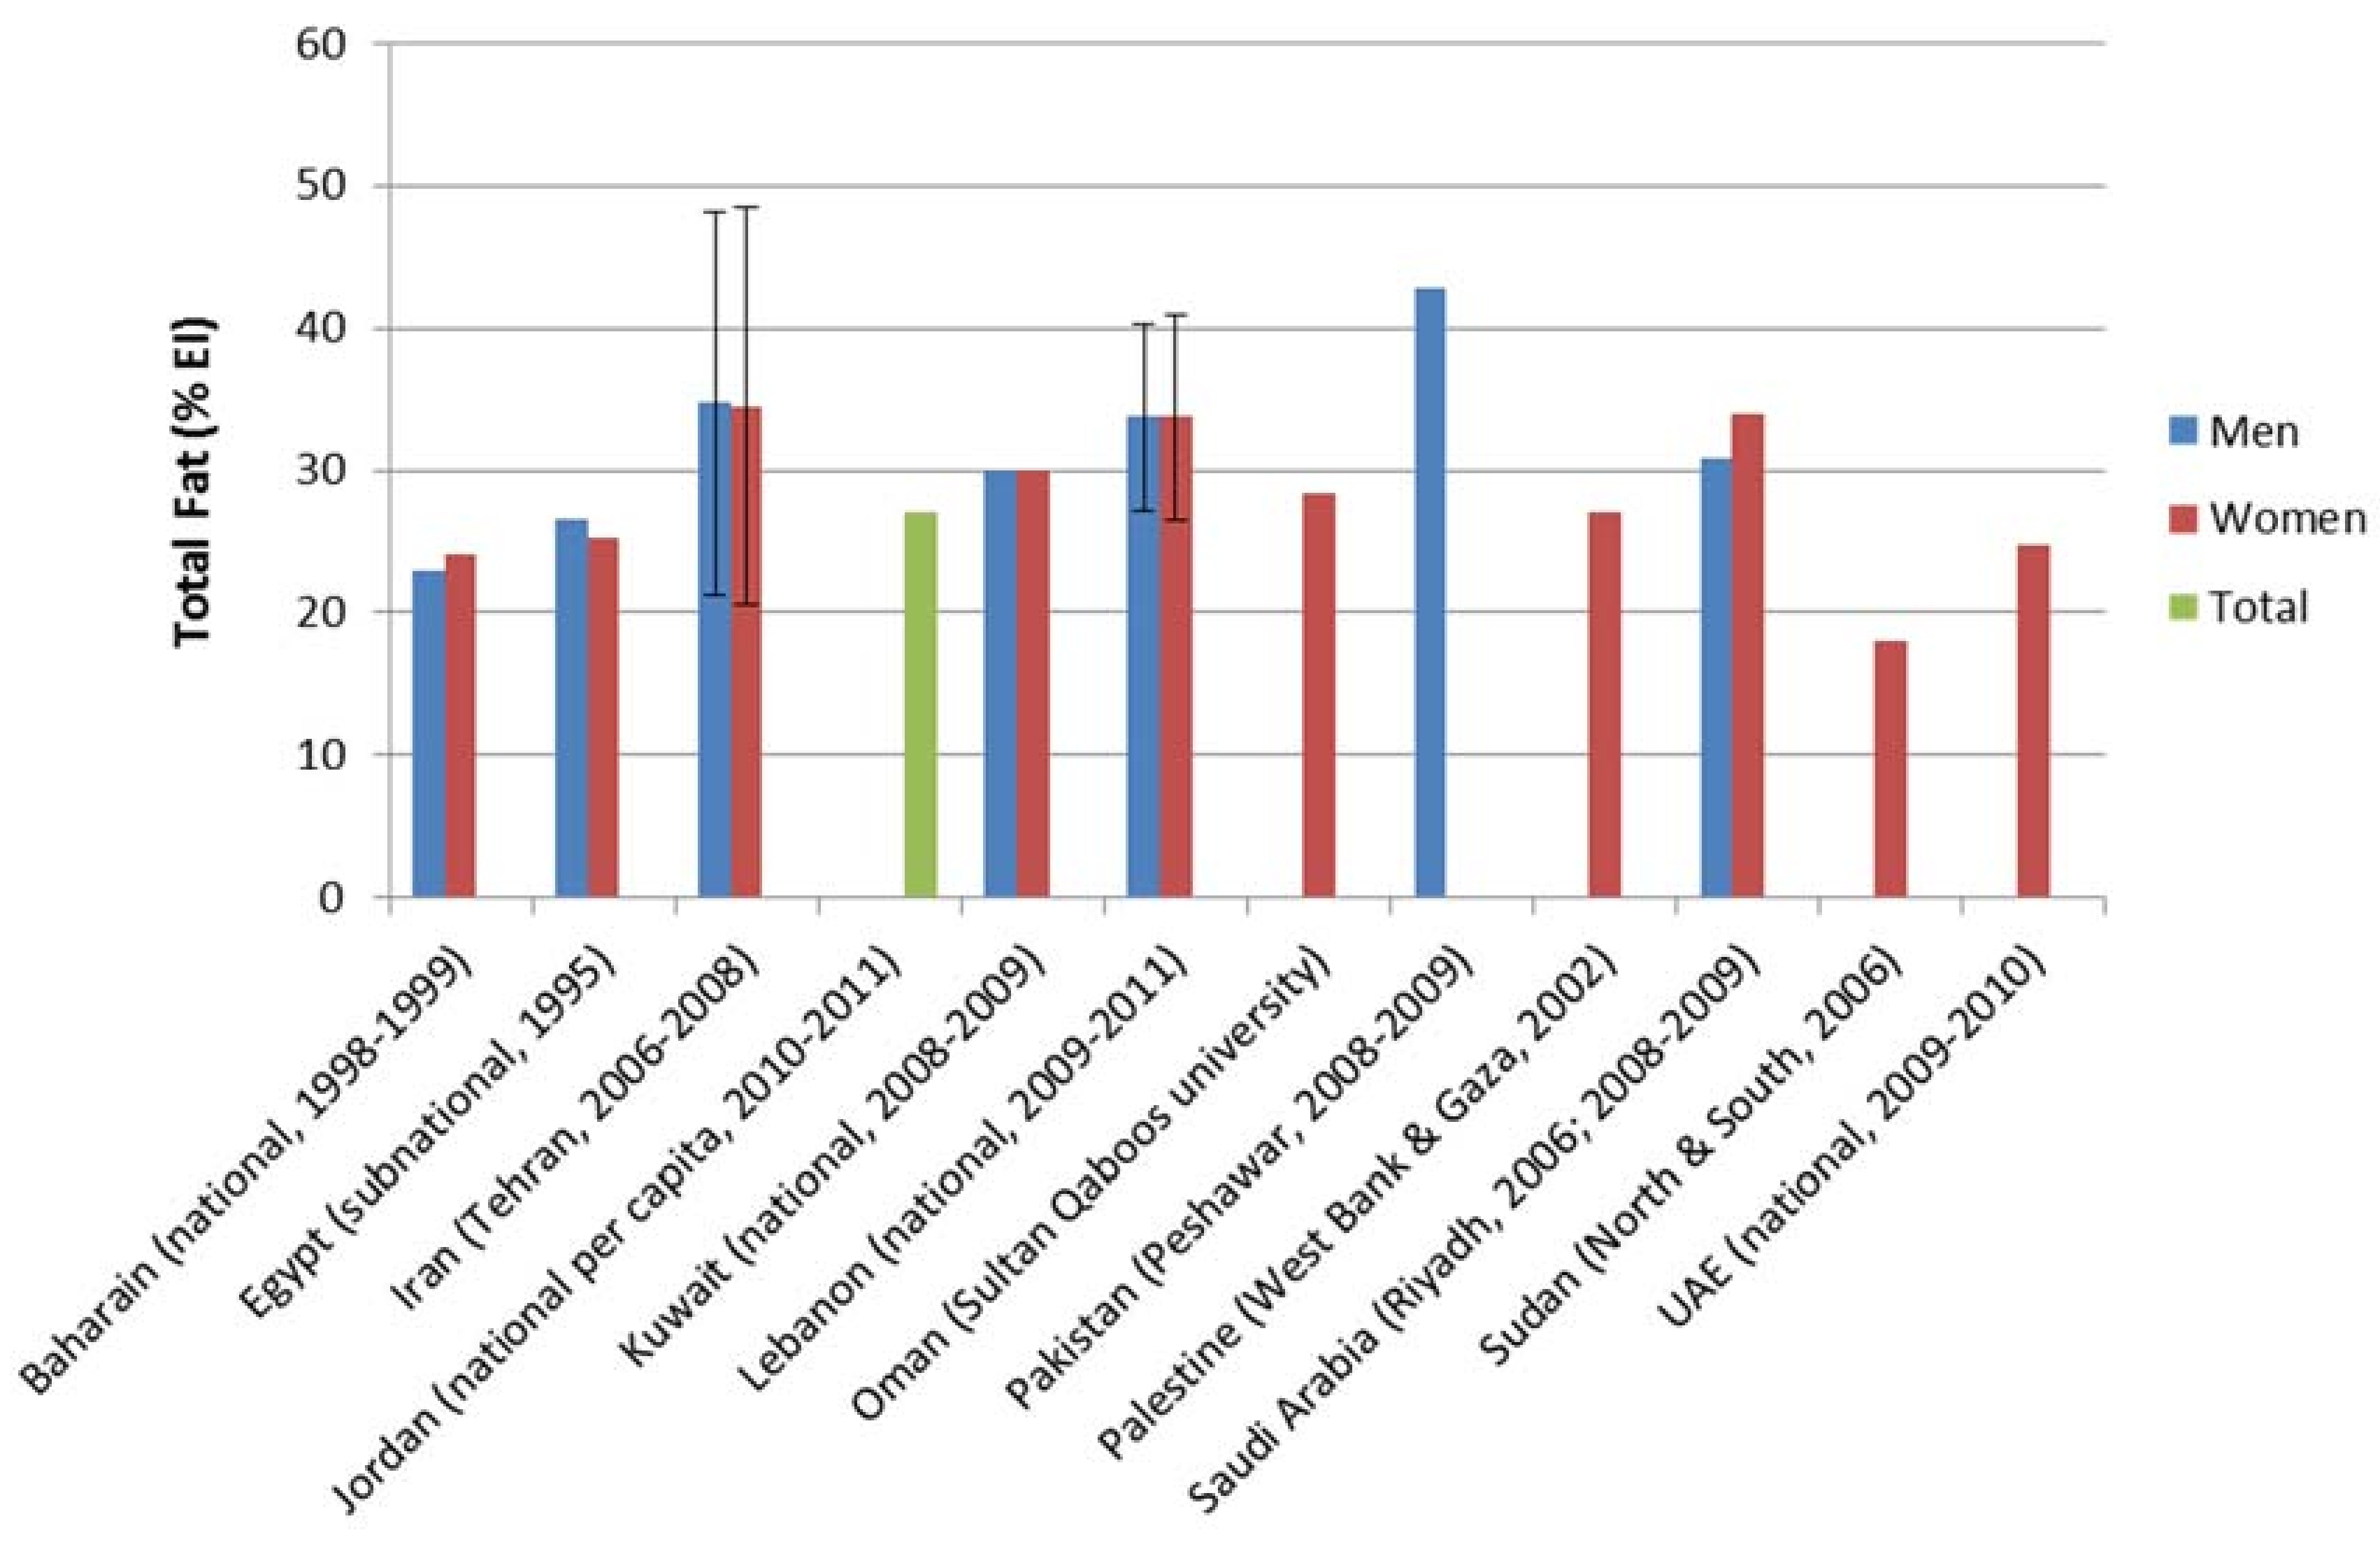
3.1. Total Fat (TF) Intake
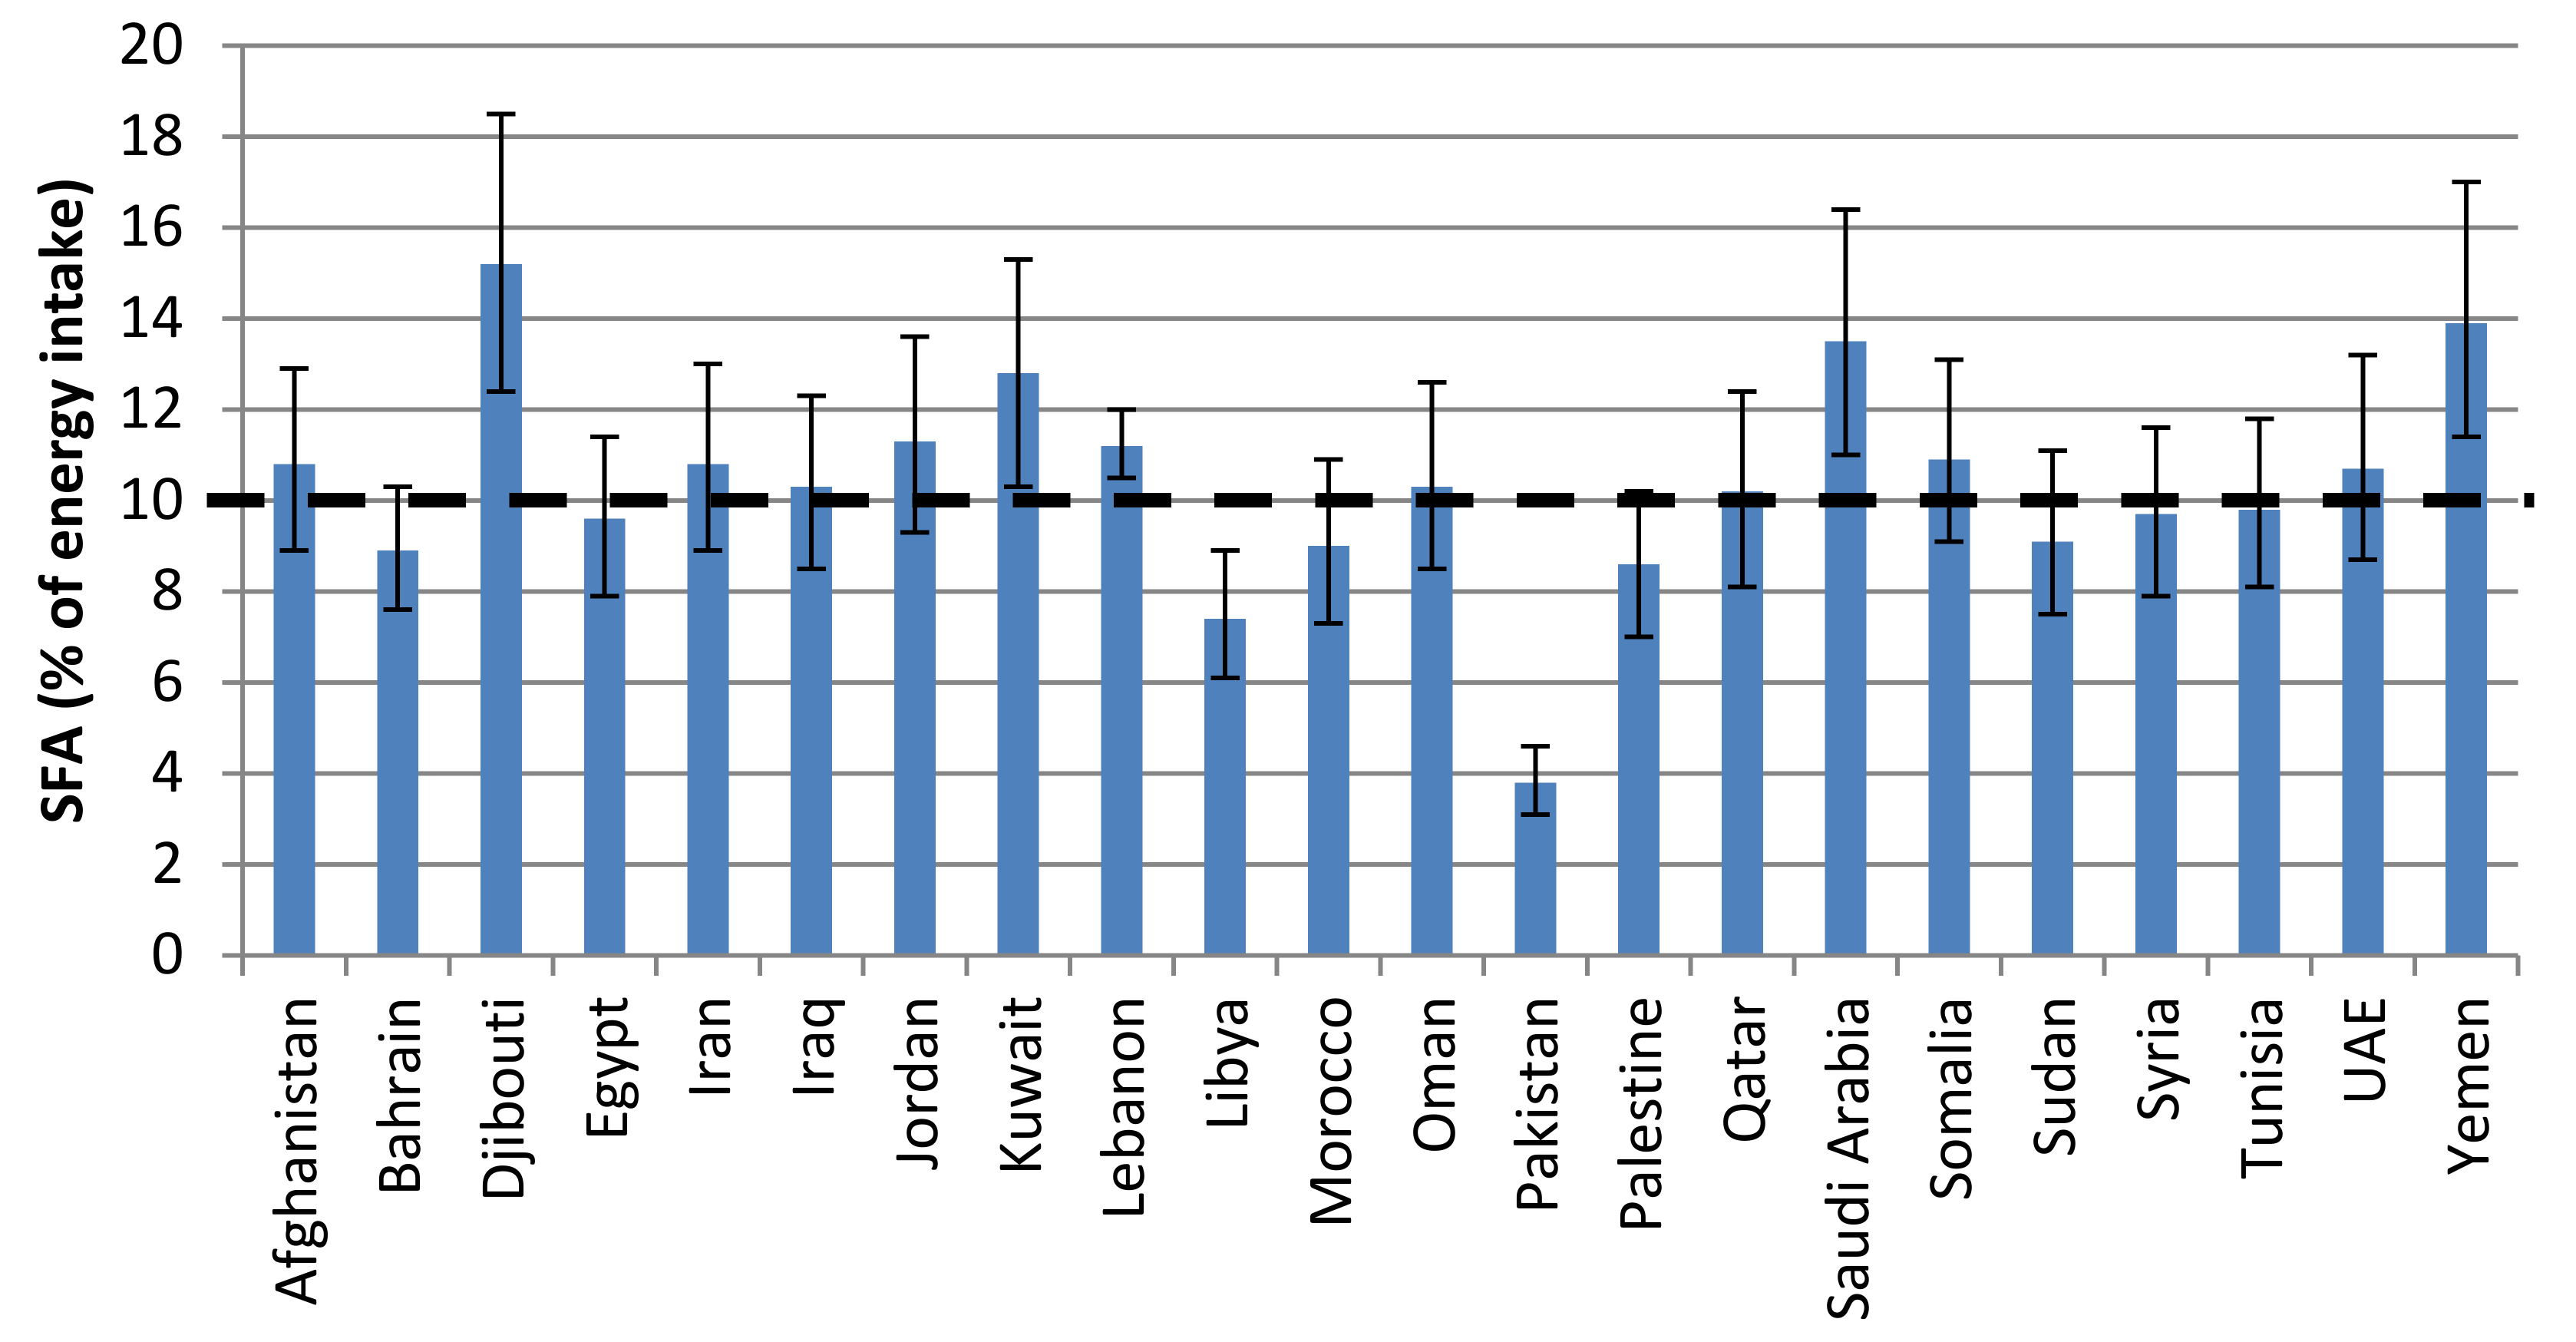
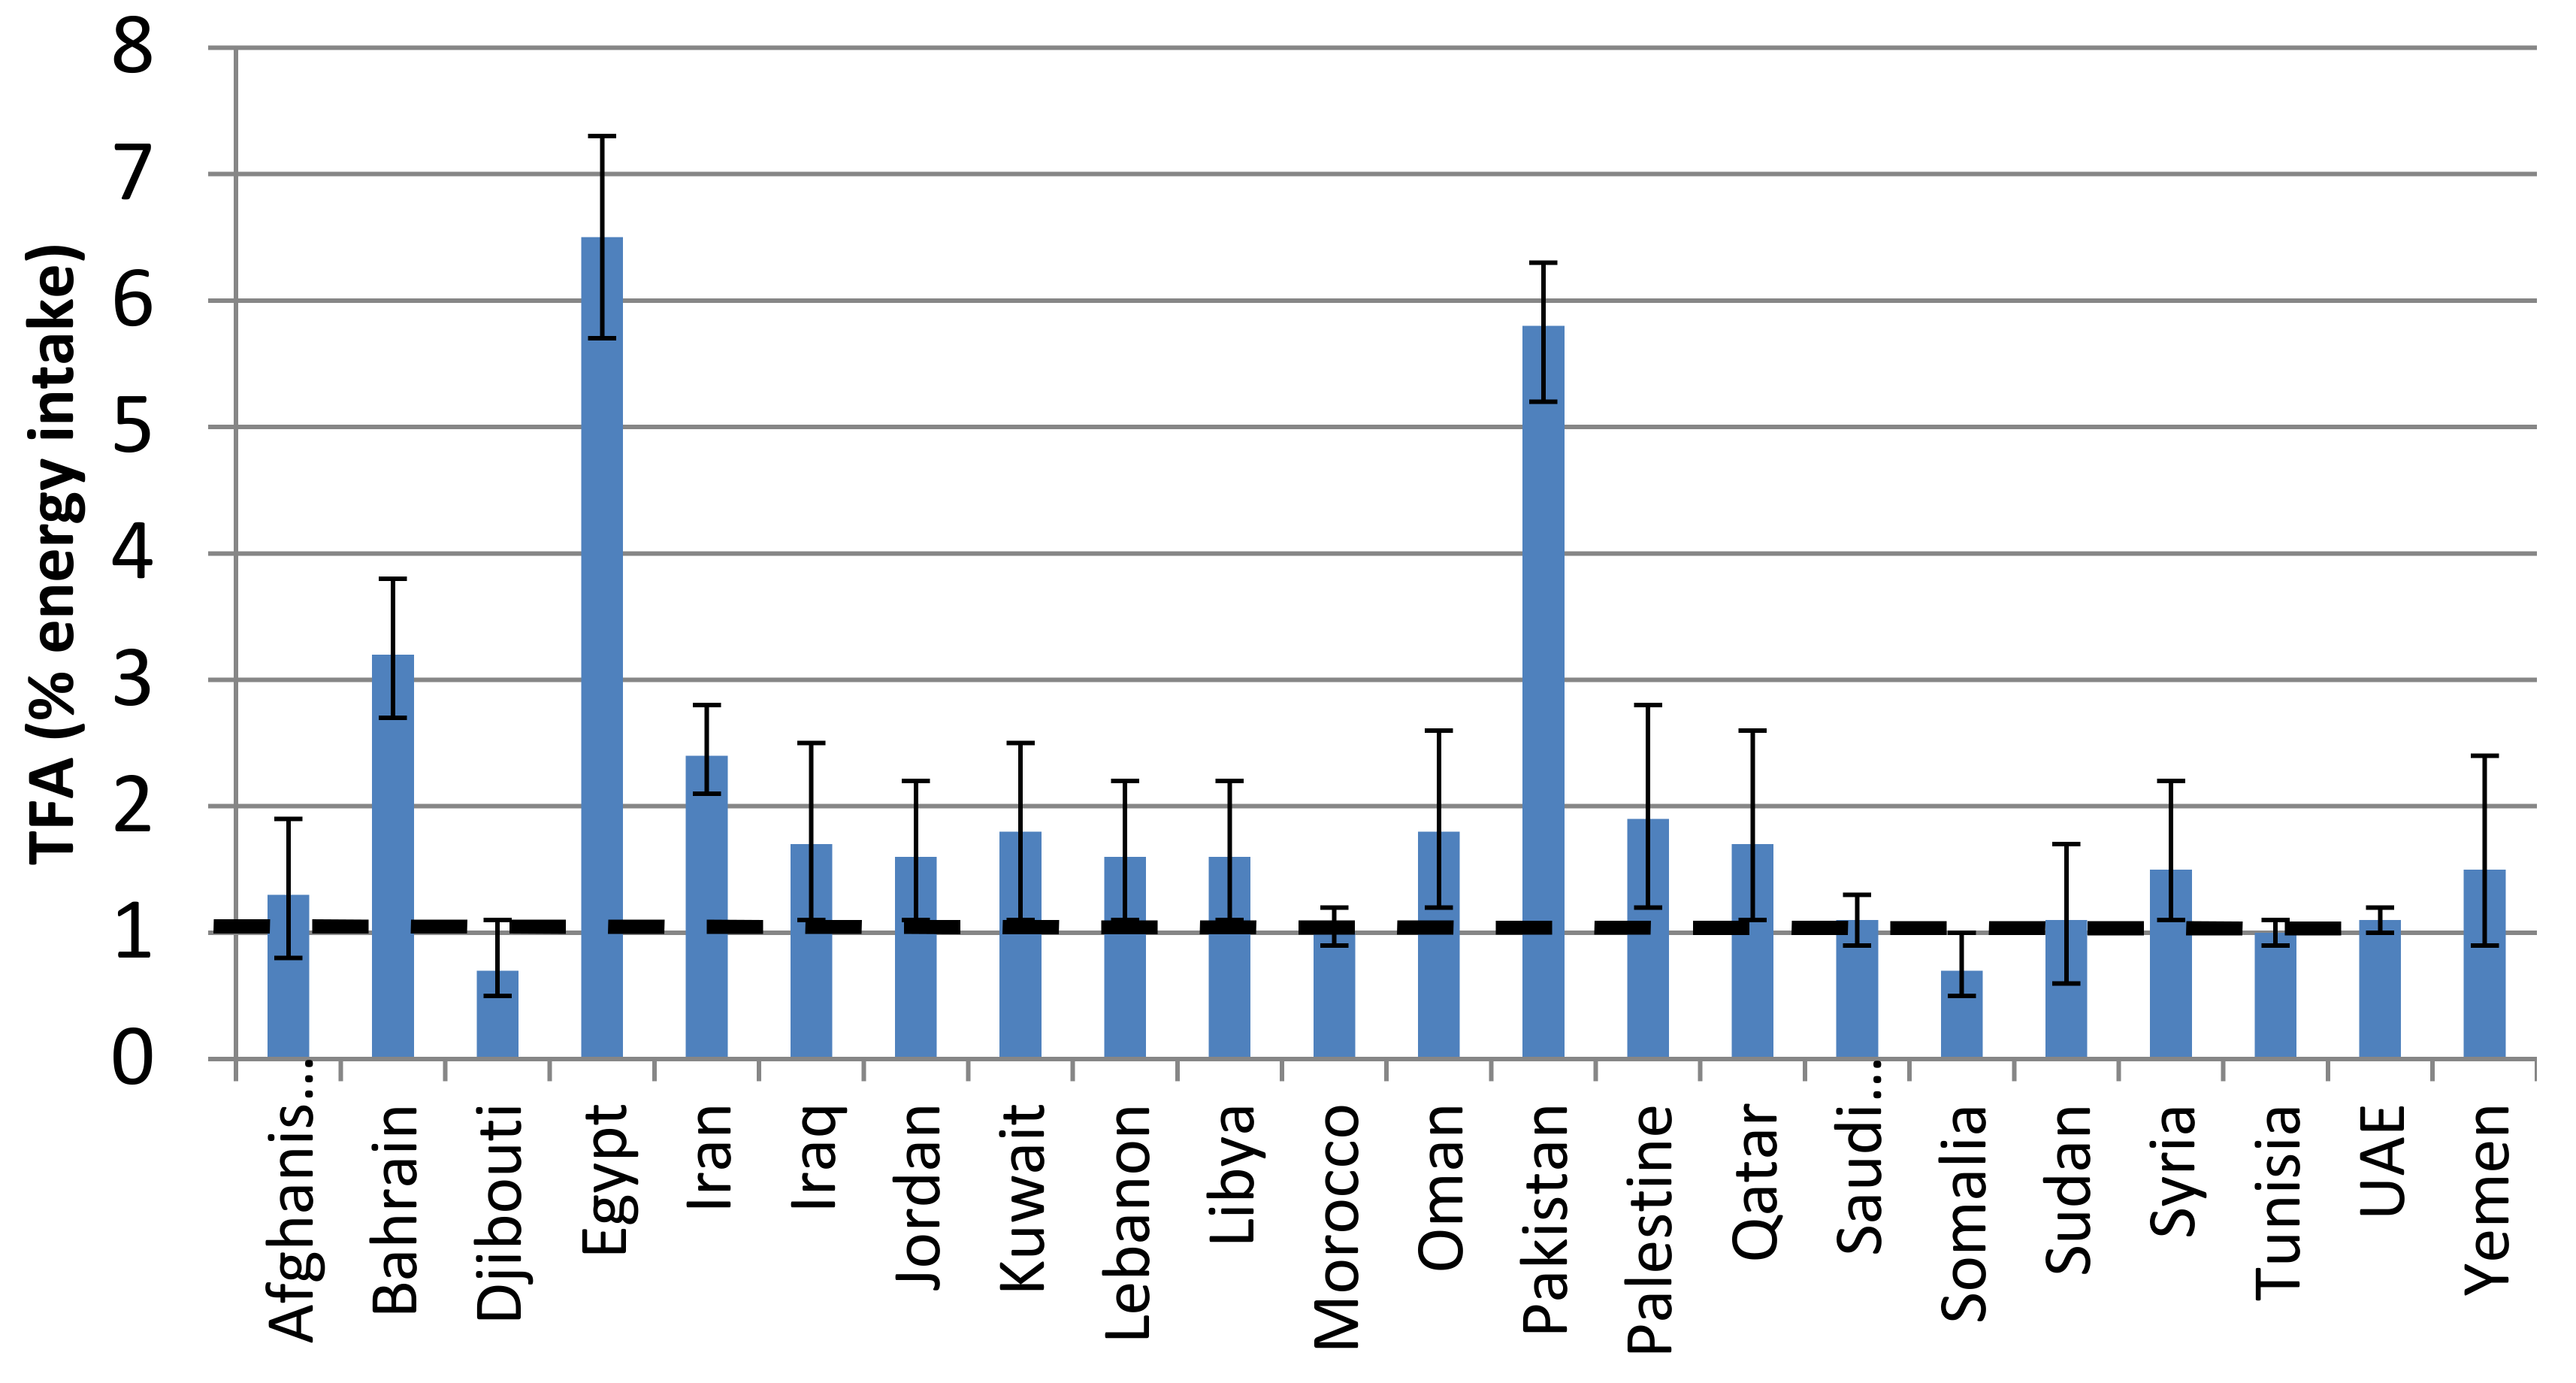
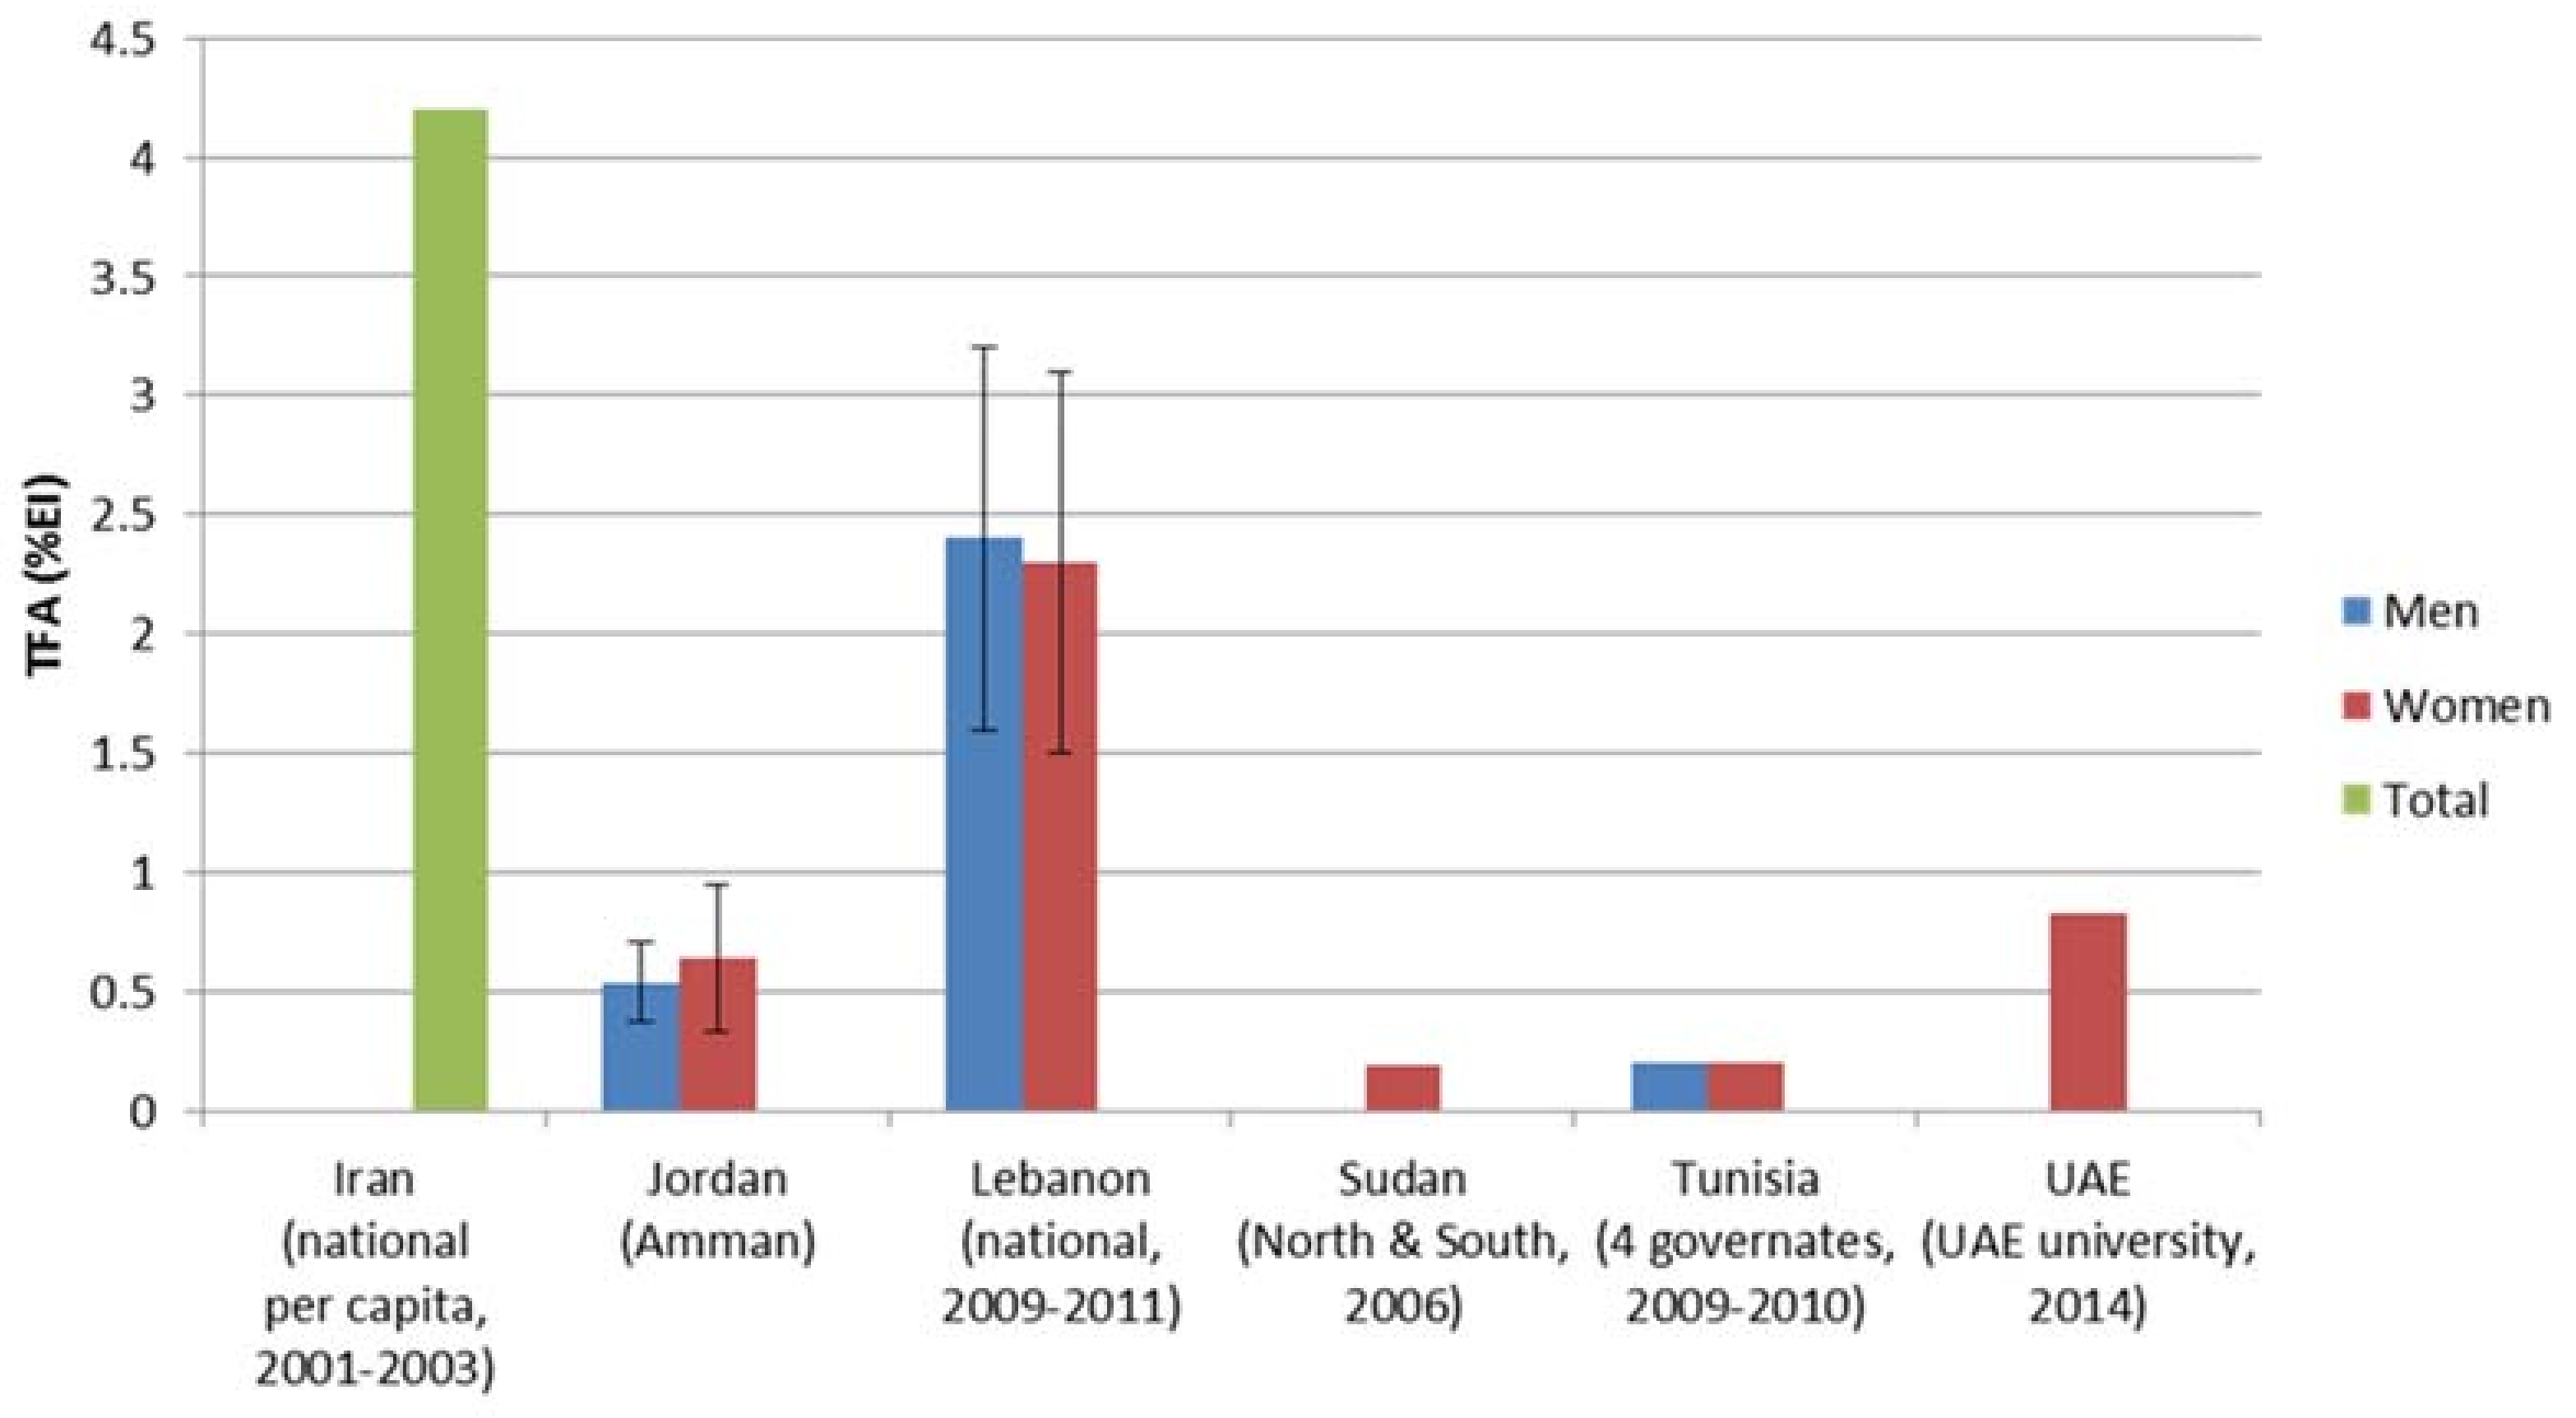
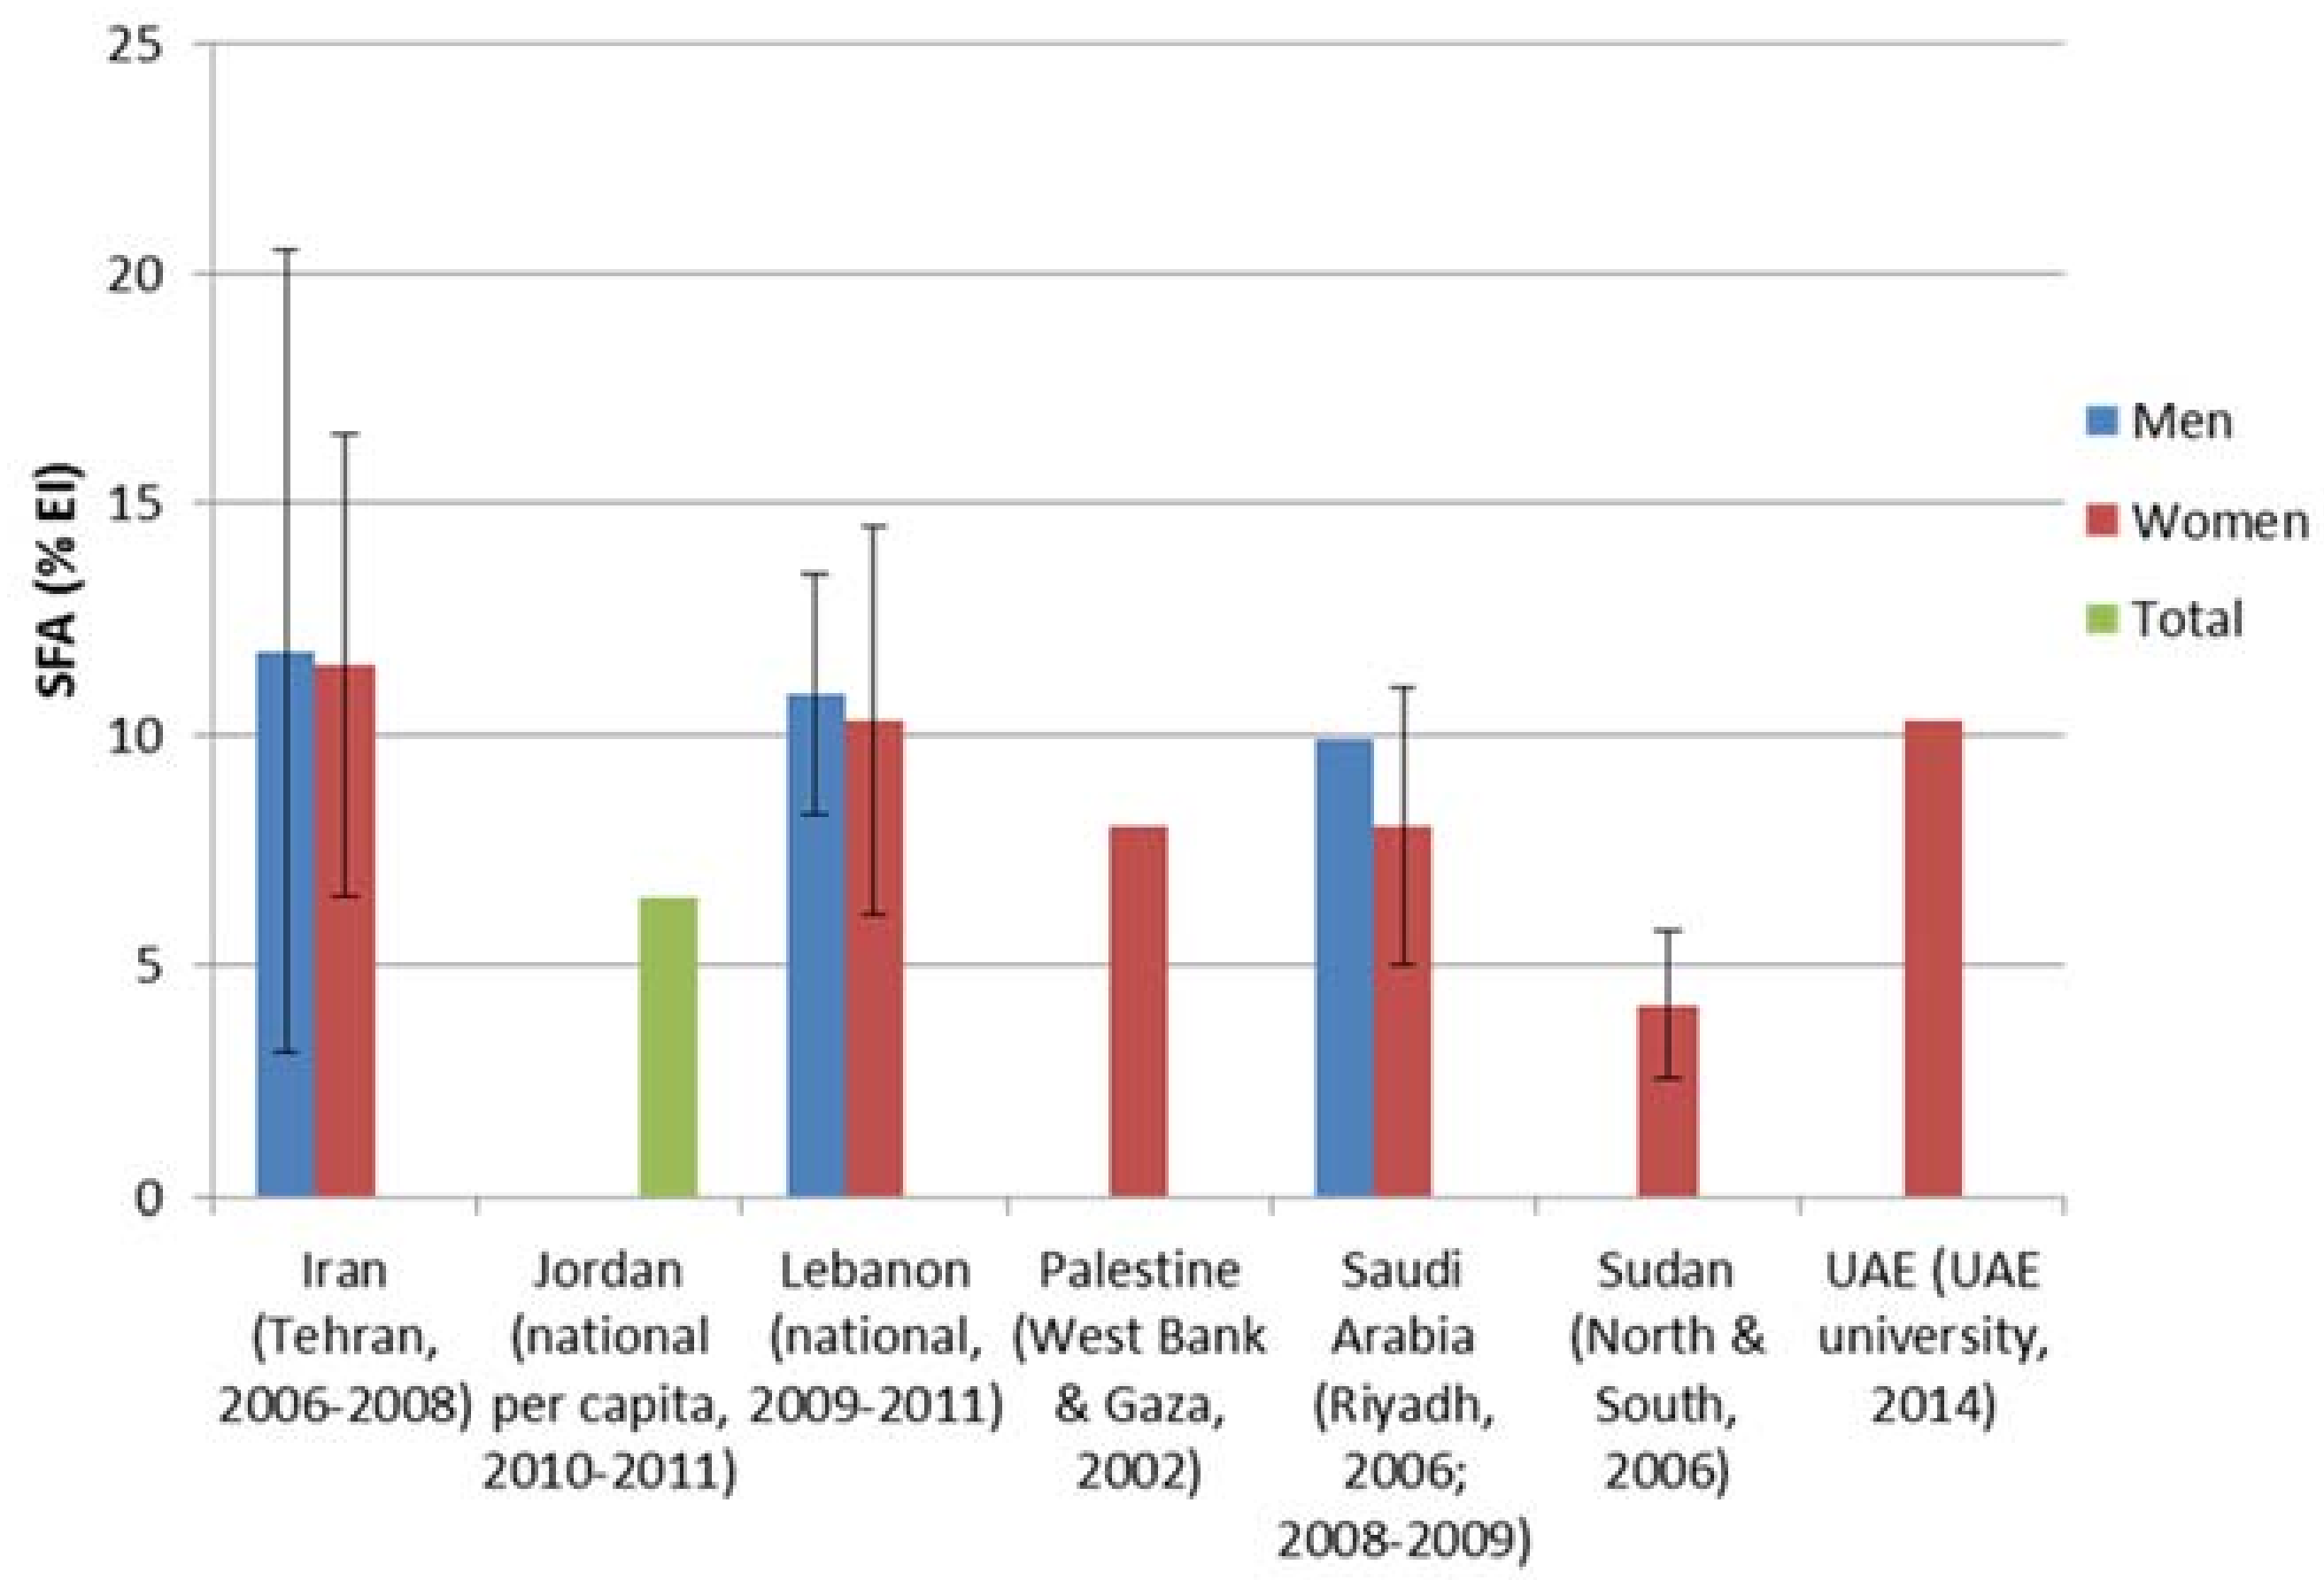
3.2. TFA and SFA Intake in the EMR
4. Sources of TFAs and SFAs in Commonly Consumed Foods in Countries of the Eastern Mediterranean Region
- (1)
- Margarines and biscuits: Pakistan had the highest TFAs content for both margarine (range: 2.2–34.8% of TF) [43] and biscuits (range: 9.3–34.9% of TF) [44], followed by Iran (margarine: 16.1% of TF; biscuits: range: 23.2–24.5% of TF) [45] and Morocco (margarine (range): 9.1–21.7% of TF) [46]. In Saudi-Arabia, three out of the four analyzed brands of margarine had TFAs content exceeding 2% of total fat (range: 0.2–8.3% of TF) [47], while in Tunisia, one out of the two analyzed margarine brands exceeded 2% (range: 1.4–9.8% of TF) [48]. For biscuits, one third of the samples analyzed in Lebanon exceeded 5% of TF (range: 0.2–19.5% of TF) [49] and one eighth of the analyzed samples in Jordan had TFAs content exceeding 5% of TF (range: 0.7–7.0% of TF) [50]. Elevated TFAs content was recorded in Tunisian classic margarine (9.8% of TF).
- (2)
- French fries: Pakistan had the highest TFAs content in food items such as French fries (range: 0.11–24.00% of TF) [51].
- (3)
- Cereal-based foods: Pakistan had the highest TFAs content in cereal-based foods (range: 2.5–16.3% of TF) [44].
- (4)
- Fast Food, snacks, milk and bakery products: TFA content was high in Iranian food products such as fast food (range: 23.6–30.7% of TF) [52], milk (range: 9.2–14.1% of TF), as well as bakery items (range: 4.5–36.1% of TF) [51]. Lebanon recorded an elevated content of TFAs in bakery products (4.91 ± 3.11%, range: 0.10–6.28% of TF) as well as snacks (8.85 ± 8.57%, range: 0.19–20.85% of TF) [49].
- (5)
- Pie and cake: reported high TFAs in Tunisia: pie (12.7% of TF), and cake (3.1% of TF) [53].
- (1)
- Margarine, mayonnaise and oils: few standards limiting SFAs in food items were found for the EMR in the literature. The one standard found was an upper limit of 30% for SFAs in edible oils in Iran (passed in November 2007) [45]. SFAs content in solid oils and liquid frying oils are on average 32.07% and 26.77% of total fat, respectively [45], indicating that not all edible oils are within the current standards. Other fat-based food items that have been analyzed for SFA content in Iran include animal butter (67.0%), margarine (42.4%) and mayonnaise (18.1–24.9%) [44,51,54]. Margarine fatty acid composition has also been assessed outside Iran, with margarine in Pakistan having the higher SFAs content (24.2–58.1%) [55,56] and Saudi Arabia having lower SFAs content (19.8–29.3%) [47] compared to Iran [44,54]. Moreover, dairy products, which are also major sources of SFAs in the diet, contain SFAs content of around 50% of total fat in Kuwait [57] and 52.8% to 78.5% of total fat in Iran [57,58]. Vulnerable groups are usually accessible to cheap oils such as Palm oil which have high levels of SFAs.
- (2)
- Traditional and fast food: Several studies have been conducted on the fatty acid content of commonly consumed fast foods and traditional foods. With respect to SFAs content in fast foods, Moroccan fast foods had a high contribution of SFAs to total fat (44.3%) [46]. Inversely, significantly lower SFAs were recorded for fast foods in Iran (21.5–38.4%) [52,59] and Bahrain (28.4%) [59,60]. Interestingly, when comparing local to Western fast foods in Bahrain, a similar SFA contribution to total fats was recorded (27.3% and 29.5%, respectively) [60,61]. A similar trend can be seen when comparing Moroccan fast foods to traditional foods where the average SFAs content is 44.3% and 43.1%, respectively. Among Moroccan traditional foods, red meat dishes were relatively high in SFA [46], while Kuwaiti traditional foods had a far lower SFAs contribution to total fat than was seen in Morocco. In Kuwaiti dishes, SFAs content varied per food group with fish dishes having a relatively high SFAs contribution to total fat (29.1%) and vegetable-based dishes had relatively low SFAs (14.6%) [57].
5. International Experience on Reducing TFA and SFA Intake and Lessons Learned
6. Regional Strategies to Reduce Fat (Total Fat, SFAs & TFAs) Intake at Population Levels
- (1)
- Reduce premature mortality from NCDs by 25%: The Political Declaration of the United Nations General Assembly on the Prevention and Control of Non-Communicable Diseases in September 2011 [68] prompted the WHO Regional Office for the Eastern Mediterranean to spearhead a salt and fat reduction initiative in the region. In May 2013, the World Health Assembly endorsed the WHO Global Action Plan for the Prevention and Control of NCDs 2013–2020. This Global Action Plan provides Member States, international partners and WHO with a road map and menu of policy options based on nine global NCDs targets, to be attained by 2025, including the number one target: to achieve a 25% relative reduction in premature mortality from NCDs by 2025. The 59th session of the WHO Regional Committee for the Eastern Mediterranean (2012) adopted the resolution EM/RC59/R.2, thus endorsing the regional Framework for Action on the commitments of Member States to implement the United Nations Political Declaration on Non-Communicable Diseases [1]. In its EM/RC59/R.2 resolution, the WHO EMRO urged the Member States to implement the core set of interventions in the regional Framework for Action, with these interventions including the reduction of the population’s salt intake levels and the replacement of trans fat with polyunsaturated fat [69,70,71].
- (2)
- Halt diabetes and obesity: WHO EMRO is working closely with governments to achieve the seventh global target of the Global strategy on diet, physical activity and health that aims to halt the rise in diabetes and obesity [5]. “Proposed policy priorities for preventing obesity and diabetes in the Eastern Mediterranean Region also published in 2017” is a recent publication by WHO EMRO which includes a set of evidence-based population-level recommendation for Member States to implement in order to prevent obesity and diabetes [71]. A policy statement and action plan on the reduction of fat intake and the lowering of heart attack rates in the Eastern Mediterranean region was also issued on 2013 by WHO EMRO [72]. The policy goals are to:
- eliminate all industrially produced trans fats from the food supply; and
- reduce markedly the saturated fat content of the food supply.
7. Examples of Action Taken by Countries of EMR
- (1)
- The Gulf Cooperation Council (GCC): Standardization Organization: The Gulf Standardization office (GSO) provides standards for food policy in 7 Member States (Bahrain, Kuwait, Oman, Qatar, Saudi Arabia, United Arab Emirates and Yemen). This includes mandatory nutritional labelling of fat (total fat, TFAs, SFAs, PUFA, MUFA) as g/100 g and % daily value (DV) [73]. Progress is also being made towards the reduction of dietary TFAs through a project by the GSO (2013) which aims at limiting the maximum level of TFA for hydrogenated oils and spreadable vegetarian margarine to 2% of total fat and the maximum level for all other foods containing TFA to 5% of total fat [5]. Enforced implementation is still a challenge and not effective yet.
- (2)
- Iran: executive committee, composed of members from the Ministry of Health and Medical Education, Ministry of Industry, Ministry of Agriculture, Ministry of Commerce and the National Standard Organization, was established in 2004 to develop an operational plan for reducing SFAs and TFAs in edible oils in Iran. In 2005, the Ministry of Commerce was obliged to gradually replace the hydrogenated oils as the subsidized ones, by non-hydrogenated (especially olive oil) and liquid frying oils [74]. In 2008, the Ministry of Health and Medical Education and National Standard Organization were obliged to revise the instructions of packaging and mandate manufacturers and importers to affix labels to all food products, especially edible oils. Also, in 2008, the National Standard Organization was mandated to revise standard NO.9131, so that SFAs and TFAs contents of edible oils (both imported and locally produced ones) are limited to 25% and 5%, respectively. As of 2011, Ministry of Health and Medical Education, Industry, Agriculture, Commerce and National Standard Organization developed a national policy for edible oil safety. In 2014, the High Council of Health and Food Security approved to revise the standards of TFAs to less than 2% and saturated fatty acid to less than 25%. In order to reduce saturated fatty acid, the Ministry of Trade was asked to reduce the amount of palm oil import, so in 2014, palm oil import was reduced from 70% to 30%. As a result of these legislations, both palm oil imports and TFAs content in edible oil has been significantly reduced (information provided by nutrition focal point) [74,75].
- (3)
- Iraq: Subsidy on palm oil and hydrogenated ghee removed and replaced by other types of oil.
- (4)
- Jordan: banning the addition of vegetable oils to dairy products including palm oil through national food standards.
- (5)
- Tunisia: In 2015, one manufacturer has just launched a kind of margarine without trans fat after adapting new food processing technology.
- (6)
- Morocco: a draft resolution prepared and submitted to the parliament. However, the advocacy group from Ministry of Health (MOH) and academia are active and contributed to increasing the awareness of the population, they have succeeded in bringing attention of the industry to cut fat on a voluntary basis in dairy products, but this is still premature.
8. Data Quality and Availability
9. Discussion
10. Conclusions and Recommendations
- (1)
- Strengthening of political commitment: countries of the region are encouraged to strengthen the political commitment to the reduction of TFAs and SFAs intakes as one of the most cost-effective strategies to hamper the growth of obesity and NCDs that are plaguing the economies of countries of the region. This can be achieved by organizing politician briefings as well as regular one-to-one meetings with relevant governmental officials.
- (2)
- Fiscal measures: progressively eliminate national subsidies for all types of fats/oils and introduce an effective tax on high-fat and/or high-sugar foods.
- (3)
- Publicly funded food: procurement and provision of healthy food in public institutions, such as government canteens, hospitals, universities, schools and kindergartens through setting mandatory nutrition standards. All countries are recommended to:
- Implement mandatory nutrition standards across all public institutions, through (a) application of the Regional nutrient profile model (b) introduction of meal standards, and (c) measures to eliminate the sale of foods or drinks high in fat, sugar or salt.
- Issue mandatory guidelines for the revision of procurement to provide healthy food, including limiting the volume of fats/oils in public-sector catering facilities in order to facilitate the necessary and properly documented menu changes.
- Provide guidance and training on appropriate catering methods to limit the use of frying foods and help design menu changes.
- (4)
- Food supply and trade: regulate all food produced locally or imported by setting benchmarks on the recommended levels of TFAs and SFAs, as well as limiting the imports of palm oil or using it in the food industry or processing. Marketing: Implement the WHO Set of Recommendations on Marketing of Foods and Non-alcoholic Beverages to Children and consider mandatory restrictions to eliminate all forms of marketing of foods high in fat, sugar and salt to children and adolescents (up to age 18) across all media, according to the Regional Action Plan to Address Unopposed Marketing of Unhealthy Food and Beverages.
- (5)
- Support research for assessing SFAs/TFAs intake and contents in foods: It is recommended that data from the region be enhanced by additional investigations conducted in individual Member States, particularly in countries where a lack of data is still noticeable.
- (6)
- Implementation of appropriate restrictions on marketing of unhealthy food to children: including diet high in TFA and SFA, low in salt and sugar.
- (7)
- Standardization of regional food composition tables: it is recommended to mark standardized Food Composition Tables with more focus on traditional diets and reflecting the content of TFAs and SFAs in the foods through expanding the regional initiative led by WHO, and other International organization.
- (8)
- Product Reformulation: Member States should strive to collaborate with food producers (industry, catering companies, restaurants) for the reformulation of processed and catered foods with the aim of decreasing total fat, TFAs and SFAs content of processed foods.
- (9)
- Food Labelling: implement a mandatory front-of-pack labelling scheme with elements to enable consumers to interpret information easily (such as colour coding or the use of terms such as “high”, “medium”, “low”).
- (10)
- Raising consumer awareness: a continuum of activities aiming to raise fat-related consumer awareness should be planned at the national level rather than engaging in sporadic and intermittent awareness activities. Success in raising consumer awareness may require a partnership between Non-Government Organization (NGOs), industry, media, the health sector and national platforms. Member states are encouraged to participate and develop campaigns with clear objectives and messages, and to develop campaign-related materials such as educational pamphlets, posters and websites.
- (11)
- Social support: Review government safety-net and social support policies to include healthy foods (e.g., subsidies for the poor allowing purchase of foods with only modest amounts of total fat and low saturated fat content).
- (12)
- Monitoring and evaluation: Those countries that have baseline data on actual TFAs and SFAs intakes and their levels in foods, and that have launched fat reduction initiatives are encouraged to embrace monitoring approaches.
Author Contributions
Funding
Acknowledgments
Conflicts of Interest
References
- World Health Organization. Global Status Report on Noncommunicable Diseases 2014; World Health Organization: Geneva, Switzerland, 2014; Available online: http://apps.who.int/iris/handle/10665/148114 (accessed on 18 January 2018).
- World Health Organization; Regional Office for the Eastern Mediterranean (EMRO). Eastern Mediterranean Region Framework for Health Information Systems and Core Indicators for Monitoring Health Situation and Health System Performance. 2017. Available online: http://applications.emro.who.int/docs/EMROPUB_2017_EN_16766.pdf?ua=1 (accessed on 15 January 2018).
- GBD 2016 Causes of Death Collaborators. Global, regional, and national age-sex specific mortality for 264 causes of death, 1980–2016: A systematic analysis for the Global Burden of Disease Study 2016. Lancet 2017, 390, 1151–1210. [Google Scholar]
- World Health Organization Regional; Office for the Eastern Mediterranean (EMRO). Health Systems Strengthening in Countries of the Eastern Mediterranean Region: Challenges, Priorities and Options for Future Action; EMRO: Cairo, Egypt, 2012; Available online: http://apps.who.int/iris/handle/10665/123147 (accessed on 1 April 2018).
- Alwan, A.; McColl, K.; James, J.P.; Al-Jawaldeh, A. Proposed Policy Priorities for Preventing Obesity and Diabetes in the Eastern Mediterranean Region; EMRO: Cairo, Egypt, 2017; Available online: http://www.who.int/iris/handle/10665/259519 (accessed on 10 March 2018).
- World Health Organization. Global Observatory (GHO) Data. Available online: http://www.who.int/gho/en/ (accessed on 10 May 2018).
- World Health Organization, Global Health Observatory Data Repository. Raised Total Cholesterol (≥5.0 mmol/L): Data by Country. Available online: http://apps.who.int/gho/data/view.main.2467 (accessed on 10 March 2018).
- Lichtenstein, A.H. Dietary trans fatty acids and cardiovascular disease risk: Past and present. Curr. Atheroscler. Rep. 2014, 16, 433. [Google Scholar] [CrossRef] [PubMed]
- Mozaffarian, D.; Clarke, R. Quantitative effects on cardiovascular risk factors and coronary heart disease risk of replacing partially hydrogenated vegetable oils with other fats and oils. Eur. J. Clin. Nutr. 2009, 63, S22. [Google Scholar] [CrossRef] [PubMed]
- Sun, Q.; Ma, J.; Campos, H.; Hankinson, S.E.; Manson, J.E.; Stampfer, M.J.; Rexrode, K.M.; Willett, W.C.; Hu, F.B. A prospective study of trans fatty acids in erythrocytes and risk of coronary heart disease. Circulation 2007, 115, 1858–1865. [Google Scholar] [CrossRef] [PubMed]
- World Health Organization. Diet, Nutrition and the Prevention of Chronic Diseases: Report of a Joint WHO/FAO Expert Consultation; World Health Organization: Geneva, Switzerland, 2003; Available online: http://whqlibdoc.who.int/trs/WHO_TRS_916.pdf (accessed on 1 February 2018).
- Wang, Q.; Afshin, A.; Yakoob, M.Y.; Singh, G.M.; Rehm, C.D.; Khatibzadeh, S. Impact of nonoptimal intakes of saturated, polyunsaturated, and trans fat on global burdens of coronary heart disease. J. Am. Heart Assoc. 2016, 5, e002891. [Google Scholar] [CrossRef] [PubMed]
- Welty, F.K. How do elevated triglycerides and low HDL-cholesterol affect inflammation and atherothrombosis? Curr. Cardiol. Rep. 2013, 15, 400. [Google Scholar] [CrossRef] [PubMed]
- Bhardwaj, S.; Passi, S.J.; Misra, A. Overview of trans fatty acids: Biochemistry and health effects. Diabetes Metab. Syndr. 2011, 5, 161–164. [Google Scholar] [CrossRef] [PubMed]
- Farvid, M.S.; Ding, M.; Pan, A.; Sun, Q.; Chiuve, S.E.; Steffen, L.M.; Willett, W.C.; Hu, F.B. Dietary linoleic acid and risk of coronary heart disease: A systematic review and meta-analysis of prospective cohort studies. Circulation 2014, 130, 1568–1578. [Google Scholar] [CrossRef] [PubMed]
- Melanson, E.L.; Astrup, A.; Donahoo, W.T. The relationship between dietary fat and fatty acid intake and body weight, diabetes, and the metabolic syndrome. Ann. Nutr. Metab. 2009, 55, 229–243. [Google Scholar] [CrossRef] [PubMed]
- Micha, R.; Mozaffarian, D. Saturated fat and cardiometabolic risk factors, coronary heart disease, stroke, and diabetes: A fresh look at the evidence. Lipids 2010, 45, 893–905. [Google Scholar] [CrossRef] [PubMed] [Green Version]
- Chowdhury, R.; Warnakula, S.; Kunutsor, S.; Crowe, F.; Ward, H.A.; Johnson, L.; Franco, O.H.; Butterworth, A.S.; Forouhi, N.G.; Thompson, S.G.; et al. Association of dietary, circulating, and supplement fatty acids with coronary risk: A systematic review and meta-analysis. Ann. Intern. Med. 2014, 160, 398–406. [Google Scholar] [CrossRef] [PubMed]
- Dashti, B.; Al-Awadi, F.; Sawaya, W.; Al-Otaibi, J.; Al-Sayegh, A. Fatty acid profile and cholesterol content of 32 selected dishes in the state of Kuwait. Food Chem. 2003, 80, 377–386. [Google Scholar] [CrossRef]
- Anzid, K.; Baali, A.; Vimard, P.; Levy-Desroches, S.; Cherkaoui, M.; López, P.M. Inadequacy of vitamins and minerals among high-school pupils in Ouarzazate, Morocco. Public Health Nutr. 2014, 17, 1796–1795. [Google Scholar] [CrossRef] [PubMed]
- Smit, L.A.; Mozaffarian, D.; Willett, W. Review of fat and fatty acid requirements and criteria for developing dietary guidelines. Ann. Nutr. Metab. 2009, 55, 44–55. [Google Scholar] [CrossRef] [PubMed]
- World Health Organization. Global Health Risks: Mortality and Burden of Disease Attributable to Selected Major Risks; World Health Organization: Geneva, Switzerland, 2009. [Google Scholar]
- Jakicic, J.M.; Ard, J.D.; de Jesus, J.M.; Houston Miller, N.; Hubbard, V.S.; Lee, I.M.; Lichtenstein, A.H.; Loria, C.M.; Millen, B.E.; Nonas, C.A.; et al. AHA/ACC Guideline on Lifestyle Management to Reduce Cardiovascular Risk. Circulation 2013, 129, S76–S99. [Google Scholar]
- Mozaffarian, D.; Katan, M.B.; Ascherio, A.; Stampfer, M.J.; Willett, W.C. Trans fatty acids and cardiovascular disease. N. Engl. J. Med. 2006, 354, 1601–1613. [Google Scholar] [CrossRef] [PubMed]
- Stachowska, E.; Dołegowska, B.; Olszewska, M.; Gutowska, I.; Chlubek, D. Isomers of trans fatty acids modify the activity of platelet 12-P lipoxygenase and cyclooxygenase/thromboxane synthase. Nutrition 2004, 20, 570–571. [Google Scholar] [CrossRef] [PubMed]
- Bray, G.A.; Lovejoy, J.C.; Smith, S.R.; DeLany, J.P.; Lefevre, M.; Hwang, D.; Ryan, D.H.; York, D.A. The influence of different fats and fatty acids on obesity, insulin resistance and inflammation. J. Nutr. 2002, 132, 2488–2491. [Google Scholar] [CrossRef] [PubMed]
- Risérus, U.; Willett, W.C.; Hu, F.B. Dietary fats and prevention of type 2 diabetes. Prog. Lipid Res. 2009, 48, 44–51. [Google Scholar] [CrossRef] [PubMed] [Green Version]
- Salmeron, J.; Hu, F.B.; Manson, J.E.; Stampfer, M.J.; Colditz, G.A.; Rimm, E.B.; Willett, W.C. Dietary fat intake and risk of type 2 diabetes in women. Am. J. Clin. Nutr. 2001, 73, 1019–1026. [Google Scholar] [CrossRef] [PubMed] [Green Version]
- Kavanagh, K.; Jones, K.L.; Sawyer, J.; Kelley, K.; Carr, J.J.; Wagner, J.D.; Rudel, L.L. Trans fat diet induces abdominal obesity and changes in insulin sensitivity in monkeys. Obesity 2007, 15, 1675–1684. [Google Scholar] [CrossRef] [PubMed]
- Simopoulos, A.P. The importance of the omega-6/omega-3 fatty acid ratio in cardiovascular disease and other chronic diseases. Exp. Biol. Med. 2008, 233, 674–688. [Google Scholar] [CrossRef] [PubMed]
- Innis, S.M. Trans fatty intakes during pregnancy, infancy and early childhood. Atheroscler. Suppl. 2006, 7, 17–20. [Google Scholar] [CrossRef] [PubMed]
- FAO/WHO. Interim Summary of Conclusions and Dietary Recommendations on Total Fat and Fatty Acids. Joint FAO/WHO Expert Consultation on Fats and Fatty Acids in Human Nutrition. 2010. Available online: http://www.who.int/nutrition/topics/FFA_summary_rec_conclusion.pdf (accessed on 12 March 2017).
- Siri-Tarino, P.W.; Sun, Q.; Hu, F.B.; Krauss, R.M. Meta-analysis of prospective cohort studies evaluating the association of saturated fat with cardiovascular disease. Am. J. Clin. Nutr. 2010, 91, 535–546. [Google Scholar] [CrossRef] [PubMed] [Green Version]
- WHO Regional Office for Europe Nutrient Profile Model. Copenhagen: World Health Organization Regional Office for Europe. 2015. Available online: http://www.euro.who.int/__data/assets/pdf_file/0005/270716/Nutrient-children_web-new.pdf (accessed on 30 March 2018).
- Ascherio, A.; Hennekens, C.H.; Buring, J.E.; Master, C.; Stampfer, M.J.; Willett, W.C. Trans-fatty acids intake and risk of myocardial infarction. Circulation 1994, 89, 94–101. [Google Scholar] [CrossRef] [PubMed]
- Willett, W.C.; Stampfer, M.J.; Manson, J.E.; Colditz, G.A.; Speizer, F.E.; Rosner, B.A.; Sampson, L.A.; Hennekens, C.H. Intake of trans fatty acids and risk of coronary heart disease among women. Lancet 1993, 341, 581–585. [Google Scholar] [CrossRef]
- Kandhro, A.; Sherazi, S.T.; Mahesar, S.A.; Bhanger, M.I.; Talpur, M.Y.; Rauf, A. GC-MS quantification of fatty acid profile including trans FA in the locally manufactured margarines of Pakistan. Food Chem. 2008, 109, 207–211. [Google Scholar] [CrossRef] [PubMed]
- World Health Organization. The Political Declaration of the United Nations General Assembly on the Prevention and Control of Non-Communicable Diseases: Commitments of Member States and the Way Forward. 2012 EM/RC59/R.2. Available online: http://applications.emro.who.int/docs/RC_Resolutions_20122_14692_EN.pdf?ua=1 (accessed on 1 March 2017).
- World Health Organization. Implementing the United Nations Political Declaration on Prevention and Control of Noncommunicable Diseases Based on the Regional Framework for Action. Regional Committee for the Eastern Mediterranean Sixtieth Session Provisional Agenda Item 7. EM/RC60/9 Rev.1 September 2013. Available online: http://applications.emro.who.int/docs/RC_Techn_paper_2013_9_15001_EN.pdf (accessed on 1 April 2018).
- Food and Agriculture Organization (FAOSTAT). Supply Utilization Accounts and Food Balances Domain: Food Balance Sheets. 2014. Available online: http://faostat3.fao.org/download/FB/FBS/E (accessed on 10 April 2017).
- Food and Agriculture Organization of the United Nations. Food and Nutrition in Numbers 2014. 2014. Available online: http://coin.fao.org/coin-static/cms/media/22/14163487981020/food_and_nutrition_in_numbers.pdf (accessed on 10 March 2017).
- Micha, R.; Khatibzadeh, S.; Shi, P. Global, regional, and national consumption levels of dietary fats and oils in 1990 and 2010: A systematic analysis including 266 country-specific nutrition surveys. BMJ 2014, 348. [Google Scholar] [CrossRef] [PubMed] [Green Version]
- Kandhro, A.; Sherazi, S.T.; Mahesar, S.A.; Bhanger, M.I.; Talpur, M.Y.; Arain, S. Monitoring of fat content, free fatty acid and fatty acid profile including trans fat in Pakistani biscuits. J. Am. Oil Chem. Soc. 2008, 85, 1057–1061. [Google Scholar] [CrossRef]
- Mahesar, S.; Kandhro, A.A. Determination of total trans fat content in Pakistani cereal-based foods by SB-HATR FT-IR spectroscopy coupled with partial least square regression. Food Chem. 2010, 123, 1289–1293. [Google Scholar] [CrossRef]
- Hajimahmoodi, M.; Arami, S.; Nosrati, M. Trans Fatty Acid Content of Iranian Edible Oils. Food Nutr. Sci. 2013, 4, 1167–1174. [Google Scholar] [CrossRef]
- Ministry of Health. Unpublished Report on the Fat Profile for Food Products; Ministry of Health: Rabat, Morocco, 2015. [Google Scholar]
- Bakeet, Z.A.N.; Alobeidallah, F.M.; Arzoo, S. Fatty acid composition with special emphasis on unsaturated trans fatty acid content in margarines and shortenings marketed in Saudi Arabia. Int. J. Biosci. 2013, 3, 86–93. [Google Scholar]
- National Nutrition Institutes. Unpublished Report Data on Food Consumption Pattern; National Nutrition Institutes: Tunis, Tunisia, 2015. [Google Scholar]
- Nasreddine, L.; Naja, F.A.; Sibai, A.M.; Helou, K.; Adra, N.; Hwalla, N. Trends in nutritional intakes and nutrition-related cardiovascular disease risk factors in Lebanon: The need for immediate action. Leban. Med. J. 2013, 62, 83–91. [Google Scholar] [CrossRef]
- Mashal, R. Variability in trans fatty acid content of selected local and imported foods in Jordan. Riv. Ital. Delle Sostanze Grasse 2011, 89, 193–200. [Google Scholar]
- Karim, Z.; Khan, K.M.; Ahmed, S.; Karim, A. Assessment of Trans Fatty Acid Level in French Fries from Various Fast Food Outlets in Karachi, Pakistan. J. Am. Oil Chem. Soc. 2014, 91, 1831–1836. [Google Scholar] [CrossRef]
- Nazari, B.; Asgary, S.; Azadbakht, L. Fatty acid analysis of Iranian junk food, dairy, and bakery products: Special attention to trans-fats. J. Res. Med. Sci. 2012, 17, 952–957. [Google Scholar] [PubMed]
- National Institute of Nutrition Food and Technology Food. Tunisian Food Composition Table of the Tunisian, 7th ed.; National Institute of Nutrition Food and Technology Food: Tunis, Tunisia, 1994. [Google Scholar]
- Takruri, H.R.; Alkurd, R.A. Intakes of Fats, Cholesterol, Fiber and Micronutrients as Risk Factors for Cardiovascular Disease in Jordan. Jordan J. Biol. Sci. 2014, 7, 119–126. [Google Scholar] [CrossRef]
- Nazari, B.; Asgary, S.; Sarrafzadegan, N. Warning about Fatty Acid Compositions in Some Iranian Mayonnaise Salad Dressings. Int. J. Prev. Med. 2010, 1, 110–114. [Google Scholar] [PubMed]
- Rifat-uz-Zaman, Z.I.; Ali, U. Dietary Intakes of Urban Adolescents of Sialkot, Pakistan Do Not Meet the Standards of Adequacy. Pak. J. Nutr. 2013, 12, 460–467. [Google Scholar] [CrossRef]
- Zaghloul, S.; Al-Hooti, S.N.; Al-Hamad, N.; Al-Zenki, S.; Alomirah, H.; Alayan, I.; Al-Attar, H.; Al-Othman, A.; Al-Shami, E.; Al-Somaie, M.; et al. Evidence for nutrition transition in Kuwait: Over-consumption of macronutrients and obesity. Public Health Nutr. 2013, 16, 596–607. [Google Scholar] [CrossRef] [PubMed]
- Bahadoran, Z.; Mirmiran, P.; Golzarand, M.; Hosseini-Esfahani, F.; Azizi, F. Fast food consumption in Iranian adults; dietary intake and cardiovascular risk factors: Tehran Lipid and Glucose Study. Arch. Iran. Med. 2012, 15, 346–351. [Google Scholar] [PubMed]
- Asgary, S.; Nazari, B.; Sarrafzadegan, N.; Parkhideh, S.; Saberi, S.; Esmaillzadeh, A.; Azadbakht, L. Evaluation of fatty acid content of some Iranian fast foods with emphasis on trans fatty acids. Asia Pac. J. Clin. Nutr. 2009, 18, 187–189. [Google Scholar] [PubMed]
- Gharib, N.; Rasheed, P. Energy and macronutrient intake and dietary pattern among school children in Bahrain: A cross-sectional study. Nutr. J. 2011, 10, 62. [Google Scholar] [CrossRef] [PubMed]
- Gharib, N.M.; Rasheed, P. Obesity among Bahraini Children and Adolescents: Prevalence and Associated Factors. J. Bahrain Med. Soc. 2013, 20, 401–407. [Google Scholar]
- Oomen, C.M.; Ocké, M.C.; Feskens, E.J.; van Erp-Baart, M.A.; Kok, F.J.; Kromhout, D. Association between trans fatty acid intake and 10-year risk of coronary heart disease in the Zutphen Elderly Study: A prospective population-based study. Lancet 2001, 357, 746–751. [Google Scholar] [CrossRef]
- Pirjo, P.; Vartiainen, E.; Seppänen, R.; Aro, A.; Puska, P. Changes in Diet in Finland from 1972 to 1992: Impact on Coronary Heart Disease Risk. Prev. Med. 1996, 25, 243–250. [Google Scholar]
- World Health Organization. WHO Regional Office for Europe. Eliminating Trans Fats in Europe: A Policy Brief. 2015. Available online: http://www.euro.who.int/__data/assets/pdf_file/0010/288442/Eliminating-trans-fats-in-Europe-A-policy-brief.pdf (accessed on 10 April 2017).
- Danish Academy of Technical Sciences, ATV. Economic Nutrition Policy Tools—Useful in the Challenge to Combat Obesity and Poor Nutrition? December 2007. Available online: https://atv.dk/sites/atv.dk/files/media/document/Rapport_ATV_Economic_nutrition_policy_tools_December_2007.pdf (accessed on 1 May 2018).
- Jakobsen, M.U.; O’Reilly, E.J.; Heitmann, B.L.; Pereira, M.A.; Balter, K.; Fraser, G.E. Major types of dietary fat and risk of coronary heart disease: A pooled analysis of 11 cohort studies. Am. J. Clin. Nutr. 2009, 89, 1425–1432. [Google Scholar] [CrossRef] [PubMed]
- Tutino, V.; Caruso, M.G.; De Leonardis, G.; De Nunzio, V.; Notarnicola, M. Tissue Fatty Acid Profile is Differently Modulated from Olive Oil and Omega-3 Polyunsaturated Fatty Acids in ApcMin/+ Mice. Endocr. Metab. Immune Disord.-Drug Targets 2017, 17, 303–308. [Google Scholar] [CrossRef] [PubMed]
- General Assembly of the United Nations. Political Declaration of the High-Level Meeting of the General Assembly on the Prevention and Control of Non-Communicable Diseases; United Nations: New York, NY, USA, 2011. [Google Scholar]
- Krenosky, S.; Mary, L.; Nora, L.; Lynne, U.; Michel, V. Risk Assessment of Exposure to Trans Fat in Canada. Int. Food Risk Anal. J. 2012, 2, 1–15. [Google Scholar] [CrossRef]
- World Health Organization. A Review of Nutrition Policies: Draft Report; World Health Organization: Geneva, Switzerland, 2010; Available online: http://www.who.int/nutrition/EB128_18_Backgroundpaper1_A_review_of_nutritionpolicies.pdf (accessed on 6 May 2013).
- WHO Regional Office for the Eastern Mediterranean (EMRO). Assessing National Capacity for the Prevention and Control of Noncommunicable Diseases; EMRO: Cairo, Egypt, 2016; Available online: http://apps.who.int/iris/bitstream/1/250370/10665/EMROPUB_2016_EN_19168.pdf (accessed on 1 April 2018).
- World Health Organization. Report on the Technical Consultation on Salt and Fat Reduction Strategies in the Eastern Mediterranean Region; World Health Organization: Tunis, Tunisia, 30–31 March 2015; Available online: http://applications.emro.who.int/docs/IC_Meet_Rep_2015_EN_16339.pdf (accessed on 1 March 2018).
- GCC Standardization Organization. Trans Fatty Acids GSO 2483. 2015. Available online: https://www.gso.org.sa/store/gso/standards/GSO:693058/GSO%202483:2015?lang=en (accessed on 1 May 2018).
- WHO. Moving Forward on Salt and Fat Reduction in the Region. East. Mediterr. Health J. 2015, 21, 374–376. [Google Scholar]
- World Health Organization. Policy Statement and Recommended Actions for Reducing Fat Intake and Lowering Heart Attack Rates in the Eastern Mediterranean Region; World Health Organization: Geneva, Switzerland, 2014; Available online: http://www.emro.who.int/nutrition/strategy/policy-statement-2013.html (accessed on 10 April 2017).
- World Health Organization. Global Database on the Implementation of Nutrition Action (GINA); World Health Organization: Geneva, Switzerland, 2012; Available online: http://www.who.int/nutrition/gina/en/ (accessed on 15 March 2017).
- Peymani, P.; Joulaei, H.; Lankarani, K.B. Iran’s Experience on Reduction of Trans-Fatty Acid Content in Edible Oils. Middle-East J. Sci. Res. 2012, 11, 1207–1211. [Google Scholar]
- GCC Standardization Organization. The Technical Regulation GSO 9/2013 “Labeling of Prepackaged Foodstuffs”. Available online: https://www.gso.org.sa/store/gso/standards/GSO:615544/GSO%209:2013?lang=en (accessed on 30 March 2018).
- World Health Organization. An Action Package to Eliminate Industrially-Produced Trans Fat from the Global Food Supply; World Health Organization: Geneva, Switzerland, 2018; Available online: http://www.who.int/nutrition/topics/replace-transfat (accessed on 15 March 2018).
- Rayner, M.; Scarborough, P.; Kaur, A. Nutrient profiling and the regulation of marketing to children. Possibilities and pitfalls. Appetite 2013, 62, 232–235. [Google Scholar] [CrossRef] [PubMed]


| Country | Total Deaths by CVDs | Total Deaths in EMR | % of Deaths Due to CVDs |
|---|---|---|---|
| Afghanistan | 51.2 | 248.2 | 20.6 |
| Bahrain | 0.8 | 2.8 | 27.8 |
| Djibouti | 1.4 | 7.4 | 18.8 |
| Egypt | 245.9 | 608.4 | 40.4 |
| Iran | 160.8 | 371.5 | 43.3 |
| Iraq | 51.6 | 189.6 | 27.2 |
| Jordan | 13.4 | 36.4 | 36.7 |
| Kuwait | 4.6 | 11.0 | 41.3 |
| Lebanon | 17.8 | 38.3 | 46.5 |
| Libya | 11.6 | 33.7 | 34.6 |
| Morocco | 69.5 | 182.0 | 38.2 |
| Oman | 4.0 | 11.2 | 36.0 |
| Pakistan | 411.6 | 1403.1 | 29.3 |
| Qatar | 1.1 | 4.0 | 26.6 |
| Saudi Arabia | 42.4 | 113.5 | 37.4 |
| Somalia | 16.0 | 167.0 | 9.6 |
| Sudan | 80.3 | 281.9 | 28.5 |
| Syrian | 37.9 | 150.4 | 25.2 |
| Tunisia | 32.0 | 72.1 | 44.3 |
| UAE | 6.0 | 15.1 | 39.5 |
| Yemen | 56.8 | 174.1 | 32.6 |
| Regional | 1316.6 | 4121.9 | 31.9 |
| Fat Supply (g/day) | 1969–1971 | 1979–1981 | 1995–1997 | 2001–2003 | 2002–2004 | 2005 | 2006 | 2007 | 2008 | 2009 | 2010 | 2011 | 2014 |
|---|---|---|---|---|---|---|---|---|---|---|---|---|---|
| Djibouti | 34 | 36 | 54 | 65 | 57 | 66 | 65 | 68 | 69 | 63 | 56 | 60 | 60 |
| Egypt | 47 | 65 | 57 | 58 | 56 | 56 | 57 | 62 | 62 | 60 | 62 | 64 | 57 |
| Iran | 39 | 60 | 66 | 62 | 63 | 63 | 68 | 73 | 74 | 77 | 76 | 74 | 76 |
| Jordan | 52 | 62 | 76 | 80 | 74 | 90 | 94 | 95 | 87 | 92 | 98 | 101 | 94 |
| KSA | 33 | 76 | 73 | 82 | 78 | 84 | 96 | 81 | 82 | 82 | 92 | 96 | 82 |
| Kuwait | 69 | 88 | 98 | 113 | 102 | 116 | 124 | 123 | 126 | 122 | 122 | 116 | 123 |
| Lebanon | 63 | 82 | 103 | 113 | 103 | 117 | 107 | 110 | 107 | 109 | 108 | 106 | 108 |
| Libya | 62 | 91 | 102 | 94 | 93 | 97 | 93 | 95 | 96 | 94 | 95 | 95 | - |
| Morocco | 43 | 52 | 60 | 59 | 54 | 57 | 62 | 65 | 64 | 65 | 64 | 65 | 61 |
| Palestine | - | - | 67 | 63 | 69 | 62 | 53 | 55 | 51 | 52 | 50 | 48 | - |
| Sudan | 65 | 74 | 65 | 74 | 68 | 66 | - | - | - | - | - | - | - |
| Syria | 60 | 83 | 99 | 101 | 91 | 104 | 107 | 96 | 99 | 104 | 104 | 107 | - |
| Tunisia | 63 | 70 | 86 | 94 | 83 | 90 | 92 | 85 | 95 | 87 | 86 | 87 | 87 |
| UAE | 97 | 130 | 107 | 92 | 92 | 74 | 82 | 84 | 90 | 92 | 91 | 103 | 83 |
| Yemen | 29 | 38 | 34 | 41 | 44 | 47 | 49 | 48 | 45 | 44 | 43 | 45 | 47 |
© 2018 by the authors. Licensee MDPI, Basel, Switzerland. This article is an open access article distributed under the terms and conditions of the Creative Commons Attribution (CC BY) license (http://creativecommons.org/licenses/by/4.0/).
Share and Cite
Jawaldeh, A.A.; Al-Jawaldeh, H. Fat Intake Reduction Strategies among Children and Adults to Eliminate Obesity and Non-Communicable Diseases in the Eastern Mediterranean Region. Children 2018, 5, 89. https://doi.org/10.3390/children5070089
Jawaldeh AA, Al-Jawaldeh H. Fat Intake Reduction Strategies among Children and Adults to Eliminate Obesity and Non-Communicable Diseases in the Eastern Mediterranean Region. Children. 2018; 5(7):89. https://doi.org/10.3390/children5070089
Chicago/Turabian StyleJawaldeh, Ayoub Al, and Hanin Al-Jawaldeh. 2018. "Fat Intake Reduction Strategies among Children and Adults to Eliminate Obesity and Non-Communicable Diseases in the Eastern Mediterranean Region" Children 5, no. 7: 89. https://doi.org/10.3390/children5070089