
Diagnostic Efficacy of Advanced Ultrasonography Imaging Techniques in Infants with Biliary Atresia (BA): A Systematic Review and Meta-Analysis
 , ,
, ,
Abstract
:1. Introduction
2. Materials and Methods
2.1. Search Strategy
2.2. Inclusion and Exclusion Criteria
2.3. Data Extraction
2.4. Quality Assessment
2.5. Statistical Analysis
3. Results
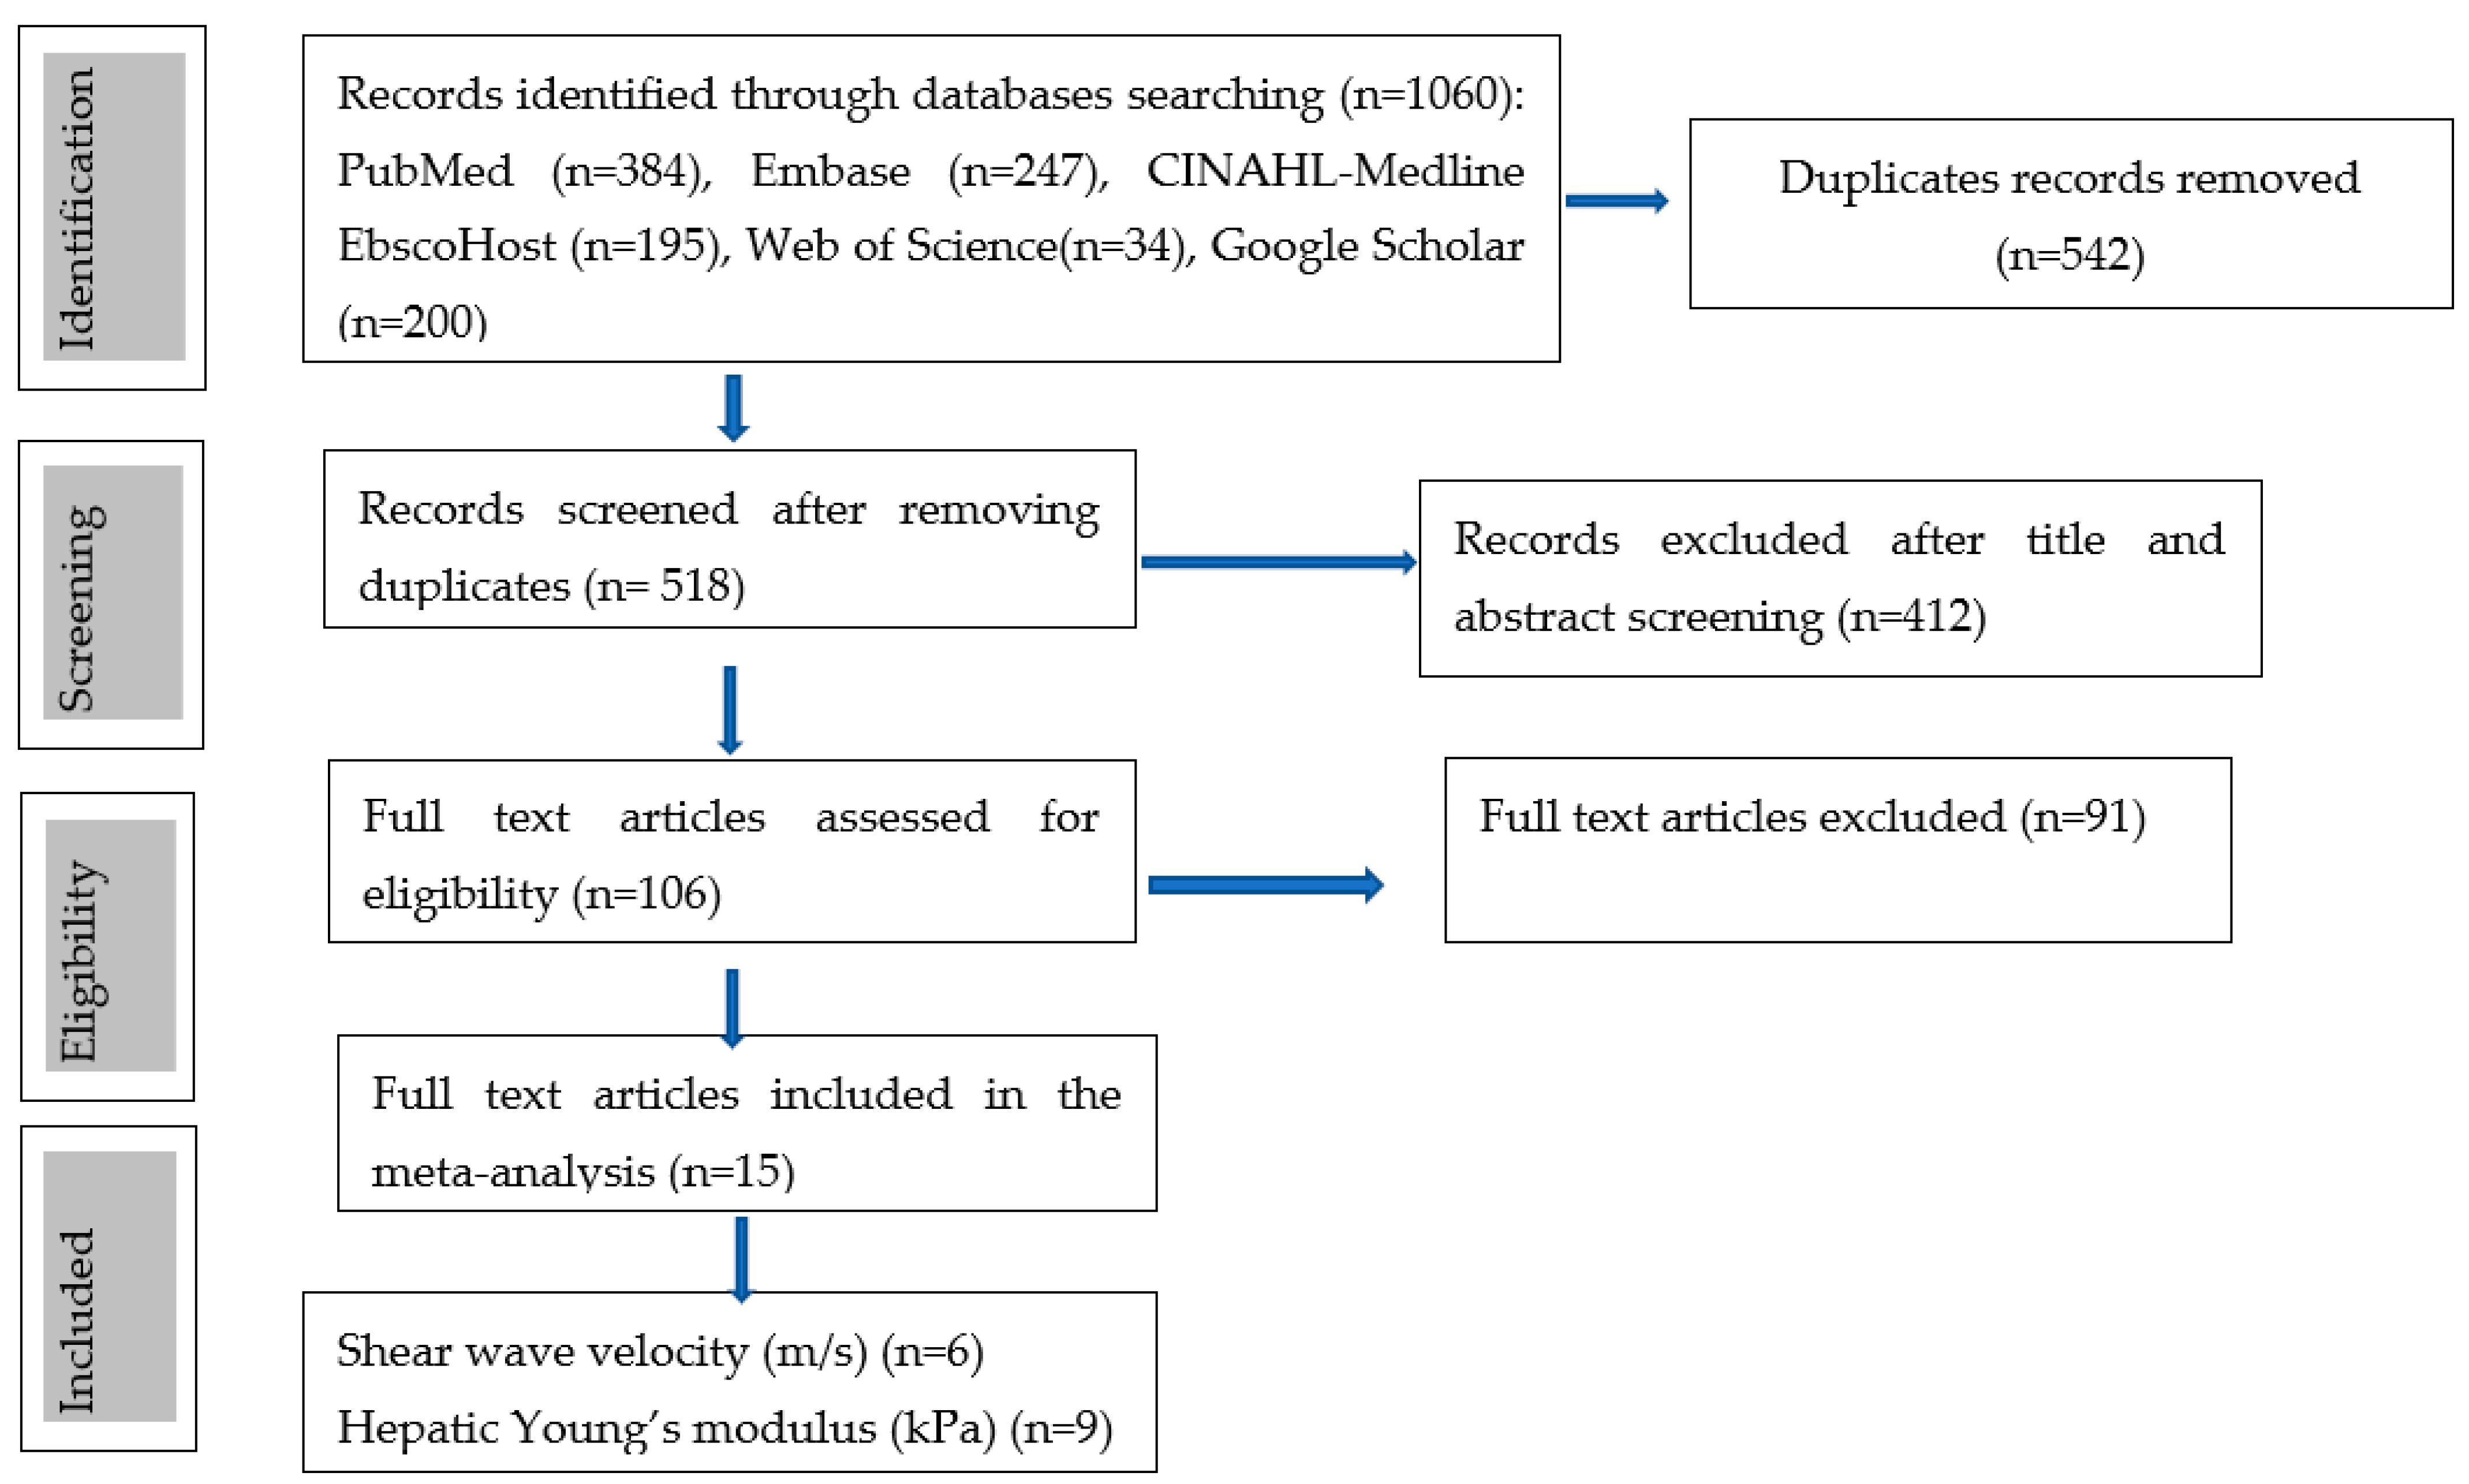
3.1. Literature Search
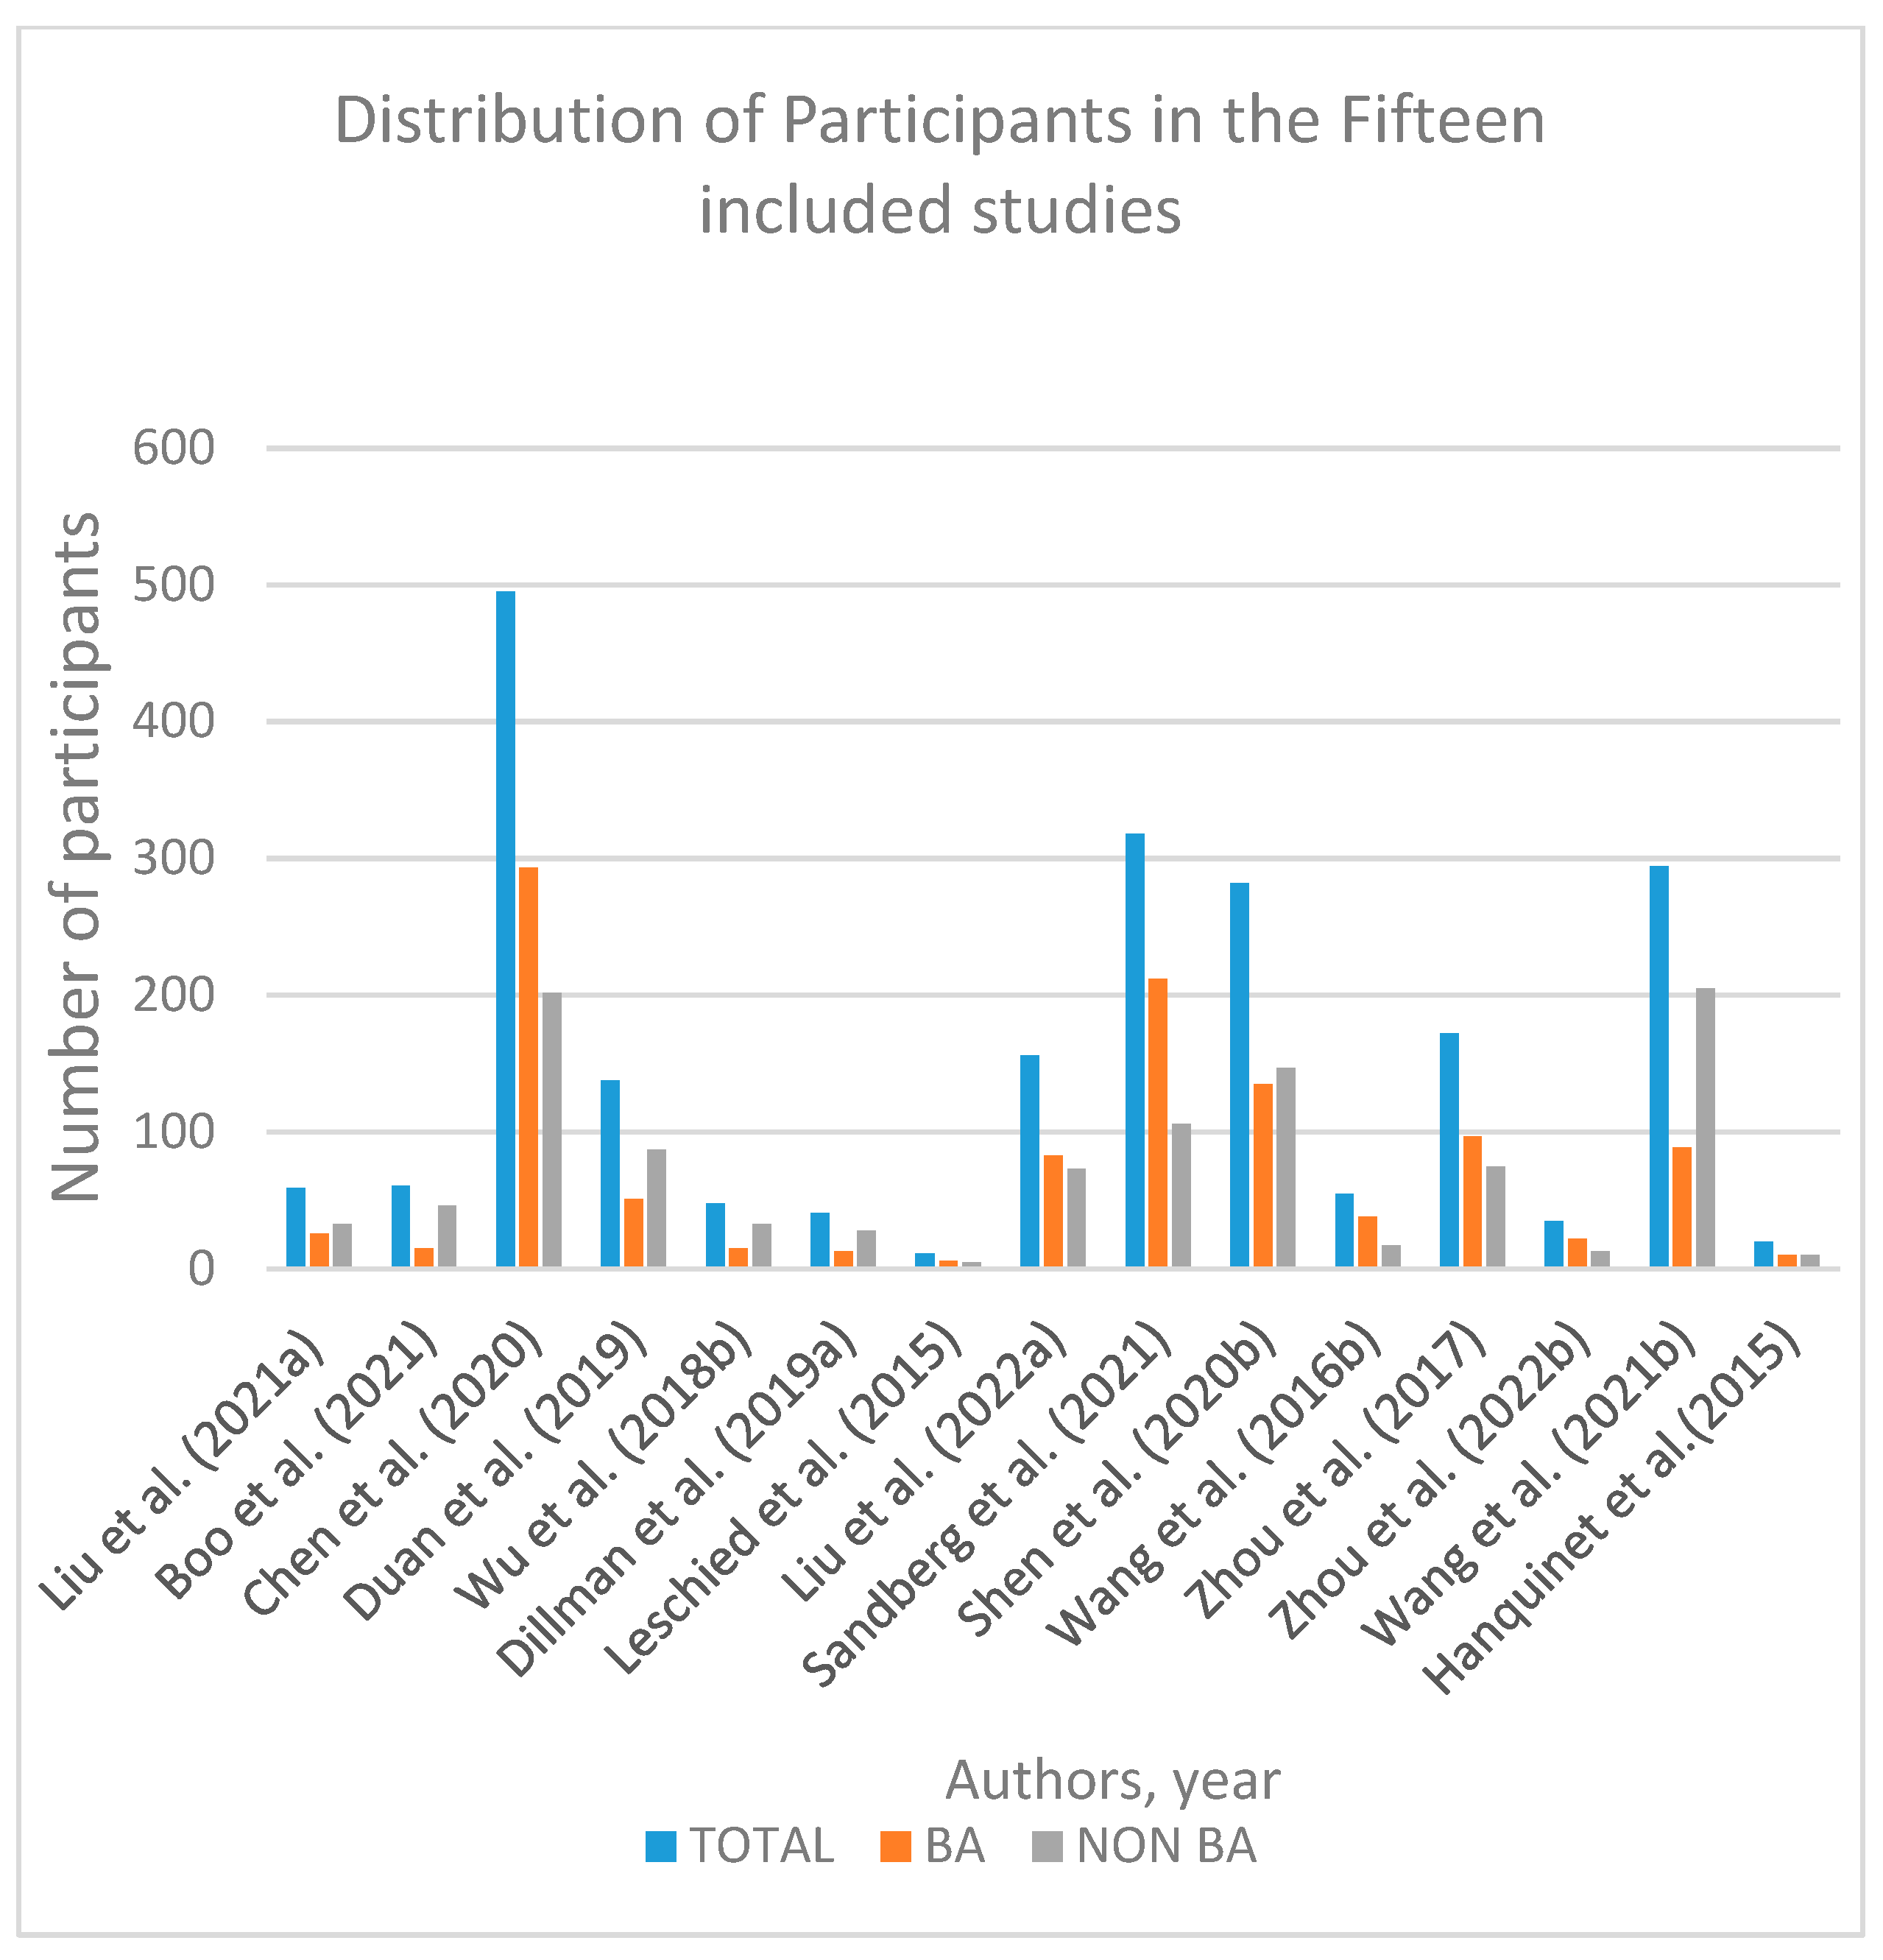
3.2. Study Characteristics
3.3. Diagnostic Performance of Shear Wave Elastography
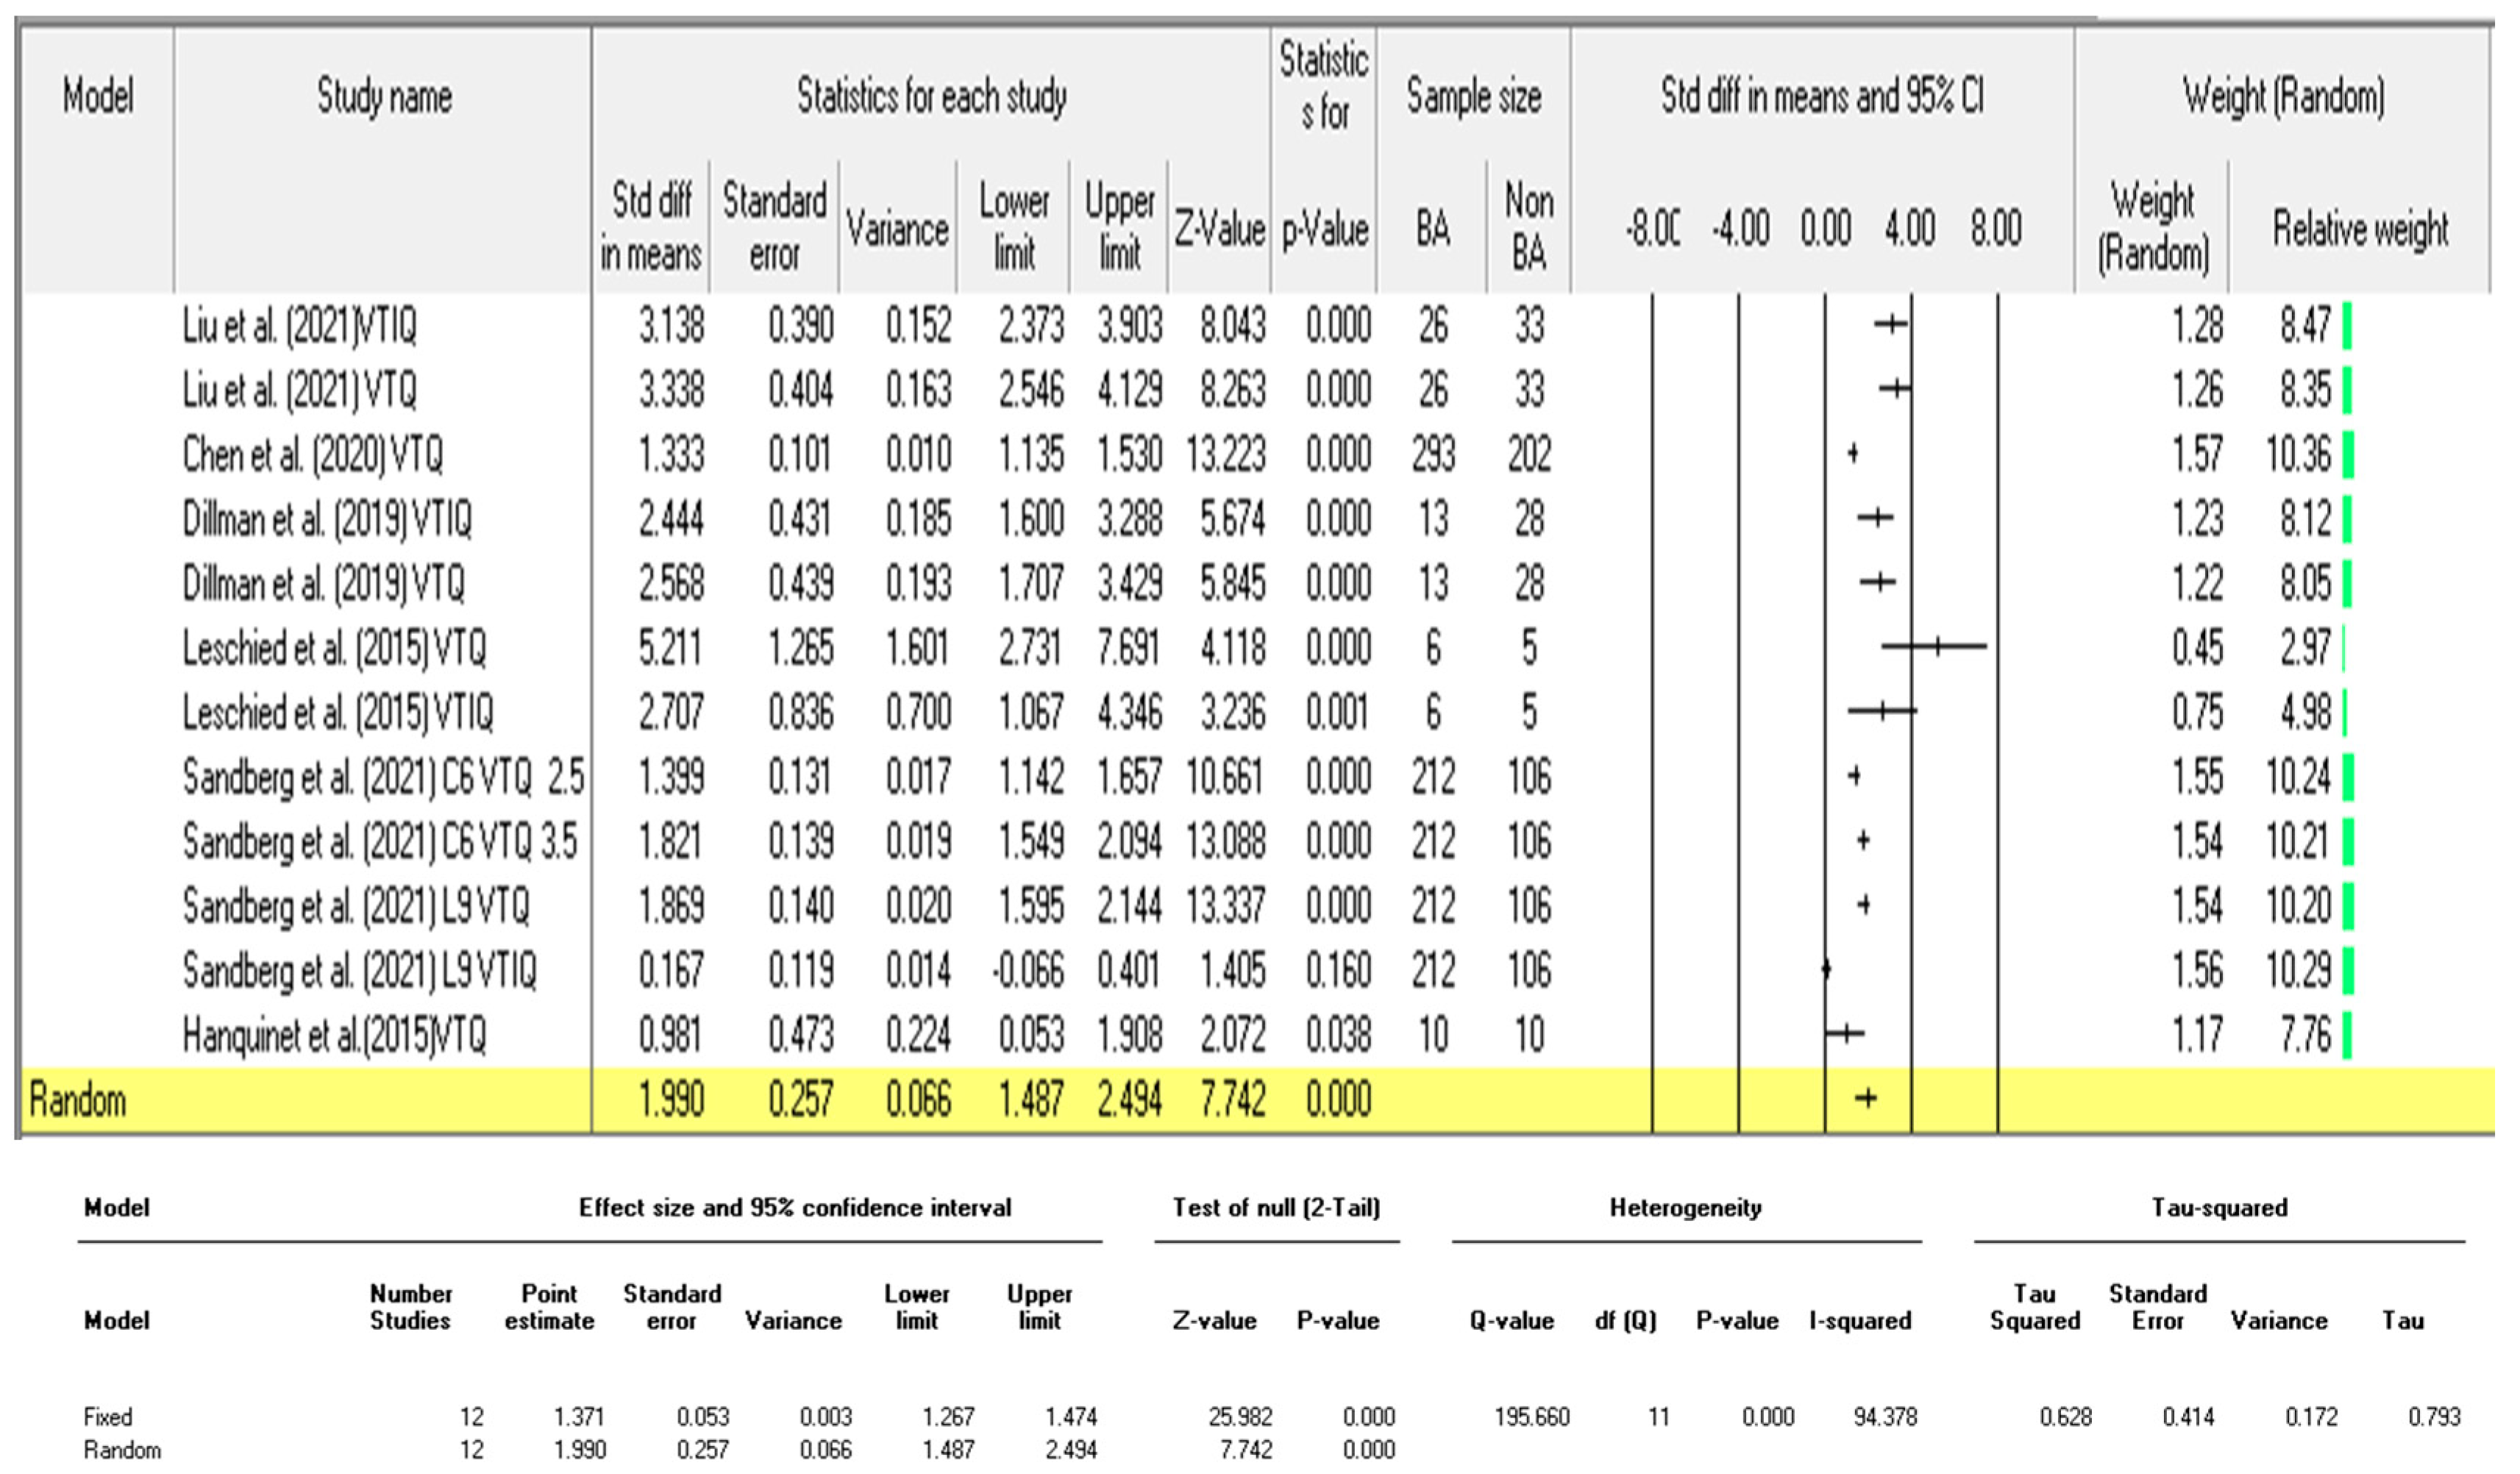
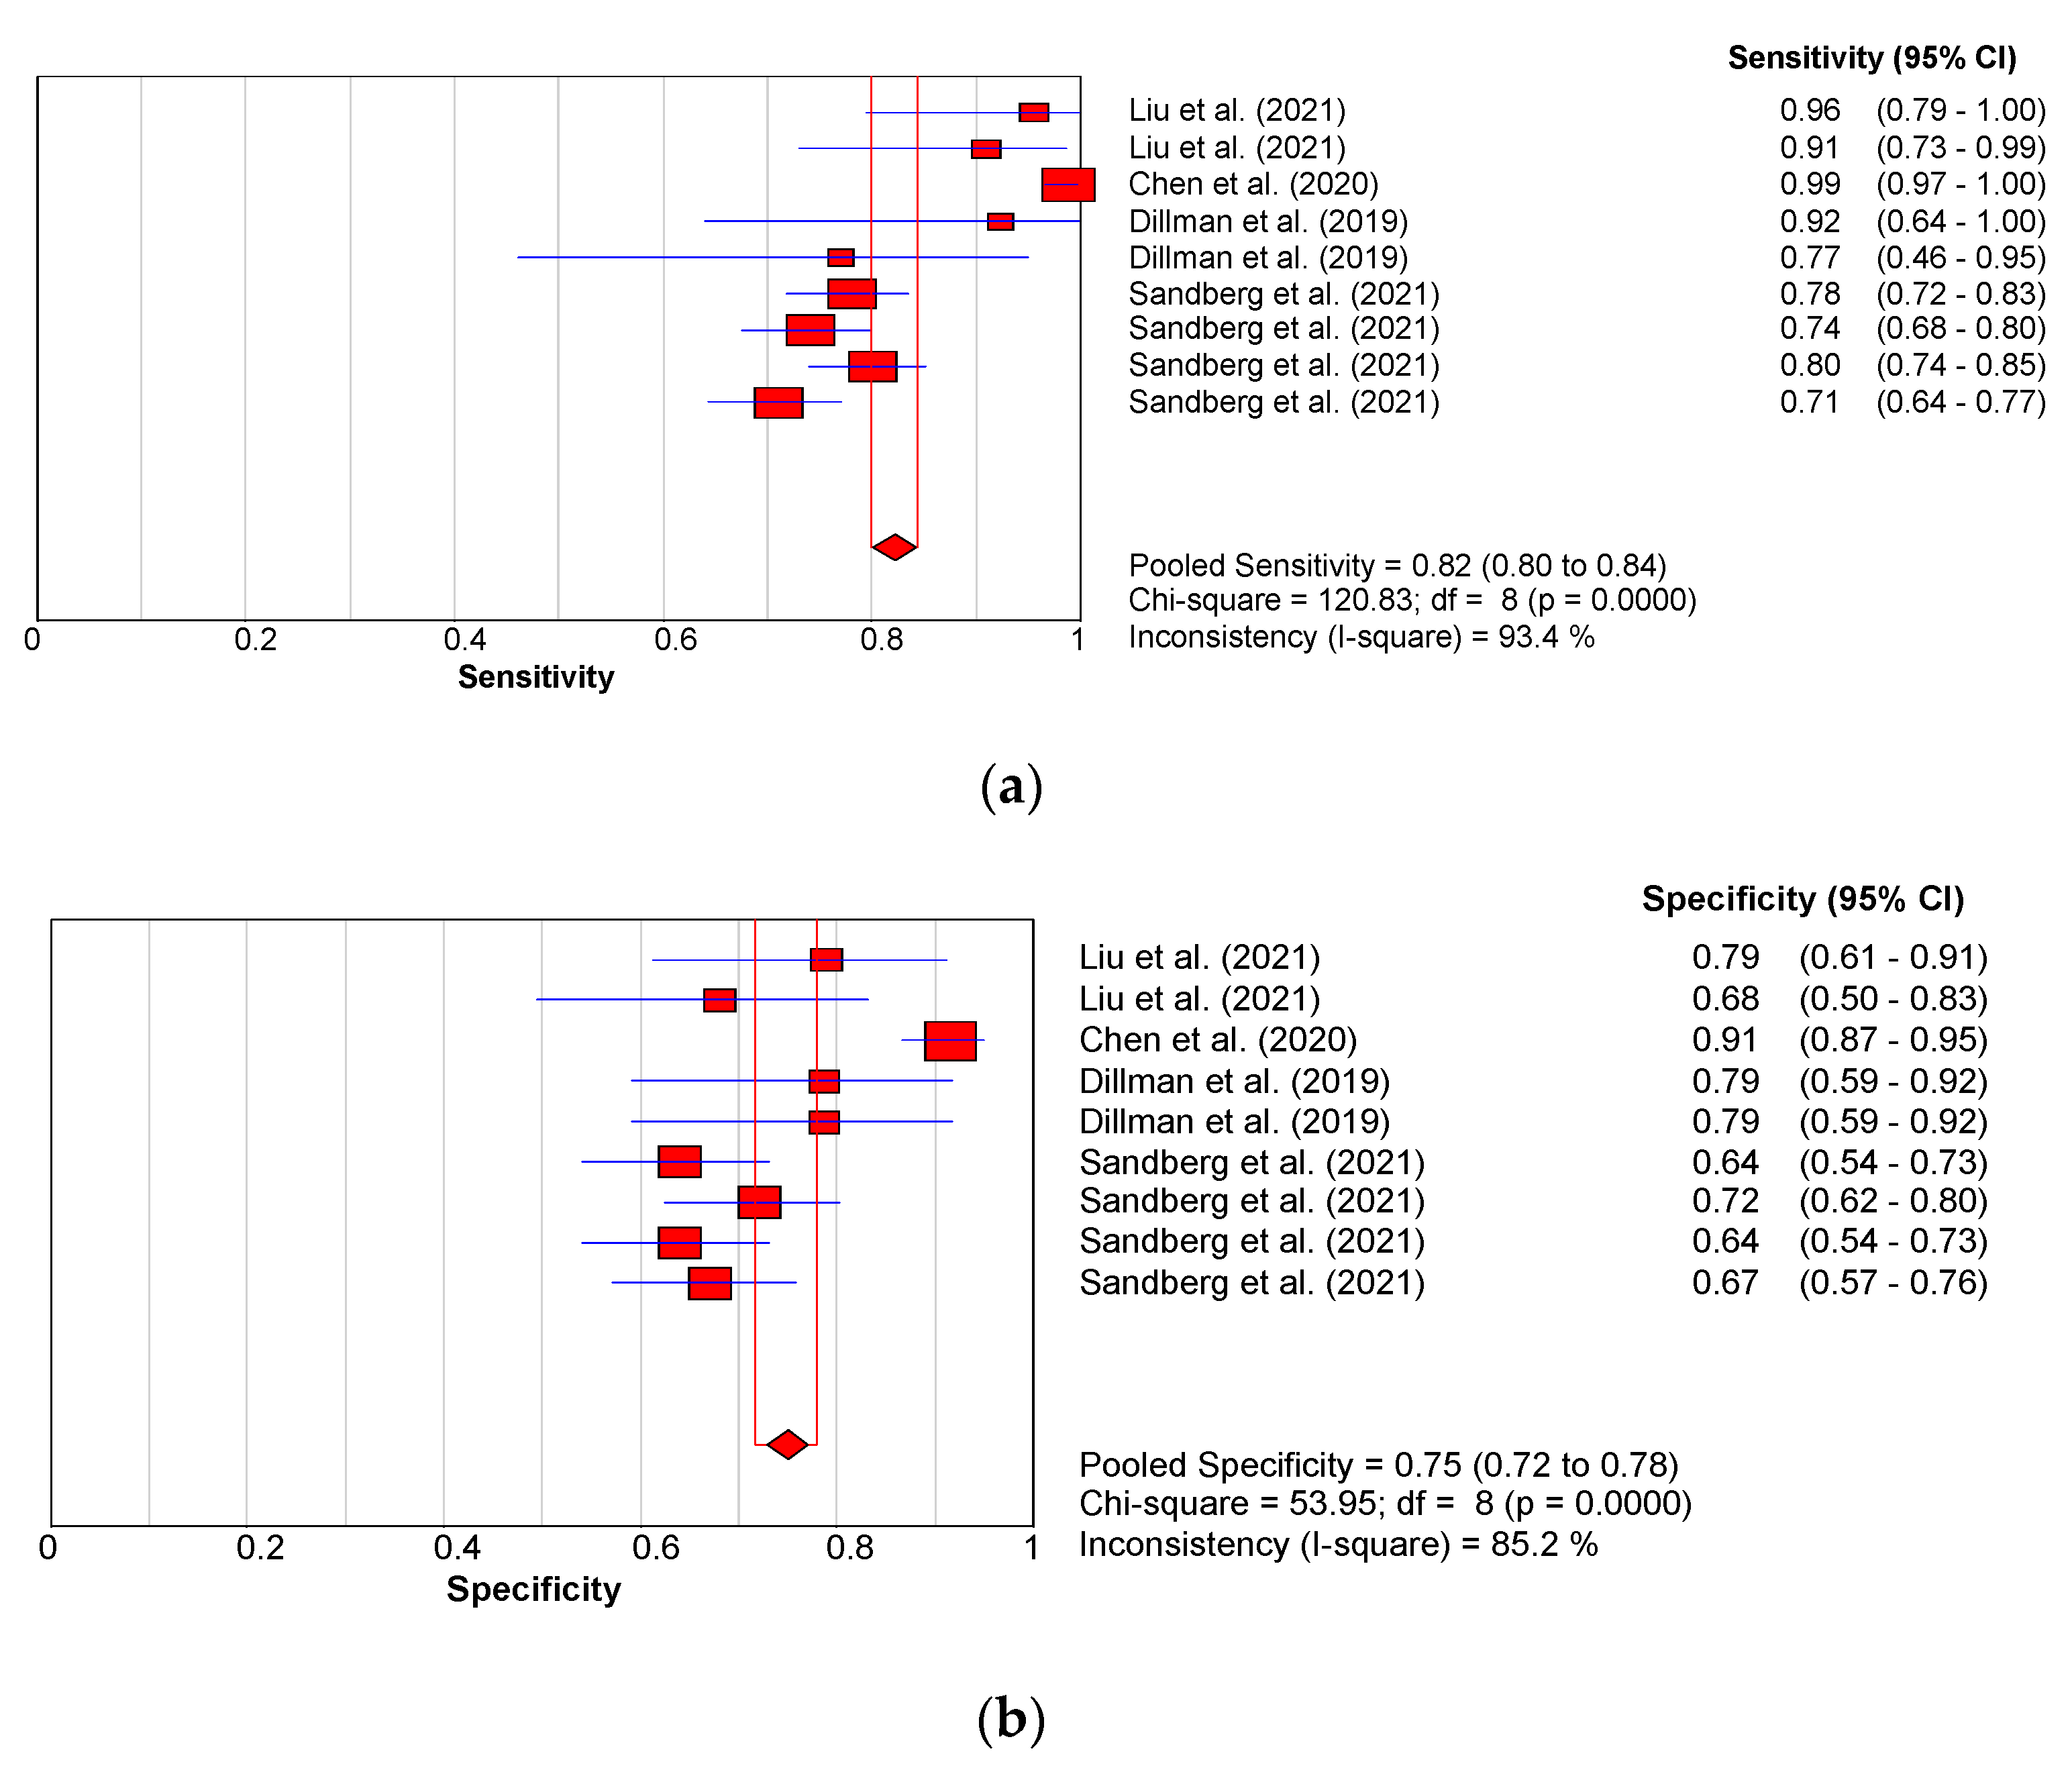
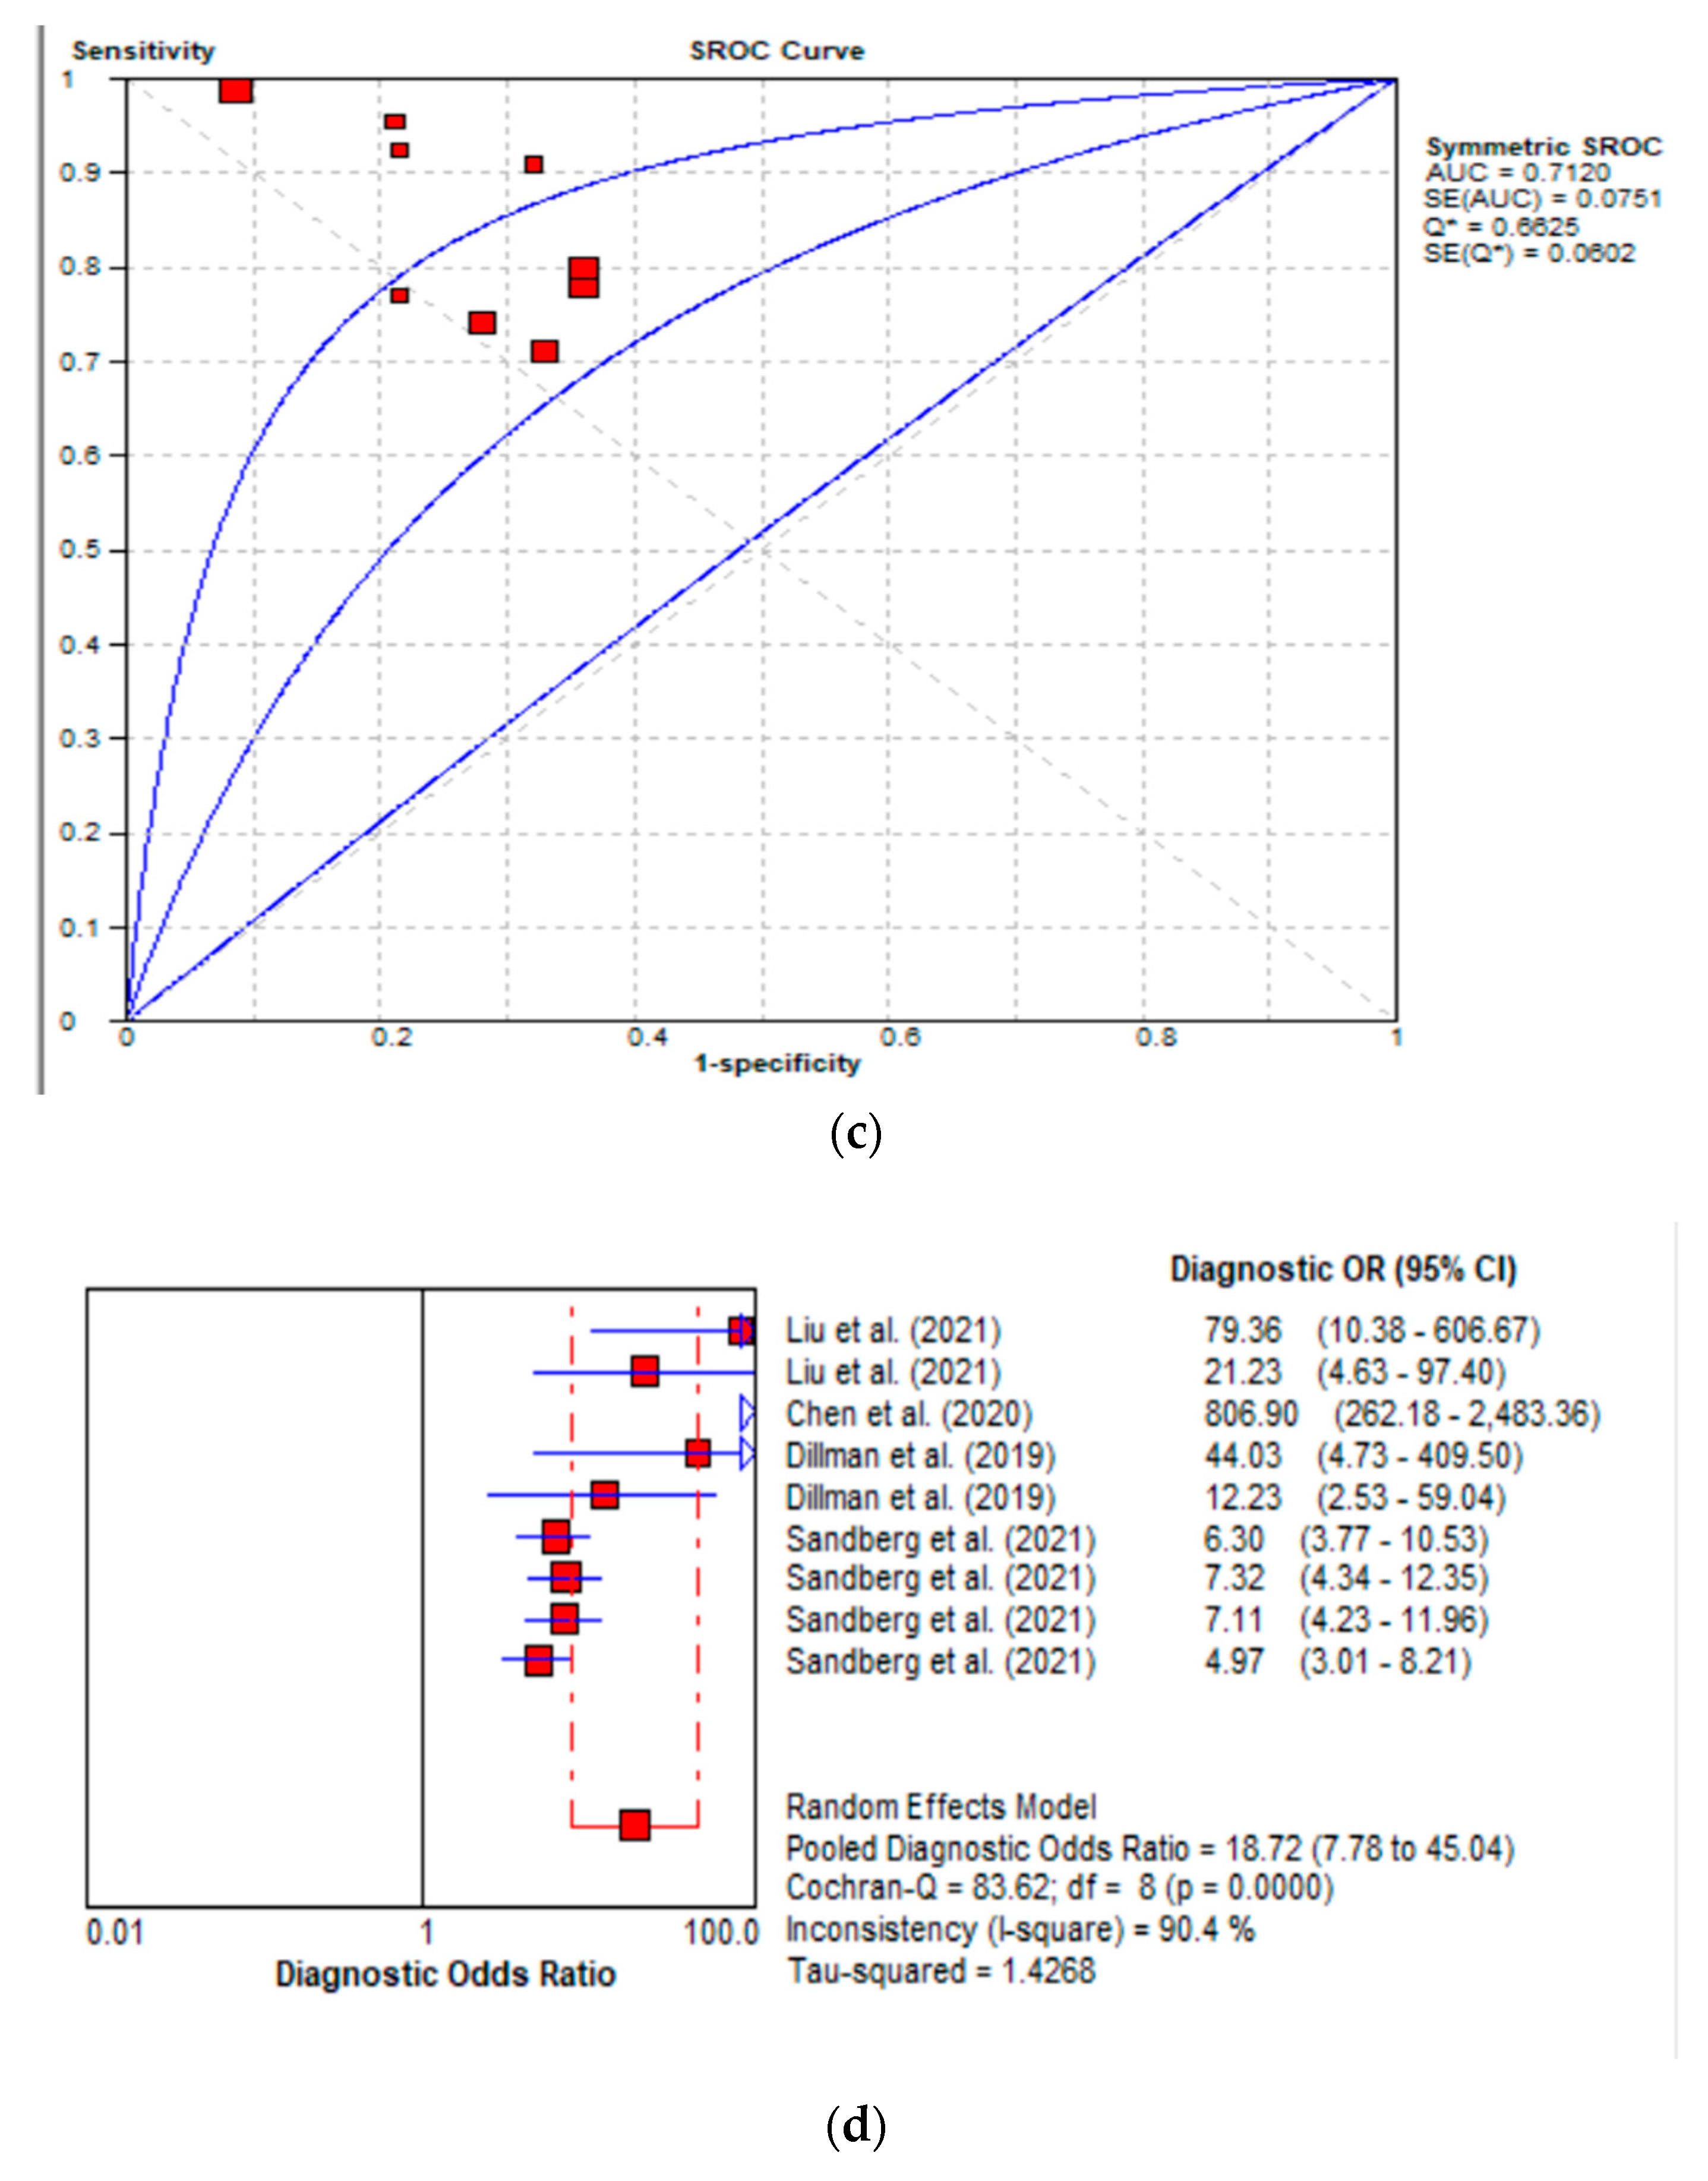
3.3.1. Diagnostic Performance of the Hepatic Young Modulus (SWE KPa)
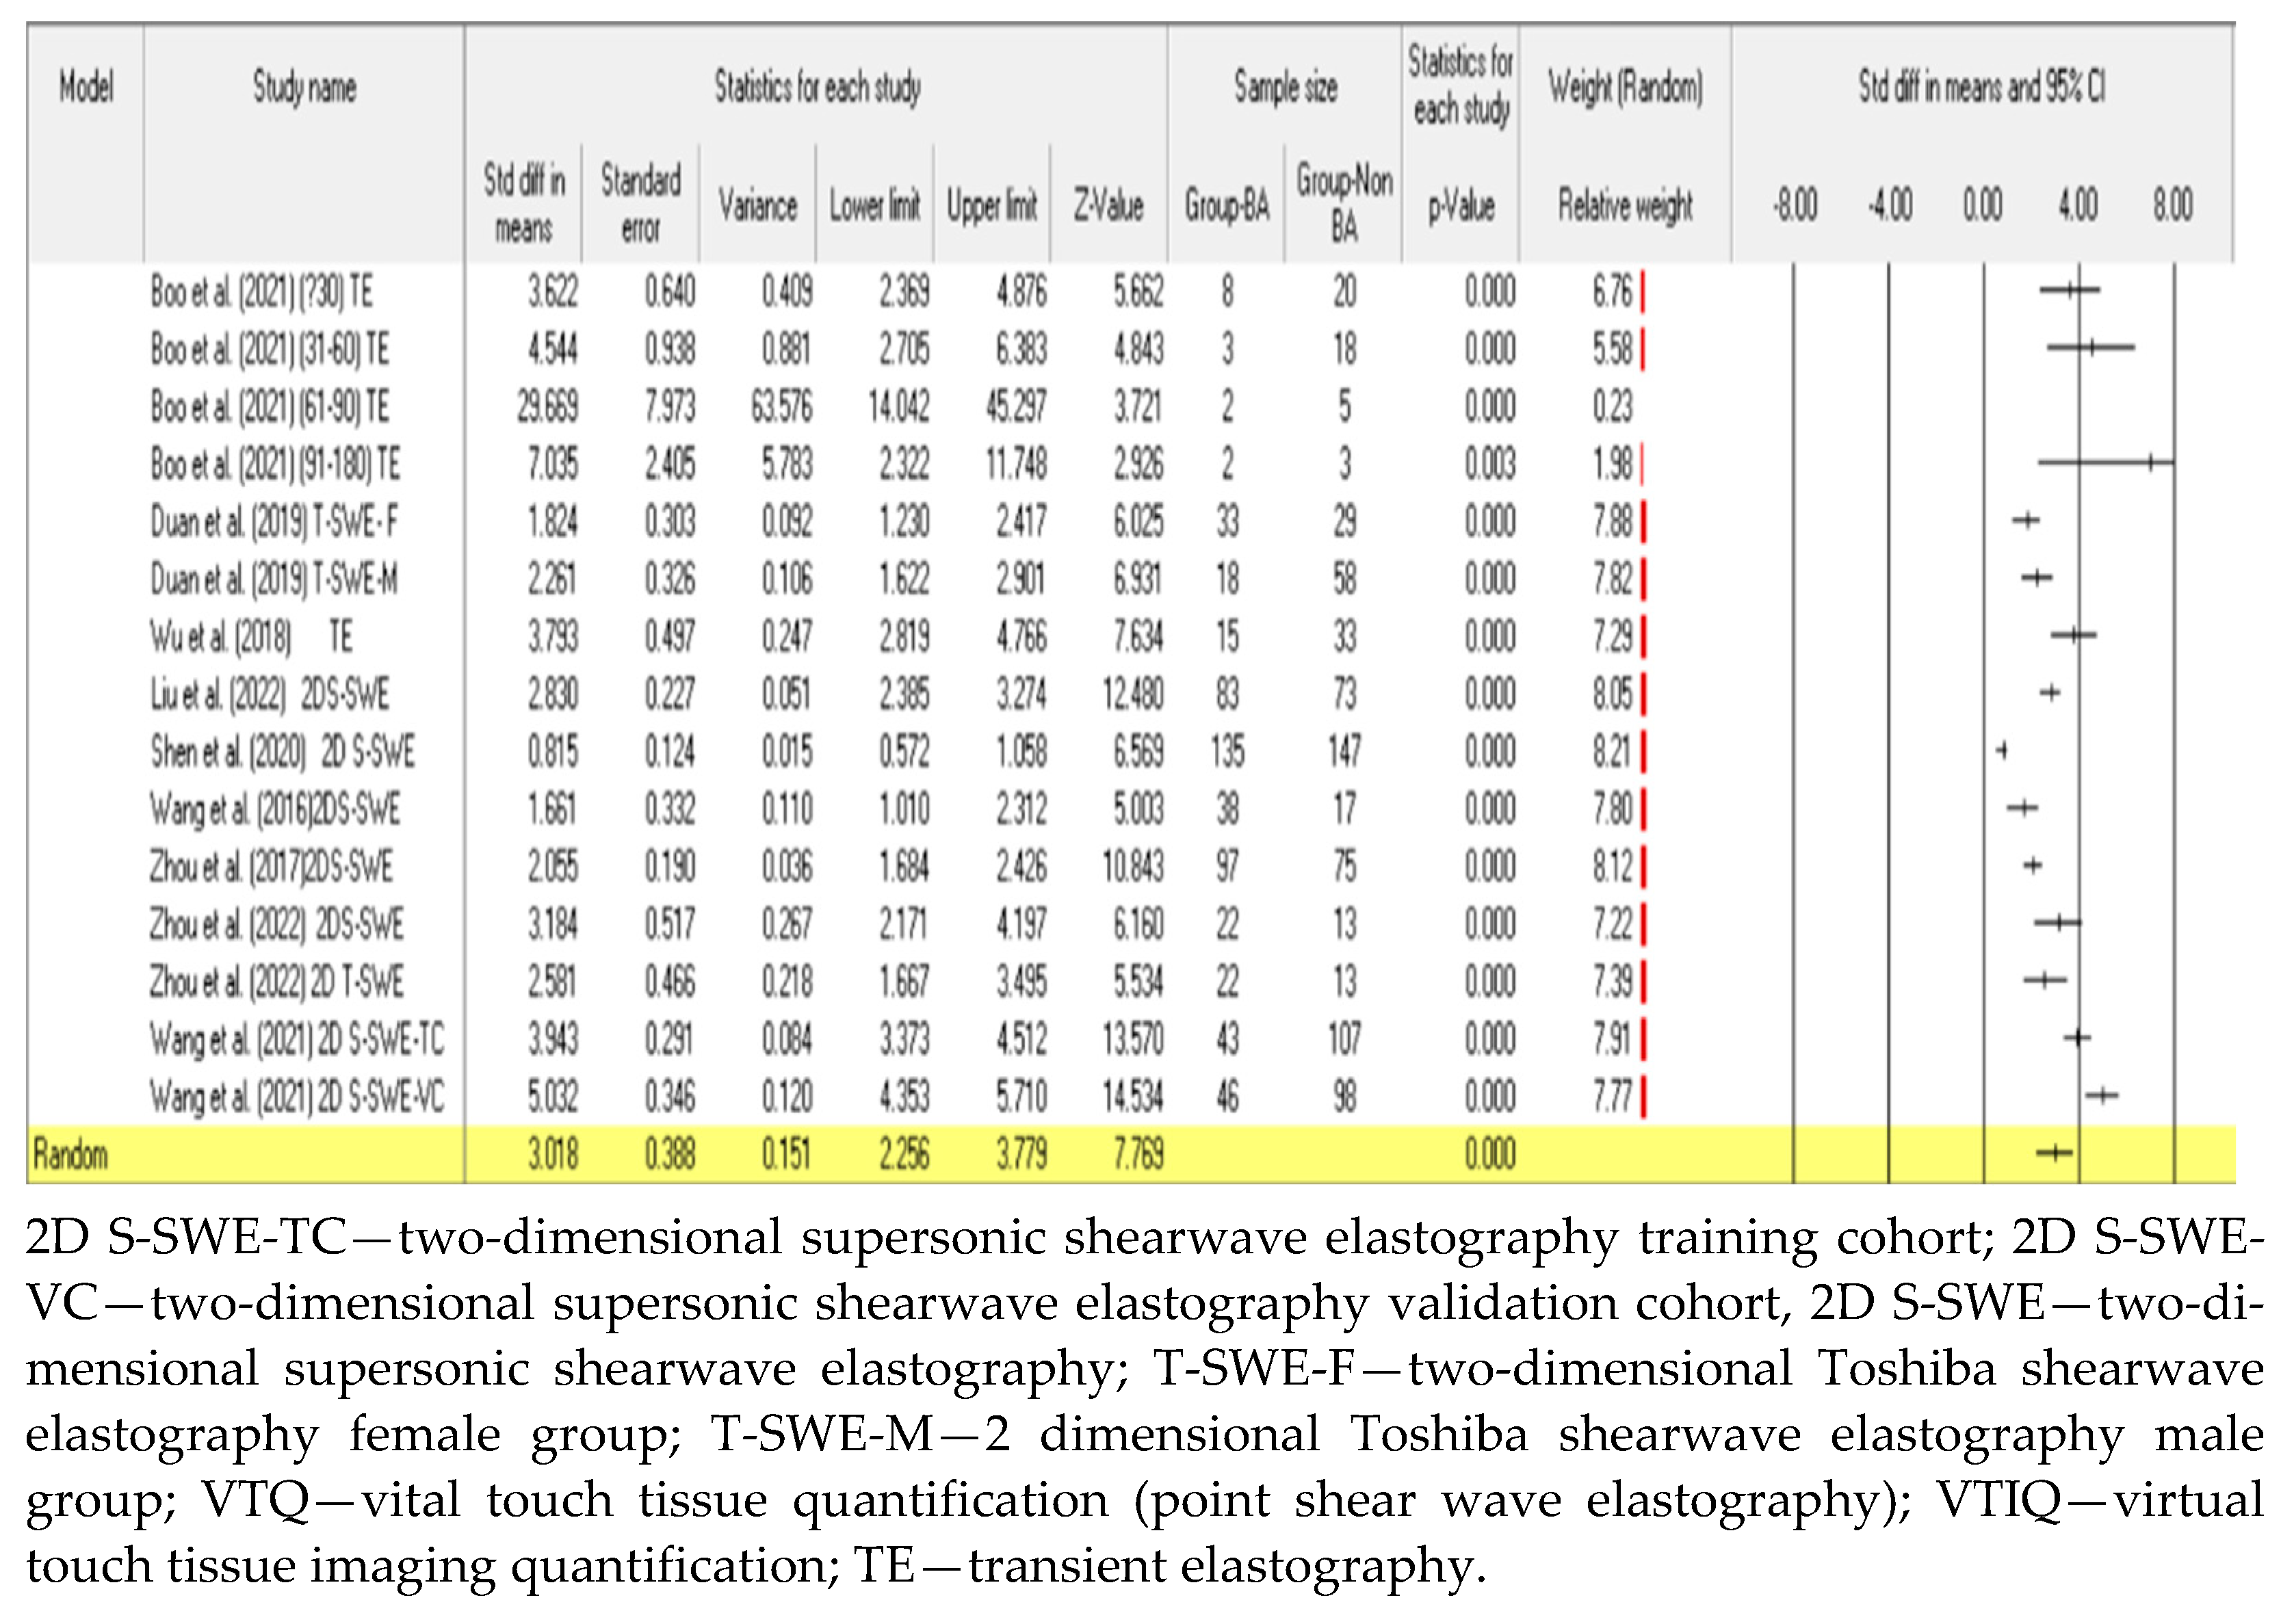
3.3.2. Diagnostic Performance of Shear Wave Velocity (SWV in m/s)
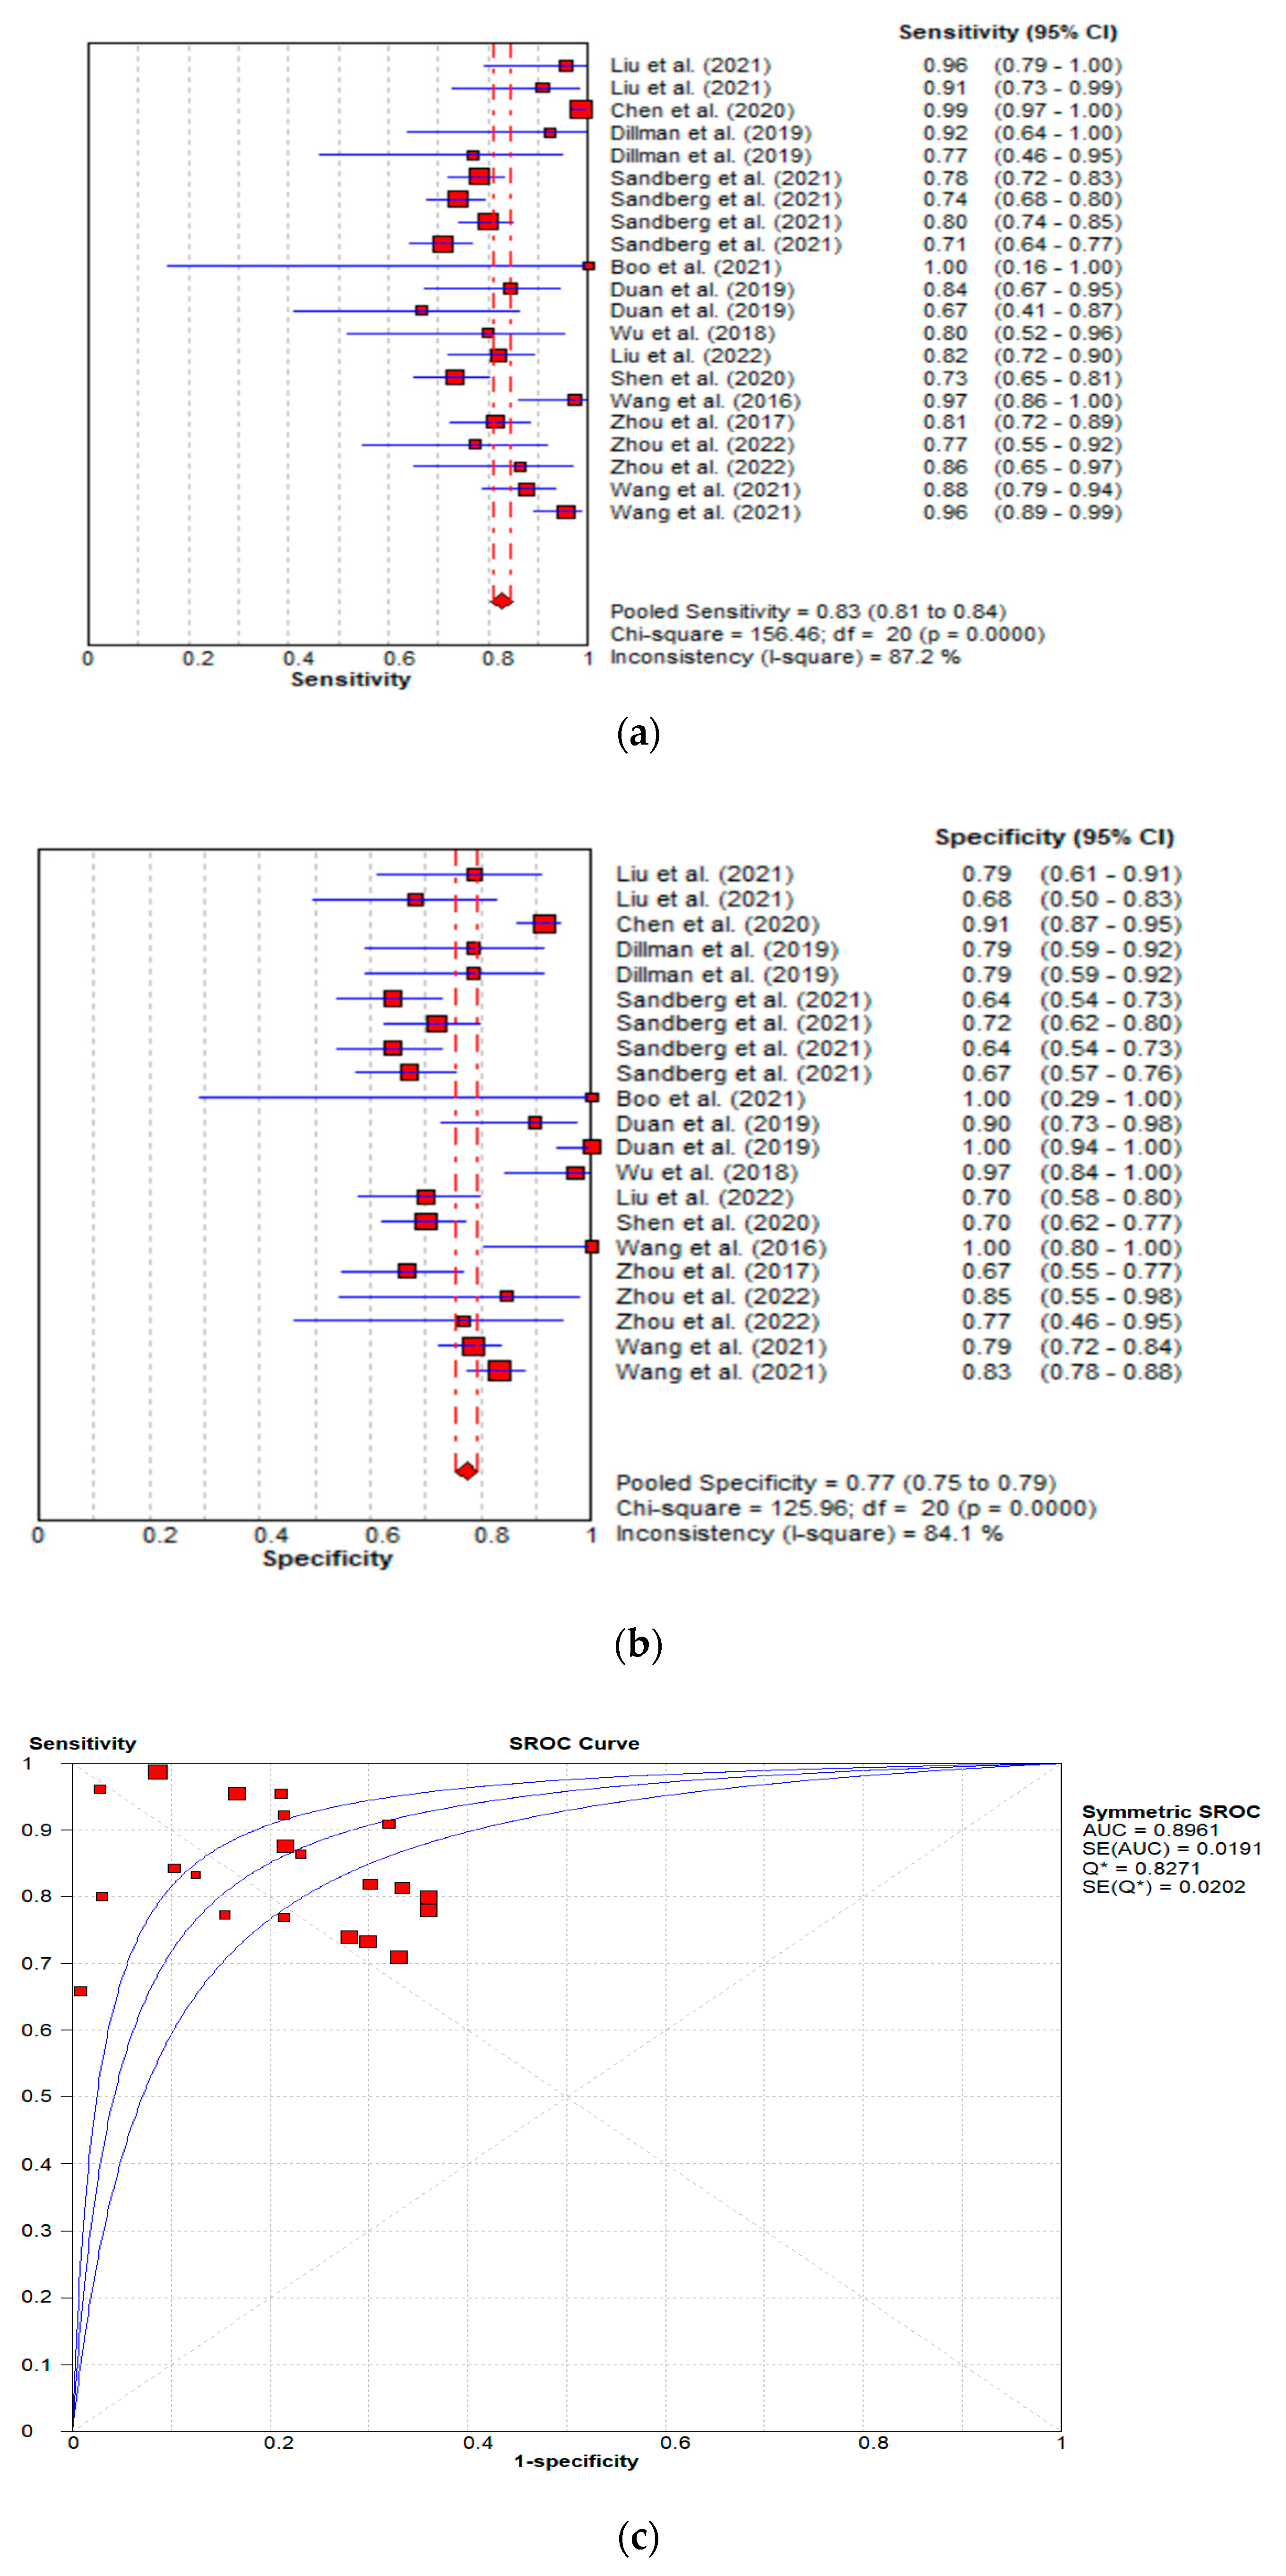
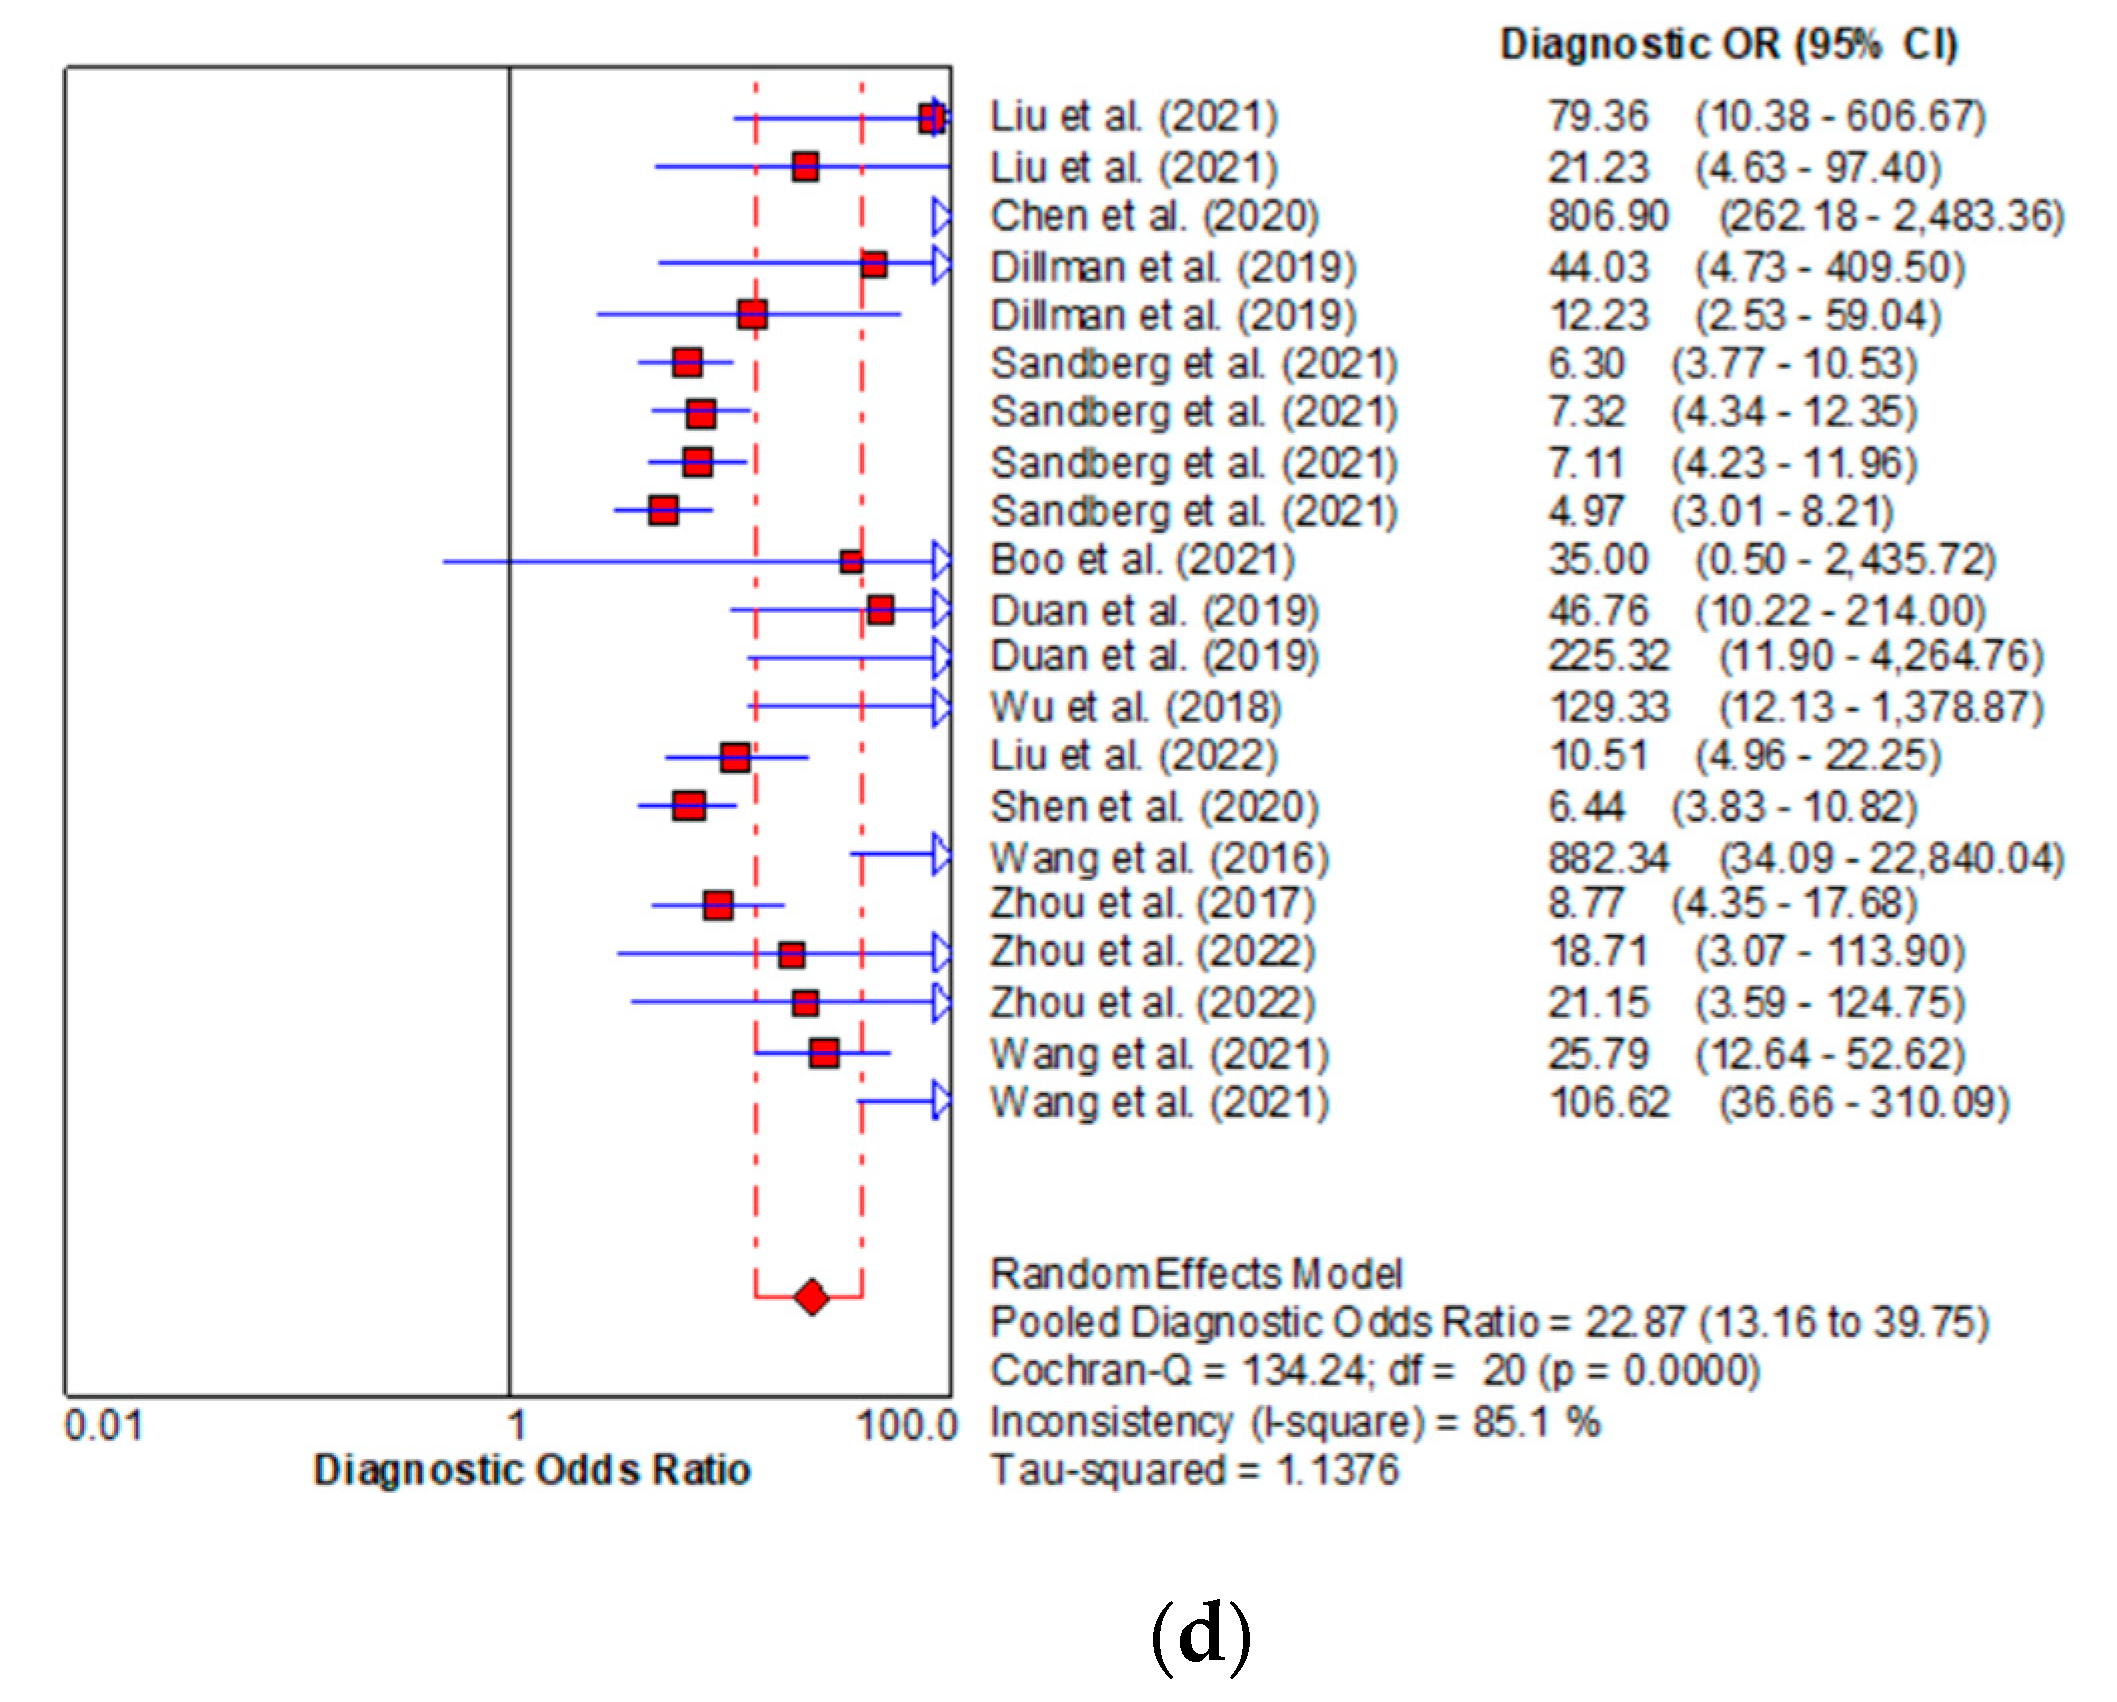
3.3.3. Diagnostic Performance of the Combined Studies
3.4. Studies Methodological Quality Assessment by the QUADAS Tool
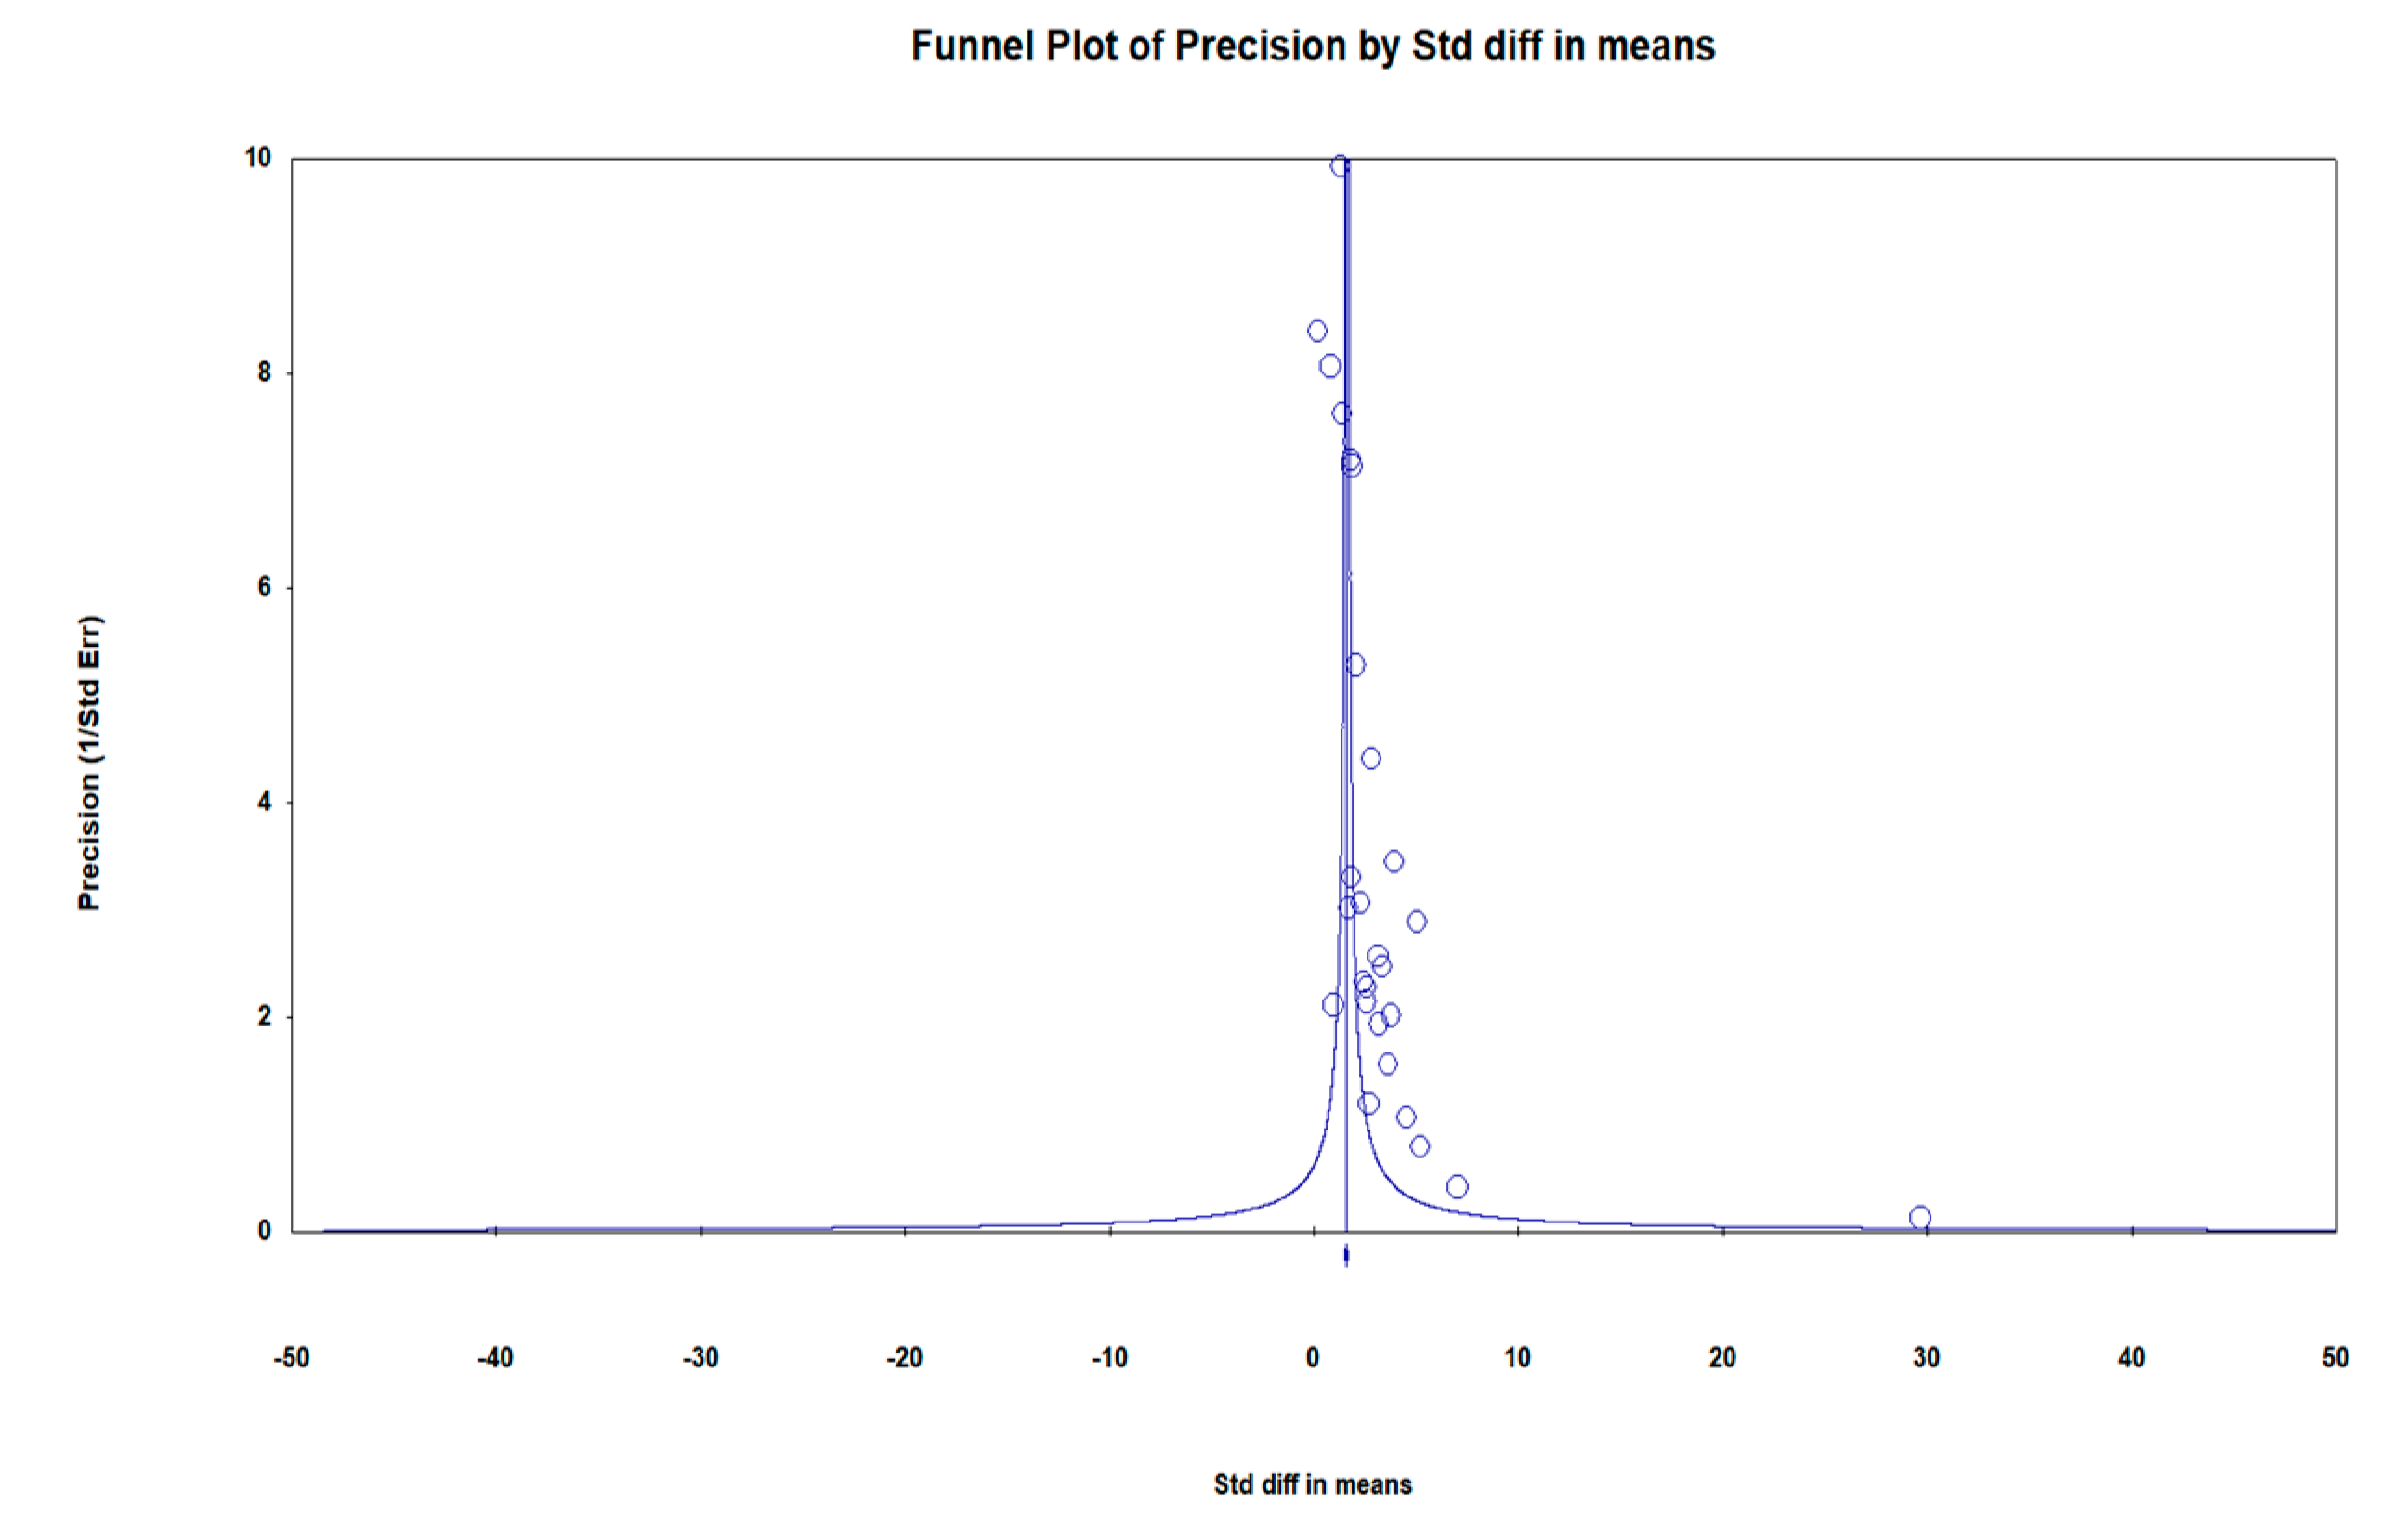
3.5. Publication Bias Assessment
4. Discussion
5. Limitations of the Study
6. Conclusions
Supplementary Materials
Author Contributions
Funding
Institutional Review Board Statement
Informed Consent Statement
Data Availability Statement
Conflicts of Interest
References
- Napolitano, M. Imaging in biliary atresia. Pediatr. Radiol. 2019, 49, S297. [Google Scholar] [CrossRef]
- Lendahl, U.; Lui, V.C.H.; Chung, P.H.Y.; Tam, P.K.H. Biliary Atresia—emerging diagnostic and therapy opportunities. eBioMedicine 2021, 74, 103689. [Google Scholar] [CrossRef] [PubMed]
- Dike, P.; Mahmood, N.; Harpavat, S. Recent advances in the use of ultrasound and related techniques in diagnosing and predicting outcomes in biliary atresia. Curr. Opin. Pediatr. 2021, 33, 515–520. [Google Scholar] [CrossRef]
- Fanna, M.; Masson, G.; Capito, C.; Girard, M.; Guerin, F.; Hermeziu, B.; Lachaux, A.; Roquelaure, B.; Gottrand, F.; Broue, P.; et al. Management of Biliary Atresia in France 1986 to 2015: Long-term Results. J. Pediatr. Gastroenterol. Nutr. 2019, 69, 416–424. [Google Scholar] [CrossRef] [PubMed]
- Lakshminarayanan, B.; Davenport, M. Biliary atresia: A comprehensive review. J. Autoimmun. 2016, 73, 1–9. [Google Scholar] [CrossRef] [PubMed]
- Chiu, C.-Y.; Chen, P.-H.; Chan, C.-F.; Chang, M.-H.; Wu, T.-C. Biliary Atresia in Preterm Infants in Taiwan: A Nationwide Survey. J. Pediatr. 2013, 163, 100–103.e101. [Google Scholar] [CrossRef]
- Chardot, C.; Buet, C.; Serinet, M.-O.; Golmard, J.-L.; Lachaux, A.; Roquelaure, B.; Gottrand, F.; Broué, P.; Dabadie, A.; Gauthier, F.; et al. Improving outcomes of biliary atresia: French national series 1986–2009. J. Hepatol. 2013, 58, 1209–1217. [Google Scholar] [CrossRef]
- Chung, P.H.Y.; Zheng, S.; Tam, P.K.H. Biliary atresia: East versus west. Semin. Pediatr. Surg. 2020, 29, 150950. [Google Scholar] [CrossRef]
- Nio, M.; Sasaki, H.; Wada, M.; Kazama, T.; Nishi, K.; Tanaka, H. Impact of age at Kasai operation on short- and long-term outcomes of type III biliary atresia at a single institution. J. Pediatr. Surg. 2010, 45, 2361–2363. [Google Scholar] [CrossRef]
- Pakarinen, M.P.; Johansen, L.S.; Svensson, J.F.; Bjørnland, K.; Gatzinsky, V.; Stenström, P.; Koivusalo, A.; Kvist, N.; Almström, M.; Emblem, R.; et al. Outcomes of biliary atresia in the Nordic countries—A multicenter study of 158 patients during 2005–2016. J. Pediatr. Surg. 2018, 53, 1509–1515. [Google Scholar] [CrossRef]
- Chen, Y.; Zhao, D.; Gu, S.; Li, Y.; Pan, W.; Zhang, Y. Three-color risk stratification for improving the diagnostic accuracy for biliary atresia. Eur. Radiol. 2020, 30, 3852–3861. [Google Scholar] [CrossRef] [PubMed]
- Choi, H.-Y. Carotid duplex ultrasound: Interpretations and clinical applications. Ann. Clin. Neurophysiol. 2021, 23, 82–91. [Google Scholar] [CrossRef]
- Di Serafino, M.; Gioioso, M.; Severino, R.; Esposito, F.; Vezzali, N.; Ferro, F.; Pelliccia, P.; Caprio, M.G.; Iorio, R.; Vallone, G. Ultrasound findings in paediatric cholestasis: How to image the patient and what to look for. J. Ultrasound 2020, 23, 1–12. [Google Scholar] [CrossRef] [PubMed]
- Zhou, W.; Chen, D.; Jiang, H.; Shan, Q.; Zhang, X.; Xie, X.; Zhou, L. Ultrasound Evaluation of Biliary Atresia Based on Gallbladder Classification: Is 4 Hours of Fasting Necessary? J. Ultrasound Med. 2019, 38, 2447–2455. [Google Scholar] [CrossRef] [PubMed]
- Ho, A.; Sacks, M.A.; Sapra, A.; Khan, F.A. The Utility of Gallbladder Absence on Ultrasound for Children With Biliary Atresia. Front. Pediatr. 2021, 9, 685268. [Google Scholar] [CrossRef]
- Hwang, M.; Piskunowicz, M.; Darge, K. Advanced Ultrasound Techniques for Pediatric Imaging. Pediatrics 2019, 143, e20182609. [Google Scholar] [CrossRef] [PubMed] [Green Version]
- Riccabona, M.; Fritz, G.A.; Schöllnast, H.; Schwarz, T.; Deutschmann, M.J.; Mache, C.J. Hydronephrotic Kidney: Pediatric Three-dimensional US for Relative Renal Size Assessment—Initial Experience. Radiology 2005, 236, 276–283. [Google Scholar] [CrossRef]
- Haratz, K.; Nardozza, L.; Oliveira, P.; Rolo, L.; Milani, H.; Sá Barreto, E.; Araujo Júnior, E.; Ajzen, S.; Moron, A. Morphological evaluation of lateral ventricles of fetuses with ventriculomegaly by three-dimensional ultrasonography and magnetic resonance imaging: Correlation with etiology. Arch. Gynecol. Obstet. 2010, 284, 331–336. [Google Scholar] [CrossRef]
- Riccabona, M. Editorial review: Pediatric 3D ultrasound. J. Ultrason 2014, 14, 5–20. [Google Scholar] [CrossRef]
- Csutak, R.; Unterassinger, L.; Rohrmeister, C.; Weninger, M.; Vergesslich, K.A. Three-dimensional volume measurement of the lateral ventricles in preterm and term infants: Evaluation of a standardised computer-assisted method in vivo. Pediatr. Radiol. 2003, 33, 104–109. [Google Scholar] [CrossRef]
- Hwang, M.; Riggs, B.J.; Katz, J.; Seyfert, D.; Northington, F.; Shenandoah, R.; Burd, I.; McArthur, J.; Darge, K.; Thimm, M.A.; et al. Advanced Pediatric Neurosonography Techniques: Contrast-Enhanced Ultrasonography, Elastography, and Beyond. J. Neuroimaging 2018, 28, 150–157. [Google Scholar] [CrossRef] [PubMed]
- Page, M.J.; McKenzie, J.E.; Bossuyt, P.M.; Boutron, I.; Hoffmann, T.C.; Mulrow, C.D.; Shamseer, L.; Tetzlaff, J.M.; Akl, E.A.; Brennan, S.E.; et al. The PRISMA 2020 statement: An updated guideline for reporting systematic reviews. Syst. Rev. 2021, 10, 89. [Google Scholar] [CrossRef] [PubMed]
- Šimundić, A.-M. Measures of Diagnostic Accuracy: Basic Definitions. EJIFCC 2009, 19, 203–211. [Google Scholar] [PubMed]
- Hozo, S.P.; Djulbegovic, B.; Hozo, I. Estimating the mean and variance from the median, range, and the size of a sample. BMC Med. Res. Methodol. 2005, 5, 13. [Google Scholar] [CrossRef] [PubMed] [Green Version]
- Urakami, Y.; Seki, H.; Kishi, S. Endoscopic retrograde cholangiopancreatography (ERCP) performed in children. Endoscopy 1977, 9, 86–91. [Google Scholar] [CrossRef] [PubMed]
- Saito, T.; Terui, K.; Mitsunaga, T.; Nakata, M.; Kuriyama, Y.; Higashimoto, Y.; Kouchi, K.; Onuma, N.; Takahashi, H.; Yoshida, H. Role of pediatric endoscopic retrograde cholangiopancreatography in an era stressing less-invasive imaging modalities. J Pediatr. Gastroenterol. Nutr. 2014, 59, 204–209. [Google Scholar] [CrossRef]
- Petersen, C.; Meier, P.N.; Schneider, A.; Turowski, C.; Pfister, E.D.; Manns, M.P.; Ure, B.M.; Wedemeyer, J. Endoscopic retrograde cholangiopancreaticography prior to explorative laparotomy avoids unnecessary surgery in patients suspected for biliary atresia. J. Hepatol. 2009, 51, 1055–1060. [Google Scholar] [CrossRef]
- Larrosa–Haro, A.; Caro–López, A.M.; Coello–Ramírez, P.; Zavala–Ocampo, J.; Vázquez–Camacho, G. Duodenal Tube Test in the Diagnosis of Biliary Atresia. J. Pediatr. Gastroenterol. Nutr. 2001, 32, 311–315. [Google Scholar] [CrossRef]
- Yoshii, D.; Inomata, Y.; Yamamoto, H.; Irie, T.; Kadohisa, M.; Okumura, K.; Isono, K.; Honda, M.; Hayashida, S.; Oya, Y.; et al. The duodenal tube test is more specific than hepatobiliary scintigraphy for identifying bile excretion in the differential diagnosis of biliary atresia. Surg. Today 2020, 50, 1232–1239. [Google Scholar] [CrossRef]
- Rafeey, M.; Saboktakin, L.; Hasani, J.S.; Naghashi, S. Diagnostic value of anti-smooth muscle antibodies and liver enzymes in differentiation of extrahepatic biliary atresia and idiopathic neonatal hepatitis. Afr. J. Paediatr. Surg. 2016, 13, 63–68. [Google Scholar] [CrossRef]
- Rafeey, M.; Saboktakin, L.; Shoa Hassani, J.; Farahmand, F.; Aslanabadi, S.; Ghorbani-Haghjou, A.; Poorebrahim, S. Diagnostic value of procalcitonin and apo-e in extrahepatic biliary atresia. Iran J. Pediatr. 2014, 24, 623–629. [Google Scholar] [PubMed]
- Guo, Y.; Parthasarathy, S.; Goyal, P.; McCarthy, R.J.; Larson, A.C.; Miller, F.H. Magnetic resonance elastography and acoustic radiation force impulse for staging hepatic fibrosis: A meta-analysis. Abdom. Imaging 2015, 40, 818–834. [Google Scholar] [CrossRef] [PubMed]
- He, J.-P.; Hao, Y.; Wang, X.-L.; Yang, X.-J.; Shao, J.-F.; Feng, J.-X. Comparison of different noninvasive diagnostic methods for biliary atresia: A meta-analysis. World J. Pediatr. 2016, 12, 35–43. [Google Scholar] [CrossRef]
- Wang, L.; Yang, Y.; Chen, Y.; Zhan, J. Early differential diagnosis methods of biliary atresia: A meta-analysis. Pediatr. Surg. Int. 2018, 34, 363–380. [Google Scholar] [CrossRef]
- Zhou, L.; Shan, Q.; Tian, W.; Wang, Z.; Liang, J.; Xie, X. Ultrasound for the Diagnosis of Biliary Atresia: A Meta-Analysis. Am. J. Roentgenol. 2016, 206, W73–W82. [Google Scholar] [CrossRef] [PubMed]
- Sun, C.; Wu, B.; Pan, J.; Chen, L.; Zhi, W.; Tang, R.; Zhao, D.; Guo, W.; Wang, J.; Huang, S. Hepatic Subcapsular Flow as a Significant Diagnostic Marker for Biliary Atresia: A Meta-Analysis. Dis. Mrk. 2020, 2020, 5262565. [Google Scholar] [CrossRef] [Green Version]
- He, L.; Ip, D.K.M.; Tam, G.; Lui, V.C.H.; Tam, P.K.H.; Chung, P.H.Y. Biomarkers for the diagnosis and post-Kasai portoenterostomy prognosis of biliary atresia: A systematic review and meta-analysis. Sci. Rep. 2021, 11, 11692. [Google Scholar] [CrossRef]
- Kim, D.W.; Park, C.; Yoon, H.M.; Jung, A.Y.; Lee, J.S.; Jung, S.C.; Cho, Y.A. Technical performance of shear wave elastography for measuring liver stiffness in pediatric and adolescent patients: A systematic review and meta-analysis. Eur. Radiol. 2019, 29, 2560–2572. [Google Scholar] [CrossRef]
- Liu, Y.; Tan, H.-Y.; Zhang, X.-G.; Zhen, Y.-H.; Gao, F.; Lu, X.-F. Prediction of high-risk esophageal varices in patients with chronic liver disease with point and 2D shear wave elastography: A systematic review and meta-analysis. Eur. Radiol. 2022, 32, 4616–4627. [Google Scholar] [CrossRef]
- Wagner, E.S.; Abdelgawad, H.A.H.; Landry, M.; Asfour, B.; Slidell, M.B.; Azzam, R. Use of shear wave elastography for the diagnosis and follow-up of biliary atresia: A meta-analysis. World J. Gastroenterol. 2022, 28, 4726–4740. [Google Scholar] [CrossRef]
- Yan, H.; Du, L.; Zhou, J.; Li, Y.; Lei, J.; Liu, J.; Luo, Y. Diagnostic performance and prognostic value of elastography in patients with biliary atresia and after hepatic portoenterostomy: Protocol for a systematic review and meta-analysis. BMJ Open 2021, 11, e042129. [Google Scholar] [CrossRef] [PubMed]
- Yoon, H.M.; Suh, C.H.; Kim, J.R.; Lee, J.S.; Jung, A.Y.; Cho, Y.A. Diagnostic Performance of Sonographic Features in Patients With Biliary Atresia: A Systematic Review and Meta-analysis. J. Ultrasound Med. 2017, 36, 2027–2038. [Google Scholar] [CrossRef] [PubMed]
- Kianifar, H.R.; Tehranian, S.; Shojaei, P.; Adinehpoor, Z.; Sadeghi, R.; Kakhki, V.R.D.; Keshtgar, A.S. Accuracy of hepatobiliary scintigraphy for differentiation of neonatal hepatitis from biliary atresia: Systematic review and meta-analysis of the literature. Pediatr. Radiol. 2013, 43, 905–919. [Google Scholar] [CrossRef] [PubMed]
- Zhang, X.; Chen, C.; Yan, C.; Song, T. Accuracy of 2D and point shear wave elastography-based measurements for diagnosis of esophageal varices: A systematic review and meta-analysis. Diagn. Interv. Radiol. 2022, 28, 138–148. [Google Scholar] [CrossRef]
- Sandberg, J.; Sun, Y.; Ju, Z.; Liu, S.; Jiang, J.; Koci, M.; Willemink, M.; Rosenberg, J.; Rubesova, E.; Barth, R. Biliary atresia versus other causes of neonatal jaundice: What is the value of shear wave elastography complementing grayscale findings? Pediatr. Radiol. 2019, 49, S134–S135. [Google Scholar] [CrossRef]
- Dabadie, A.; Pariente, D.; Guerin, F.; Hermeziu, B.; Gonzales, E.; Adamsbaum, C.; Franchi-Abella, S. Can liver and spleen stiffness measurements help to differentiate biliary atresia from other neonatal cholestasis? Pediatr. Radiol. 2018, 48, S408. [Google Scholar] [CrossRef]
- Chen, H.; Zhou, L.; Liao, B.; Cao, Q.; Jiang, H.; Zhou, W.; Wang, G.; Xie, X. Two-Dimensional Shear Wave Elastography Predicts Liver Fibrosis in Jaundiced Infants with Suspected Biliary Atresia: A Prospective Study. Korean J. Radiol. 2021, 22, 959. [Google Scholar] [CrossRef]
- Dillman, J.R.; Heider, A.; Bilhartz, J.L.; Smith, E.A.; Keshavarzi, N.; Rubin, J.M.; Lopez, M.J. Ultrasound shear wave speed measurements correlate with liver fibrosis in children. Pediatr. Radiol. 2015, 45, 1480–1488. [Google Scholar] [CrossRef]
- Farmakis, S.G.; Buchanan, P.M.; Guzman, M.A.; Hardy, A.K.; Jain, A.K.; Teckman, J.H. Shear wave elastography correlates with liver fibrosis scores in pediatric patients with liver disease. Pediatr. Radiol. 2019, 49, 1742–1753. [Google Scholar] [CrossRef]
- Galina, P.; Alexopoulou, E.; Mentessidou, A.; Mirilas, P.; Zellos, A.; Lykopoulou, L.; Patereli, A.; Salpasaranis, K.; Kelekis, N.L.; Zarifi, M. Diagnostic accuracy of two-dimensional shear wave elastography in detecting hepatic fibrosis in children with autoimmune hepatitis, biliary atresia and other chronic liver diseases. Pediatr. Radiol. 2021, 51, 1358–1368. [Google Scholar] [CrossRef]
- Gao, F.; Chen, Y.Q.; Fang, J.; Gu, S.L.; Li, L.; Wang, X.Y. Acoustic Radiation Force Impulse Imaging for Assessing Liver Fibrosis Preoperatively in Infants With Biliary Atresia: Comparison With Liver Fibrosis Biopsy Pathology. J. Ultrasound Med. Off. J. Am. Inst. Ultrasound Med. 2017, 36, 1571–1578. [Google Scholar] [CrossRef] [PubMed]
- Hanquinet, S.; Rougemont, A.-L.; Courvoisier, D.; Rubbia-Brandt, L.; McLin, V.; Tempia, M.; Anooshiravani, M. Acoustic radiation force impulse (ARFI) elastography for the noninvasive diagnosis of liver fibrosis in children. Pediatr. Radiol. 2013, 43, 545–551. [Google Scholar] [CrossRef] [PubMed]
- Shen, Q.L.; Chen, Y.J.; Wang, Z.M.; Zhang, T.C.; Pang, W.B.; Shu, J.; Peng, C.H. Assessment of liver fibrosis by Fibroscan as compared to liver biopsy in biliary atresia. World J. Gastroenterol. 2015, 21, 6931–6936. [Google Scholar] [CrossRef] [PubMed]
- Teufel-Schäfer, U.; Flechtenmacher, C.; Fichtner, A.; Hoffmann, G.F.; Schenk, J.P.; Engelmann, G. Transient elastography correlated to four different histological fibrosis scores in children with liver disease. Eur. J. Pediatr. 2021, 180, 2237–2244. [Google Scholar] [CrossRef]
- Ding, C.; Wang, Z.; Peng, C.; Pang, W.; Tan, S.S.; Chen, Y. Diagnosis of liver cirrhosis with two-dimensional shear wave elastography in biliary atresia before Kasai portoenterostomy. Pediatr. Surg. Int. 2022, 38, 209–215. [Google Scholar] [CrossRef]
- Uchikawa, S.; Kawaoka, T.; Fujino, H.; Ono, A.; Nakahara, T.; Murakami, E.; Yamauchi, M.; Miki, D.; Imamura, M.; Aikata, H. The effect of the skin-liver capsule distance on the accuracy of ultrasound diagnosis for liver steatosis and fibrosis. J. Med. Ultrason. 2001 2022, 49, 443–450. [Google Scholar] [CrossRef]
- Voutilainen, S.; Kivisaari, R.; Lohi, J.; Jalanko, H.; Pakarinen, M.P. A Prospective Comparison of Noninvasive Methods in the Assessment of Liver Fibrosis and Esophageal Varices in Pediatric Chronic Liver Diseases. J. Clin. Gastroenterol. 2016, 50, 658–663. [Google Scholar] [CrossRef]
- Zhou, W.; Yang, Y.; Yu, C.; Liu, J.; Duan, X.; Weng, Z.; Chen, D.; Liang, Q.; Fang, Q.; Zhou, J.; et al. Ensembled deep learning model outperforms human experts in diagnosing biliary atresia from sonographic gallbladder images. Nat. Commun. 2021, 12, 1259. [Google Scholar] [CrossRef]
- Zhou, L.; Xie, J.; Gao, P.; Chen, H.; Chen, S.; Wang, G.; Zhou, W.; Xie, X. Percutaneous ultrasound-guided cholecystocholangiography with microbubbles combined with liver biopsy for the assessment of suspected biliary atresia. Pediatr. Radiol. 2022, 52, 1075–1085. [Google Scholar] [CrossRef]
- Zhou, L.-Y.; Chen, S.-L.; Chen, H.-D.; Huang, Y.; Qiu, Y.-X.; Zhong, W.; Xie, X.-Y. Percutaneous US-guided Cholecystocholangiography with Microbubbles for Assessment of Infants with US Findings Equivocal for Biliary Atresia and Gallbladder Longer than 1.5 cm: A Pilot Study. Radiology 2018, 286, 1033–1039. [Google Scholar] [CrossRef]
- Liu, Y.F.; Ni, X.W.; Pan, Y.; Luo, H.X. Comparison of the diagnostic value of virtual touch tissue quantification and virtual touch tissue imaging quantification in infants with biliary atresia. Int. J. Clin. Pract. 2021, 75, e13860. [Google Scholar] [CrossRef] [PubMed]
- Boo, Y.A.; Chang, M.H.; Jeng, Y.M.; Peng, S.F.; Hsu, W.M.; Lin, W.H.; Chen, H.L.; Ni, Y.H.; Hsu, H.Y.; Wu, J.F. Diagnostic Performance of Transient Elastography in Biliary Atresia Among Infants With Cholestasis. Hepatol. Commun. 2021, 5, 882–890. [Google Scholar] [CrossRef]
- Duan, X.; Peng, Y.; Liu, W.; Yang, L.; Zhang, J. Does Supersonic Shear Wave Elastography Help Differentiate Biliary Atresia from Other Causes of Cholestatic Hepatitis in Infants Less than 90 Days Old? Compared with Grey-Scale US. BioMed. Res. Int. 2019, 2019, 9036362. [Google Scholar] [CrossRef] [PubMed] [Green Version]
- Wu, J.-F.; Lee, C.-S.; Lin, W.-H.; Jeng, Y.-M.; Chen, H.-L.; Ni, Y.-H.; Hsu, H.-Y.; Chang, M.-H. Transient elastography is useful in diagnosing biliary atresia and predicting prognosis after hepatoportoenterostomy. Hepatology 2018, 68, 616–624. [Google Scholar] [CrossRef] [PubMed] [Green Version]
- Dillman, J.R.; DiPaola, F.W.; Smith, S.J.; Barth, R.A.; Asai, A.; Lam, S.; Campbell, K.M.; Bezerra, J.A.; Tiao, G.M.; Trout, A.T. Prospective Assessment of Ultrasound Shear Wave Elastography for Discriminating Biliary Atresia from other Causes of Neonatal Cholestasis. J. Pediatr. 2019, 212, 60–65. [Google Scholar] [CrossRef] [PubMed]
- Leschied, J.R.; Dillman, J.R.; Bilhartz, J.; Heider, A.; Smith, E.A.; Lopez, M.J. Shear wave elastography helps differentiate biliary atresia from other neonatal/infantile liver diseases. Pediatr Radiol 2015, 45, 366–375. [Google Scholar] [CrossRef]
- Sandberg, J.K.; Sun, Y.; Ju, Z.; Liu, S.; Jiang, J.; Koci, M.; Rosenberg, J.; Rubesova, E.; Barth, R.A. Ultrasound shear wave elastography: Does it add value to gray-scale ultrasound imaging in differentiating biliary atresia from other causes of neonatal jaundice? Pediatr. Radiol. 2021, 51, 1654–1666. [Google Scholar] [CrossRef]
- Wang, X.; Qian, L.; Jia, L.; Bellah, R.; Wang, N.; Xin, Y.; Liu, Q. Utility of Shear Wave Elastography for Differentiating Biliary Atresia From Infantile Hepatitis Syndrome. J. Ultrasound Med. 2016, 35, 1475–1479. [Google Scholar] [CrossRef] [Green Version]
- Zhou, L.Y.; Jiang, H.; Shan, Q.Y.; Chen, D.; Lin, X.N.; Liu, B.X.; Xie, X.Y. Liver stiffness measurements with supersonic shear wave elastography in the diagnosis of biliary atresia: A comparative study with grey-scale US. Eur. Radiol. 2017, 27, 3474–3484. [Google Scholar] [CrossRef]
- Zhou, W.; Liang, J.; Shan, Q.; Chen, H.; Gao, P.; Cao, Q.; Wang, G.; Xie, X.; Zhou, L. Comparison of Two Kinds of Two-Dimensional Shear Wave Elastography Techniques in the Evaluation of Jaundiced Infants Suspected of Biliary Atresia. Diagnostics 2022, 12, 1092. [Google Scholar] [CrossRef]
- Wang, Y.; Jia, L.Q.; Hu, Y.X.; Xin, Y.; Yang, X.; Wang, X.M. Development and Validation of a Nomogram Incorporating Ultrasonic and Elastic Findings for the Preoperative Diagnosis of Biliary Atresia. Acad. Radiol. 2021, 28 (Suppl. S1), S55–S63. [Google Scholar] [CrossRef] [PubMed]
- Liu, Y.; Peng, C.; Wang, K.; Wu, D.; Yan, J.; Tu, W.; Chen, Y. The utility of shear wave elastography and serum biomarkers for diagnosing biliary atresia and predicting clinical outcomes. Eur. J. Pediatr. 2022, 181, 73–82. [Google Scholar] [CrossRef] [PubMed]
- Shen, Q.; Tan, S.S.; Wang, Z.; Cai, S.; Pang, W.; Peng, C.; Chen, Y. Combination of gamma-glutamyl transferase and liver stiffness measurement for biliary atresia screening at different ages: A retrospective analysis of 282 infants. BMC Pediatr. 2020, 20, 276. [Google Scholar] [CrossRef] [PubMed]
- Hanquinet, S.; Courvoisier, D.S.; Rougemont, A.-L.; Dhouib, A.; Rubbia-Brandt, L.; Wildhaber, B.E.; Merlini, L.; McLin, V.A.; Anooshiravani, M. Contribution of acoustic radiation force impulse (ARFI) elastography to the ultrasound diagnosis of biliary atresia. Pediatr. Radiol. 2015, 45, 1489–1495. [Google Scholar] [CrossRef]
- Wang, G.; Zhang, N.; Zhang, X.; Zhou, W.; Xie, X.; Zhou, L. Ultrasound characteristics combined with gamma-glutamyl transpeptidase for diagnosis of biliary atresia in infants less than 30 days. Pediatr. Surg. Int. 2021, 37, 1175–1182. [Google Scholar] [CrossRef]
- Baratloo, A.; Hosseini, M.; Negida, A.; El Ashal, G. Part 1: Simple Definition and Calculation of Accuracy, Sensitivity and Specificity. Emergency 2015, 3, 48–49. [Google Scholar]
- Lee, S.; Kim, M.-J.; Lee, M.-J.; Yoon, H.; Han, K.; Han, S.J.; Koh, H.; Kim, S.; Shin, H.J. Hepatic subcapsular or capsular flow in biliary atresia: Is it useful imaging feature after the Kasai operation? Eur. Radiol. 2020, 30, 3161–3167. [Google Scholar] [CrossRef]
- Sterne, J.A.C.; Sutton, A.J.; Ioannidis, J.P.A.; Terrin, N.; Jones, D.R.; Lau, J.; Carpenter, J.; Rucker, G.; Harbord, R.M.; Schmid, C.H.; et al. Recommendations for examining and interpreting funnel plot asymmetry in meta-analyses of randomised controlled trials. BMJ 2011, 343, d4002. [Google Scholar] [CrossRef] [Green Version]
- Egger, M.; Smith, G.D.; Schneider, M.; Minder, C. Bias in meta-analysis detected by a simple, graphical test. BMJ 1997, 315, 629–634. [Google Scholar] [CrossRef] [Green Version]
- Page, M.J.; Sterne, J.A.C.; Higgins, J.P.T.; Egger, M. Investigating and dealing with publication bias and other reporting biases in meta-analyses of health research: A review. Res. Synth. Methods 2021, 12, 248–259. [Google Scholar] [CrossRef]


| Author(s), Year | Ref | Country | Type of Patient | Patients (n) | Age (Days) | ||||
|---|---|---|---|---|---|---|---|---|---|
| Total (n = 2185) | BA (n = 1105) | Non-BA (n = 1080) | Overall Age | BA | Non-BA | ||||
| Liu et al. (2021) | [61] | China | Infants with Cholestasis | 59 | 26 | 33 | NA | a 72.5 ± 29.0 (30–127) | a 81.3 ± 35.2 (25–141) |
| Boo et al. (2021) | [62] | Taiwan | Cholestatic infants | 61 | 15 | 46 | NA | a 45 (13–121); b 30 (22–63) | b 35.5 (24–51.3) |
| Chen et al. (2020) | [11] | China | Cholestatic infants | 495 (R 308; P 187) | 293 (R 186; P 107) | 202 (R 122; P 80) | a 52.4 ± 19.5 | aR 55.2 (19.7) aP 51.0 (18.8) | aR 51.9 (18.8) aP 45.8 (26.8) |
| Duan et al. (2019) | [63] | China | Cholestatic hepatitis | 138 | 51 | 87 | NA | c 43 (5–88) days | c 30 (5–90) |
| Wu et al. (2018) | [64] | Taiwan | Cholestatic infants | 48 | 15 | 33 | a 45.87 (9–87) | b 45 (34.5–60.5) | b 40 (27–56) |
| Dillman et al. (2019) | [65] | USA | Neonatal cholestasis | 41 | 13 | 28 | b 37 (24–52) | ||
| Leschied et al. (2015) | [66] | USA | Infantile liver disease | 11 | 6 | 5 | a 107 (42–336) | a 79 (range 42–196) | a 140 (56–336) |
| Liu et al. (2022) | [72] | China | Infantile cholestasis | 156 | 83 | 73 | b 36 days (25–41) | NA | NA |
| Sandberg et al. (2021) | [67] | China | Cholestatic jaundice | 318 | 212 | 106 | NA | a 59.7 ± 18.8 (20–114) | a 65.7 ± 25.6 (9–186) |
| Shen et al. (2020) | [73] | China | Cholestatic jaundice | 282 | 135 | 147 | NA | a 59 ± 18.8 | a 70 ± 20.4 |
| Wang et al. (2016) | [68] | China | Cholestatic hepatitis | 55 | 38 | 17 | NA (16–140) | a 42 | a 50 |
| Zhou et al. (2017) | [69] | China | Cholestatic infants | 172 | 97 | 75 | NA | a 65.3 ± 20.5 (26–134) | a 62.4 ± 22.0 (2–140) |
| Zhou et al. (2022) | [70] | China | Cholestatic infants | 35 | 22 | 13 | NA | b 61 (45–75) | b 69 (50–87) |
| Wang et al. (2021) | [75] | China | Cholestatic infants | 294 (T 150; V 144) | 89 (T 150; V 144) | 205 (T 150; V 144) | a 42.94 (4–67) | bT 46 (33–54) bV 50 (33–57) | bT 47 (33–54) bV 44 (33–57) |
| Hanquinet et al. (2015) | [74] | Switzerland | Cholestatic infants | 20 | 10 | 10 | 52.1 ± 29.2 | NA | NA |
| Author(s), Year. | Ref | Study Design | Type of Ultrasoumd Machine | Ultrasound Technique | Reference Standard | Ultrasound Parameter |
|---|---|---|---|---|---|---|
| Liu et al. (2021) | [61] | Prospective single center cohort | Siemens Acuson OXANA2 (Siemens Healthcare, Erlangen, Germany) with a 3–5.5 MHz 6C1 convex transducer probe and a 4–9 MHz 9L4 linear array probe. | VTQ and VTIQ | Surgical exploration | mean VTQ & VTIQ SWV |
| Boo et al. (2021) | [62] | prospective cohort study | TE (FibroScan 502 Touch; Echosens, Paris, France), S1 probe (5 MHz) | TE | IOC, surgical | Median TE kPa |
| Chen et al. (2020) | [11] | Prospective and retrospective analysis single center | Siemens Acuson S2000 (Siemens Medical Solutions) with a 4- to 9-MHz linear transducer. | VTQ | IOC and Intraoperative biopsy | median VTQ SWV |
| Duan et al. (2019) | [63] | Prospective, single center. | TUS-Aplio 500 scanner (Toshiba Medical Systems, Tokyo, Japan).14L5 linear array probe (10 MHz) | VTIQ | KPE and liver biopsy | Mean VTIQ kPa |
| Wu et al. (2018) | [64] | Prospective, single center | TE (Fibroscan 502 Touch; Echosens, Paris, France) S1 probe (5 MHz) | TE | IOC and liver biopsies | Median (kPa) |
| Dillman et al. (2019) | [65] | Prospective, multi-center study. | Acuson S2000 or S3000 (Siemens Healthcare, Erlangen, Germany); 9L4 linear transducer probe | VTIQ and VTQ | Not specified | Median VTQ and VTIQ SWV |
| Leschied et al. (2015) | [66] | Single-center retrospective | Acuson S3000 US system/ 9L4 transducer (Siemens Medical Solutions USA, Malvern, PA) | VTQ and VTIQ | liver biopsy andIOC | 1. mean VTQ and VTIQ |
| Liu et al. (2022) | [72] | single-center retrospective study | Aixplorer ultrasound system (SuperSonic Imagine SA, Aix-en-Provence, France) with an L15-4 linear probe | VTIQ | IOC and Biopsy | |
| Sandberg et al. (2021) | [67] | prospective cohort | (Siemens), with C6 and L9 transducers, | VTQ & VTIQ 2 transducers & 2 ROI | biopsy | Median SWV |
| Shen et al. (2020) | [73] | retrospective | Aixplorer ultrasound system(SuperSonic Imagine SA, Aix-en-Provence, France), and L15–4 linear probe. | VTIQ | Kasai surgery | mean SWE kPa |
| Wang et al. (2016) | [68] | Single-center case control | Aixplorer ultrasound system (SuperSonic Imagine SA, Aix-en-Provence, France), an L15-4 linear probe. | VTIQ | Kasai surgery | mean SWE kPa |
| Zhou et al. (2017) | [69] | Single-center prospective cohort study | AixPlorer scanner (Supersonic Imagine, Paris, France) with a(1 to 6 MHz curvilinear transducer and 4 to 15 MHz linear array transducer 2.A linear array transducer (SL15-4) | VTIQ | surgical exploration, IOC and liver biopsy | Median kPA |
| Zhou et al. (2022) | [70] | Single-center prospective cohort study | Aixplorer scanner (SuperSonic Imagine, Aix-en-Provence, France), linear array transducer SL15-4 (5 to 14 MHz). Toshiba T-SWE used Aplio500 (Canon Medical System, Otawara, Tochigi, Japan), a linear array transducer 14-L5 (5 to 14 MHz) | S-SWE and T-SWE | surgical exploration, IOC and liver biopsy | mean SWE kPa |
| Wang et al. (2021) | [75] | Single-center prospective analysis | 1. Aixplorer US system (SuperSonic Imagine, Aix-en-Provence, France), with linear probe. 2. HI VISION Ascendus (Hitachi Medical Systems, Japan) equipped with a 5–13 MHz linear-array transducer | VTIQ (2D SWE) training and validation groups | IOC | Mean SWEkPa |
| Hanquinet et al. (2015) | [74] | retrospective | Acuson® S2000 or S3000 US machine (Siemens Healthcare, Erlangen, Germany) a linear 9-MHz probe | VTQ | IOC & Liver biopsy | mean VTQ SWV |
| Author(s), Year | Ref | Elastography Technique | Hepatic Young’s Modulus (kPA) | SWV(m/s) | Main Finding | ||
|---|---|---|---|---|---|---|---|
| BA | Non BA | BA | Non BA | ||||
| Liu et al. (2021) | [61] | VTIQ | NA | NA | a 2.43 ± 0.29 | a 1.52 ± 0.29 | VTQ and VTIQ can help distinguish BA from non-BA; VTIQ has higher sensitivity and specificity than VTQ |
| [61] | VTQ | NA | NA | a 2.36 ± 0.36) | a 1.30 ± 0.28 | ||
| Boo et al. (2021) | [62] | (≤30) TE | b 8.4 (6.8–16.8) ab 10.1 (2.9) | b 4.2 (3.3–5.4) ab 4.3 (0.64) | Statistically significant difference between BA and non-BA TE values. A cutoff LSM > 7.7 kPa had high diagnostic accuracy for BA in all age groups, except for the group of 91–180 days of age. | ||
| [62] | (31–60) TE | b 10 (5.5–13) ab 9.63 (2.15) | b 5.4 (3.8–6.2) ab 5.2 (0.72) | ||||
| [62] | (61–90) TE | b 19.4 (19.1–19.7) ab 19.4 (0.27) | b 5.5 (4.5–6.1) ab 5.4 (0.51) | ||||
| [62] | (91–180) TE | b 40.8 (26–55.5) ab 40.78 (8.52) | b 3.8 (3.2–8.8) ab 4.9 (1.65) | ||||
| Chen et al. (2020) | [11] | VTQ | a 1.77 (0.39) | a 1.30 (0.29) | Mean SWV is significantly higher in BA than in other causes of cholestasis, p< 0.001. | ||
| Duan et al. (2019) | [63] | T-SWE-VTQ | a 17.59 ± 5.65 | a 9.84 ± 1.49 | Both SWE and grayscale ultrasound have good performance in diagnosing BA. SWE increases the diagnostic specificity when combined with grayscale ultrasound. | ||
| [63] | T-SWE VTIQ) | a 17.94 ± 6.44 | a 9.91 ± 2.00 | ||||
| Wu et al. (2018) | [64] | TE | b 10.50 (8.50–20.90) ab 12.6 (3.61) | b 4.60 (3.90–6.00) ab 4.78 (0.64) | LSM assessment during the workup of cholestatic infants may facilitate the diagnosis of BA. | ||
| Dillman et al. (2019) | [65] | 2DSWE VTIQ | b 2.08 (1.90–2.50) ab 2.14 (0.27) | b 1.49 (1.34–1.80) ab 1.53 (0.24) | SWV were significantly different between BA and non-BA subjects, p = 0.0001 SWE showed better diagnostic performance for distinguishing BA from non-BA causes of neonatal cholestasis, p = 0.0014. | ||
| [65] | Point SWE VTQ | b 1.95 (1.48–2.42) ab 1.95 (0.34) | b 1.21 (1.12–1.51) ab 1.26 (0.23) | ||||
| Leschied et al. (2015) | [66] | VTQ | a 2.08 ± 0.17 (1.90–2.30) | a 1.28 ± 0.13 (1.09–1.44) | A significant difference between the VTQ mean SWV of the BA and non-BA groups, p< 0.0001. The mean color pixel values were significantly different between BA and non-BA subjects, p < 0.0001. | ||
| [66] | VTIQ | a 3.14 ± 0.73 (2.24–4.40) | a 1.61 ± 0.23 (1.34–1.87) | ||||
| Liu et al. (2022) | [72] | S-SWE | b 9.37 (7.30–11.45) ab 9.37 (1.22) | b 6.50 (5.95–7.65) ab 6.65 (0.53) | LSM measurement by SWE & Serum GGT level showed the best performances for differentiating BA fromNon BA LSM diagnostic value increased with age, and AUC = 0.91 in patients of (30–45) versus 0.74 in 1 (5–30) days old, p < 0.01. | ||
| Sandberg et al. (2021) | [67] | C6 VTQ 2.5 | b 1.9 (1.6–2.3) ab 1.93 (0.29) | b 1.59 (1.3–1.7) ab 1.55 (0.23) | SWE had significantly better performance in differentiating BA from non-BA cases when compared to grayscale ultrasound. | ||
| [67] | C6 VTQ 3.5 | b 1.9 (1.6–2.3) ab 1.93 (0.29) | b 1.4 (1.3–1.7) ab 1.45 (0.2) | ||||
| [67] | L9 VTQ | b 2.1 (1.7–2.4) ab 2.08 (0.29) | b 1.5 (1.3–1.9) ab 1.55 (0.27) | ||||
| [67] | L9 VTIQ | b 2.2 (1.9–2.5) ab 2.2 (2.7) | b 1.8 (1.6–2.1) ab 1.83 (0.25) | ||||
| Shen et al. (2020) | [73] | 2D S-SWE | a 12 (6.0) | a 8.1 (3.3) | Parallel testing of GGT and LSM in infants < 90 days decreases the rate of BA misdiagnosis, p < 0.001. | ||
| Wang et al. (2016) | [68] | 2D S-SWE | a 20.46 ± 10.19 | a 6.29 ± 0.99 | Mean SWE values were significantly higher in BA than non-BA hepatitis syndrome and control groups, p< 0.01. | ||
| Zhou et al. (2017) | [66] | 2D S-SWE | b 12.6 (10.6–18.8) ab 13.65 (2.39) | b 9.6 (7.5–11.7) ab 9.6 (1.23) | Diagnostic performance of LSM values in identifying BA was lower than that of grayscale ultrasound, p < 0.001. S-SWE was comparable to T-SWE (AUC 0.895 vs. 0.822, p = 0.071) in diagnosing BA. T-SWE had good performances in the diagnosis of BA and the assessment of liver fibrosis compared with S-SWE, p < 0.002. | ||
| Zhou et al. (2022) | [70] | 2D S-SWE | a 14.0 (11.1–20.0) | a 8.2 (7.1–9.7) | |||
| [70] | 2D T-SWE | a 11.0 (9.1–13.5) | a 8.5 (6.5–9.2) | ||||
| Wang et al. (2021) | [75] | 2D S-SWE (TC) | b 9.9 (8.4–14.3) ab 10.63 (1.7) | b 6.6 (5.7–7.5) ab 6.6 (0.56) | Age (p = 0.009), gallbladder morphology (p = 0.001) and hepatic elasticity (p < 0.001) are independent predictive factors to differentiate between BA and other causes of cholestasis. | ||
| [75] | 2D S-SWE (VC) | b 11.1 (8.7–12.8) ab 10.93 (1.2) | b 6.3 (5.3–7.7) ab 6.4 (0.72) | ||||
| Hanquinet et al. (2015) | [74] | VTQ | a 2.2 (0.4) | a 1.7 (0.6) | Significance difference between BA and non-BA SWV, p = 0.049 | ||
| Author (s) | Ref | Elastography Technique | Cutoff Value | Sen (%) | Spec (%) | PPV (%) | NPV (%) | AUC | DA | BA(n) | Non-BA(n) | TP | TN | FP | FN |
|---|---|---|---|---|---|---|---|---|---|---|---|---|---|---|---|
| Liu et al. (2021) | [61] | VTIQ | 1.92 | 95.5 | 78.9 | NA | NA | 0.92 | NA | 26 | 33 | 24.83 | 26.04 | 6.96 | 1.17 |
| [61] | VTQ | 1.77 | 90.9 | 68 | NA | NA | 0.89 | NA | 26 | 33 | 23.63 | 22.44 | 10.56 | 2.37 | |
| Chen et al. (2020) | [11] | VTQ | 1.35 | 98.7 | 91.4 | 94 | 98.1 | 0.98 | 93.6 | 293 | 202 | 289.1 | 184.63 | 17.37 | 3.809 |
| Dillman et al. (2019) | [65] | 2DSWE VTIQ | 1.84 | 92.3 | 78.6 | 66.7 | 95.7 | 0.89 | NA | 13 | 28 | 12 | 22.01 | 6 | 1.00 |
| [65] | Point SWE VTQ | 1.53 | 76.9 | 78.6 | 62.5 | 88 | 0.81 | NA | 13 | 28 | 9.99 | 22.01 | 5.99 | 3.003 | |
| Leschied et al. (2015) | [66] | Mean SWV VTQ | NA | NA | NA | NA | NA | NA | NA | 6 | 5 | NA | NA | NA | NA |
| [66] | Mean SWV VTIQ | NA | NA | NA | NA | NA | NA | NA | 6 | 5 | NA | NA | NA | NA | |
| Sandberg et al. (2021) | [67] | C6 VTQ 2.5 | 1.5 | 78 | 64 | NA | NA | 0.8 | NA | 212 | 106 | 165.36 | 67.84 | 38.16 | 46.64 |
| [67] | C6 VTQ 3.5 | 1.6 | 74 | 72 | NA | NA | 0.8 | NA | 212 | 106 | 156.88 | 76.32 | 29.68 | 55.12 | |
| [67] | L9 VTQ | 1.6 | 80 | 64 | NA | NA | 0.8 | NA | 212 | 106 | 169.6 | 67.84 | 38.16 | 42.4 | |
| [67] | L9 VTIQ | 2 | 71 | 67 | NA | NA | 0.7 | NA | 212 | 106 | 150.52 | 71.02 | 34.98 | 61.48 | |
| Boo et al. (2021) | [62] | (91–180) TE | 8.8 | 100 | 100 | 100 | 100 | 100 | 100 | 2 | 3 | 2 | 3 | 0 | 0 |
| [62] | (≤30) TE | 7.7 | NA | NA | 100 | 90.9 | NA | 92.9 | 8 | 20 | NA | NA | NA | NA | |
| [62] | (31–60) TE | 7.7 | NA | NA | 100 | 94.7 | NA | 95.3 | 3 | 18 | NA | NA | NA | NA | |
| [62] | (61–90) TE | 7.7 | NA | NA | 100 | 100 | NA | 100 | 2 | 5 | NA | NA | NA | NA | |
| [62] | (91–180) TE | 7.7 | NA | NA | 66.7 | 100 | NA | 80 | 2 | 3 | NA | NA | NA | NA | |
| Duan et al. (2019) | [63] | T-SWE-VTQ-f | 12.35 | 84.3 | 89.7 | 82.7 | 90.7 | 0.937 | 87.7 | 33 | 29 | 27.82 | 26.013 | 2.987 | 5.181 |
| [63] | T-SWE VTIQ-M | 12.35 | 66.7 | 100 | 100 | 83.6 | 0.833 | 87.7 | 18 | 58 | 12.0 | 58 | 0 | 5.99 | |
| Wu et al. (2018) | [64] | TE | 7.7 | 80 | 97 | NA | NA | 85.3 | NA | 15 | 33 | 12 | 32.01 | 0.99 | 3 |
| Liu et al. (2022) | [72] | S-SWE | 7.1 | 81.3 | 69.86 | NA | NA | 0.82 | NA | 83 | 73 | 68.00 | 50.9978 | 22.02 | 14.9981 |
| Shen et al. (2020) | [73] | 2D S-SWE | 9.5 | 73.3 | 70.1 | 69.2 | 74.1 | 0.771 | NA | 135 | 147 | 98.96 | 103.047 | 43.95 | 36.045 |
| Wang et al. (2016) | [68] | 2DS-SWE | 9.5 | 97.4 | 100 | 100 | 96.9 | 0.997 | NA | 38 | 17 | 37.01 | 17 | 0 | 0.988 |
| Zhou et al. (2017) | [69] | 2DS-SWE | 10.2 | 81.4 | 66.7 | 76 | 73.5 | 0.79 | NA | 97 | 75 | 78.96 | 50.025 | 24.975 | 18.042 |
| Zhou et al. (2022) | [70] | 2DS-SWE | 10.2 | 77.3 | 84.6 | 89.5 | 68.8 | 0.895 | 80 | 22 | 13 | 17.0 | 10.998 | 2.002 | 4.994 |
| [70] | 2D T-SWE | 8.7 | 86.4 | 76.9 | 86.4 | 76.9 | 0.822 | 82.9 | 22 | 13 | 19.0 | 9.997 | 3.003 | 2.992 | |
| Wang et al. (2021) | [75] | 2D S-SWE-TV | 7.81 | 87.6 | 78.5 | 63.9 | 93.6 | 0.888 | 81.3 | 89 | 205 | 77.964 | 160.925 | 44.075 | 11.036 |
| [75] | 2D S-SWE-N | 7.81 | 95.5 | 83.4 | 71.4 | 97.7 | 0.94 | 87.1 | 89 | 205 | 85 | 171 | 34. | 4.00 | |
| Hanquinet et al. (2015) | [74] | VTQ | NA | NA | NA | NA | NA | NA | NA | 10 | 10 | NA | NA | NA | NA |
| Aurthor(S), Year | Ref | Risk Of Bias | Applicability Concerns | |||||
|---|---|---|---|---|---|---|---|---|
| Patient Selection | Index Test | Reference Standard | Flow and Timing | Patient Selection | Index Test | Reference Standard | ||
| Liu et al. (2021) | [61] | Unclear | Low | Low | Low | Low | Low | Low |
| Boo et al. (2021) | [62] | Low | Low | Low | Low | Low | Low | Low |
| Chen et al. (2020) | [11] | Low | Low | Low | Low | Low | Low | Low |
| Duan et al. (2019) | [63] | Low | Low | Low | Low | Low | Low | Low |
| Wu et al. (2018) | [64] | Low | Low | Low | Low | Low | Low | Low |
| Dillman et al. (2019) | [65] | High | Low | Unclear | Low | Low | Low | Unclear |
| Leschied et al. (2015) | [66] | Low | Low | Low | Low | Low | Low | Low |
| Liu et al. (2022) | [72] | Low | Low | Low | Unclear | Low | Low | Low |
| Sandberg et al. (2021) | [67] | Low | Low | Low | Low | Low | Low | Low |
| Shen et al. (2020) | [73] | Low | Low | Low | Low | Low | Low | Low |
| Wang et al. (2016) | [68] | Low | Low | Low | Low | Low | Low | Low |
| Zhou et al. (2017) | [69] | Low | Low | Low | Low | Low | Low | High |
| Zhou et al. (2022) | [70] | Low | Low | Low | Low | Low | Low | High |
| Wang et al. (2021) | [75] | Low | Low | Low | Low | Low | Low | Low |
| Hanquinet et al. (2015) | [74] | Unclear | Low | Low | Low | Low | Low | Low |
Publisher’s Note: MDPI stays neutral with regard to jurisdictional claims in published maps and institutional affiliations. |
© 2022 by the authors. Licensee MDPI, Basel, Switzerland. This article is an open access article distributed under the terms and conditions of the Creative Commons Attribution (CC BY) license (https://creativecommons.org/licenses/by/4.0/).
Share and Cite
Gunda, S.T.; Chambara, N.; Chen, X.F.; Pang, M.Y.C.; Ying, M.T.-c. Diagnostic Efficacy of Advanced Ultrasonography Imaging Techniques in Infants with Biliary Atresia (BA): A Systematic Review and Meta-Analysis. Children 2022, 9, 1676. https://doi.org/10.3390/children9111676
Gunda ST, Chambara N, Chen XF, Pang MYC, Ying MT-c. Diagnostic Efficacy of Advanced Ultrasonography Imaging Techniques in Infants with Biliary Atresia (BA): A Systematic Review and Meta-Analysis. Children. 2022; 9(11):1676. https://doi.org/10.3390/children9111676
Chicago/Turabian StyleGunda, Simon Takadiyi, Nonhlanhla Chambara, Xiangyan Fiona Chen, Marco Yiu Chung Pang, and Michael Tin-cheung Ying. 2022. "Diagnostic Efficacy of Advanced Ultrasonography Imaging Techniques in Infants with Biliary Atresia (BA): A Systematic Review and Meta-Analysis" Children 9, no. 11: 1676. https://doi.org/10.3390/children9111676