1. Introduction and Literature Review
Risk management is the cornerstone of the insurance industry. It not only ensures the financial stability and the regulatory compliance of the insurance companies, but also facilitates the strategic growth. It allows the insurance companies to identify and mitigate potential risks to help maintain the solvency and the confidence of the policyholders. The process of loss reserving is key to a successful risk management program. There have been a variety of different approaches to loss reserving in the insurance industry but only few freely available tools for practitioners. In this paper, we introduce AutoReserve, which utilizes three different loss reserving approaches: loss data summary, classical loss reserving, and machine learning loss reserving. The purpose of the Loss Data Summary module (
Hewitt and Lefkowitz 1979) is to equip the user with a comprehensive tool for the initial analysis of loss data. This module offers features such as data distribution visualization, automated pivot tables, and data dashboards. By providing this information, it enables actuaries to gain a holistic understanding of the loss data before commencing the estimation of loss reserves. Classical loss reserving (
Huang et al. 2015) provides an online version of the ChainLadder package and spreadsheet tool. The online ChainLadder tool comes with a graphic user interface (GUI), which has a series of different methods for loss reserving evaluation and ultimate loss forecasting. The spreadsheet module uses the chain ladder method (
Mack 1993) to project ultimate claims. The Machine Learning Loss Reserving module (
Taylor 2019;
Taylor and McGuire 2016) allows users to choose from various machine learning methods for loss reserving. AutoReserve provides its users with free and easy access to both traditional and machine learning loss reserving techniques. Currently, there is a lack of free software in the industry that provides access to loss reserving techniques, especially machine-learning-based methods. AutoReserve aims to fill that gap. With this tool, actuaries will be able to have a more organized, efficient, and diversified approach to risk management. They will be able to compare results from several different risk management methods before settling on the best approach for their specific situation.
Loss reserving is a very important and challenging job for actuaries, not only because of the complexity of the valuation techniques and its importance to the company, but also because actuaries require a lot of subjective judgment. The purpose of reserve estimation is mainly for supporting the following:
The company’s business plan and insurance claim management (
Kasturi 2006).
Having sufficient reserves is extremely important to ensure that insurance companies have sufficient solvency. Without a reasonable assessment of the loss reserving fund, it is impossible to make a correct judgment on the financial status of the insurance company. Evaluating the loss reserve fund will also help the insurance company estimate the cash flow of future claims and help the company make an appropriate business plan.
Insurance companies maintain different types of reserves. Our primary focus in this paper is liability reserves, which can be divided into reserves for claim liabilities and reserves for premium liabilities. Under claim liability, one can consider reserves for reported but not fully settled (RBNS) claims and incurred but not reported (IBNR) claims. The AutoReserve tool focuses on calculating these claim liability reserves using various techniques. Next, we discuss the current state of actuarial software.
Actuaries use spreadsheets as well as other software for loss modeling and loss reserving. We can divide these actuarial software into open-source vs. copyrighted ones or “code” vs. “no code” software. The actuar (
Dutang et al. 2008) package introduces various R functions needed in loss distribution modeling, risk theory, simulation of compound hierarchical models, and ratemaking. The current version 3.3 allows actuaries to use a wide variety of heavy-tailed distributions specifically used in loss modeling. The package can be used with custom R codes and is freely available for actuaries under GPL-2 and GPL-3 licenses. Another freely available R package for actuarial science is lifecontingencies (
Spedicato 2013). The current version 1.3.9 allows for the calculation of quantities related to life contingent products such as life annuity, an insurance benefit, etc. RiskDemo (
Luoma et al. 2021) is an R plugin that can be used to demonstrate various actuarial tasks. Compared to other R packages, this plugin allows for various graphical representations such as bond yield curves, mortality curves, etc. Moody’s analytics AXIS Actuarial System (
Moody’s Analytics 2022) is copyrighted, commercial software. The system is available in standalone software as well as cloud-based ones. It can be used for reserving, asset and liability management, pricing, financial modeling, capital calculation, hedging, and financial framework. The software supports the International Financial Reporting Standard 2017 (IFRS 17) for new insurance contracts. This software falls under the “no code” type since it does not allow actuaries to add custom functions or change existing ones but only to change input parameters and feed data as requested. PolySystem actuarial software (
Polysystem 2021) is another copyrighted, commercially available, “no code” software. The user can carry out multiple actuarial tasks by feeding input data. ARCVAL software, provided by
Actuarial Resources Corporation (
2022), is copyrighted, “no code” software used for financial reporting in universal life, traditional life, annuities, structures settlement, and health. The ULtraVAL module in ARCVAL allows the calculation of Statutory, Tax, and alternative minimum reserves set by the National Association of Insurance Commissioners. This is a useful tool for casualty actuaries.
Prophet (
2022) and
Slope (
2022) are two other copyrighted, commercial software related to actuarial science. These software allow some coding, thus giving an actuary the chance to modify existing codes to match their specific needs. Prophet and SLOPE have pre-existing templates which can be tweaked according to actuary needs. SLOPE is a cloud-based software. Next, Arius is a software developed by
Milliman (
2022) for analyzing unpaid claims liabilities. The tool is intended for property and casualty actuaries, who can use it to calculate casualty reserves and ultimate loss costs. The software has enterprise solutions as well as others such as Triangle on Demand and Claim Variability Benchmarks
Nair and Closs (
2006). This software is also copyrighted and commercially available. ICRFS software by
Insureware (
2023) is another commercially available software for actuarial loss reserving. This software allows user to find the optimal statistical model, select multiple lines of business, measure various trends, obtain risk matrices for ORSA or Solvency II, calculate various reserves, and so on.
In the last decade, various literature have expanded our understanding of loss reserving in the insurance industry. This literature can be divided into two main categories, namely, focusing on loss reserving based on aggregate models or individual models. Popular loss reserving models such as
Bornhuetter and Ferguson (
1972) and the chain ladder (
Mack 1993) models come under aggregate models. These models are expanded to include stochastic factors and multiple business lines by many researchers. Notably, Taylor and McGuire in their work “Stochastic Loss Reserving using Generalized Linear Models” (
Taylor and McGuire 2016) extensively explored the application of the generalized linear model (GLM) in loss reserving with emphasis on the chain ladder method. They described the strategy for model testing, error estimation using Bootstrap, and dealing with model failures and time-heterogeneity, offering practical solutions to expand and enhance the traditional loss reserving techniques. Moreover, in “Chain ladder method: Bayesian bootstrap versus classical bootstrap”,
Peters et al. (
2010) proposed a normal approach to estimate a Bayesian distribution-free chain ladder model, leveraging the approximate Bayesian computation, Markov chain Monte Carlo technique, and Bayesian bootstrap procedure in a truly distribution-free setting, aiming to enhance the prediction of loss reserving and capital estimation. Shi and Frees’ research “Dependent Loss Reserving using Copulas” (
Shi and Frees 2011) and proposed a multivariable dependent loss reserving framework using copulas. This work offers valuable insights into how to model multiple business lines with dependent relationships and include them in the loss reserving procedure. At the individual level, stochastic loss reserving methods have been studied by many authors. The mathematical framework was developed by
Arjas (
1989),
Haastrup and Arjas (
1996), and
Norberg (
1993,
1999).
Antonio and Plat (
2014) conducted a detailed case study to find the performance of these individual-level stochastic loss reserving approaches and concluded that micro-level loss reserving provides a better claim process modeling. Machine learning models based on various individual loss reserving approaches have been studied by many authors, including
Wüthrich (
2018a),
Duval and Pigeon (
2019),
Baudry and Robert (
2019),
Delong et al. (
2022),
Kuo (
2020), and
Manathunga and Zhu (
2022), to name few. A detailed list of loss reserving research articles was prepared by
Schmidt (
2011).
In the field of insurance company solvency assessment research, there are several notable studies to mention.
Xiong and Hong (
2020) proposed a Monte Carlo simulation-based solvency rating framework for workers’ competition captive insurance companies.
Xiong (
2020) used regular expression to extract data from nearly 15 years of PDF publications of NAIC IRIS ratios manuals and assembled them as a comprehensive data table. Various machine learning methods were then applied to build the predictive modeling to evaluate the property and casualty insurance company solvency using these 13 IRIS ratios.
Xiong and Hong (
2022) further refined the solvency predictive framework proposed by
Xiong and Hong (
2020) and developed a corresponding VBA software for the use of captive insurance company managers.
3. Shiny R
In this section, we would like to give a brief introduction to Shiny R. In the book “R Data Science” (
Koushik and Ravindran 2016), Hardley Wickham sees “communication” as a critical part of a data science project. A highly effective way to communicate with users is to combine interactivity with data reporting. Shiny is an R package for building interactive web applications. It was developed by RStudio and is one of the most powerful and characteristic tools in R. Shiny allows users to interactively change the code that is run and the data that is output. Using Shiny, one can quickly build prototypes of data products or dynamically display data analysis/modeling results. One of the main advantages of Shiny is the easiness to build interactive web applications directly from R. A user can host Shiny-based programs as stand-alone applications on web pages or embed them in R Markdown documents or build dashboards. Shiny applications can also be extended with CSS themes, HTML widgets, and JavaScript actions. It combines the computing power of R with the interactivity of the Web and can easily complete a Web interactive application without much knowledge of web development. The basic underlying structure of Shiny-based R code can be described as follows:
Sharing data with users requires the developer’s code to perform two distinct tasks: First, it needs to process and analyze the information, and then present it to the user for viewing. Second, through interactive applications, users can interact with the displayed data. The data needs to be reprocessed with the information entered by the user, and then the output is redisplayed. Therefore, a shiny app consists of two parts: one is the HTTP server (Server) that interacts with the web browser, and the other is the user interface (UI) that interacts with the server. Because Shiny renders the user interface in the web browser, it actually generates a website. In other words, the shiny framework will create all the necessary components (HTML elements), their styles (CSS rules), and scripts (JavaScript code) for interactivity. But as an integral part of R, shiny code can be written entirely in R, and it does not require developers to master profound knowledge of web development.
5. Loss Data Summary
The purpose of the Loss Data Summary module is to provide the user with a tool for preliminary analysis of the loss data that includes visualization of data distribution, automated pivot tables, and data dashboards. This information helps the actuary envision an overall picture of the loss data before starting the loss reserving estimation.
In this module, the user will upload his or her loss data to the server. AutoReserve requires data to be formatted in a certain way before it accepts and interacts with the data. The loss data must be formatted in the same way as the given sample data as shown in
Table 1. This requires the Loss Date in the first column and the claim Total Incurred in the second column. The data should be saved in a CSV file. The CSV file can then be uploaded to the app by clicking the “Browse” button in the control panel. If the data is formatted correctly, the app should process the data from there.
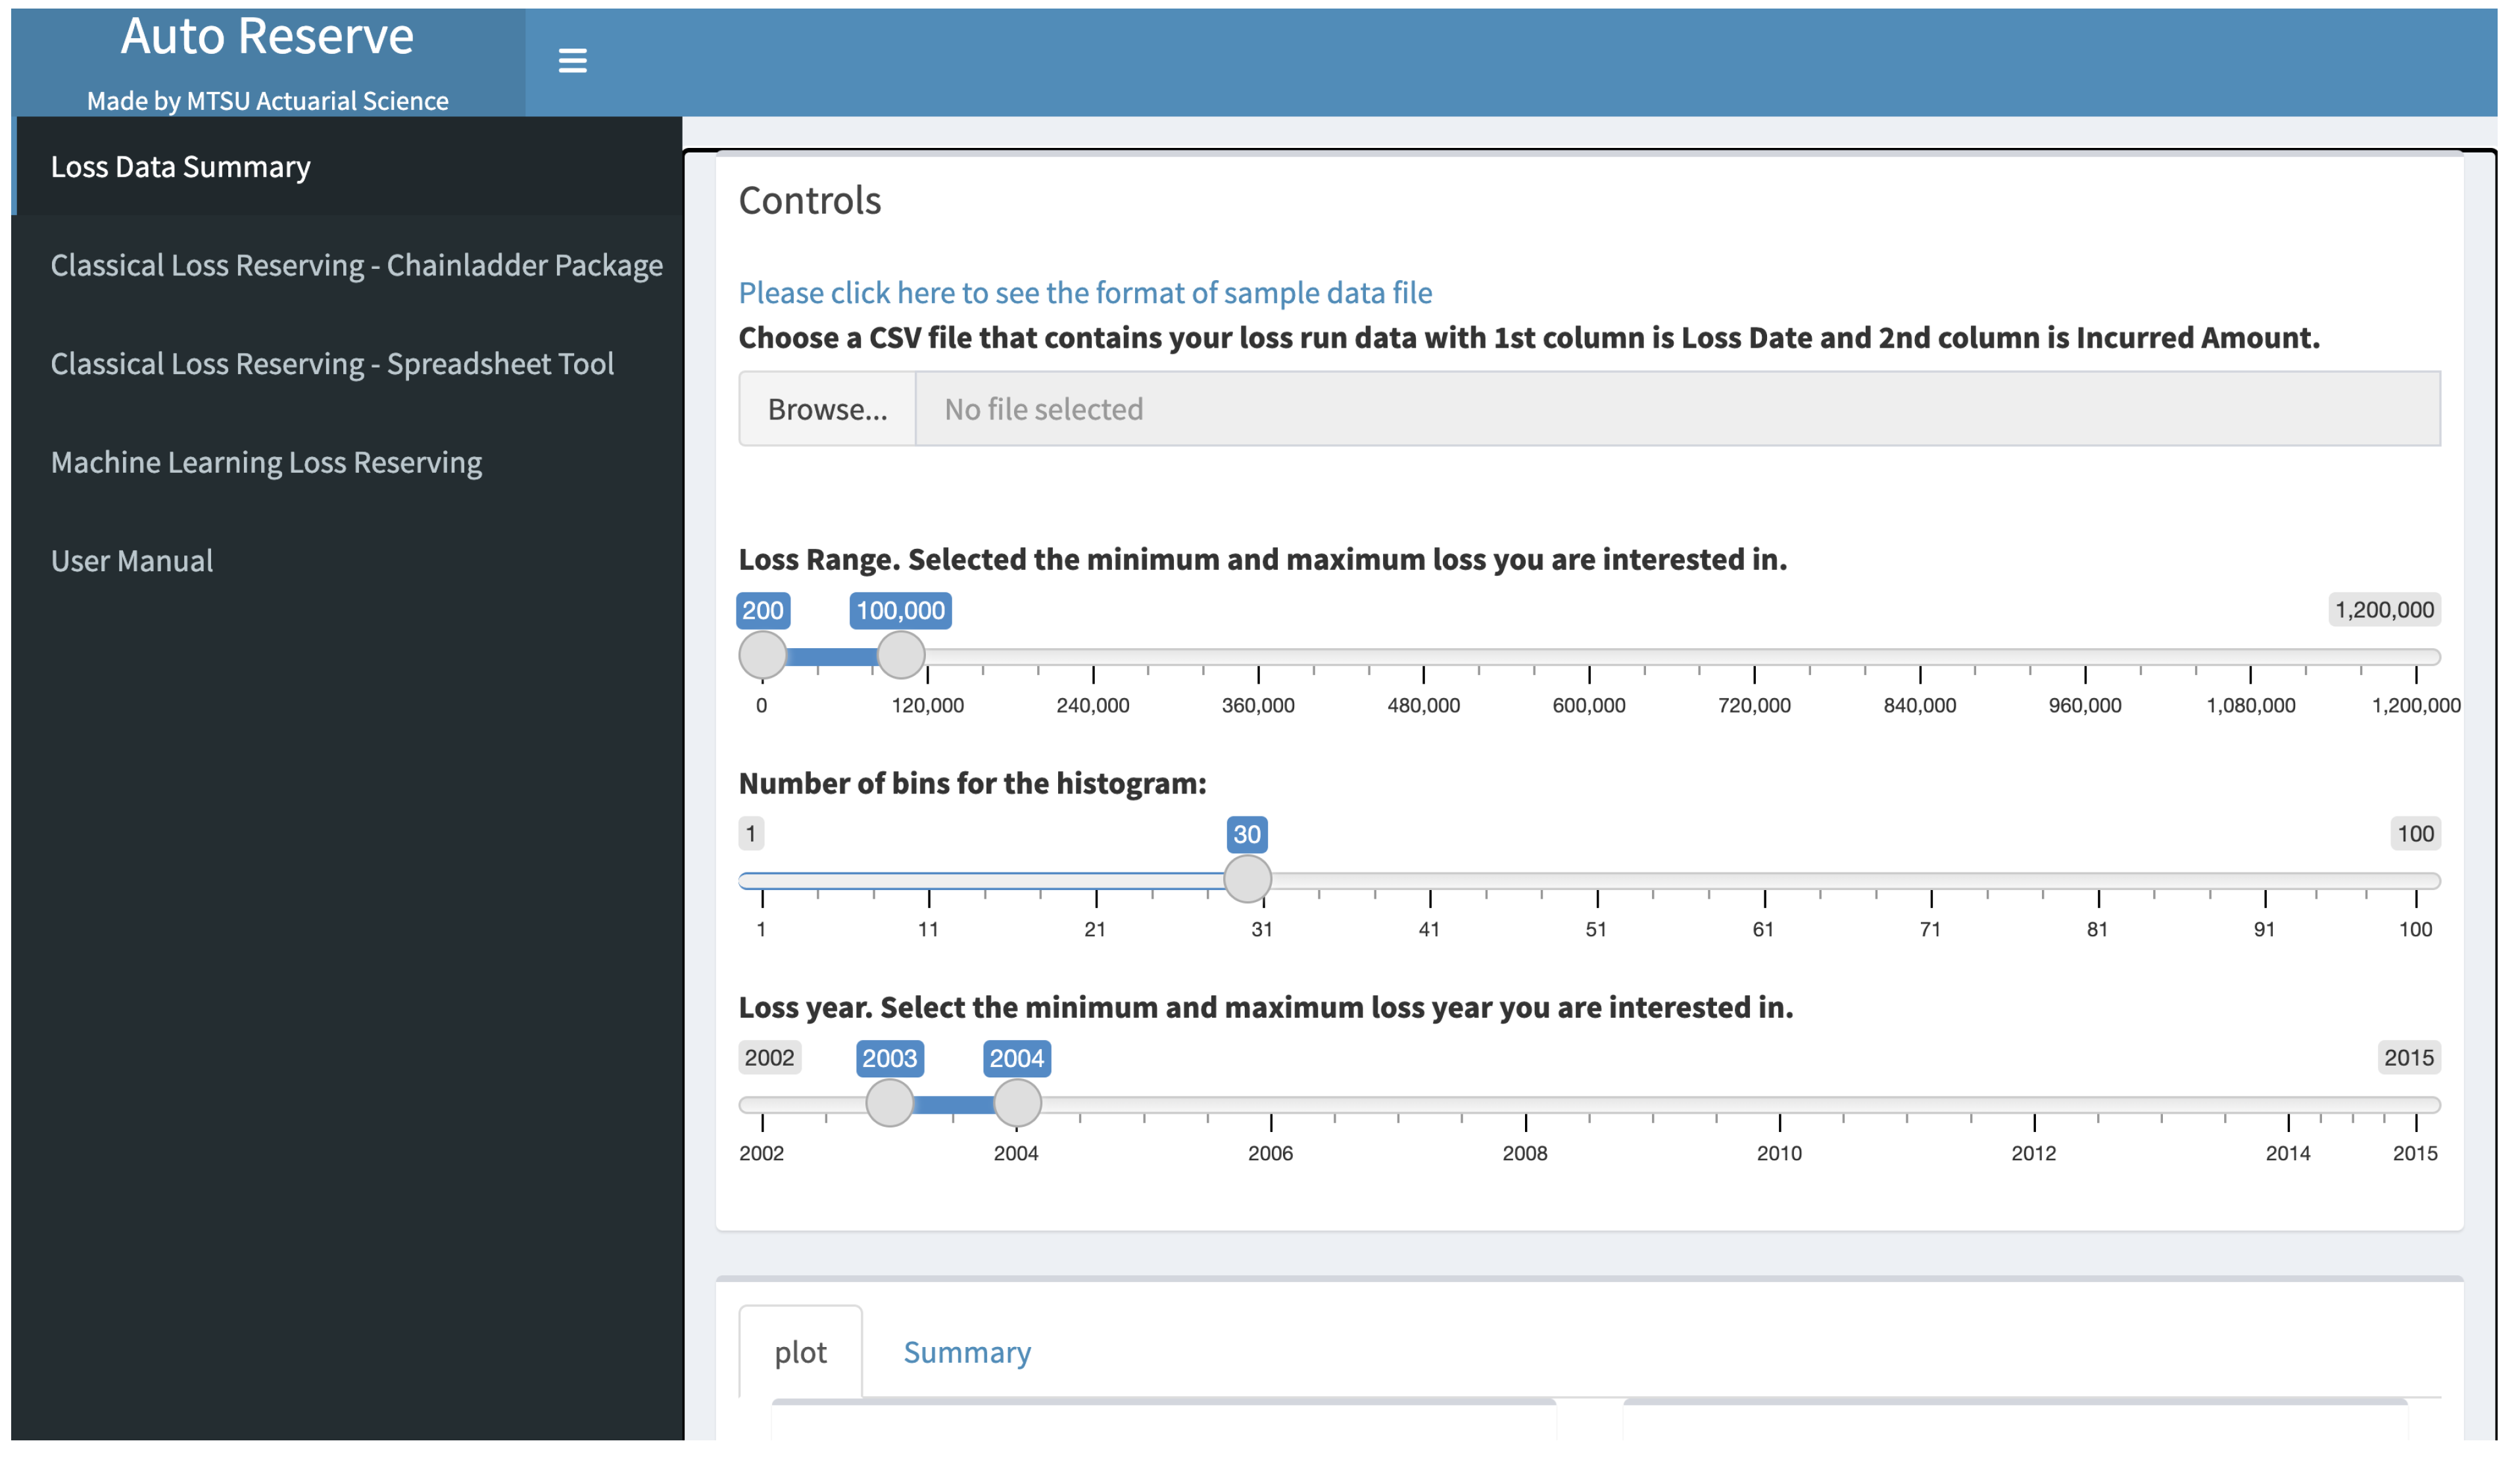
After uploading, the user will be able to adjust sliders to customize how the data is filtered. The slider control bar, as shown in
Figure 1, allows the user to select a loss range, which represents the maximum and minimum loss value that AutoReserve will consider. A second slider is the number of bins, which adjusts the number of bars displayed on the histogram. The third slider is loss year, which allows the user to choose the first and last year of the data the user wants AutoReserve to work with. When the user is satisfied with these sliders, the user can click the “Apply Changes” button to generate new graphs with the given customizations.
After clicking this button, our system will generate a visual analysis of the data as shown in
Figure 2. This will include histograms showing the frequency and average per month of both the total incurred and the number of claims, etc. The graphs are interactive; the user can check the exact value of each bar by putting the cursor on it. R shiny has a powerful interaction function based on UI and Server. Setting parameters in it can control input and output to achieve the desired effect. We implement the versatility of figures by using the R package plotly (
Sievert 2020), which greatly extends the user–system interaction, not only displaying data labels on mouse hover but also zooming in and out. In addition to the plots, AutoReserve will generate summary statistics and a pivot table as shown in
Figure 3. The summary statistics will allow the user to see the average loss amount as well as the average number of claims per year. The pivot table breaks down the claims by year and displays the average loss, total loss, and the number of losses for each year.
6. Classical Loss Reserving—With the ChainLadder Package
ChainLadder is an R Package, mainly used for insurance loss reserving analysis. It provides a series of different methods for loss reserving evaluation and ultimate loss forecasting, especially based on the loss triangle data. These methods include the Chain Ladder Method (CLM), Bornhuetter–Ferguson method, Cape Cod method, Mack method, etc. The ChainLadder Package also provides various figures to visualize the loss triangle, loss development factor (LDF), and estimation of the loss reserving.
Even though the ChainLadder package provides powerful functionalities, it is only limited to local usages after installation, which constrains its potential user base. Not all actuaries or insurance professionals who are interested in loss reserving have R programming skills. Therefore, converting this package into online software can greatly improve its usability. By providing an online graphic user interface (GUI) to the ChainLadder package, the user can use various functionalities of this package with a simple data upload and a few clicks. Therefore, in this paper, we use shiny R to convert the ChainLadder package into a GUI software that can be used online.
In this module, users will first upload the historical loss data and then select the evaluation year. Then our software will automatically calculate the lost triangle and the LDFs.
We use four different methods to estimate the IBNR and Ultimate Loss including the Incurred Chain Ladder Method, Paid Chain Ladder Method, Incurred Cape Cod Method and Paid Cape Cod Method.
In addition to these features, our module also supports multiple lines of business, including workers’ compensation, general liability, and commercial auto liability. Each line of business provides the industry benchmark of LDFs, which represents the average for this business line. When the user uploaded the loss data and the select the line of business, AutoReserve will use the credibility theory to calculate the final LDF. This calculation involves using the LDF compiled from user loss data with a weight of 0.5 and benchmark LDF with weight of 0.5 to obtain the weighted average LDF for loss reserving. By combining the characteristics of the user’s loss data and the average of the industry, we can reduce the stochastic volatility to achieve more reliable and more stable predictions.
This module also provides a series of plots to visualize the analysis and the results of the forecast. For instance, as shown in
Figure 4, there are six figures in the Incurred Chain Ladder Method tab and Paid Chain Ladder Method tab. The 1st plot located in the upper-left corner shows the forecasted Ultimate Loss (in dark color) and the reported Incurred Loss (in light color) of each accident year. The 2nd plot located in the upper-right corner is cumulative loss. It shows the change in the cumulative loss over the development years. The users can check this plot to diagnose whether the loss development trends of each accident year are similar. If the trends are consistent, it shows the basic assumption of the chain ladder method has been satisfied. The other four plots are residual plots to diagnose the fitting and prediction capability of the model. By comparing the standardized residuals with the fitted values, we can evaluate the fitting ability of the model at different accident periods and development years. Ideally, the standardized residuals should be horizontally randomly distributed along the fitted values without obvious patterns or trends. If this is not the case, the model may require adjustments.
7. Classical Loss Reserving—Spreadsheet Tool
AutoReserve uses the chain ladder method (
Mack 1993) to project ultimate claims in the classical loss reserving spreadsheet module. This module is called “Classical Loss Reserving” since the chain ladder method is considered to be a traditional method in the loss reserving paradigm. The module uses incurred, paid, and case chain ladder methods to calculate the ultimate loss. For the incurred chain ladder (
Renshaw and Verrall 1998) method, the user will input the incurred losses and LDF for each accident year as of a certain evaluation date. These LDFs can be obtained through the previous module of our software, where the user can select the line of business. The spreadsheet embedded in the app will automatically display the product of the losses incurred and the claim development factor, and that product represents the projected ultimate claim. The paid and case chain ladder methods operate similarly. For the paid method, the app uses paid losses to calculate the projected ultimate claim, and for the case method, the app uses case reserves and paid claims to project ultimate claim. The case reserves represent the amount set aside to settle the current reported claim by the insurance company.
Table 2,
Table 3,
Table 4,
Table 5,
Table 6 and
Table 7 show the six spreadsheet tables found under the Classical Loss Reserving module. Next, we give a brief introduction of each table.
Table 2 shows the details of calculating the projected ultimate claims based on the losses incurred as of the evaluation date. The projected ultimate claims are obtained by multiplying the incurred losses as of the evaluation date with LDF. The LDFs can be estimated from the loss triangle obtained from previous modules in AutoReserve. The paid method is similar and uses paid losses as of the evaluation date to project the ultimate claim.
Table 3 illustrates the paid method approach. The third method uses case reserves to calculate projected ultimate claims as shown in
Table 4. Case reserves are losses that have been reported but not yet paid; therefore, the number of case reserves can be obtained by subtracting the losses paid from the losses incurred in this accident year. The case reserve claim development factor can be computed from the incurred claim development factor and paid claim development factor. Then the estimated ultimate claim in each accident year is the case reserve multiplied by the case reserve claim development factor, added to the paid losses as of the evaluation date. Case reserves can be defined as expected future payments under currently available information (
Gross 2019).
In
Table 2,
Table 3 and
Table 4, the app calculated the projected ultimate claim using three different methods: incurred losses, paid losses, and case reserves.
Table 5 gives the selected projected ultimate claims by calculating the weighted average of projected ultimate claims given by each method. By default, the method gives 40% weight to the incurred method, 40% weight to the paid method, and 20% to the case method. A user can assign different weights as required. The default formula to calculate the selected claims is as follows:
Table 6 calculates the development of known claims and IBNR (incurred but not reported) as of the evaluation date. This table does not require any user input and will be calculated automatically based on previous input. Development on known claims and IBNR is calculated based on the following equation:
The value of estimated required reserves in this equation is calculated using the following formula:
The purpose of
Table 7 is to calculate future payment cash flows and present value. The user only needs to enter the discount rate and the percentage paid in each future year into the spreadsheet. Then future payments and discounted future payments as of the evaluation date for each future year will be calculated automatically by the spreadsheet. This can be used to calculate project selection criteria such as net present value, discount payback period, etc.
As shown in
Table 7 as an example, if the user enters a discount rate of 3.00%, the discounted values will be calculated based on that rate. The first discounted value is discounted at 3% for 6 months to determine the discounted future payments value. The second will be discounted for a year and six months, then two years and six months, and so on. Then the values are added up to obtain the total. The table shows that, with the sample data and payments, there is roughly a USD 250,000 difference between the total future payments and the total discounted future payments.
8. Machine Learning Loss Reserving
The classical loss reserving methods are useful when risk management is based on a more traditional approach. However, the insurance industry is changing, and AutoReserve offers a more modernized approach to loss reserving as well. Under the “Machine Learning Loss Reserving” module, the user can choose from various machine learning methods for loss reserving. This allows the user to compare the results from the traditional methods to the machine learning methods and decide which method works best for the given situation.
The data used for the machine learning portion of the application must be uploaded in a specific format as it appears in the sample data. Users can view the sample data by clicking the link provided on the website to understand the correct format. In detail, the sample data includes information about the loss date and the total amount incurred. The date needs to be in the month-day-year format and the total incurred amount should be retained to two decimal places with the dollar sign. When it comes to our data, some of the variables are self-explanatory. We also provide some brief explanations for those variables that may not be self-explanatory. Firstly, “GRCODE” and “GRNAME” refer to the company code and name, respectively. “DevelopmentLag” can be calculated using the development year minus the accident year plus 1. Then, “IncurLoss_” and “CumPaidLoss_” refer to the losses incurred and the cumulative paid losses as well as their allocated expenses at the end of the year. “BulkLoss_” represents the bulk and incurred but not reported reserves. “EarnedPremDIR_”, “EarnedPremCeded_”, and “EarnedPremNet_” refer to the direct and assumed premiums earned at incurred year, the ceded premiums at incurred year, and the net premiums at incurred year, respectively. “Single” variable is like a dummy variable: (1) represents a single entity and (0) represents a group insurer. Finally, “PostedReserve97_” shows the reserves posted by the Underwriting and Investments Exhibit in 1997 (
Casualty Actuarial Society 2019). Thus, if the data have been formatted correctly and uploaded as a CSV file, the user will be ready to use the machine learning module.
In this module, the user can determine reserve estimates with several machine learning methods. Possible methods include Linear Regression, Ridge Regression, Neural Network, KNN Model, Support Vector Machines, Gaussian Process, Polynomial Regression, Robust Model, Generalized Linear Model, and Random Forest. For each machine learning method, we use set of predictors such as “GRCODE”, “Accident year”, “Development year”, “Incurred Loss”, etc., and one response variable, “Reserve”. Then each machine learning method is trained using a training dataset. The implemented machine learning method algorithms are traditional algorithms that can be found in any standard machine learning text (
Hastie et al. 2009). For this paper, we did not implement special machine learning algorithms for reserves found in recent literature (
Baudry and Robert 2019;
Wüthrich 2018a,
2018b).
To help users choose the appropriate algorithm, in the following paragraphs we will introduce some of the algorithms in this module, including their pros, cons, and applications:
Neural Network is a powerful machine learning tool consisting of neuron layers that simulate the human brain neurons. These layers allow the model to learn from the complex patterns in the data, making it suitable for the loss reserving data which includes multi-dimensional variables. The advantages of neural networks come from the ability to model nonlinear relationships. This makes the neural networks especially suitable for certain types of insurance loss data. An instance would be data that include large amount of heterogeneous risk factors, complicated interactions, or prone to sudden changes due to external impact, such as auto, property and casualty, and catastrophe insurance data. However, they also have certain limitations, such as overfitting, and being sensitive to hyperparameters selection including learning rate and the number of hidden layers. Neural networks also require large datasets to obtain the best performance. Therefore, it may not be appropriate for small, noisy, or simple linear datasets. Additionally, its “black box” nature brings challenges to the interpretation of the results.
Random Forest is an ensemble machine learning algorithm that operates by constructing a multitude of decision trees at training time. It is used for loss reserving in AutoReserve, providing robust predictions and feature importance, though its interpretability can be challenging, it handles missing data effectively, and it finds applications in insurance loss reserving, risk management, and fraud detection. Random forest shows strong performance in predicting the claim data that are multidimensional and heterogeneous. It is appropriate for complex claim pattern prediction in auto and commercial auto insurance, property insurance, and so on.
Support vector machine (SVM) is a supervised learning method used for classification and regression. The goal of SVM is to find the hyperplane in N-dimensional space to classify the high-dimensional data points. The key parameters include the C parameter, which is used to decide the trade-off between the low error of training data and the minimum complexity of the model, and the kernel parameter, which is used to determine the type of hyperplane to divide the data. Even though SVM performs well when dealing with high dimensional and sparse data, it requires appropriate tuning for hyperparameters and could be computationally intensive, especially when processing large datasets.
K-Nearest Neighbors (KNN) is a nonparametric algorithm, often used for classification and regression. It works by finding the nearest K points to the given point in the training data and using the majority class (for classification) and average (for regression) of these neighboring points to do prediction. The key parameter of KNN is the number of neighbors K. It can greatly impact the bias–variance trade-off of the algorithm. Even though KNN is easy to be understood and implemented, it has certain limitations. First of all, it is sensitive to the selection of K and the distance measurement used. Secondly, for a large dataset, it is computationally intensive because it requires the computing of the distance of every prediction to all the points in the training sample. Last, because of the “curse of dimension”, KNN does not perform well when dealing with high-dimensional data.
In general, both machine learning algorithms and traditional actuarial models have their own advantages in loss reserving. Traditional actuarial models such as the Chain Ladder method emphasize on the theoretical background and interpretability. They perform well on simple structured data, or those data with certain distributions. However, when dealing with complex or nonlinear data relationships, they could face challenges. In contrast, machine learning methods such as neural networks and random forest can handle more complex, higher dimensional, and nonlinear data relationships. However, a main disadvantage of these models is the “black box” nature, resulting in difficulties in interpretation. Which method to choose should be decided according to the applications, data characteristics, and business requirements. AutoReserve aims to provide a diverse toolbox so that the users can choose the most appropriate model based on their situations.
In addition, for users who are not very familiar with the machine learning algorithms, we have provided a brief explanation of every machine learning algorithm available on AutoReserve in the user manual in the final module of this software. This will help the user to better understand these techniques and select the appropriate algorithm based on their business needs. This functionality will ensure the user-friendliness of AutoReserve and provide broad accessibility for users with different knowledge about machine learning.
To choose which methods to use, as illustrated in
Figure 5, the user can click on the “Select Algorithms” input box and choose the appropriate machine learning algorithms from the provided dropdown menu. The user can also adjust the hyperparameters in some algorithms by using the slider located on the control bar in this module. For instance, in the random forest algorithm, the user can select the number of trees to be built by adjusting the slider. This flexibility allows the user to customize the machine learning algorithm they are interested in. As shown in
Figure 6, box plots will be generated for each selected algorithm. These box plots will display the mean absolute error (MAE), R squared (
), and root-mean-square error (RMSE) for the selected machine learning methods so that they can be compared.
Mean absolute error (MAE) (
Chai and Draxler 2014) measures the average of absolute difference between observed and predicted values. Root mean square error (RMSE) (
Chai and Draxler 2014) measures the square root of average squared differences between the predicted value and the observed value. Another way to think about RMSE is the standard deviation of residuals. R-Squared (
or the coefficient of determination) (
Dueck et al. 2012) is a statistical measure in a regression model that determines the proportion of variance in the dependent variable that can be explained by the independent variable.
These fit statistics are calculated for the validation dataset, which is obtained by dividing the user-provided training dataset as 90% for model training and 10% for model validation. Each fit statistic was calculated 30 times by randomly dividing user-provided training data as 90% for training and 10% for validation. Finally, AutoReserve will calculate the required reserve for the user-provided test dataset. AutoReserve also allows users to choose other ML methods (
Buczak and Guven 2015) and compare fit statistics with those techniques. The program works as a “no code” type since users are only required to upload training and test datasets to obtain results. Given the complexity of some ML techniques, these save valuable time for actuaries, which can be used on interpreting results. Furthermore, the tool can be used to determine which method is promising for further investigation when predicting required reserves. Another advantage of this approach are the identical results when applying the same settings. This is especially valuable for regulatory purposes.
9. Discussion
In the future, the app will continue to undergo development. Software errors could be fixed and more features could potentially be added based on user feedback. A potential future feature is user registration. This would allow AutoReserve to manage and save each user’s data more effectively. It would also allow for better management of databases for each user. A form of Natural Language Processing may also be added to AutoReserve in the future. This would allow for text within the lost data to be handled better by the app. Depending on the user base, AutoReserve may also need to be scaled on the cloud. This will allow it to handle large numbers of visits at the same time.
There is also always room for expanding AutoReserve’s widgets. Some potential future widgets include loss simulations (
Wenner et al. 2011), machine learning with Joint Gaussian Distribution (
Rasmussen 2004), and more. AutoReserve will be open to suggestions from users on which new widgets will be the most useful.
There are several limitations in the current version of AutoReserve. For example, the app requires users to enter data in certain format in order to obtain the final result. During this development phase, AutoReserve is not exploring its compliance with insurance regulations in different countries. The app’s developers do not possess the necessary background for this task. Additionally, the current app cannot consider other numerical or categorical variables in the dataset that are not in the predefined list. The app currently uses only MAE, RMSE, and R-squared to compare models. However, there are many other model selection metrics that users may prefer to see but are not given by the current version of the app. Nonetheless, the app possesses enormous potential to overcome these limitations and become a leading free software in the actuarial science world.
Even in today’s world, many actuaries still rely on spreadsheets. Thus, Shiny-R-based AutoReserve would bring a discussion on developing easy-to-use software for actuaries. Many practitioners would greatly benefit from free apps which require less coding, as would students in actuarial science programs. Practitioners in the industry can supplement their work with AutoReserve output and educators can use it classroom for method illustration purposes. Therefore, we believe actuarial science would greatly benefit from open-source, free educational apps such as AutoReserve. We hope our work encourages others to develop more open-source free software related to actuarial science.


