
Volatility Spillovers among Sovereign Credit Default Swaps of Emerging Economies and Their Determinants


1
Department of Finance, College of Business Administration, King Saud University, P.O. Box 12371, Riyadh 11451, Saudi Arabia
2
Department of Finance, College of Business, Imam Mohammad Ibn Saud Islamic University (IMSIU), P.O. Box 5701, Riyadh 11564, Saudi Arabia
3
Department of Economics, College of Business, Imam Mohammad Ibn Saud Islamic University (IMSIU), P.O. Box 5701, Riyadh 11564, Saudi Arabia
*
Author to whom correspondence should be addressed.
Risks 2024, 12(4), 71; https://doi.org/10.3390/risks12040071
Submission received: 11 March 2024
/
Revised: 9 April 2024
/
Accepted: 18 April 2024
/
Published: 22 April 2024
Abstract
:This paper aims to investigate the volatility spillovers among selected emerging economies’ sovereign credit default swaps (SCDSs), including those of Saudi Arabia, Russia, China, Indonesia, South Africa, Brazil, Mexico, and Turkey. Using data from January 2010 to July 2023, we apply the time-domain and the frequency-domain connectedness approaches.Empirical results show that (i) Indonesia, followed by China and Mexico, are the main transmitters of sovereign credit risk volatility. (ii) Among global factors, the volatility index (VIX), economic policy uncertainty (EPU), and global political risk (GPR) positively impacted spillover on lower and higher quantiles. The results offer critical insights for international investors, policymakers, and researchers, emphasizing the importance of risk-aware investment strategies and cautious policy formulation in the context of financial crises and political events.
JEL Code:
C2; C22; G15; G11. Introduction
The recent financial crises, triggered by the global spread of COVID-19 and the ongoing Russian–Ukrainian conflict, have unleashed a series of disruptions in the global financial market, particularly the credit risk market. Whether corporate or sovereign, credit risk significantly threatens financial stability (Ghenimi et al. 2017). The latter, sovereign credit risk, has become a pressing concern, given its potential to destabilize countries and financial positions (Poon et al. 2017). The importance of sovereign risk is further underscored by the attention garnered by sovereign credit default swaps (SCDSs) since the European debt crisis. The impact of sovereign risk extends beyond financial markets and affects the real economy (Bottero et al. 2020), influencing investors’ decisions, countries’ financial positions, and their engagement in international trade. This research, therefore, holds immense value in understanding and managing these risks, which can have far-reaching and potentially devastating consequences for international trade.
Moreover, financial markets have become more interconnected recently, and as a result, the impact of favorable and unfavorable market events spreads rapidly through risk channels. While some market segments tend to be more impacted by crises and sovereign credit risk propagation than others, risks travel across markets, regions, and countries over time. Such interconnectedness among global financial markets highlights the need to explore and understand how sovereign credit risk propagates across different sovereigns. Among market segments, emerging economies are considered the most significant financial market. Their significance is attributed to the emerging market’s rapid growth, sensitivity to global crises, and connectedness to other market segments, including developed and underdeveloped economies. Various countries in the emerging market are considered among the most significant commodity exporters (Hilscher and Nosbusch 2010; Baffes et al. 2018; Da Silva Souza and Fry-McKibbin 2021). Hu et al. (2021) argue that regardless of their slightly less developed markets, emerging market countries’ openness to foreign investment keeps them highly engaged in the international financial system. Additionally, Pretorius (2023) finds emerging market countries more sensitive to market instability and uncertainty. The author argues that studies have confirmed the existence of herd behavior in emerging markets, especially during times of turmoil. While some investors treat all emerging market countries similarly in making their investment decisions, others consider looking into each country-specific factor for further analysis.
The objective of this study is twofold: First, we aim to investigate the time and frequency of volatility spillovers among selected emerging economies’ SCDSs. Second, this study explores the determinants of volatility spillovers using global financial, economic, commodity, and climate uncertainty factors. Third, this study aims to investigate the dynamics of financial connectedness and risk transmission among emerging market economies and then determine countries that are net transmitters or receivers of financial shocks. Using data from January 2010 to July 2023, we apply the time-domain approach of Diebold and Yilmaz (2012) and the frequency-domain approach of Baruník and Křehlík (2018). The two approaches, including the time and frequency and quantile approaches, comprehensively examine the sovereign credit risk dynamic’s interactions among emerging markets economies. The selection of countries includes Saudi Arabia, Russia, China, Indonesia, Brazil, Mexico, South Africa, and Turkey. These countries are characterized as emerging market economies and are all members of the G20 economies. The countries in the sample include oil exporting and importing countries and represent a wide selection of countries with similar economic characteristics over a broad geographical range.
There are several motivations for empirically examining the time and frequency approaches to examine the volatility spillovers among emerging economies’ SCDSs. First, as one of the sample countries, Saudi Arabia is considered the largest economy in the Middle East, and it ranks as the sixth largest equity market in the Morgan Stanley Capital International (MSCI) Emerging Market index. However, the dynamics and connectedness of Saudi Arabia’s sovereign credit risk have not been studied widely in the literature. Thus, this study examines the spillover of sovereign credit risk and its main determinants for Saudi Arabia and other selected emerging market economies. Second, emerging market economies are closely tied to global financial markets, and they are considered among the most intriguing markets to examine due to their high vulnerability to market uncertainty and facilitation of risk spillover. Third, the study is motivated by the alarming impact of climate change risk and climate uncertainty policies that influence financial markets globally. Fourth, sovereign credit risk spillover may have significant implications for the financial stability of emerging market economies due to their vulnerability to market instability and uncertainty. Finally, examining the time and frequency approaches to spillover of sovereign credit risk among emerging market economies can aid in assessing risk dynamics and the risk travel network on average, on short and longer terms. Additionally, the study provides valuable insights to investors, policymakers, and portfolio managers who wish to widen their investments internationally.
This paper contributes to the existing literature on risk spillover and financial connectedness by comprehensively analyzing the time and frequency connectedness among emerging economies’ SCDSs. Additionally, the study presents a novel contribution of incorporating climate policy uncertainty (CPU) as a global factor that influences sovereign credit risk in global financial markets. The study contributes to the literature by providing novel results incorporating periods of financial turmoil and recent events from 2010 to 2023. The study utilizes multiple robust econometric methodologies to capture the time and frequency connectedness in the long and short run during different market conditions. Further, the study contributes to the emerging market literature by thoroughly investigating eight emerging market economies. We start by examining the static connectedness of Diebold and Yilmaz (2012), followed by the short- and long-run frequency reaction to shocks using the frequency domain approach of Baruník and Křehlík (2018). Eventually, the study extends the analysis of emerging market connectedness by examining volatility spillover using the joint total connectedness index obtained from Diebold and Yilmaz (2012) as the dependent variable to identify the factors affecting spillovers across quantiles. Key empirical results show a strong association between financial crisis periods and spillover for emerging markets in the sample. Second, among emerging markets in the sample, Indonesia, followed by China and Mexico, are the main transmitters of sovereign credit risk volatility. Third, the examination of the impact of the global uncertainty factors on SCDSs indicates that among global factors, the geopolitical risk index (GPR), the Merrill Lynch Option Volatility Estimate Index (MOVE), the CBOE volatility index (VIX), and the economic policy uncertainty index (EPU) showed a positive impact on spillover on lower and higher quantiles. Climate policy uncertainty (CPU) and the CBOE crude oil volatility index (OVX) had a negative impact on higher and lower quantiles of the volatility spillover.
The remaining sections of this paper are presented as follows: Section 2 provides the literature review. Section 3 demonstrates the empirical methodologies used in the study. Section 4 presents the data sample and period of the study. Section 5 discusses the study’s empirical findings. Section 6 outlines the conclusion of this paper.
2. Literature Review
Volatility spillover among sovereign CDSs is triggered by crises, where volatility travels among financial markets through various risk channels. To understand the traveling mechanism of sovereign credit risk among emerging markets, examining the determinants and major factors that influence such risk is pivotal. The determinants of sovereign credit risk are mainly linked to global financial, macroeconomic, commodity, and uncertainty factors. The existing literature has mainly focused on two main drivers of sovereign credit risk. Prior studies have segmented the determinants of sovereign credit risk into two main categories: global uncertainty factors and country-specific factors. First, global uncertainty factors that appear in the form of economic and financial instability, outbreaks of pandemics, global trade tensions, geopolitical risks, and climate uncertainty have a massive impact on sovereign credit risk. Studies show that global uncertainty factors affect sovereign credit risk, including Balcilar et al. (2020); Hilscher and Nosbusch (2010); Oliveira et al. (2012); Amstad et al. (2016); Pan and Singleton (2008); Stolbov (2017); Bouri et al. (2018); and Rikhotso and Simo-Kengne (2022), among others. The study by Pan and Singleton (2008), used a lognormal process to seize variations in the term structure of sovereign CDSs for Turkey, Mexico, and Korea from March 2001 to August 2006. The study showed that investors’ behaviors affected the term structure of sovereign credit risk globally. Further, (Remolona et al. 2008) analyzed the dynamics of pricing sovereign risk in the emerging market and found that sovereign risk and risk premiums are greatly affected by global investors’ risk appetites. Additionally, Longstaff et al. (2011) examined the impact of global and local factors on sovereign credit risk for 26 different countries from 2000 to 2010. The study finds that sovereign spread variations are closely associated with variations in the VIX index and that global macroeconomic factors greatly influence sovereign credit risk.
The second set of related studies finds that country-specific factors and macroeconomic fundamentals influence sovereign credit risk. Country-specific factors such as domestic institutions, economic development, fiscal policies, and market structure impact the level of sovereign credit risk. A well-developed institutional framework and strong macroeconomic fundamentals were found to reduce the likelihood of a government’s default. Similarly, a country’s level of development, diversification of its economy, and export status can impact credit risk perceptions. An example of studies that focused on the impact of the macroeconomic fundamentals on sovereign credit risk includes Hilscher and Nosbusch (2010), who examined the impact of macroeconomic fundamentals on sovereign credit risk to find that greater macroeconomic volatilities make emerging market countries more susceptible to sovereign defaults. Additional studies that considered country factors and macroeconomic fundamentals as critical determinants of sovereign credit risk include Eyssell et al. (2013), Liu and Morley (2012), and Abid and Naifar (2006), among others. Furthermore, Eyssell et al. (2013) examined the determinants of sovereign CDSs for China during 2001–2009 using a vector autoregressive model. The study finds that country-specific factors, including the stock index and interest rates, and global factors, such as U.S. S&P 500 stock option volatilities and default spreads, affect the movement of China’s CDS spread. Another related study by Eichengreen and Gupta (2015) examined the impact of local factors and found that factors such as equity prices, exchange rates, and foreign reserves tend to have similar behavior among countries. However, the volume of the market movements relies on local market size. An additional study by Amstad et al. (2016) examined how global investors differentiate between sovereign risks by examining the impact of global risk factors and country-specific factors for 18 emerging market economies during the 2008 crisis. The study finds that global factors motivate what occurs over time, while country-specific factors motivate what happens between countries. The findings are linked to the Merton (1974) structural model, as it associates the intensity of credit default with credit instruments. The Merton model, which exhibits a form of structural model, assumes that the probability of default is linked to the firms’ assets and liability. The Merton (1974) model branches from a Brownian motion, assuming that defaults occur when a firm’s liabilities exceed its assets. The model justifies default based on the economic situation. Hibbert and Pavlova (2017) explore the determinants of sovereign CDS prices, highlighting the impact of global macroeconomic and country-specific factors. They provide empirical findings on the relative importance of global versus local factors, focusing on differences between Europe and Latin America. The analysis reveals the commonalities and regional differences in the determinants of sovereign CDS spreads, indicating the impact of global and domestic economic conditions on credit risk.
Despite the growing amount of literature on the determinants of sovereign credit risk, only a few studies have examined the impact of climate change on sovereign credit risk. This study utilizes the newly developed climate policy uncertainty (CPU) index to capture its impact on sovereign credit risk and whether it creates a channel through which sovereign credit risk volatility spills over to other markers. The CPU index was developed by Gavriilidis (2021), who follows the pathways of the methodology of the EPU index (Baker et al. 2016). The CPU index is a global policy uncertainty index that utilizes the frequency of major U.S. newspaper coverage to determine climate policy uncertainty. The index searches for the usage of climate policy uncertainty-related terminologies such as, but not limited, to climate risk, carbon dioxide, climate change, greenhouse gas emissions, legislation, environment, policy, and so on. The climate change phenomenon continues to rise, posing a serious environmental risk, especially if it continues to rise during the 21st century. Climate change risk driven by enormous carbon dioxide emissions has directed countries globally toward taking actions to enhance climate governance (Ren et al. (2022); Liu et al. (2020); McCollum et al. (2018)). The alarming increase in market uncertainties driven by climate change risk has enticed governments to develop climate policies for industry regulation (Ren et al. 2022). The Paris Agreement on Climate Change is among the most promising climate policies adopted recently. The Paris Agreement aims to reduce global temperature and mitigate the impact of climate change during the 21st century. Further, climate change creates risks for the environment and global economies. Specifically, severe weather conditions tend to generate huge financial and environmental losses. Such losses harm financial stability and environmental structure. Studies in the literature have discussed the impact of climate change on various sectors, including the stock market, economic growth, banking and finance, commodity prices, food securities, credit ratings, and sovereign debt. Among studies that have examined the impact of climate risk on sovereign credit risk (e.g., Cevik and Jalles 2022; Zenios 2022; Naifar 2023), Cevik and Jalles (2022) examined the impact of climate change vulnerability on sovereign bond yield for a sample of 98 countries, including developed and developing ones, from 1995 to 2017. The study finds that vulnerability to climate change mainly impacts the government’s borrowing costs. Essentially, the study argues that bond yield spread was lower in countries with more resilience to climate change than in countries that are more sensitive to risks generated by climate change (Cevik and Jalles 2022). Zenios (2022) also highlights the importance of utilizing climate risk in sovereign credit risk analysis. The author presented a case study of Italy and discussed the main climate risk channels through which sovereign debt and public finances are impacted. Naifar (2023) investigated the linkage between climate change and sovereign credit risk by examining climate change readiness in a sample of developed and developing countries from 2010 to 2020 using a panel quantile regression approach. The study finds that sovereign credit risk is impacted by climate change readiness and vulnerability, especially in higher quantiles. According to Naifar (2023), there are three main channels through which climate risk impacts sovereign credit risk: risk transition, sensitivity to climate damages, and ability to adapt to climate change consequences. Yang and Hamori (2023) also examined sovereign credit networks through tail dependence of daily CDS data for a sample of 57 countries from 2009 to 2020. The study finds that risk spillover increases among sovereigns during extreme weather conditions. Xu et al. (2023) investigated the relationship between climate policy uncertainty and stock market return in China and the U.S. during the period of 2000–2022 using the copula function. The study finds that in the case of China, increased CPU resulted in lower stock returns and increased volatility. The study also finds evidence that CPU impacts differ for each stock market. The discussed literature highlights the growing interest in investigating the impact of climate change risk and climate policy uncertainty on the performance of the global financial market. However, there is a scarcity of studies documenting the impact of climate policy uncertainty (CPU) on financial stability and sovereign credit risk. To our knowledge, no study has examined the impact of CPU on sovereign credit risk for emerging market countries.
Moreover, examining the global and country-specific factors that impact sovereign credit risk is necessary to justify credit risk movements and sovereign credit risk dynamics. The spread of financial crises and their massive impact on global economies have enticed researchers, policymakers, and investors to investigate financial market contentedness and risk transmission networks. Spillover is considered a crucial part of the sovereign credit risk discussion. Spillover is defined as an intensive correlation caused by a shock to sovereign credit risk (Augustin et al. 2018). The spillover phenomenon has gained significance, especially during the Great Crises period (GFC), due to its impact on investors, portfolio managers, policymakers, and governments. Scholars examining the spillover phenomenon found evidence of risk transferring among countries, especially during times of distress. Kamber et al. (2016) investigated the spillover of uncertainty shocks among the US, Japan, New Zealand, Austria, China, Switzerland, the UK, and Canada. The study utilized a factor-augmented autoregression analysis to examine uncertainty shocks’ travel across the selected countries from 1995 to 2015.The study showed that financial instruments such as exchange rates, stock prices, and interest rates contribute to uncertainty shocks’ transmission among countries.
Further, Augustin et al. (2018), focused on examining the transmission of credit risk from sovereign to corporate credit risk during the Greek bailout in 2010. The sample contained 15 countries and 226 different firms. The findings show evidence of a spillover of credit risk from sovereigns to corporates. Sovereign risk created a risk network through which risks traveled to corporations in the Eurozone. The study shows that increases in corporate credit risk follow increases in sovereign credit risk. The Impact was stronger for countries that share a common currency in the Eurozone. In terms of corporations, the most impacted were those relying on bank loans and others more connected to governments. Furthermore, (Abed et al. 2019) investigated the interconnection among sovereign CDSs of the Eurozone and the related financial markets, including banking CDSs, sovereign bonds, future interest rates, and stock markets, using an ARCH model from 2011 to 2016. The study spots a clear connection between sovereign CDSs and the financial markets regarding movements, especially during crises. The study found traces of credit risk transferring from the private sector to the public sector and vice versa. In addition, coherence in behavior exists between CDSs and the used financial indices. Moreover, Sabkha et al. (2019) examined the international spillover among sovereign markets. Using a FIEGARCH model for 33 sovereign credit swap country data samples from 2006 to 2014, the study confirms the existence of sovereign credit risk spillover across international markets, particularly during times of turmoil. The extent to which each country’s financial market is affected is different. In addition, the trend in which risk travels alters over time and crosses global financial markets. The study suggests that country-tailored regulatory and economic policies could mitigate credit risk transfer.
Furthermore, (Härdle et al. 2016) the systematic risk transfer in the U.S. financial market was examined using a TENET tail event-driven network throughout 2007–2012. The study finds that the tail-driven method helps rank transmitters and receivers of risk within the country’s financial market. The study argues that there is a significant connectedness among financial sectors that thrive during crises. The study findings could be enriched by adding more variables or, better yet, by focusing on an international market level that shows systematic risk receivers and transmitters. On a more expanded level, (Naifar and Shahzad 2021) the tail event-based methodology measured the interconnectedness in sovereign credit risk among emerging market economies from 2019 to 2020. The risk network showed palpable relatedness among SCDSs in emerging financial markets. The connectivity of these SCDSs was higher during the COVID-19 pandemic. Further, (Ballester and González-Urteaga 2021) examined the cross-border impact of risk transmission between sovereign CDSs and credit ratings for 45 emerging market countries from 2004 to 2015. The study showed a positive and negative spillover risk transfer among countries in the region. However, the degree to which each country in the region is impacted differs. The analysis showed that the cross-border transmission impact of credit ratings is best measured in a regional or international framework. (Augustin et al. 2020) studied the impact of the COVID-19 pandemic on sovereign credit risk for a sample of 30 countries in the developed market from January 2020 to May 2020. The study finds that the COVID-19 pandemic impacted sovereign credit spreads. Regarding the degree of impact, countries with higher debt levels were more affected than countries with more stable financial conditions. Additionally, Balcilar et al. (2023) is among recent studies that examined risk transmission among 11 MENA countries using daily data from 2006 to 2021. The study uses multiple economic models, including the standard spillover approach, frequency domain, and quantile connectedness. The study finds a strong positive association between financial stress and risk spillover among countries. Countries were segmented into three main categories: risk transmitters, risk receivers, and players, through which financial connectedness is observed.
Contrary to the previous literature, this paper intends to fill the research gap by comprehensively investigating sovereign CDS determinants and their volatility spillover among emerging economies, including Saudi Arabia, Russia, China, Indonesia, Brazil, Mexico, South Africa, and Turkey. The study utilizes robust methodologies, including the time and frequency approaches, which provide a nuanced understating of sovereign risk transmission and the possible asymmetric impact of global financial, economic, and climate uncertainty factors on sovereign credit risk.
3. Econometric Methodology
The empirical analysis in this study examines connectedness spillover in two stages. We follow the method applied by Balcilar et al. (2023) by examining spillover from different angles, including the time-domain approach of Diebold and Yilmaz (2012) and the frequency-domain approach of Baruník and Křehlík (2018). The applied spillover approaches are used to comprehend the static and dynamic sources of sovereign credit risk and the overall spillover connectedness during different time scales, including times of financial and economic stress.
3.1. Time-Domain Approach of Diebold and Yilmaz (2012)
First, we applied the standard network connectedness approach of (Diebold and Yilmaz 2012) to examine the spillover and static connectedness of sovereign credit risk among selected emerging markets. In the spillover connectedness table, each value is denoted as , which equates the estimation financial shock j’s impact on emerging market countries SCDS i’s forecast error variance attained from the H-step-ahead generalized forecast:
The symbol Σ is the covariance matrix of errors. The term is the standard deviation of the error term in the j-th equation. The selection vector, denoted as , takes the value 1 if the i-th component is zero, and is h-step moving average coefficient matrix.
Therefore, the normalized entry is written as
where and the sum of the total variance decompositions is .
represents the “directional pairwise connectedness” among emerging market countries’ SCDSs. The table of connectedness is derived by converting into a directional spillover from country j to country i, denoted as . Since ≠ typically, we can derive distinct pairwise directional connectedness measurements. Further, the net pairwise connectedness table uses the degree of spillover among two countries as a basis for determining the weighted edges, with the countries under investigation shown as nodes. The direction of volatility spillover from country j to country i is illustrated by the arrows. The aggregate connectedness measure of volatility spillover among selected emerging economies’ SCDSs can be calculated as follows:
3.2. Frequency Connectedness Approach
In this section, we employ the frequency connected approach of Baruník and Křehlík (2018). The frequency domain approach is utilized to identify the magnitude of short- and long-term connectedness among emerging market countries depending on spectral range of variance decomposition. Variance decomposition illustrates the amount of the forecast error variance of a variable that can be explained by shocks in other variables in the VAR system. Consider the spectral behavior of series at frequency ω:
In Equation (4), , and ∞ represents the infinite horizon relations. The general forecast error variance decomposition on an explicit frequency can be defined as follows:
Equation (5) can be standardized as follows:
The applied approach of Baruník and Křehlík (2018) comprises an accumulative connectedness table, focusing on a designated frequency band .
We categorize the data according to specific frequency ω: frequencies one month are considered a short-run, while one month to infinity represents the long-run measures. This classification approach illustrates the connectedness table in the provided frequency range as follows:
Consequently, the overall connectedness in the frequency band d can be defined as
The pairwise connectedness can be expressed as follows:
The weight of a specific frequency band d must be considered when contributing to the overall measure, as follows:
The spectral weight represents the proportion of frequency band d in the entire VAR system, while is the comprehensive connectedness measure seen in the connectedness tables () related to a chosen frequency of band d.
4. Data and Preliminary Statistics
This paper examines the connectedness and sovereign credit risk transmission among eight selected emerging market economies. The selected emerging market countries include Saudi Arabia, Russia, China, Indonesia, Brazil, Mexico, South Africa and Turkey. The sample period is chosen based on data availability. The data cover significant financial and economic events, including the Arab Spring in 2010, the oil crises during 2014–2016, the COVID-19 pandemic in 2020, and the ongoing Russian–Ukrainian conflict. The data are obtained from the Refinitiv database, Bloomberg, and the trading economics database. We used sovereign CDS data with a 5-year maturity for a sample period starting from 2 February 2010, to 14 July 2023. To work with stationary data, we calculated the log spread returns, where is the return on the sovereign CDS spreads at time and and are the SCDS spreads at and , respectively. The sovereign CDS volatility is estimated using the monthly realized variance (RV) as , where the subscript i denotes the currency, and t is the monthly time index.
5. Empirical Results and Discussion
5.1. Time -Domain Spillover Analysis
We begin by investigating the standard spillover approach among eight emerging market economies following the time-domain spillover approach of (Diebold and Yilmaz 2012). Table 1 summarizes the average spillovers over the entire sample period and the intra-country and inter-country spillovers. Table 1 indicates that the total spillover index explains 71.77% of the total forecast error variance. These countries are highly interconnected, as more than half of the total forecast error variance can be linked to the spillovers across the eight emerging market countries. Moreover, the intra-country spillover justifies most of the forecast error variance, especially for Russia, reaching 76.70%, Turkey at 27%, South Africa at 22.43%, and Saudi Arabia at 22.91%. On the other hand, the results show that Indonesia, Mexico, Brazil, and China have the lowest intra-country spillover, with percentages reaching 18.62%, 18.71%, 19.10%, and 20.34%, respectively. The results show high integration among the emerging market countries in the sample.
Furthermore, to illustrate the inter-country spillover, we use the pairwise directional connectedness to confirm that the emerging market countries within the sample are financially connected among themselves strongly, except for Russia, as the results of the pairwise directional connectedness show that it is disconnected from emerging market countries. Given the Russian–Ukrainian conflict, this might be attributed to Russia’s trade relations and unstable political situation.
Table 1 shows the “TO” row, which indicates that the largest gross directional spillover among the selected emerging countries to others comes from Indonesia (12.48%), followed by China (11.67%), Mexico (11.49%) and Brazil (11.02%). On the contrary, Russia (.80%) and Turkey (6.93%) show the lowest gross directional spillover to emerging market countries. Further, the “FROM” column illustrates that the highest gross directional spillover from others is attributed to Indonesia (10.17%), Mexico (10.16%), and Brazil (10.11%). The lowest value was found for Russia (2.91%).
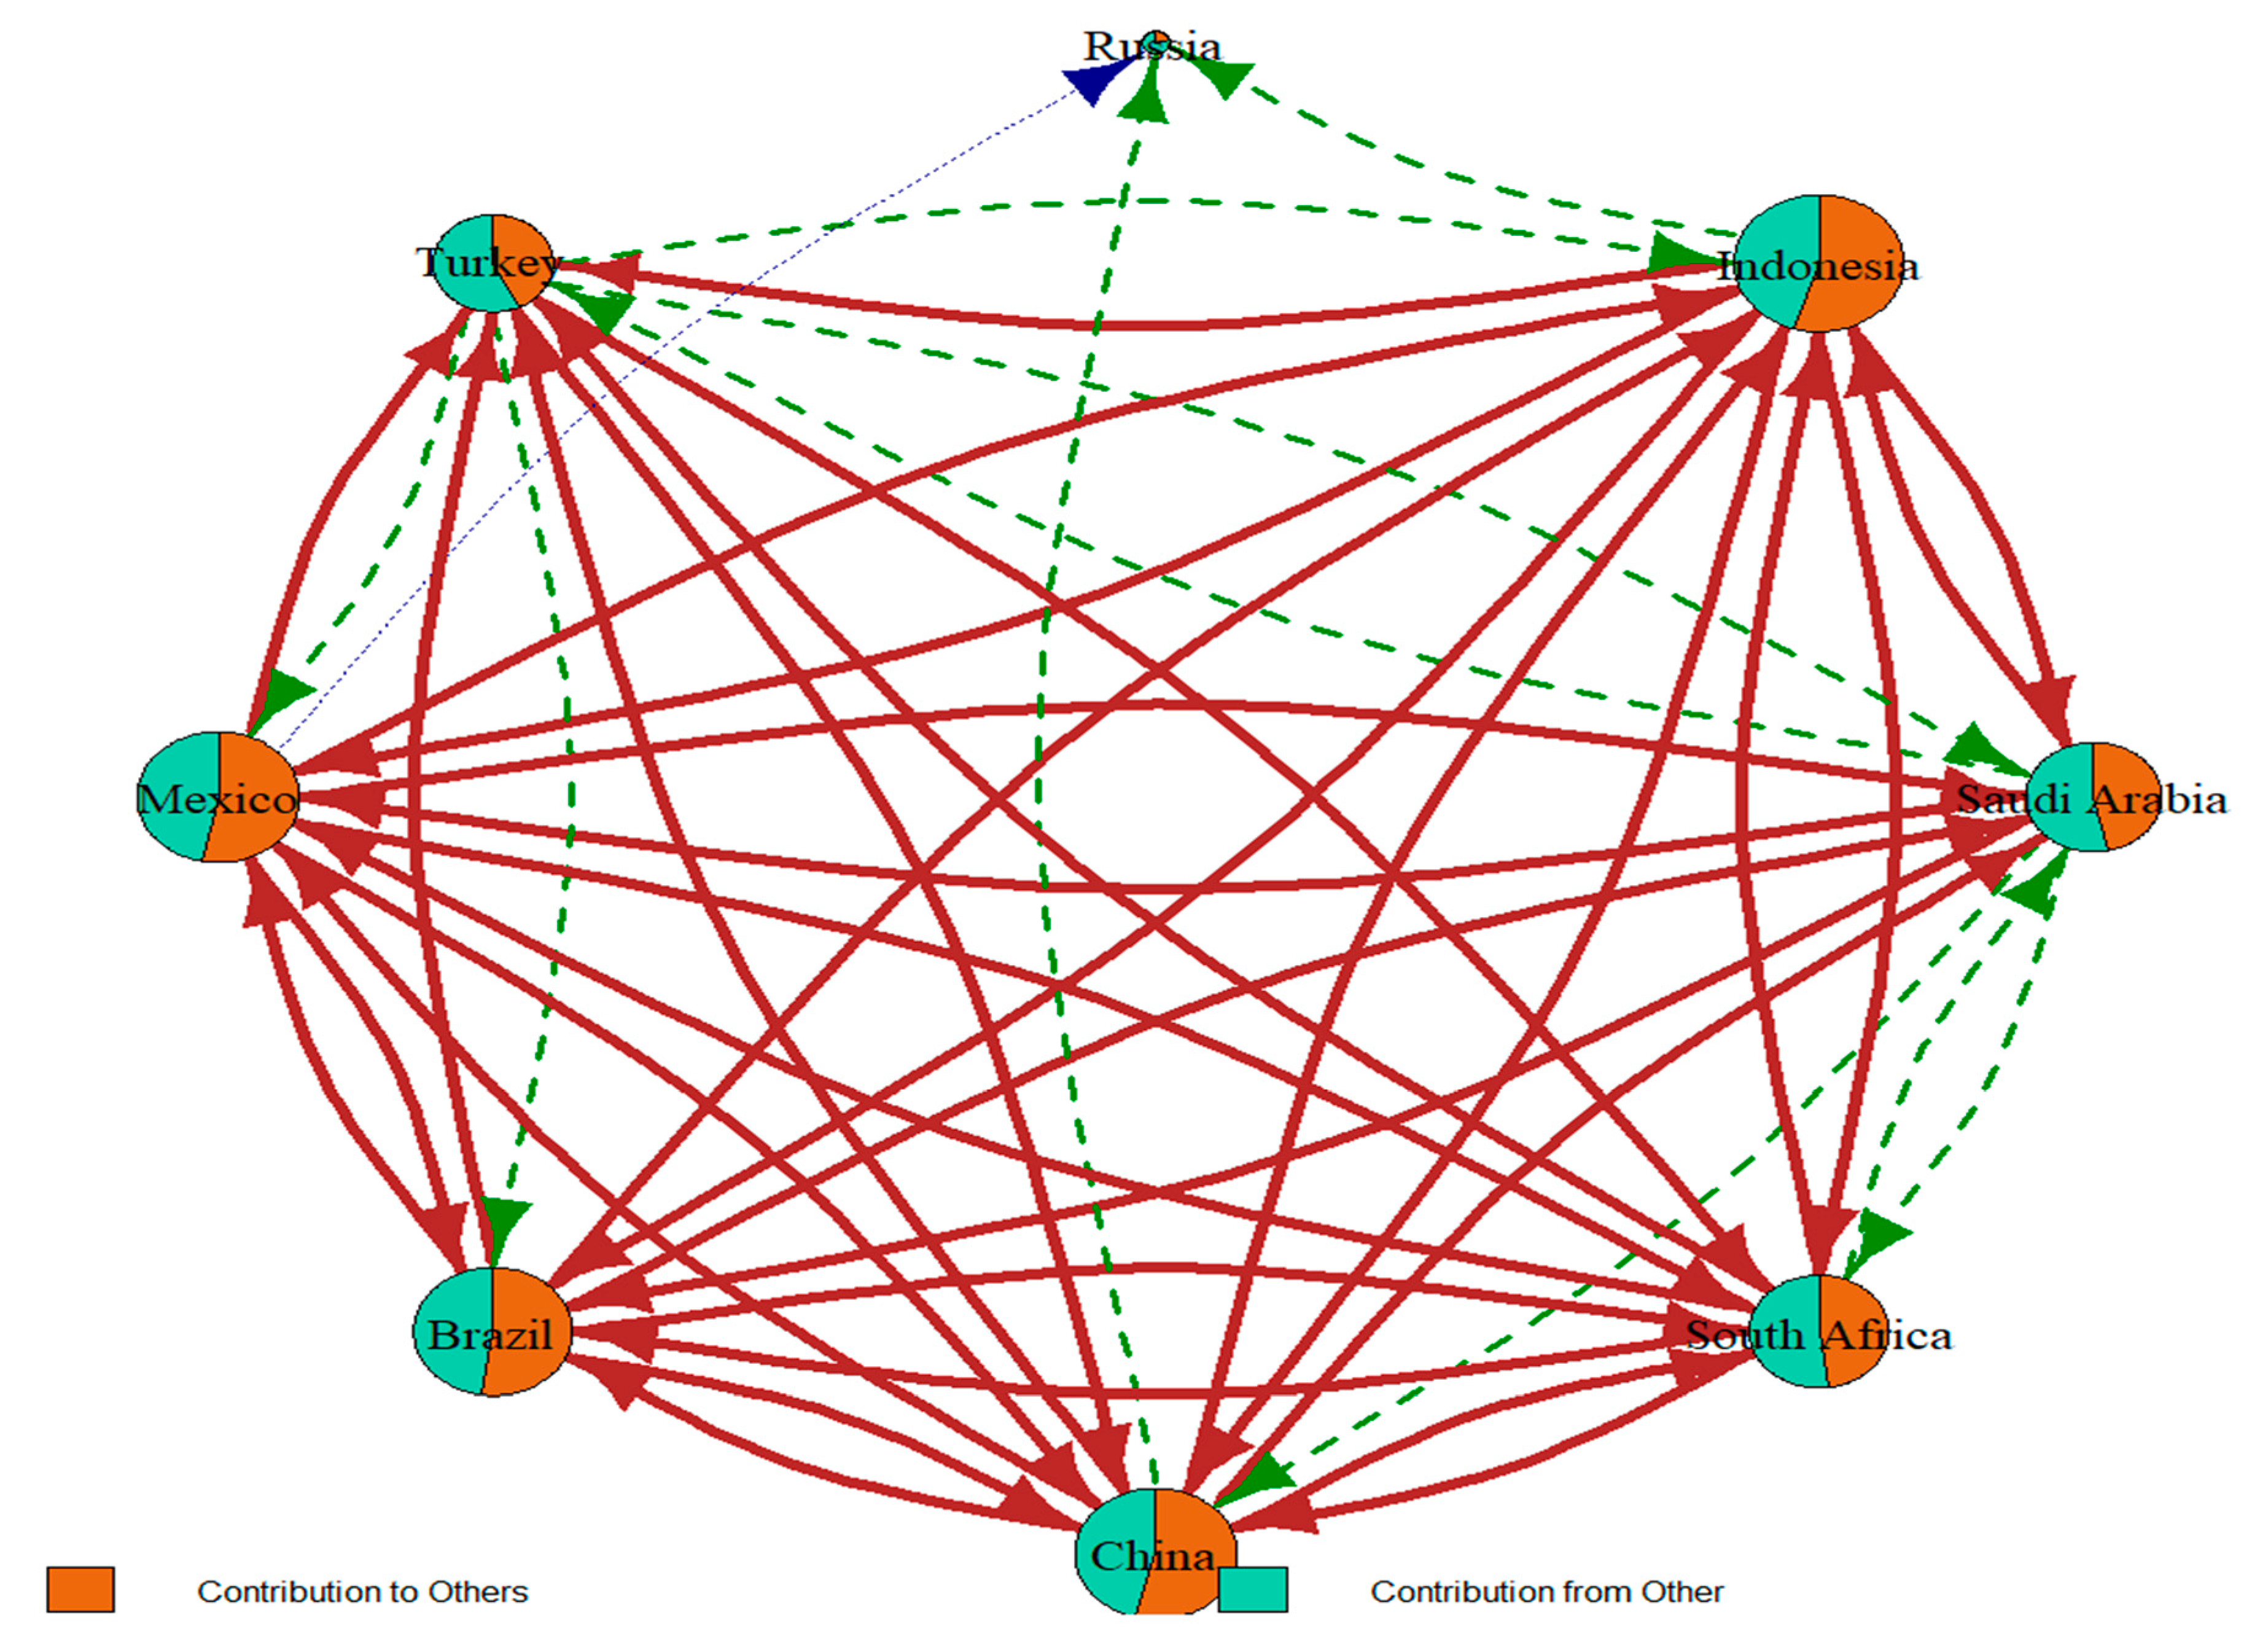
Figure 1 showcases the total connectedness graph, which is applied using the Diebold and Yilmaz (2012) approach. This network graph illustrates the total connectedness and volatilities during the sample period among emerging market countries, consisting of Saudi Arabia, Russia, China, South Africa, Brazil, Mexico, Indonesia, and Turkey. The node size in the graph indicates the extent of each country’s contribution to the system connectedness, and the node color shows the sources of connectedness. To illustrate, the red color represents the country’s contribution in consideration of the other countries in the sample. In contrast, the green color represents the contribution from other countries to the country in consideration. The arrows appear in different thicknesses and colors to represent the network’s spillover connectedness strength and magnitude. The red, stronger line arrows indicate a more than 20% spillover. In contrast, the green dotted arrows indicate an approximate spillover of 10–20%, and the blue ones indicate less than 10% spillover in the network.
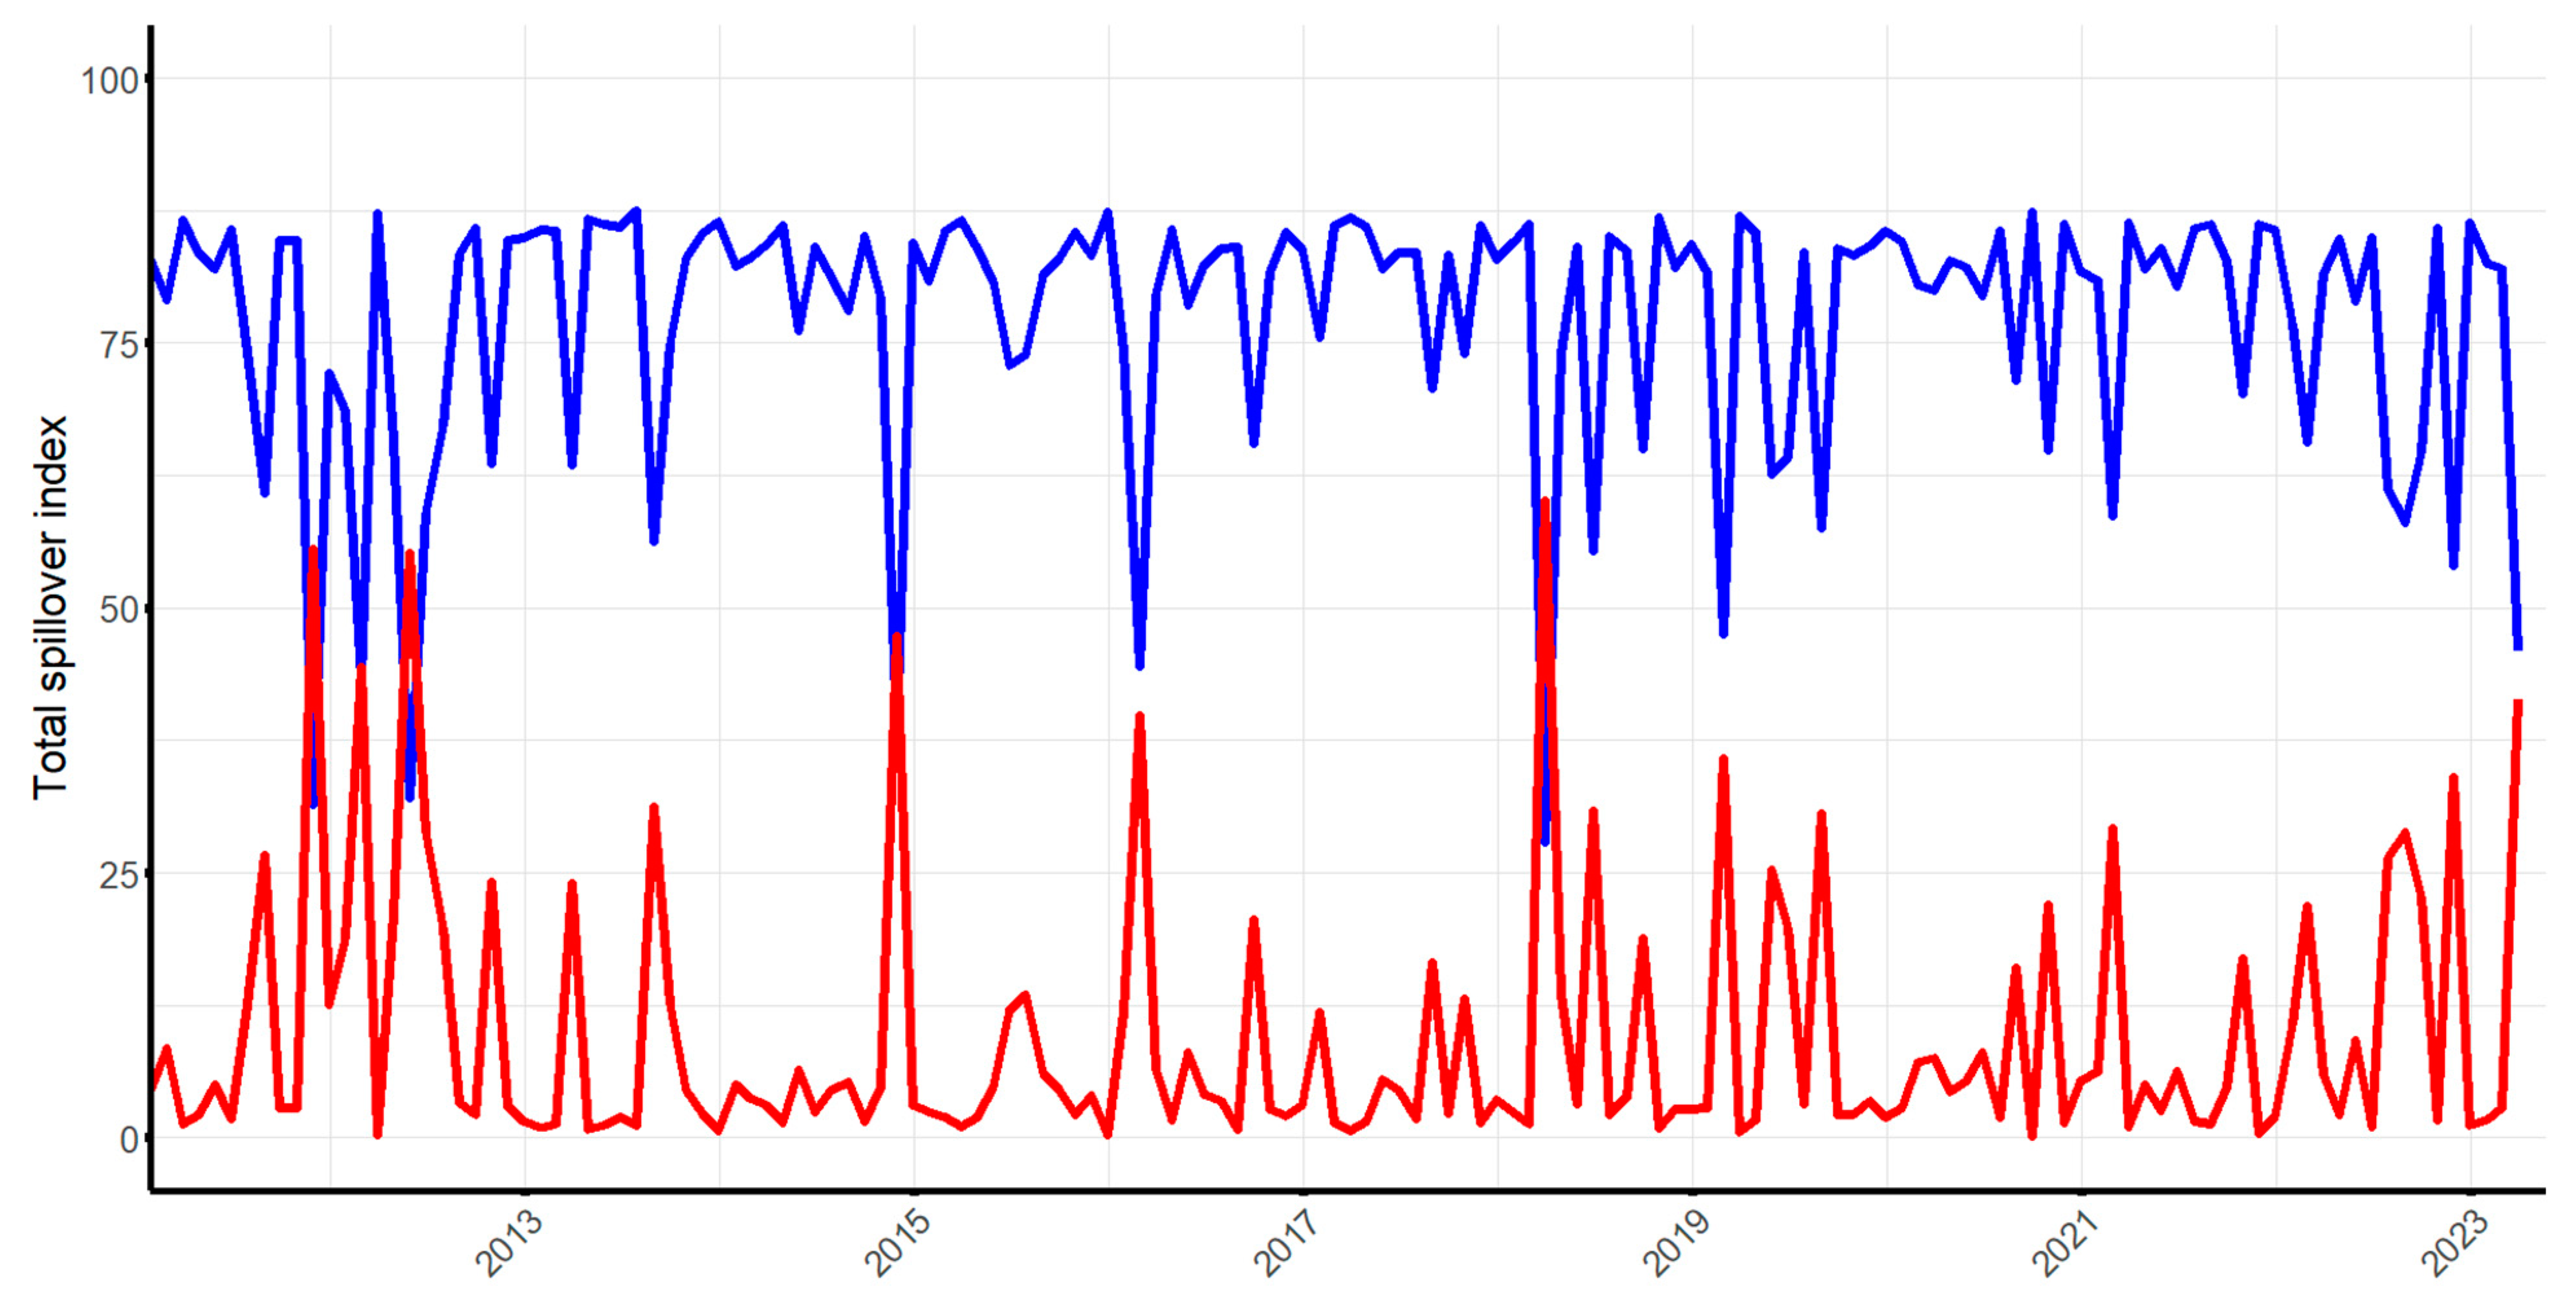
Figure 2 illustrates the overall total volatility spillover index estimates using the standard time-frequency domain of Diebold and Yilmaz (2012).
As shown in Figure 2, the spillover index is very susceptible to financial market crises and political and economic events. Figure 2 indicates a spike during the 2010–2011 Arab Spring, followed by another spike during the 2014–2016 oil price collapse and another spike around the COVID-19 pandemic crisis period during 2020. The last spike, which appeared during 2022–2023, could be attributed to the Russian–Ukrainian conflict. Stronger spillover effects among emerging market economies in the sample were mainly caused by the oil price collapse of 2014–2016, followed by the COVID-19 pandemic impact during 2020.
5.2. Frequency-Domain Spillover Analysis
This section takes the spillover analysis one step further. In addition to the time-domain approach of Diebold and Yilmaz (2012) discussed above, we employ the frequency-domain approach of Baruník and Křehlík (2018). The frequency-domain approach allows for the examination of the short- and long-run frequency responses to shocks, which enables the examination of spillover across the financial market in the short and long run. The approach is useful in examining the financial risk connectedness of emerging market countries for different timeframes. Since financial markets are dynamic, they react differently to economic and global financial crises during different periods or frequencies. Times of financial turmoil tend to excite reactions from different financial systems in different time horizons. Therefore, we examine the time and frequency dynamics of risk connectedness to perceive the different sources of sovereign credit risk connectedness across Saudi Arabia and other selected emerging market economies. Table 2 and Table 3 illustrate the total frequency domain spillover using the Baruník and Křehlík (2018) approach. The approach is utilized to differentiate between the stresses of financial connectedness among the selected emerging market countries in different time scales.
Table 2 shows that for directional spillover in the short run (1 month), Mexico and Brazil followed by Indonesia are the major net transmitters of financial shocks to emerging market countries in the sample. Table 3 indicates that Indonesia (12.32%) followed by China (11.52%) and Mexico (11.33%) are the main transmitters of volatility to selected emerging market countries in the sample.
Figure 3 showcases the total connectedness network graph of the pairwise volatility spillovers in the short run using the (Baruník and Křehlík 2018) approach. This network graph illustrates the level of total connectedness and volatilities during the sample period among emerging market countries in the sample, which consists of Saudi Arabia, Russia, China, South Africa, Brazil, Mexico, Indonesia, and Turkey. In the network, the red, stronger line arrows indicate spillover of more than 20%, while the green dotted arrows indicate approximate spillover of 10–20%, and the blue ones indicate less than 10% spillover. The node size in the graph indicates the extent of each country’s contribution to the system connectedness, and the color of the node shows the sources of connectedness. To illustrate, the red color represents the contribution of the country in consideration to the other countries in the sample, while the green color represents the contribution from other countries to the country in consideration. The arrows appear in different thickness and colors to represent spillover connectedness strength and magnitude.
Figure 4 shows the short and long-run spillover indices using the frequency domain (Baruník and Křehlík 2018) approach, with 1 month for the short run and 1 month to infinity for the long run. Spikes in Figure 4 show similarities in patterns of frequency in long and shorter terms.
5.3. The Impact of Global Uncertainty Factors on SCDS Spillovers
This section uses the joint total connectedness index obtained from Diebold and Yilmaz (2012) as the dependent variable to identify the factors affecting spillovers across quantiles. Theoretically, we assumed that many global risk factors could impact the shocks on SCDSs. These factors include (1) the climate policy uncertainty index (CPU), (2) the geopolitical risk index (GPR), (3) the CBOE Crude Oil Volatility Index (OVX), (4) the Merrill Lynch Option Volatility Estimate Index (MOVE), (5) the CBOE volatility index (VIX), and (6) the economic policy uncertainty index (EPU).
The quantile regression results (Table 4) indicate that the climate policy uncertainty index (CPU) shows a negative impact at higher quantiles, indicating that increased uncertainty in climate policy may lead to reduced spillover effects, especially at the 90th and 95th percentiles, with the latter showing significant negative effects. This could suggest that during periods of high market stress or uncertainty, investors might perceive climate policy as a factor adding to economic instability. The GPR has a significantly positive impact on lower quantiles, but this influence decreases as we move to higher quantiles. This implies that geopolitical risks are more influential during lower-stress periods in the market, possibly due to investors’ heightened sensitivity to geopolitical events when baseline conditions are stable.
The MOVE and the OVX show varying impacts across quantiles. MOVE indicates a significant positive impact at the highest quantile, suggesting that bond market volatility is dominant in spillovers during extreme market conditions. Conversely, OVX demonstrates a significant negative impact at the lower and higher quantiles, highlighting how oil price volatility might reduce spillovers in stable and highly uncertain market conditions. The EPU shows an increasing positive impact on spillovers as we move to higher quantiles, particularly significant at the 75th percentile. This suggests that economic policy uncertainty is critical to spillovers in more turbulent market conditions. Lastly, VIX exhibits a significant positive impact at lower quantiles, indicating its role as a predictor of spillover effects in relatively stable conditions. However, its influence diminishes in more extreme market scenarios.
Our additional analysis explores the hypothesis that global uncertainty factors have asymmetric effects on volatility spillovers, with more pronounced impacts during extreme market conditions. This is consistent with the notion that investors’ sensitivity to different types of risk may vary depending on the prevailing market environment. For instance, during periods of high market stress, factors such as EPU and MOVE exhibit heightened significance, suggesting that investors place greater emphasis on these indicators when assessing sovereign credit risk. Conversely, during stable periods, the significance of the OVX and CPU at lower quantiles indicates a differential weighting of risks by market participants.
6. Conclusions and Policy Implications
This paper has investigated the time-frequency approach of Diebold and Yilmaz (2012) along with the frequency-domain approach of Baruník and Křehlík (2018) for the connectedness of spillovers for selected emerging economies’ SCDSs, including Saudi Arabia, Russia, China, Indonesia, South Africa, Brazil, Mexico, and Turkey. This paper aimed to achieve two main goals. The first was to examine both the time domain as well as the frequency domain approach of connectedness. Second, the paper examined the determinants of volatility spillovers, using global financial, economic, commodity and climate uncertainty factors, to investigate the dynamics of financial connectedness and risk transmission among emerging market economies, then determine countries that are net transmitters or receivers of financial shocks. Our empirical results suggested various remarkable findings. First, there is a strong association among financial crises periods and spillover for emerging markets in the sample. Second, among emerging markets in the sample, Indonesia followed by China and Mexico were the main transmitters of sovereign credit risk volatility. Third, the examination of the impact of the global uncertainty factors on SCDSs indicates that among global factors, VIX, EPU, GPR, and MOVE showed a positive impact on spillover in lower and higher quantiles, while CPU and OVX had negative impacts on higher and lower quantiles of the spillover.
The results indicate that the spillover among selected emerging market economies is mainly driven by Indonesia and Mexico, as they appear to be the risk transmitters to other markets in the sample. These empirical findings fuel several policy implications for international investors, policymakers, researchers, and central bankers. International investors should pay significant attention to investing in emerging market countries, especially when investing in countries that are more prone to receiving risk. Diversification is a key factor in investing in emerging market countries. Policymakers and central bankers should exercise extreme caution when making monetary decisions, considering the sensitivity of emerging market credit risk to financial crises and political events. This research presents valuable insights to academics and researchers who wish to further investigate the dynamics of sovereign credit risk spillover among emerging market countries. This paper’s findings open avenues for future research on emerging market spillovers and transmission networks. Future research could beneficially extend the scope of this study to include developed economies, thereby offering a richer understanding of the comprehensive dynamics of financial spillovers across the global economic landscape. This expansion is critical to investigating the relationships between emerging and developed markets, especially in the context of “flight-to-quality” behaviors during periods of market volatility. By examining the spillover effects from emerging markets into developed ones, future studies could illuminate the resilience of the global financial system and the mechanisms underlying risk contagion.
Author Contributions
Conceptualization, S.A. and N.N.; methodology, N.N. and S.A.; software, N.N.; validation, N.N. and K.A.; formal analysis, S.A.; investigation, S.A.; resources, S.A.; data curation, S.A.; writing—original draft preparation, S.A.; writing—review and editing, N.N. and K.A.; visualization, S.A.; supervision, N.N.; project administration, N.N. All authors have read and agreed to the published version of the manuscript.
Funding
This research received no external funding.
Data Availability Statement
Data available upon request.
Conflicts of Interest
The authors declare no conflict of interest.
References
- Abed, R. E., Sahar Boukadida, and Warda Jaidane. 2019. Financial Stress Transmission from Sovereign Credit Market to Financial Market: A Multivariate FIGARCH-DCC Approach. Global Business Review 20: 1122–40. [Google Scholar] [CrossRef]
- Abid, Fathi, and Nader Naifar. 2006. The Determinants of Credit Default Swap Rates: An Explanatory Study. International Journal of Theoretical and Applied Finance 9: 23–42. [Google Scholar] [CrossRef]
- Amstad, Marlene, Eli Remolona, and Jimmy Shek. 2016. How do global investors differentiate between sovereign risks? The new normal versus the old. Journal of International Money and Finance 66: 32–48. [Google Scholar] [CrossRef]
- Augustin, Patrick, Hamid Boustanifar, Johannes Breckenfelder, and Jan Schnitzler. 2018. Sovereign to Corporate Risk Spillovers. Journal of Money, Credit and Banking 50: 857–91. [Google Scholar] [CrossRef]
- Augustin, Patrick, Valeri Sokolovski, Marti G. Subrahmanyam, and Davide Tomio. 2020. In Sickness and in Debt: The COVID-19 Impact on Sovereign Credit Risk. SSRN Electronic Journal. Available online: https://doi.org/10.2139/ssrn.3613432 (accessed on 1 March 2024).
- Baffes, John, Alain N. Kabundi, Peter S. O. Nagle, and Franziska Ohnsorge. 2018. The Role of Major Emerging Markets in Global Commodity Demand. World Bank Policy Research Working Paper, 8495. Washington, DC: World Bank Group. [Google Scholar]
- Baker, Scott R., Nicholas Bloom, and Steven J. Davis. 2016. Measuring Economic Policy Uncertainty. The Quarterly Journal of Economics 131: 1593–636. [Google Scholar] [CrossRef]
- Balcilar, Mehmet, Ahmed H. Elsayed, and Shawkat Hammoudeh. 2023. Financial connectedness and risk transmission among MENA countries: Evidence from connectedness network and clustering analysis. Journal of International Financial Markets, Institutions and Money 82: 101656. [Google Scholar] [CrossRef]
- Balcilar, Mehmet, Zeynel Abidin Ozdemir, Huseyin Ozdemir, and Mark E. Wohar. 2020. Spillover effects in oil-related CDS markets during and after the sub-prime crisis. The North American Journal of Economics and Finance 54: 101249. [Google Scholar] [CrossRef]
- Ballester, Laura, and Ana González-Urteaga. 2021. Do sovereign ratings cause instability in cross-border emerging CDS markets? International Review of Economics and Finance 72: 643–63. [Google Scholar] [CrossRef]
- Baruník, Jozef, and Tomas Křehlík. 2018. Measuring the Frequency Dynamics of Financial Connectedness and Systemic Risk. Journal of Financial Econometrics 16: 271–96. [Google Scholar] [CrossRef]
- Bottero, Margherita, Simone Lenzu, and Filippo Mezzanotti. 2020. Sovereign debt exposure and the bank lending channel: Impact on credit supply and the real economy. Journal of International Economics 126: 103328. [Google Scholar] [CrossRef]
- Bouri, Elie, Syed J. H. Shahzad, Naveed Raza, and David Roubaud. 2018. Oil volatility and sovereign risk of BRICS. Energy Economics 70: 258–69. [Google Scholar] [CrossRef]
- Cevik, Serhan, and Joao T. Jalles. 2022. This changes everything: Climate shocks and sovereign bonds. Energy Economics 107: 105856. [Google Scholar] [CrossRef]
- Da Silva Souza, Rodrigo, and Renee Fry-McKibbin. 2021. Global liquidity and commodity market interactions: Macroeconomic effects on a commodity exporting emerging market. International Review of Economics and Finance 76: 781–800. [Google Scholar] [CrossRef]
- Diebold, Francis X., and Kamil Yilmaz. 2012. Better to give than to receive: Predictive directional measurement of volatility spillovers. International Journal of Forecasting 28: 57–66. [Google Scholar] [CrossRef]
- Eichengreen, Barry, and Poonam Gupta. 2015. Tapering talk: The impact of expectations of reduced Federal Reserve security purchases on emerging markets. Emerging Markets Review 25: 1–15. [Google Scholar] [CrossRef]
- Eyssell, Thomas, Hung-G. Fung, and Gaiyan Zhang. 2013. Determinants and price discovery of China sovereign credit default swaps. China Economic Review 24: 1–15. [Google Scholar] [CrossRef]
- Gavriilidis, Konstantinos. 2021. Measuring Climate Policy Uncertainty. SSRN Electronic Journal. SSRN Scholarly Paper 3847388. Available online: https://doi.org/10.2139/ssrn.3847388 (accessed on 1 March 2024).
- Ghenimi, Ameni, Hasna Chaibi, and Mohamed Omri. 2017. The effects of liquidity risk and credit risk on bank stability: Evidence from the MENA region. Borsa Istanbul Review 17: 238–48. [Google Scholar] [CrossRef]
- Härdle, Wolfgang K., Weining Wang, and Lining Yu. 2016. TENET: Tail-Event driven NETwork risk. Journal of Econometrics 192: 499–513. [Google Scholar] [CrossRef]
- Hibbert, Ann M., and Ivelina Pavlova. 2017. The drivers of sovereign cds spread changes: Local versus global factors. Financial Review 52: 435–57. [Google Scholar] [CrossRef]
- Hilscher, Jens, and Yves Nosbusch. 2010. Determinants of Sovereign Risk: Macroeconomic Fundamentals and the Pricing of Sovereign Debt. Review of Finance 14: 235–62. [Google Scholar] [CrossRef]
- Hu, Biliang, Xing Tang, Lin Yin, and Qian Liu. 2021. Emerging Markets Redefined: Comprehensive Measurement and Future Prospects. Global Journal of Emerging Market Economies 13: 165–91. [Google Scholar] [CrossRef]
- Kamber, Gunes, Özer Karagedikli, and Michael Ryan. 2016. International Spill-Overs of Uncertainty Shocks: Evidence from a FAVAR. (Working Paper No. 61/2016). Centre for Applied Macroeconomic Analysis, Crawford School of Public Policy. Available online: https://ssrn.com/abstract=2848034 (accessed on 1 March 2024).
- Liu, Weifeng, Warwick J. McKibbin, Adele C. Morris, and Peter J. Wilcoxen. 2020. Global economic and environmental outcomes of the Paris Agreement. Energy Economics 90: 104838. [Google Scholar] [CrossRef]
- Liu, Yang, and Bruce Morley. 2012. Sovereign credit default swaps and the macroeconomy. Applied Economics Letters 19: 129–32. [Google Scholar] [CrossRef]
- Longstaff, Francis A., Jun Pan, Lasse H. Pedersen, and Kenneth J. Singleton. 2011. How Sovereign Is Sovereign Credit Risk? American Economic Journal: Macroeconomics 3: 75–103. [Google Scholar] [CrossRef]
- McCollum, David L., Wenji Zhou, Christoph Bertram, Harmen-S. de Boer, Valentina Bosetti, Sebastian Busch, Jacques Després, Laurent Drouet, Johannes Emmerling, Marianne Fay, and et al. 2018. Energy investment needs for fulfilling the Paris Agreement and achieving the Sustainable Development Goals. Nature Energy 3: 589–99. [Google Scholar] [CrossRef]
- Merton, Robert C. 1974. On the Pricing of Corporate Debt: The Risk Structure of Interest Rates. Journal of Finance 29: 449. [Google Scholar]
- Naifar, Nader. 2023. Does climate change affect sovereign credit risk? International evidence. Borsa Istanbul Review 23: S84–S95. [Google Scholar] [CrossRef]
- Naifar, Nader, and Syed J. H. Shahzad. 2021. Tail event-based sovereign credit risk transmission network during COVID-19 pandemic. Finance Research Letters 45: 102182. [Google Scholar] [CrossRef]
- Oliveira, Luis, Jose D. Curto, and Joao P. Nunes. 2012. The determinants of sovereign credit spread changes in the Euro-zone. Journal of International Financial Markets, Institutions and Money 22: 278–304. [Google Scholar] [CrossRef]
- Pan, Jun, and Kenneth J. Singleton. 2008. Default and Recovery Implicit in the Term Structure of Sovereign CDS Spreads. Journal of Finance 63: 2345–84. [Google Scholar] [CrossRef]
- Poon, Winnie P., Jianfu Shen, and John E. Burnett. 2017. An empirical study of international spillover of sovereign risk to bank credit risk. Financial Review 52: 281–302. [Google Scholar] [CrossRef]
- Pretorius, Anmar. 2023. How did advanced emerging stock markets respond to COVID-19 and the Ukraine invasion? Journal of Economic and Financial Sciences 16: a820. [Google Scholar] [CrossRef]
- Remolona, Eli, Michela Scatigna, and Eliza Wu. 2008. The Dynamic Pricing of Sovereign Risk in Emerging Markets: Fundamentals and Risk Aversion. The Journal of Fixed Income 17: 57–71. [Google Scholar] [CrossRef]
- Ren, Xiaohang, Xiao Zhang, Cheng Yan, and Giray Gozgor. 2022. Climate policy uncertainty and firm-level total factor productivity: Evidence from China. Energy Economics 113: 106209. [Google Scholar] [CrossRef]
- Rikhotso, Prayer M., and Beatrice D. Simo-Kengne. 2022. Dependence Structures between Sovereign Credit Default Swaps and Global Risk Factors in BRICS Countries. Journal of Risk and Financial Management 15: 109. [Google Scholar] [CrossRef]
- Sabkha, Saker, Christian de Peretti, and Dorra Mezzez Hmaied. 2019. International risk spillover in sovereign credit markets: An empirical analysis. Managerial Finance 45: 1020–40. [Google Scholar] [CrossRef]
- Stolbov, Mikhail. 2017. Determinants of sovereign credit risk: The case of Russia. Post-Communist Economies 29: 51–70. [Google Scholar] [CrossRef]
- Xu, Xin, Shupei Huang, Brian M. Lucey, and Haizhong An. 2023. The impacts of climate policy uncertainty on stock markets: Comparison between China and the US. International Review of Financial Analysis 88: 102671. [Google Scholar] [CrossRef]
- Yang, Lu, and Shigeyuki Hamori. 2023. Modeling the global sovereign credit network under climate change. International Review of Financial Analysis 87: 102618. [Google Scholar] [CrossRef]
- Zenios, Stavros A. 2022. The risks from climate change to sovereign debt. Climatic Change 172: 30. [Google Scholar] [CrossRef]
Figure 1.
Diebold and Yilmaz (2012) volatility spillover network.
Figure 1.
Diebold and Yilmaz (2012) volatility spillover network.
Figure 2.
Spillover index dynamics using the standard time-frequency domain.
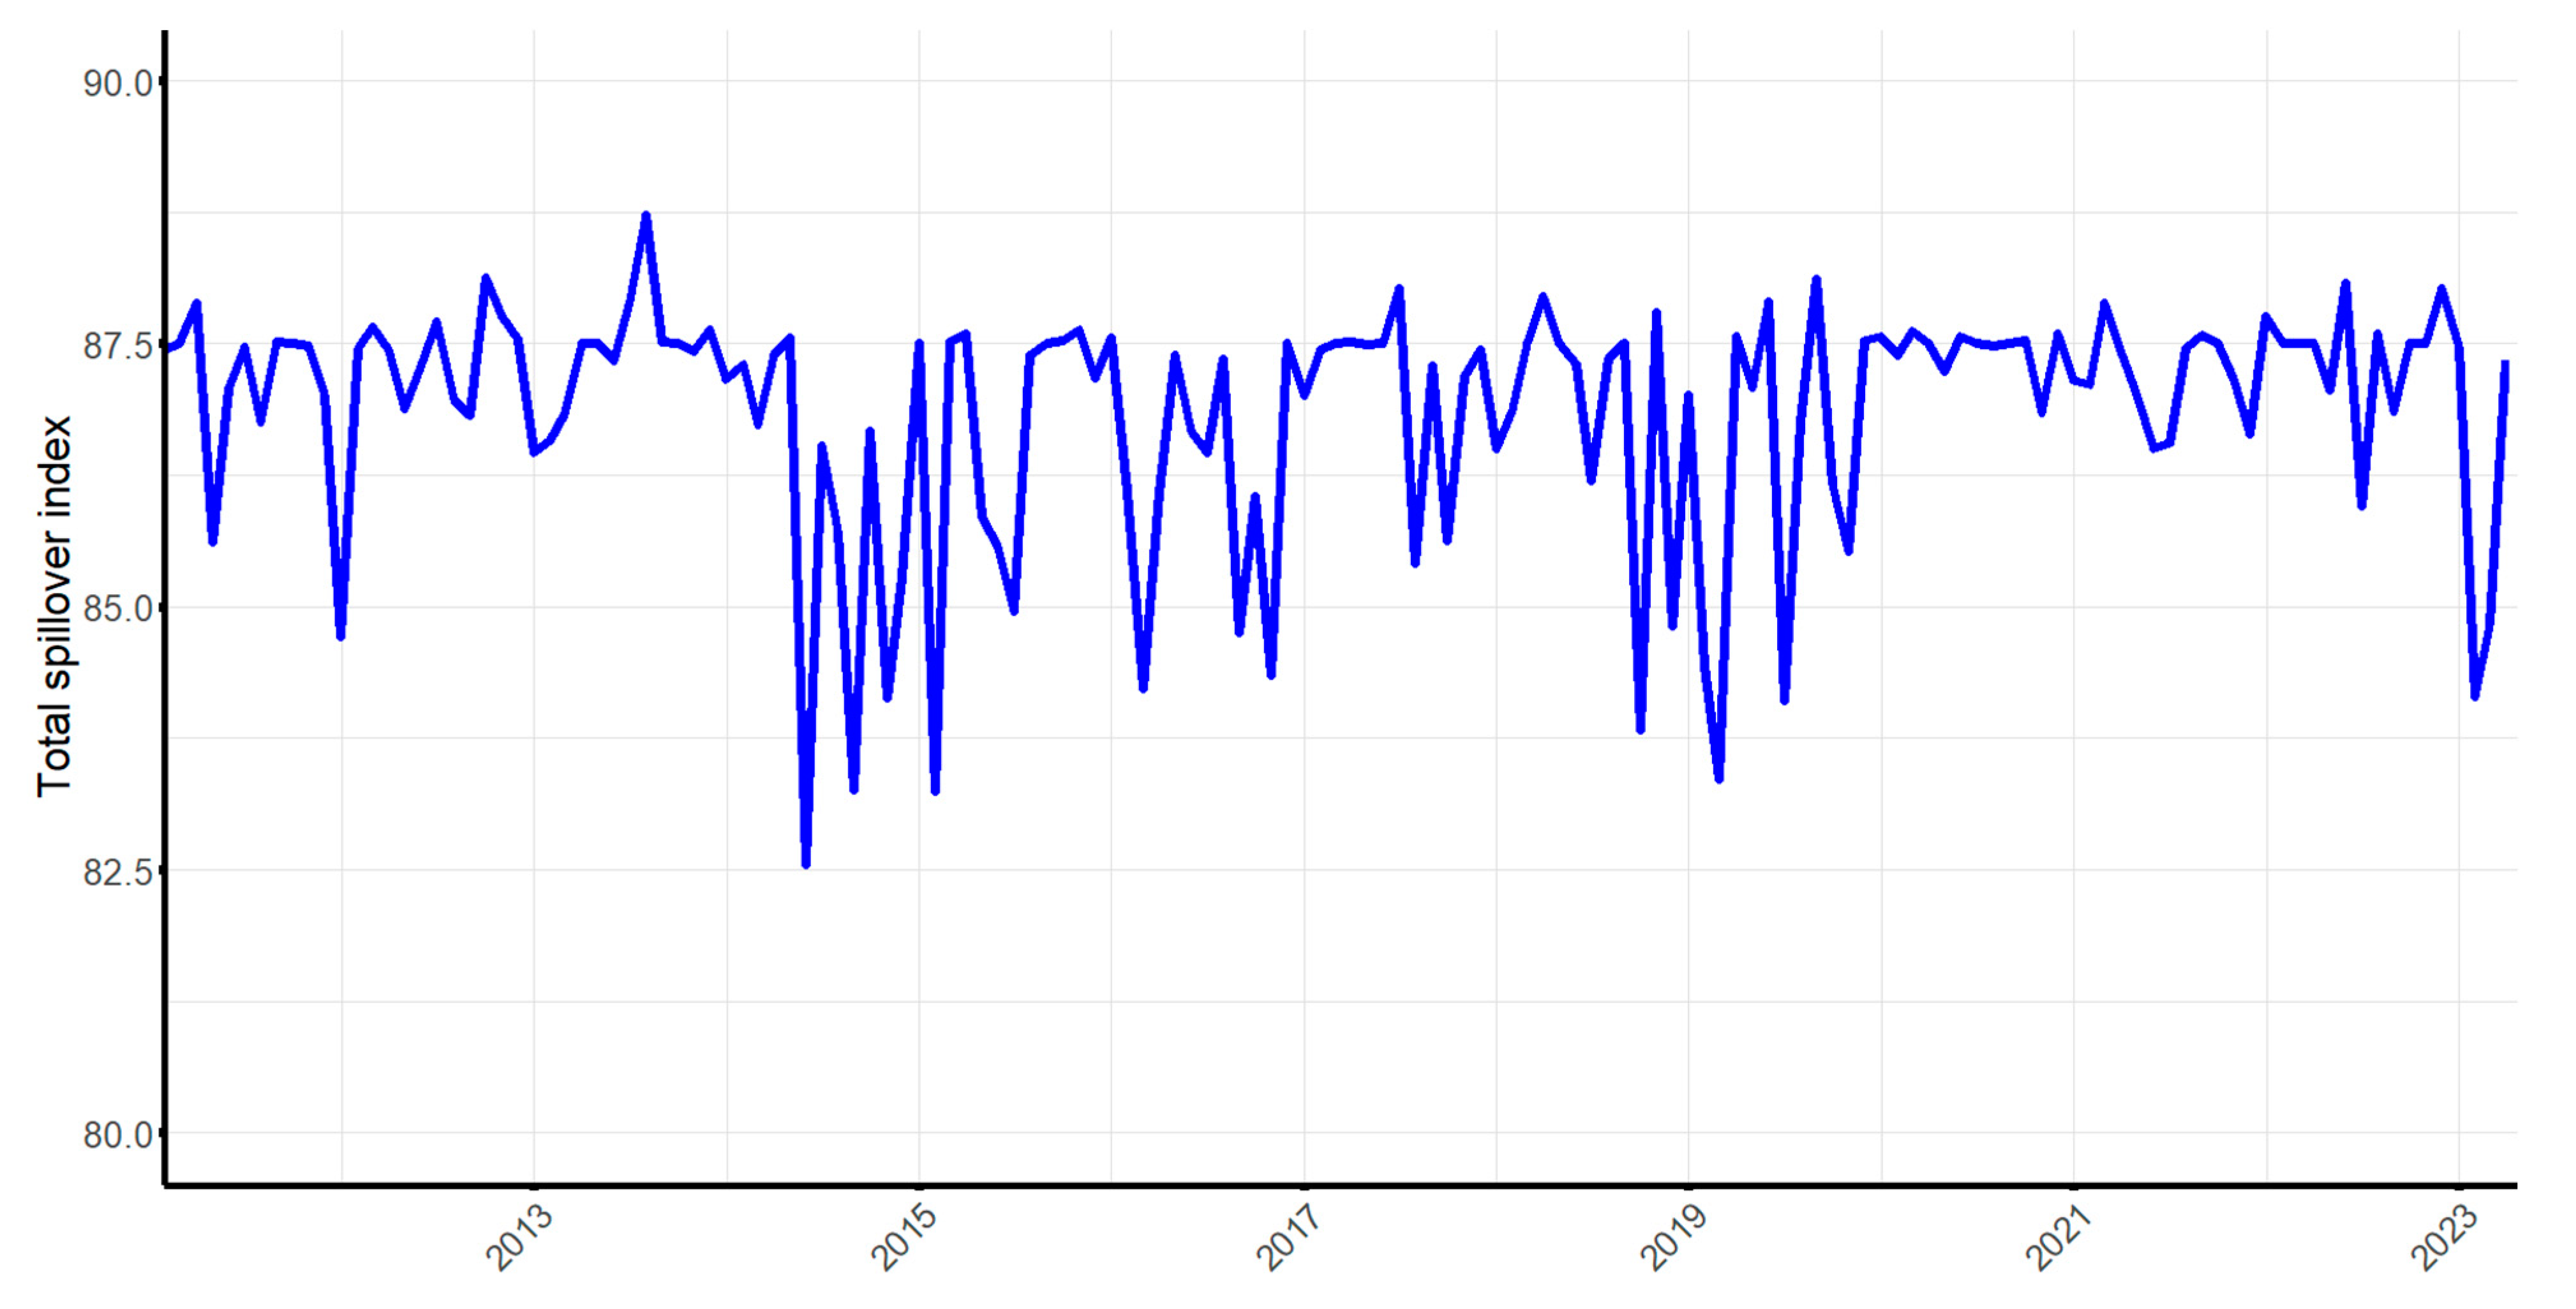
Figure 3.
Total connectedness network in the short and long run.
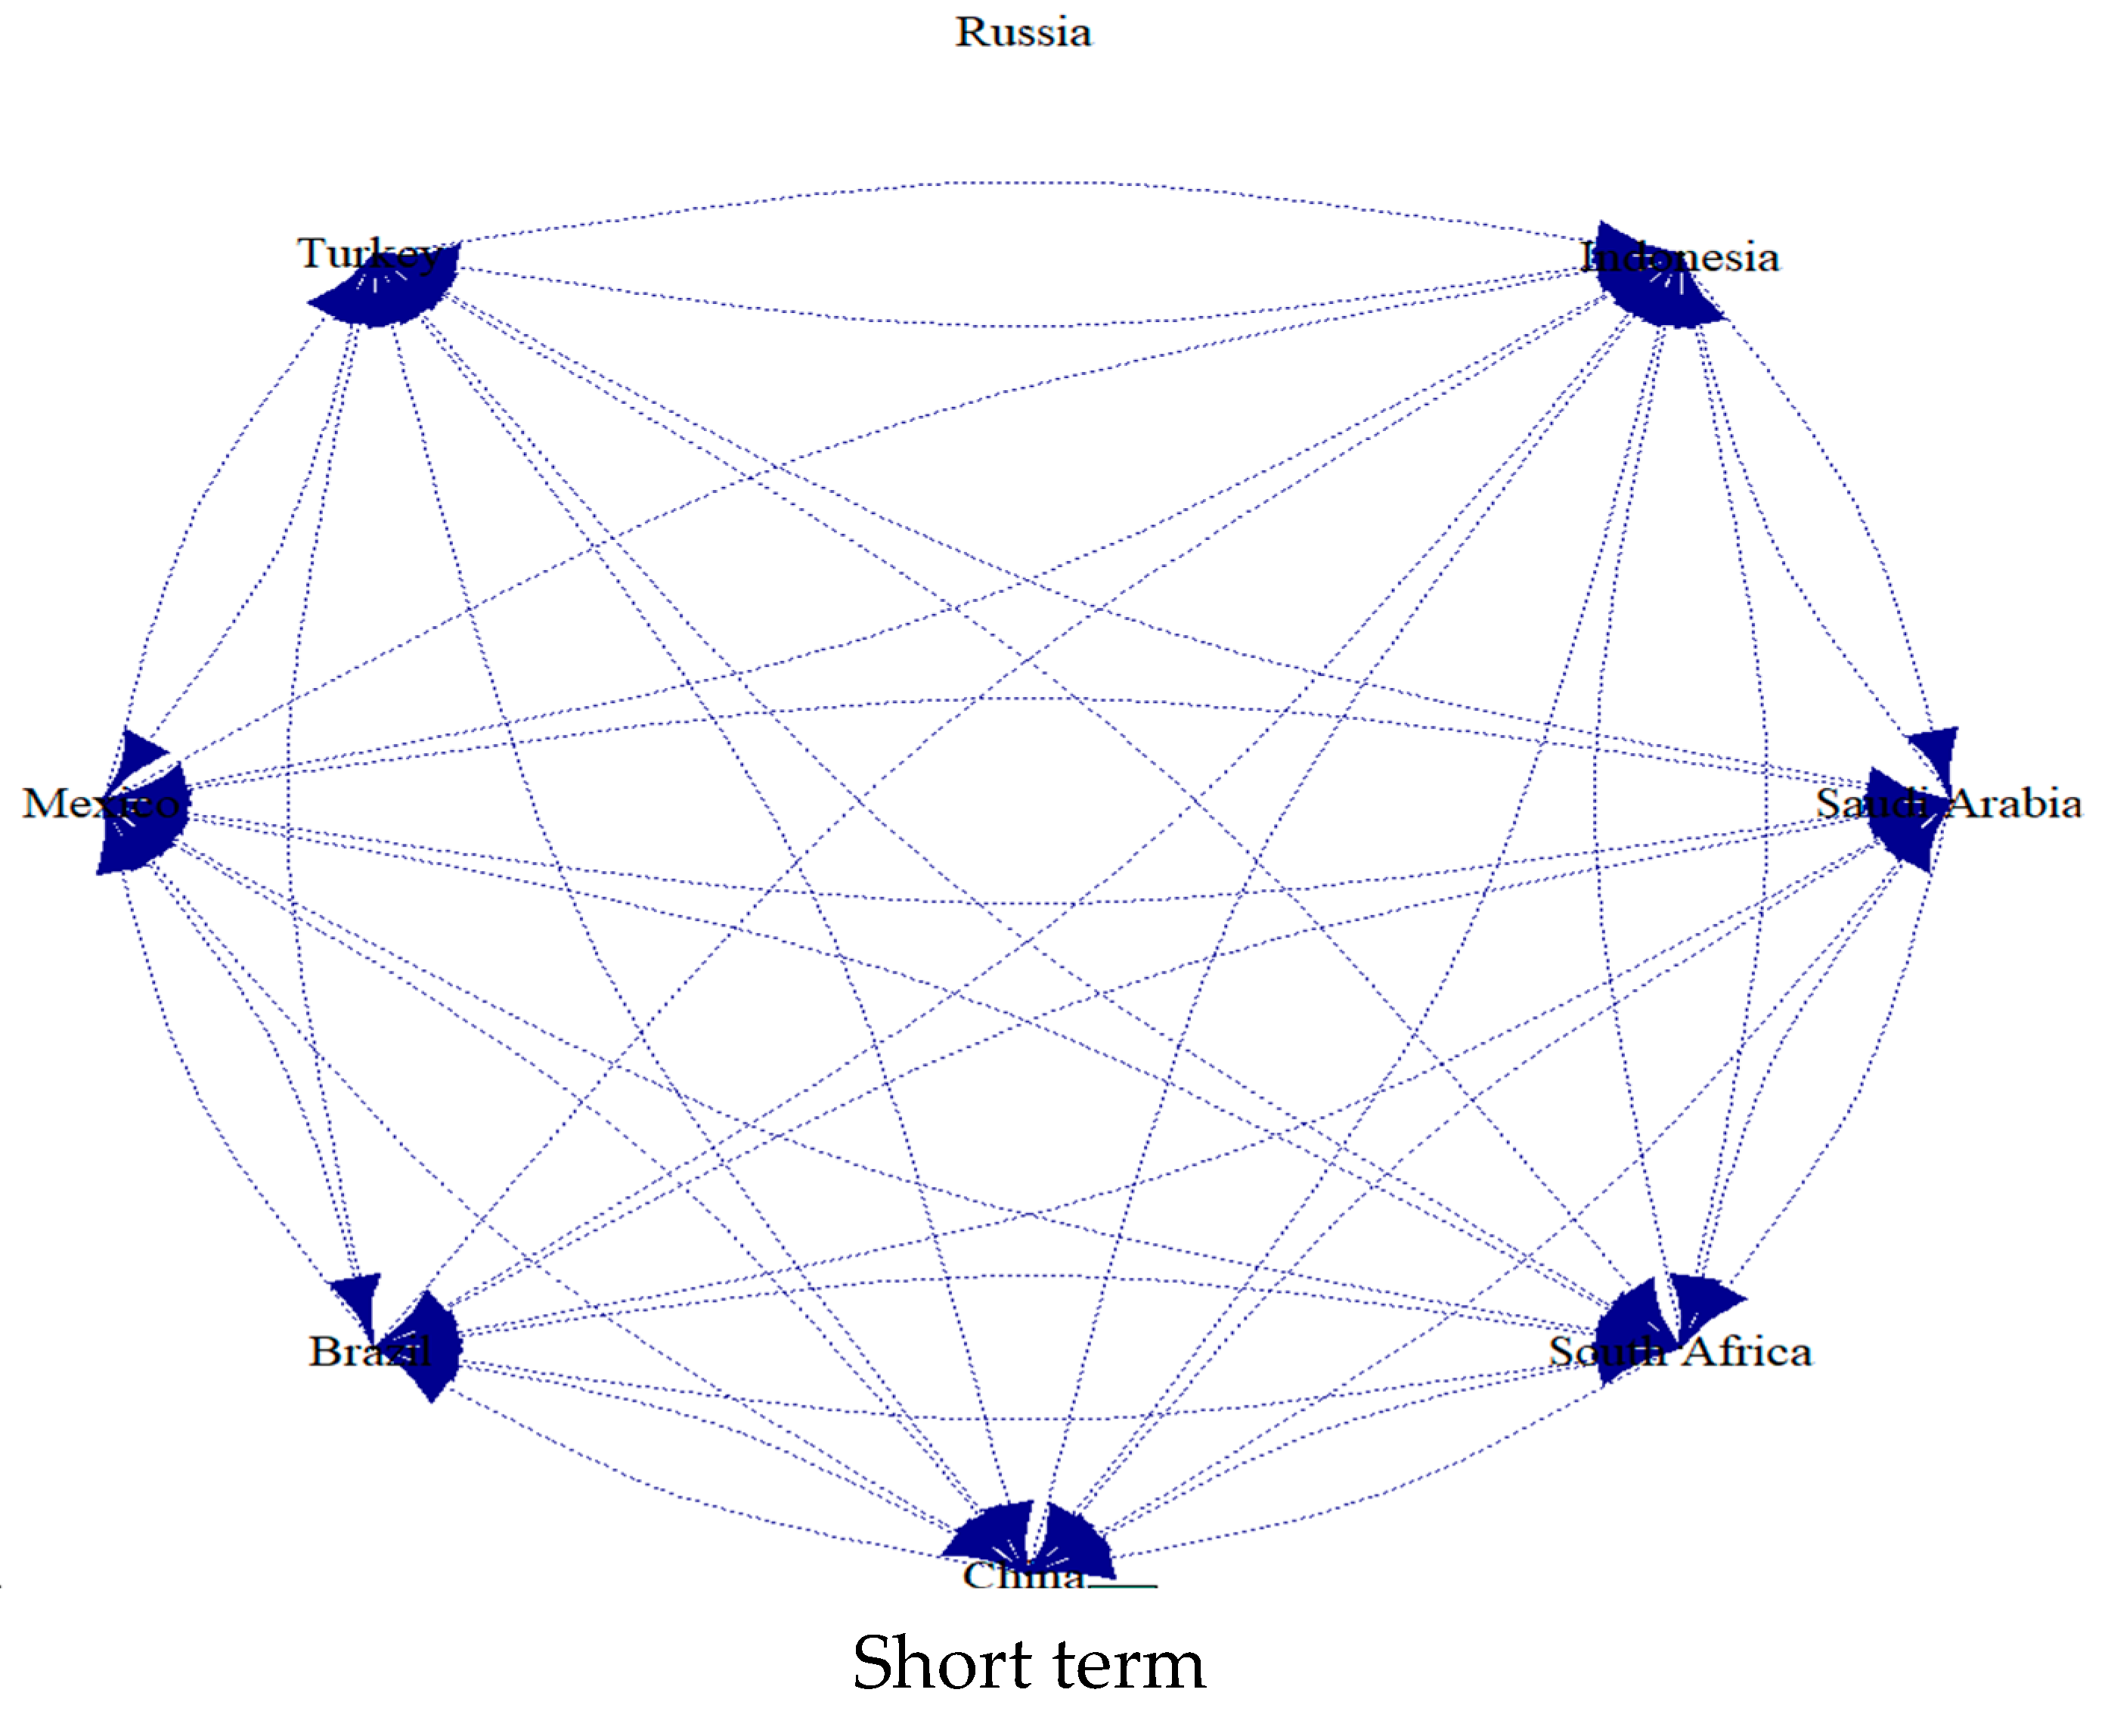
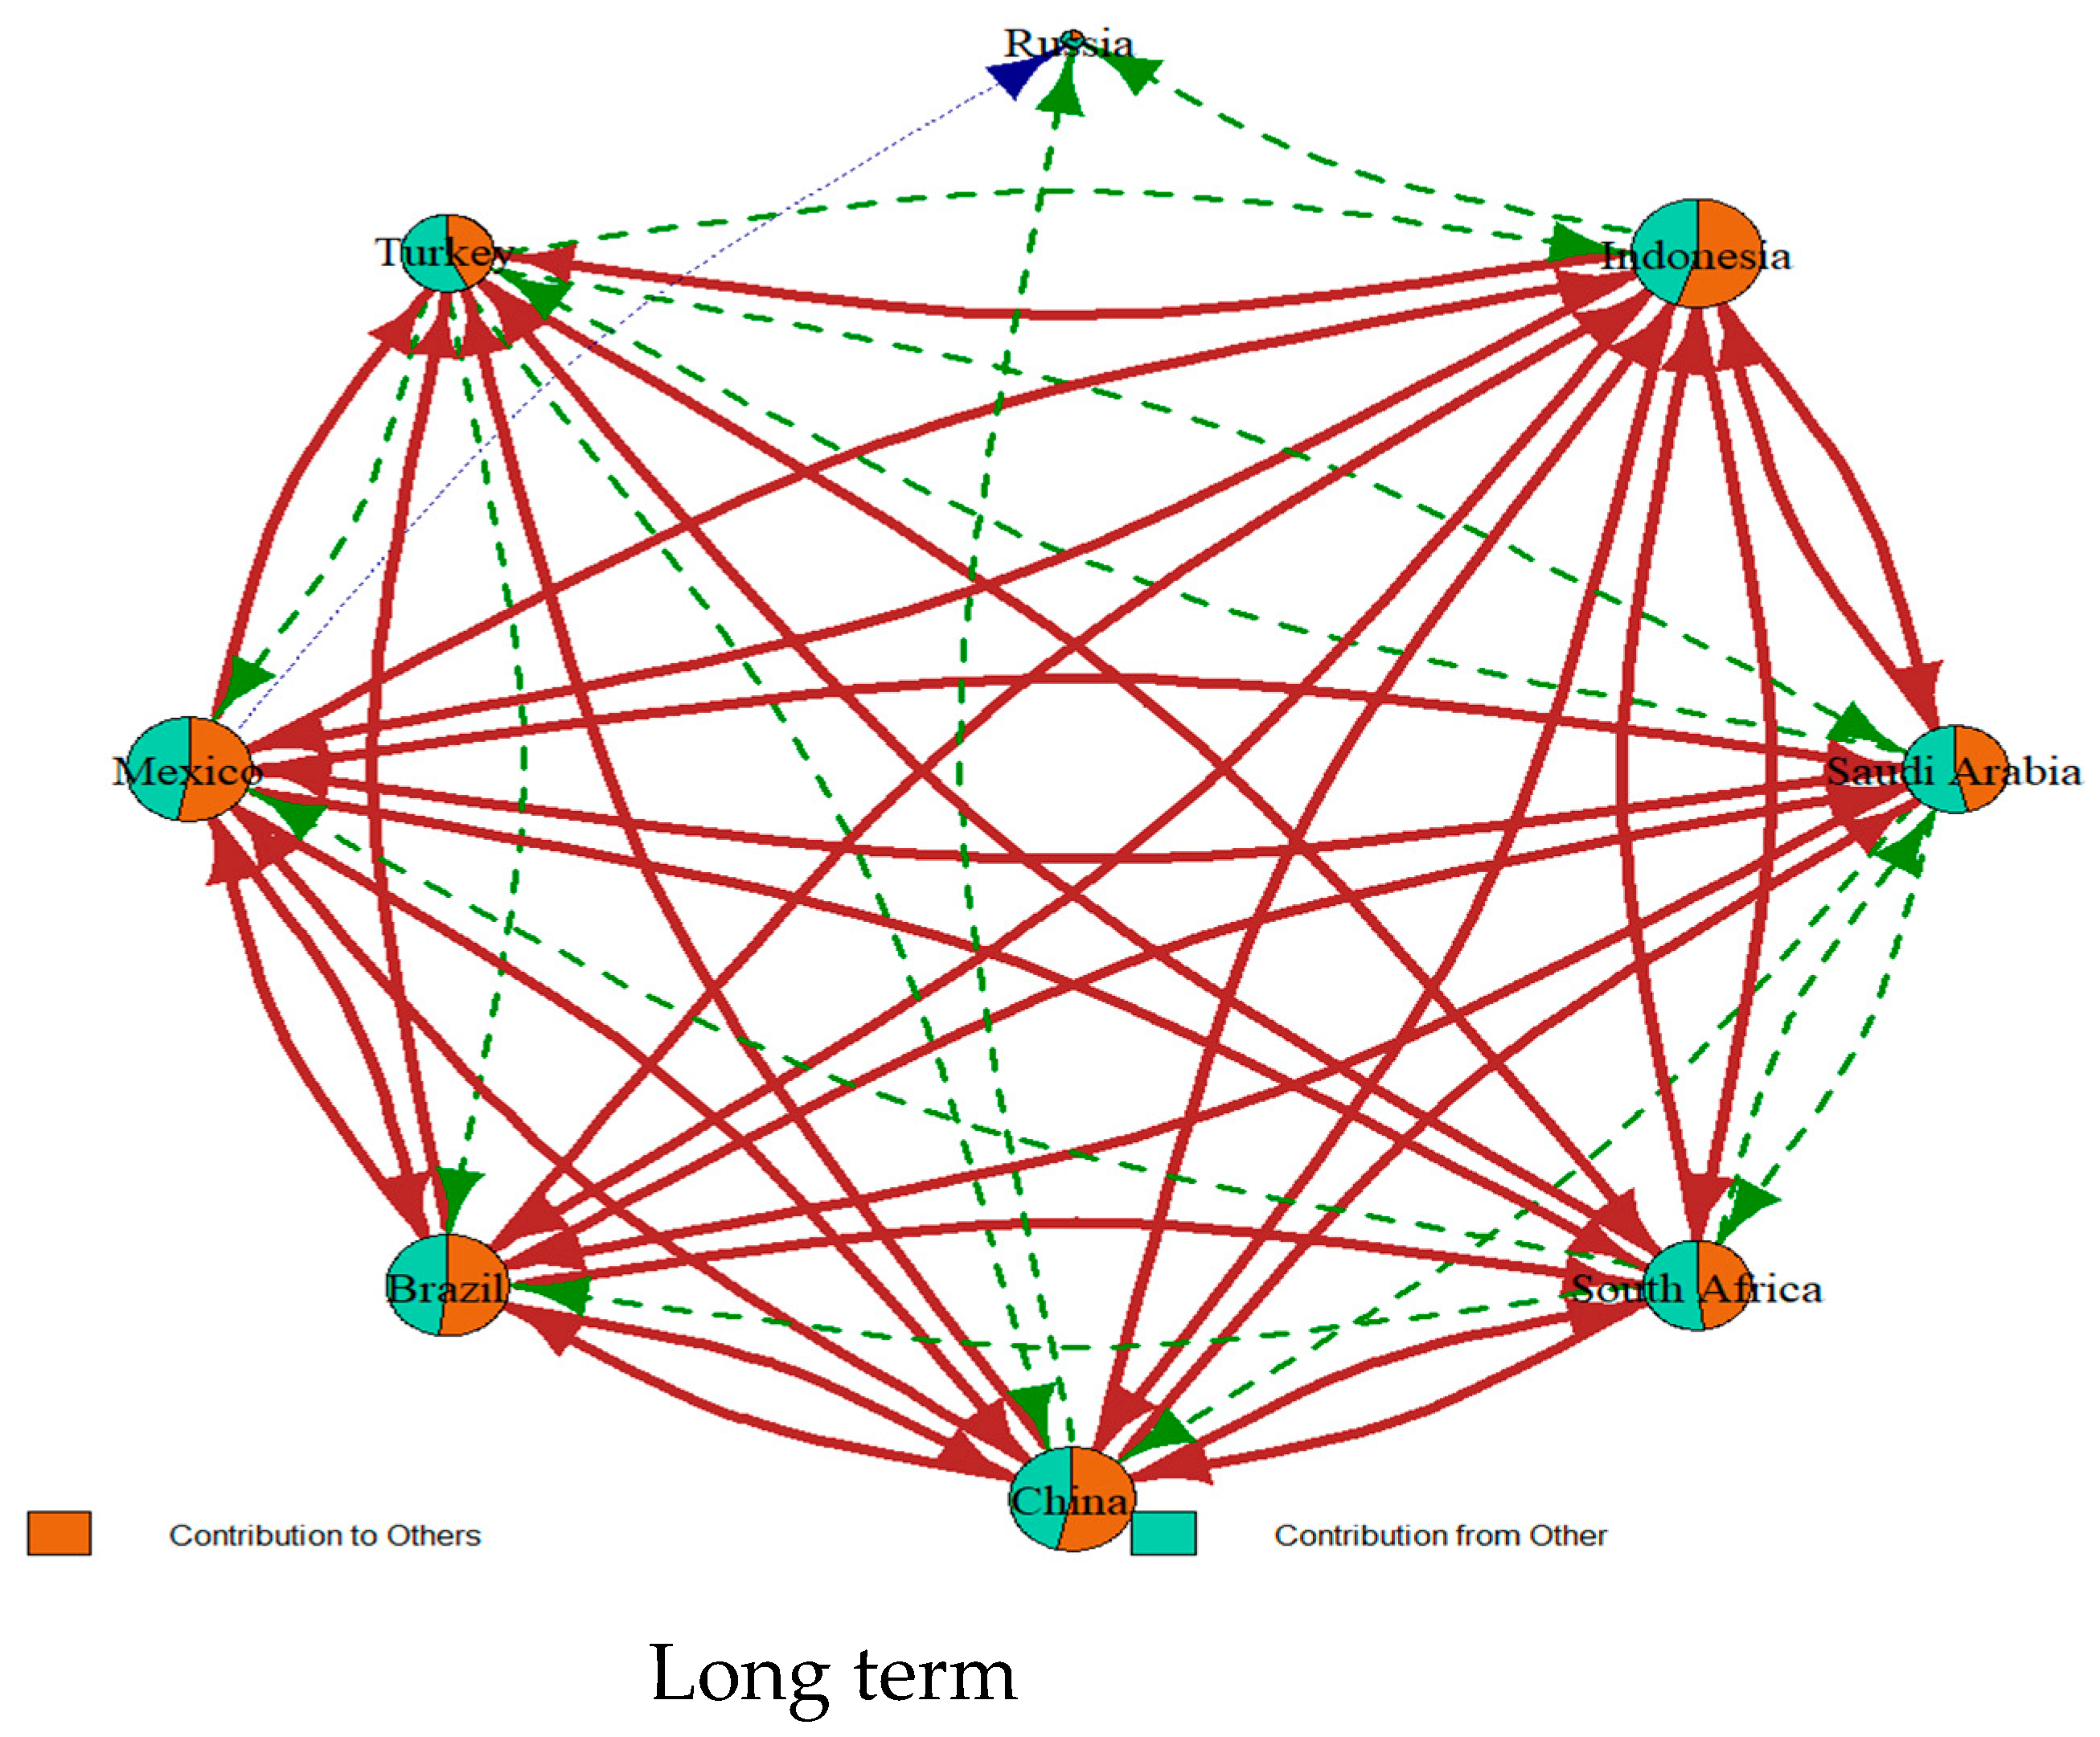
Figure 4.
Total connectedness index dynamics using the (Baruník and Křehlík 2018) approach. Note: The red line indicates short-term connectedness and the blue line indicates long-term connectedness.
Figure 4.
Total connectedness index dynamics using the (Baruník and Křehlík 2018) approach. Note: The red line indicates short-term connectedness and the blue line indicates long-term connectedness.

Table 1.
The spillover results of Diebold and Yilmaz (2012).
Table 1.
The spillover results of Diebold and Yilmaz (2012).
| Saudi Arabia | Indonesia | Russia | Turkey | Mexico | Brazil | China | South Africa | FROM | |
|---|---|---|---|---|---|---|---|---|---|
| Saudi Arabia | 22.91 | 14.84 | 0.60 | 6.76 | 16.81 | 16.80 | 12.22 | 9.05 | 9.64 |
| Indonesia | 11.41 | 18.62 | 1.33 | 9.20 | 15.52 | 14.77 | 16.58 | 12.57 | 10.17 |
| Russia | 1.90 | 5.25 | 76.70 | 1.37 | 3.51 | 2.40 | 6.95 | 1.92 | 2.91 |
| Turkey | 7.83 | 13.71 | 0.55 | 27.00 | 11.82 | 11.32 | 13.82 | 13.95 | 9.12 |
| Mexico | 13.70 | 16.44 | 0.93 | 8.23 | 18.71 | 17.97 | 13.88 | 10.13 | 10.16 |
| Brazil | 13.99 | 16.17 | 0.64 | 8.12 | 18.32 | 19.10 | 13.56 | 10.10 | 10.11 |
| China | 9.91 | 17.54 | 1.82 | 10.07 | 13.75 | 12.90 | 20.34 | 13.67 | 9.96 |
| South Africa | 8.98 | 15.87 | 0.52 | 11.66 | 12.21 | 12.02 | 16.31 | 22.43 | 9.70 |
| TO | 8.47 | 12.48 | 0.80 | 6.93 | 11.49 | 11.02 | 11.67 | 8.92 | 71.77 |
Table 2.
The spillover results of Baruník and Křehlík (2018), short-run, 1 month.
Table 2.
The spillover results of Baruník and Křehlík (2018), short-run, 1 month.
| Saudi Arabia | Indonesia | Russia | Turkey | Mexico | Brazil | China | South Africa | FROM_ABS | FROM_WTH | |
|---|---|---|---|---|---|---|---|---|---|---|
| Saudi Arabia | 0.35 | 0.21 | 0.01 | 0.10 | 0.26 | 0.26 | 0.16 | 0.16 | 0.14 | 10.40 |
| Indonesia | 0.20 | 0.26 | 0.02 | 0.13 | 0.25 | 0.24 | 0.21 | 0.20 | 0.16 | 11.33 |
| Russia | 0.03 | 0.06 | 0.79 | 0.02 | 0.05 | 0.04 | 0.08 | 0.01 | 0.04 | 2.71 |
| Turkey | 0.11 | 0.18 | 0.01 | 0.41 | 0.15 | 0.14 | 0.19 | 0.21 | 0.12 | 8.94 |
| Mexico | 0.23 | 0.23 | 0.02 | 0.12 | 0.30 | 0.28 | 0.18 | 0.17 | 0.15 | 11.08 |
| Brazil | 0.19 | 0.19 | 0.01 | 0.10 | 0.25 | 0.25 | 0.14 | 0.15 | 0.13 | 9.31 |
| China | 0.15 | 0.22 | 0.03 | 0.13 | 0.20 | 0.19 | 0.24 | 0.19 | 0.14 | 10.01 |
| South Africa | 0.13 | 0.21 | 0.01 | 0.17 | 0.17 | 0.17 | 0.20 | 0.34 | 0.13 | 9.57 |
| TO_ABS | 0.13 | 0.16 | 0.01 | 0.10 | 0.17 | 0.17 | 0.14 | 0.14 | 1.01 | |
| TO_WTH | 9.36 | 11.73 | 0.96 | 6.92 | 12.10 | 11.97 | 10.46 | 9.85 | 73.35 |
Note: TO_ABS stands for the absolute contributions made by a country to spillovers of emerging countries. TO_WTH denotes the relative contributions from a specific country to others. FROM_ABS indicates the absolute incoming spillovers to a country from others. FROM_WTH represents the relative incoming spillovers.
Table 3.
The spillover results of Baruník and Křehlík (2018), long-run, 1 month to infinity.
Table 3.
The spillover results of Baruník and Křehlík (2018), long-run, 1 month to infinity.
| Saudi Arabia | Indonesia | Russia | Turkey | Mexico | Brazil | China | South Africa | FROM_ABS | FROM_WTH | |
|---|---|---|---|---|---|---|---|---|---|---|
| Saudi Arabia | 22.56 | 14.64 | 0.59 | 6.67 | 16.55 | 16.54 | 12.06 | 8.89 | 9.49 | 9.63 |
| Indonesia | 11.22 | 18.37 | 1.30 | 9.06 | 15.27 | 14.53 | 16.38 | 12.37 | 10.02 | 10.16 |
| Russia | 1.87 | 5.19 | 75.92 | 1.35 | 3.46 | 2.36 | 6.87 | 1.91 | 2.87 | 2.91 |
| Turkey | 7.72 | 13.53 | 0.54 | 26.59 | 11.67 | 11.17 | 13.63 | 13.75 | 9.00 | 9.13 |
| Mexico | 13.47 | 16.21 | 0.91 | 8.11 | 18.41 | 17.69 | 13.70 | 9.96 | 10.01 | 10.15 |
| Brazil | 13.80 | 15.98 | 0.63 | 8.02 | 18.08 | 18.84 | 13.42 | 9.95 | 9.98 | 10.12 |
| China | 9.76 | 17.32 | 1.79 | 9.94 | 13.55 | 12.71 | 20.10 | 13.48 | 9.82 | 9.96 |
| South Africa | 8.85 | 15.66 | 0.51 | 11.49 | 12.04 | 11.85 | 16.12 | 22.09 | 9.56 | 9.70 |
| TO_ABS | 8.34 | 12.32 | 0.78 | 6.83 | 11.33 | 10.86 | 11.52 | 8.79 | 70.76 | |
| TO_WTH | 8.45 | 12.49 | 0.80 | 6.93 | 11.48 | 11.01 | 11.68 | 8.91 | 71.75 |
Table 4.
The results of the determinants of the total SCDS return spillovers.
| Coefficient | Q = 0.05 | Q = 0.10 | Q = 0.25 | Q = 0.50 | Q = 0.75 | Q = 0.90 | Q = 0.95 |
|---|---|---|---|---|---|---|---|
| CPU | 0.003604 | −0.001610 | 0.001410 | −0.000808 | −0.001792 | −0.007623 * | −0.01079 *** |
| GPR | 0.030595 *** | 0.024421 *** | 0.016587 * | 0.000503 | −0.002276 | 0.005701 | 0.013200 |
| MOVE | −0.028428 | 0.018146 | 0.001033 | −0.001640 | 0.005480 | 0.008190 | 0.050487 |
| OVX | −0.043297 | −0.034522 *** | −0.009571 | 0.000583 | 0.005829 | −0.004968 | −0.036412 * |
| EPU | −0.003664 | 0.007291 | 0.003563 | 0.006466 | 0.016253 * | 0.030883 | 0.014545 |
| VIX | 0.035527 *** | 0.017979 *** | 0.007585 | 0.003489 | −0.000363 | −0.005135 | 0.002548 |
| R2 (%) | 15.47 | 14.98 | 4.97 | 0.73 | 3.04 | 6.32 | 8.86 |
Note: ***, * indicate significance at 1% and 10%, respectively.
Disclaimer/Publisher’s Note: The statements, opinions and data contained in all publications are solely those of the individual author(s) and contributor(s) and not of MDPI and/or the editor(s). MDPI and/or the editor(s) disclaim responsibility for any injury to people or property resulting from any ideas, methods, instructions or products referred to in the content. |
© 2024 by the authors. Licensee MDPI, Basel, Switzerland. This article is an open access article distributed under the terms and conditions of the Creative Commons Attribution (CC BY) license (https://creativecommons.org/licenses/by/4.0/).
Share and Cite
MDPI and ACS Style
Aljarba, S.; Naifar, N.; Almeshal, K. Volatility Spillovers among Sovereign Credit Default Swaps of Emerging Economies and Their Determinants. Risks 2024, 12, 71. https://doi.org/10.3390/risks12040071
AMA Style
Aljarba S, Naifar N, Almeshal K. Volatility Spillovers among Sovereign Credit Default Swaps of Emerging Economies and Their Determinants. Risks. 2024; 12(4):71. https://doi.org/10.3390/risks12040071
Chicago/Turabian StyleAljarba, Shumok, Nader Naifar, and Khalid Almeshal. 2024. "Volatility Spillovers among Sovereign Credit Default Swaps of Emerging Economies and Their Determinants" Risks 12, no. 4: 71. https://doi.org/10.3390/risks12040071
Note that from the first issue of 2016, this journal uses article numbers instead of page numbers. See further details here.