
Evaluating Extensions to Coherent Mortality Forecasting Models


1
Actuarial Science Department, Faculty of Computer & Mathematical Sciences, University of Technology MARA, Shah Alam 40450, Malaysia
2
Department of Applied Finance & Actuarial Studies, Faculty of Business and Economics, Macquarie University, Sydney, NSW 2109, Australia
3
Department of Marketing & Management, Macquarie University, Sydney, NSW 2109, Australia
*
Author to whom correspondence should be addressed.
Risks 2017, 5(1), 16; https://doi.org/10.3390/risks5010016
Submission received: 25 October 2016
/
Accepted: 10 February 2017
/
Published: 10 March 2017
(This article belongs to the Special Issue Ageing Population Risks)
Abstract
:Coherent models were developed recently to forecast the mortality of two or more sub-populations simultaneously and to ensure long-term non-divergent mortality forecasts of sub-populations. This paper evaluates the forecast accuracy of two recently-published coherent mortality models, the Poisson common factor and the product-ratio functional models. These models are compared to each other and the corresponding independent models, as well as the original Lee–Carter model. All models are applied to age-gender-specific mortality data for Australia and Malaysia and age-gender-ethnicity-specific data for Malaysia. The out-of-sample forecast error of log death rates, male-to-female death rate ratios and life expectancy at birth from each model are compared and examined across groups. The results show that, in terms of overall accuracy, the forecasts of both coherent models are consistently more accurate than those of the independent models for Australia and for Malaysia, but the relative performance differs by forecast horizon. Although the product-ratio functional model outperforms the Poisson common factor model for Australia, the Poisson common factor is more accurate for Malaysia. For the ethnic groups application, ethnic-coherence gives better results than gender-coherence. The results provide evidence that coherent models are preferable to independent models for forecasting sub-populations’ mortality.
1. Introduction
The widely-used Lee–Carter [1] model is an extrapolative mortality forecasting model that uses a single time-varying index of the mortality level. Despite its success forecasting U.S. mortality, the Lee–Carter model’s assumptions have not been found to be universally appropriate [2], leading to a range of modifications being proposed in the literature [2,3,4,5,6,7]. It is noteworthy that the mortality forecasts of the modified Lee–Carter models have proven to be more accurate than those of the original model [8,9,10]. The Lee–Carter model and its earlier extensions are independent models [11] and, as such, forecast sub-populations (such as males and females) separately, failing to account for any relationship between groups [12]. Such independent models may produce divergent forecasts between two or more sub-populations, which may poorly represent the smaller populations within the same larger region or country [13].
Coherent models were developed to forecast the mortality of two or more sub-populations simultaneously and to ensure long-term non-divergent forecasts of sub-populations [11,12,13]. This type of joint forecasting is important, for example, to estimate deaths of both genders concurrently or to calculate premiums for life insurance and annuities that depend on the death or survival of more than one life [14]. The augmented common factor model [11] extends the Lee–Carter model in two ways. It incorporates a mortality reference (the aggregated death rates of sub-populations) in the base model to maintain historic relationships between groups. It also restricts the time-component of sub-populations to forecasts, guaranteeing non-divergent forecasts in the long run. This technique improved the divergent forecasts of independent models over a variety of metrics and spawned the development of further new coherent models, including the Poisson common factor model [12] and the product ratio functional model [13]. Both of these models are examined in detail in Section 2 below.
Which of the independent and coherent models provide better forecasts and why? While the literature includes comparisons between different independent models [3,8,9,10], as well as between independent and coherent functional time series models [13], no comparisons between types of coherent models have been made. Further, the application of coherent forecasting models has been limited to developed countries. The purpose of this research is to evaluate the forecast accuracy of two recent coherent models, the Poisson common factor model and the product ratio functional model. The two coherent models are compared to each other, as well as to their respective independent versions: the Poisson Lee–Carter model and the weighted functional model. In addition, as all four models are extensions of the Lee–Carter model, we include Lee–Carter forecasts as a performance benchmark. We also extend the application of coherent mortality forecasting to a less developed nation, Malaysia, as well as treating Australia, with gender-coherence being applied to Malaysian and Australian age-gender-specific mortality data. Furthermore, we apply two types of coherency: gender-coherence and ethnic-coherence to Malaysian age-gender-ethnic-specific mortality data. We forecast death rates, male-to-female death rate ratios and life expectancy at birth and compare the out-of-sample forecasts with the observations from official statistics.
Section 2 of this paper explains the coherent models and describes the error measures that we use to estimate the out-of-sample forecast errors. Section 3 discusses the observed mortality rates and their trends in Australia and Malaysia. In Section 4 and Section 5, coherent and independent models are applied to gender-specific data for Australia and Malaysia, as well as ethnic-specific mortality data; the forecast accuracy of death rates, male-to-female sex ratios and life expectancy at birth are reported. Section 6 discusses the research outcomes in detail. Finally, Section 7 concludes.
2. Coherent Mortality Forecasting
2.1. Poisson Common Factor Model
The Poisson common factor model, based on the Poisson parametric distribution function, was extended by Li [12] to estimate the number of deaths directly. The method extends the independent model Poisson–Lee–Carter model of Brouhns et al. [5]. The age-specific mortality rates, , for lives aged x in year t and belonging to the i-th sub-population are given by:
where is the average of the log age-specific death rates for the i-th group over the fitting period, is the product of an age-component and time-component for the common factor, is the product of an age-component and a time-component for the i-th subgroup and the j-th additional subgroup-specific factor and are the subgroup-specific residuals for age x and year t.
Equation (1) is identical to its independent version, the Poisson–Lee–Carter model [5], if the value of is zero and just one gender-specific factor is considered. Clearly, without common factor variables, the model does not account for inter-relationships between sub-populations.
The parameters of the Poisson common factor model are estimated, as is the case with its independent version, using maximum log-likelihood. Deaths are assumed to follow the Poisson distribution function, with:
and:
where are the deaths of those aged x in year t belonging to the i-th sub-population and are the corresponding exposures. The age-specific mortality rates are considered unknown values and are estimated using (3) subject to the constraints and and constraints of and , where the number of factors I and J can be optimally determined using either the Bayesian Information Criterion (BIC) or the Akaike Information Criterion (AIC).
Following [5], parameters , , , and are estimated via an iterative updating scheme [12]. The time-component of the common factor is a non-stationary process; thus, a random walk with drift model is used to forecast the data. The subgroup-specific (like gender) time-components, on the other hand, are stationary; hence, a -th order autoregressive model (p) is used. Finally, age-specific death rate forecasts can be retrieved by placing the forecast time-component factors and estimated age factors into Equation (3).
2.2. Product-Ratio Functional Model
Hyndman et al. [13] extended the independent Hyndman and Ullah [7] functional time series model to model two quantities, the product function and the ratio function , where:
and:
and where refers to the i-th sub-population and the are the smoothed age and time-specific mortality rates for the i-th population. As a smoothing procedure, Hyndman et al. [13] use weighted penalized regression splines. A monotonic increasing constraint over time is imposed on ages x and above. Intuitively, the product function is estimated as the geometric mean of the smoothed rates of sub-populations, which represents the general trend or mortality reference of sub-populations, while is the ratio of one sub-population’s rates to the geometric mean, representing the mortality difference of a particular sub-population from the general trend.
The product and ratio functions have the advantage of being easy to use and are uncorrelated with each other on a log scale. Both are then used in the functional independent model [7] with:
and:
where and average the logs of the product and ratio functions respectively and l and ξ index the principal components. The time components and the and the age components and are estimated using weighted principal component analysis following Shang et al. [10], which applies more weight to recent data. The weighting technique is used to cater for change over time in and . In contrast to Li and Lee [11], who used only the first principal component, the work of [13] used up to six components. The time-component for the product function displays a linear decreasing trend and therefore is more appropriately forecast using a non-stationary series model, (p,d,q). A non-divergent mortality forecast is attained when is restricted to being forecast by a stationary time series model, either an autoregressive moving average (p) or an auto-regressive fractional integrated moving average (p,d,q).
The estimated average death rates and age factors, as well as the forecast of time components are put into Equations (6) and (7) to get the forecast values of the product and ratio functions. Subsequently, the age-specific mortality forecasts for each sub-population are obtained by simply multiplying the forecast rates of the product and ratio functions,
where and are the mortality average and error terms, respectively, for a particular group. Equation (8) is similar to that of [12] given in (1) when there is no additional component for . The product-ratio functional model and its independent predecessor, the weighted functional model, were implemented using the demography package for R [15].
2.3. Measurement of Forecast Accuracy
We divide T-year observations of a particular i-th sub-population into two parts. First, the in-sample data, which consist of the first n-year observations , are used in each model to estimate the parameters. Second, the out-of-sample data, comprising the remaining years of data , are compared to the forecast rates .
With the out-of-sample data, the forecast accuracy of each model is estimated using the following error measurements:
and:
for the p age groups. We use mean absolute forecast error () and mean forecast error () to evaluate the forecast accuracy of the log death rates and life expectancy for the i-th sub-population. For male-to-female death rate ratio forecasts, errors are estimated using the mean absolute percentage forecast error ().
3. Mortality Data
In this study, we use central age-gender-specific death rates for Australia and Malaysia and age-gender-ethnic-specific death rates for Malaysia together with their respective mid-year exposures. The data for Australia are taken from [16] for the period 1921 to 2009 for ages zero to 110. Data for Malaysia are from the Malaysian Department of Statistics from 1965 to 2011 for ages zero to 80.1 According to Mikkelsen et al. [17], Malaysia currently has ‘good’ quality mortality data, with substantial improvements having occurred since 2000.
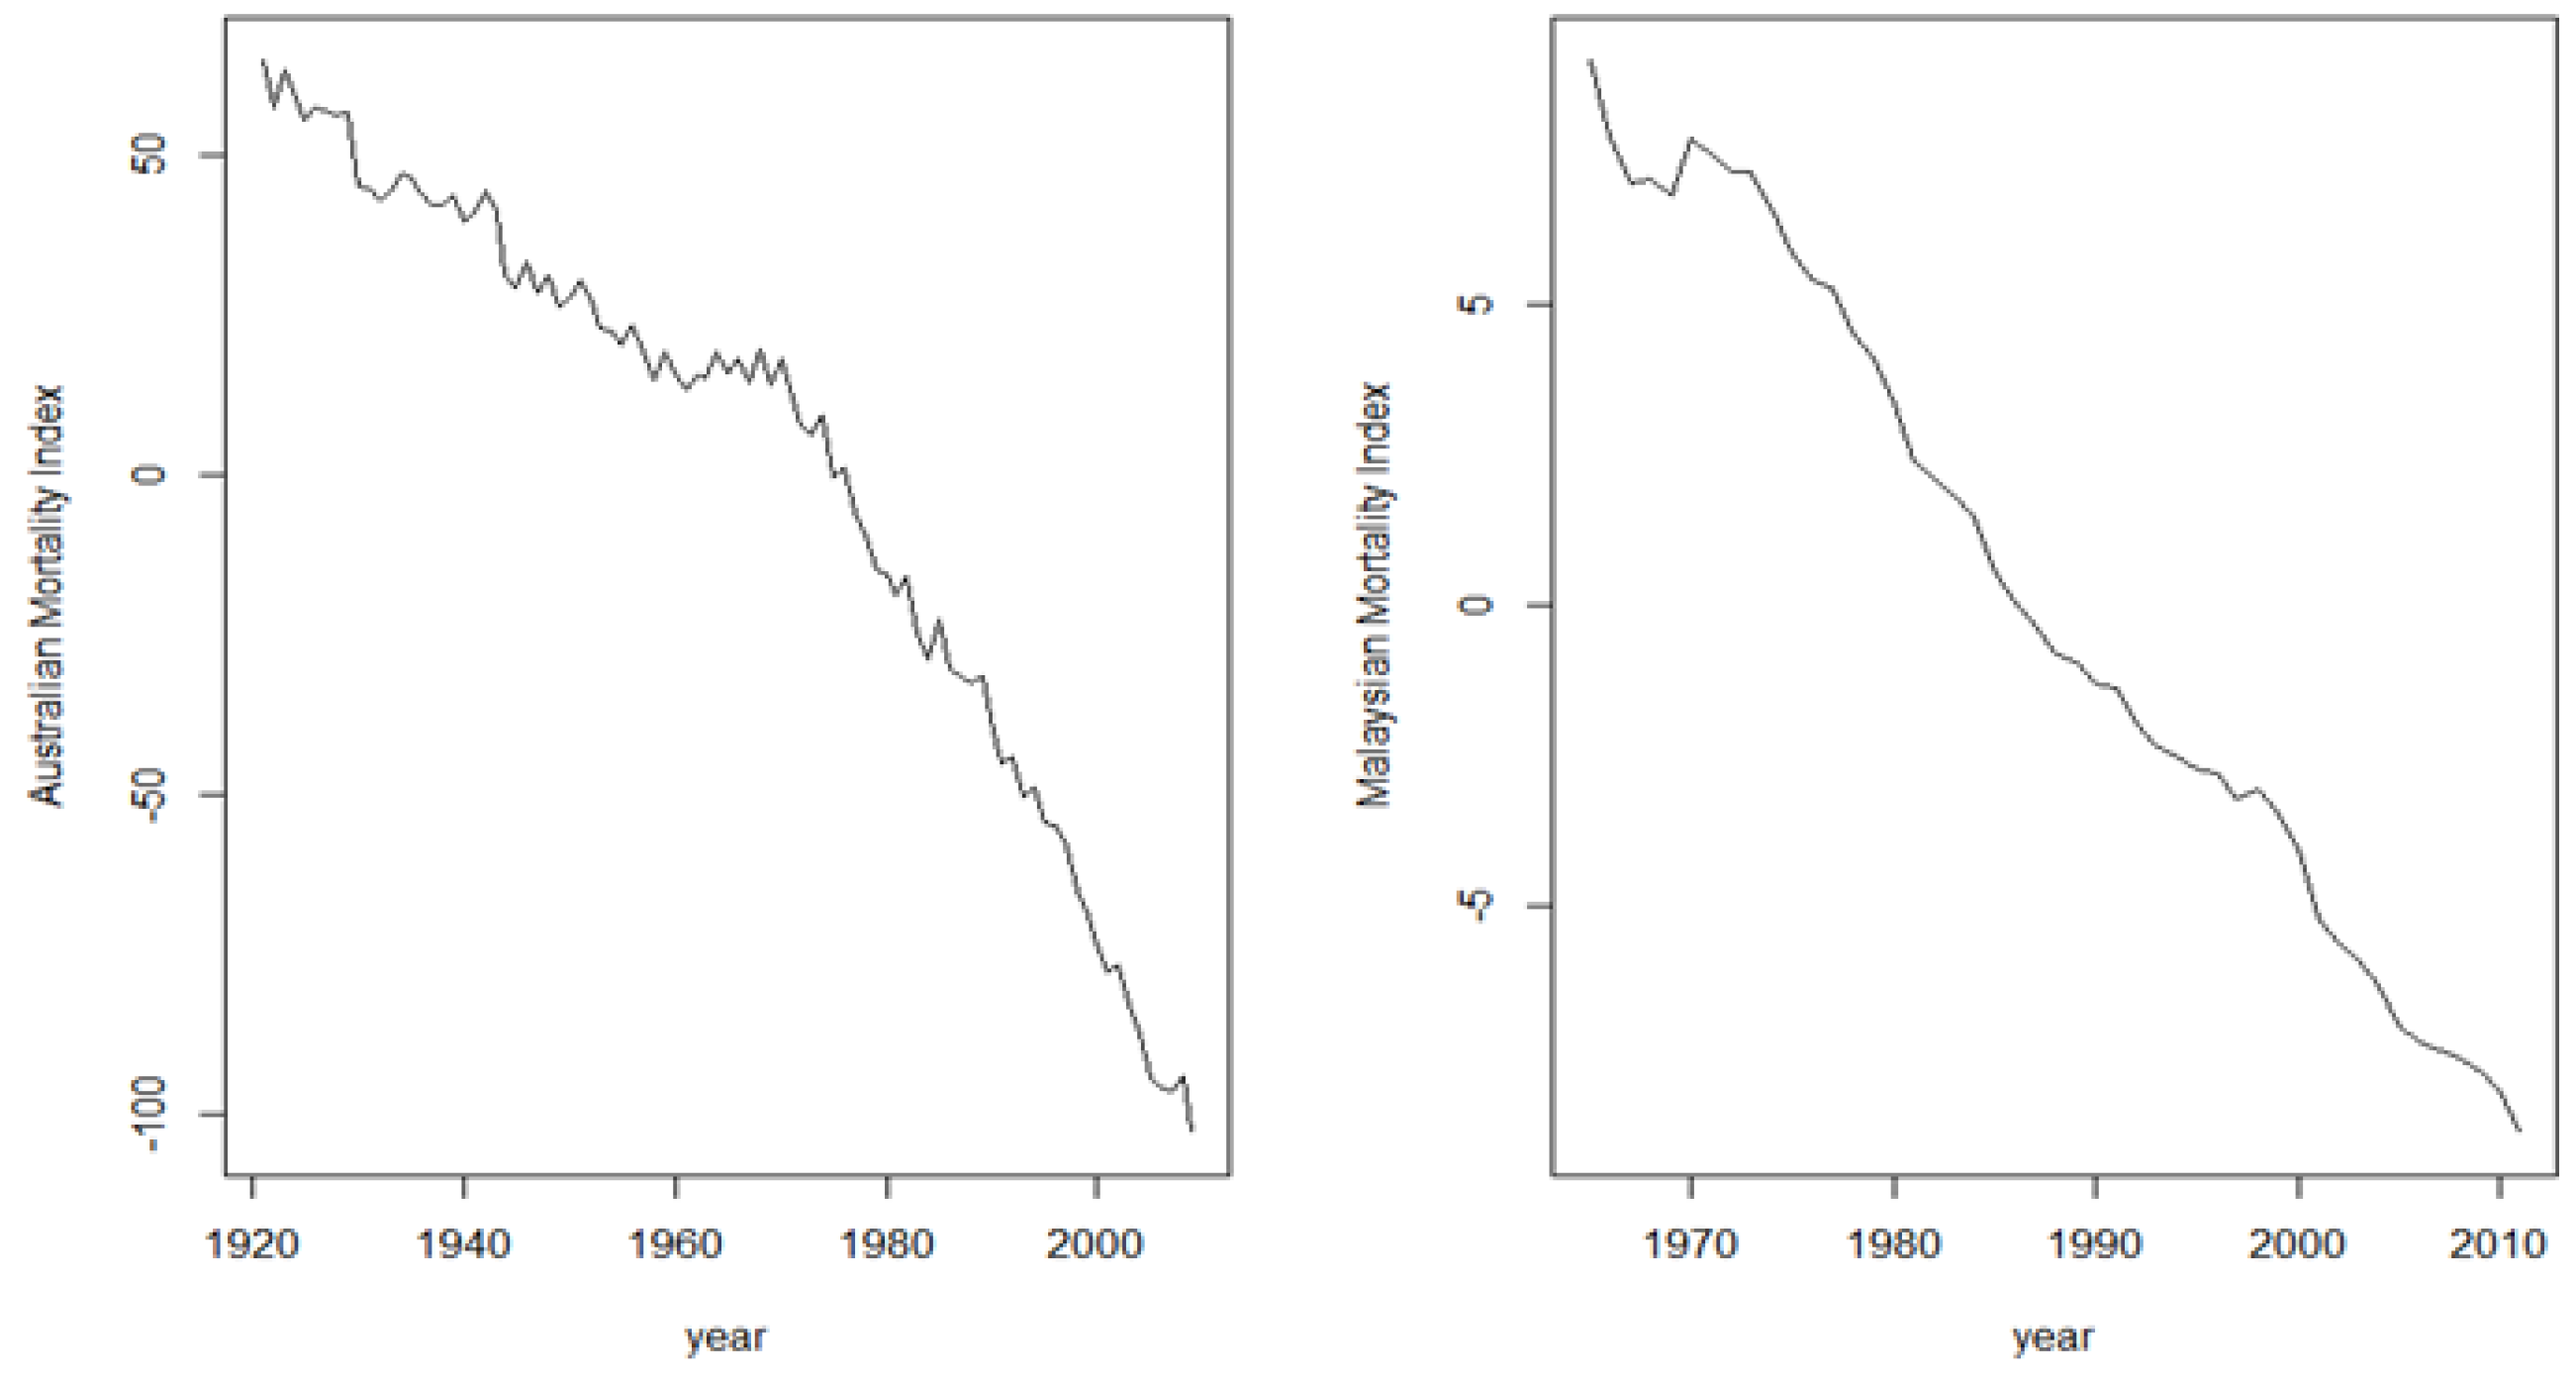
The mortality rates at the oldest ages fluctuate widely. Following Li [12], we exclude some of the oldest rates and include only data up to age 90 for Australia.2 The original Lee and Carter [1] model uses the data from the earliest available year regardless of whether or not the mortality index has been subject to change over time. Major shifts in the mortality index can be seen in the late 1960s for Australia and in the early 1970s and late 1990s for Malaysia (see Figure 1). Hence, to improve forecast accuracy, an appropriate starting year for the fitting period must be selected for the Lee–Carter extensions to ensure that the mortality index is reasonably linearly decreasing.
Booth et al. [2] suggest that 1968 and 1970 are the best starting years for the fitting period for Australian males and females, whereas Hyndman et al. [13] used 1950 to fit the age-region-specific death rates to the product-ratio functional model. In this study, for comparative purposes, all models except for the original Lee–Carter model will use the same starting years, namely 1968 for Australia and 1975 for Malaysia.
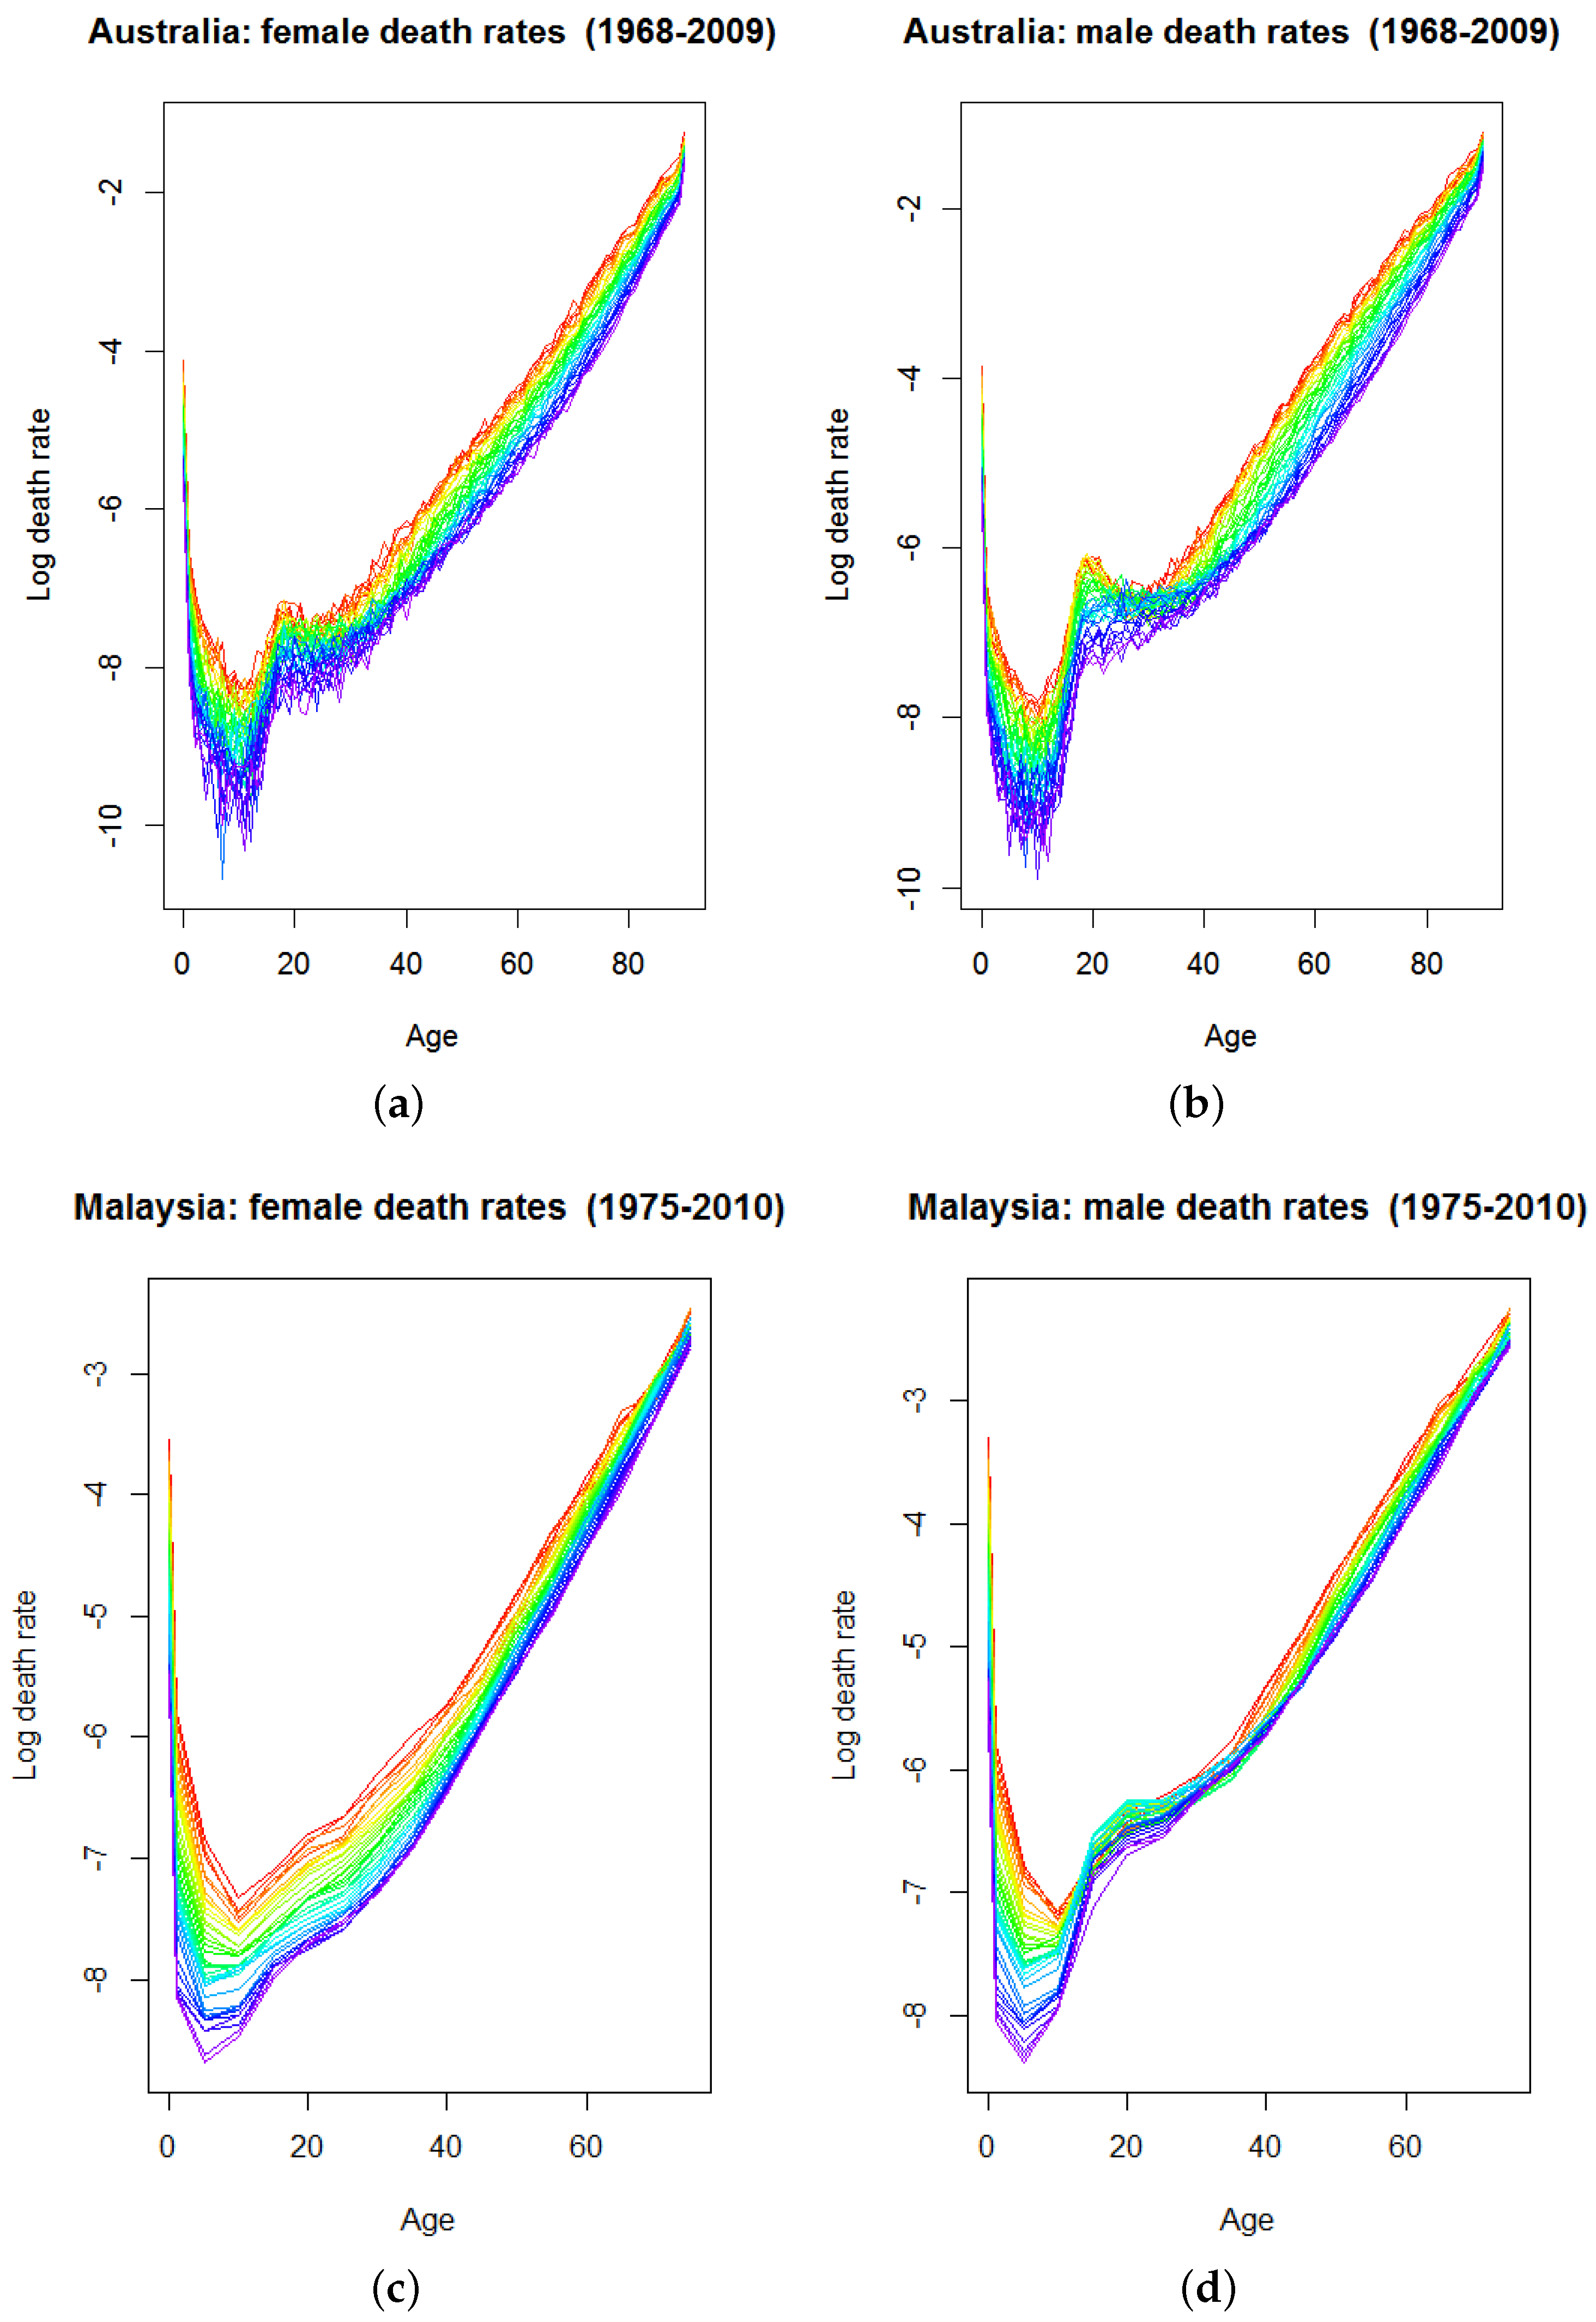
The log age-specific death rate plots for males and females are shown in Figure 2. The top panel is Australian death rates, which clearly exhibit a similar pattern between males and females. The decreasing rates over the years from red to purple (1968 to 2009) occur in all ages. However, mortality has been decreasing at a slower rate in recent years: note the small decrease from blue to purple curves (1990 to 2009). According to [18], Australian mortality rates will continue decreasing, with the fastest decreases occurring at ages below 20 and between 40 and 80.
The male accident hump has decreased more rapidly than that for females in recent years. According to Pollard [19], the disappearance of the accident hump among young males aged 14 to 24 and in the early adult ages 25 to 40 since the late 1980s is due to the declining rate of motor accident fatalities, a result of the introduction of random breath testing for alcohol and seat-belt regulations.
The bottom panel displays the inconsistent patterns between Malaysian female and male mortality, especially for the accident hump ages. Female mortality has declined consistently over the years (1975 to 2011) in all age groups, with a thin accident hump. The mortality of males over the accident hump ages (15 to 39) fluctuated in the early years (1975 to 1997). However, a decreasing trend can be seen in the later years, starting from 1998. The inconsistent pattern of change over time between the genders leads to the highest ratio of male-to-female death rates in this age group being from 1975 to 1997 [20].
4. Forecast Evaluation of Coherent Models Using Australian and Malaysian Male and Female Mortality
Our forecasts are based on five different mortality forecasting models, including two coherent models, the Poisson common factor and product-ratio functional models, and their independent versions, the Poisson Lee–Carter and weighted functional models. These four models are extensions of the Lee–Carter model; hence, the original model is included as a performance benchmark.
This section reports the forecast error of log age-gender-specific death rates, male-to-female death rate ratios and life expectancy at birth for the five different mortality forecasting methods (coherent and independent) for Australia and Malaysia.
4.1. Log Death Rate Forecasts
Table 1 presents the mean absolute forecast errors of log death rates for different methods averaged over age and year for male and female mortality rates in Australia and Malaysia.3 In comparison to the independent models, both coherent models are more accurate for three out of four sub-populations—Australian males and females and Malaysian females—while the independent models perform better than the coherent models for Malaysian males. In terms of the overall accuracy (averaged over male and female errors), the coherent models perform better than the independent models for Australia, but underperform for Malaysia. The product-ratio functional model (coherent) performs the best for Australia, while the Poisson–Lee–Carter model (independent) performs the best for Malaysia.
Of the two coherent methods, the product-ratio functional model is more accurate than its counterpart, the Poisson common factor model, and proved to be the best model for three out of four sub-populations: Australian males and females and Malaysian females. When taking the average over genders, the product-ratio functional model performs better than the Poisson common factor model for Australia, but less well for Malaysia. Among the five models, all Lee–Carter extensions perform significantly better than the original model for both genders in Australia and for females in Malaysia. It is noteworthy that for Malaysian male mortality, the Lee–Carter model is more accurate than both coherent models, but underperforms the other independent models.
Table 2 summarises the corresponding mean forecast errors. The Lee–Carter model underestimates Australian male and female mortality rates substantially, in contrast to the other four models. For Malaysia, all models consistently underestimate both genders’ mortality with the Lee–Carter model being the least accurate model for Malaysian females. Consistent with Table 1, in terms of overall accuracy, the product-ratio functional model is the most accurate for Australia, while the Poisson Lee–Carter is the most accurate for Malaysia.
Figure 3 shows the mean forecast errors by age. Clearly, the original Lee–Carter model produces significant errors for Australia and underestimates the mortality for people under 40 and overestimates the mortality of those who are aged above 40. However, for Malaysia, the Lee–Carter forecasts are fairly similar to the other four methods, especially for males. The errors for the coherent (dashed lines) and the independent (solid lines) models are generally similar in pattern for Australia. As can be seen from Figure 3, there is an extreme point of error for the Poisson-based methods around age 12 for both genders in Australia. However, no outlier is detected for the functional-based methods, which indicates the ability of the functional models to minimize the effect of extreme forecast values.
4.2. Male to Female Death Rate Ratio Forecasts
The forecast error of male-to-female death rate ratios is presented in Table 3. The overall error shows that coherent models are more accurate than independent models for Australia, but less accurate for Malaysia. Results show substantial errors at younger ages (less than 40) for all methods in both countries. This indicates the difficulty in estimating the childhood mortality and the accident hump. Similar conclusions regarding log death rates appear in [10], which examined such forecasts over fourteen countries.
For Australia, the coherent models have lower forecast errors than the independent models for the 0, 1 to 14, 15 to 39 and 70 to 90 age groups. Although the coherent models have higher errors than the independent models for Australian ages 40 to 69, the difference is insignificant, and the coherent models perform better than the independent models in overall terms. For Malaysia, the coherent models have lower forecast errors than the independent models for the 0, 1 to 14, 55 to 69 and 70 to 80 age groups and significantly higher errors for the 15 to 39 and 40 to 54 age groups; the errors of the young adult group aged 15 to 39 increase from 14.67 to 22.32 (by 52%) for the Poisson common factor model and from 16.19 to 24.98 (by 54%) for the product-ratio functional model. The high percentage error from this Malaysian young adult group causes the coherent models to perform less accurately than the independent models.
The comparisons between the two coherent models show that the product-ratio functional model is consistently more accurate than the Poisson common factor for all age groups in Australia and for the age group 40 and above in Malaysia. Similar to the results reported in Table 1, the overall errors show that the product-ratio functional model (a coherent model) is the best model for Australia, while Poisson–Lee–Carter (an independent model) is the best model for Malaysia.
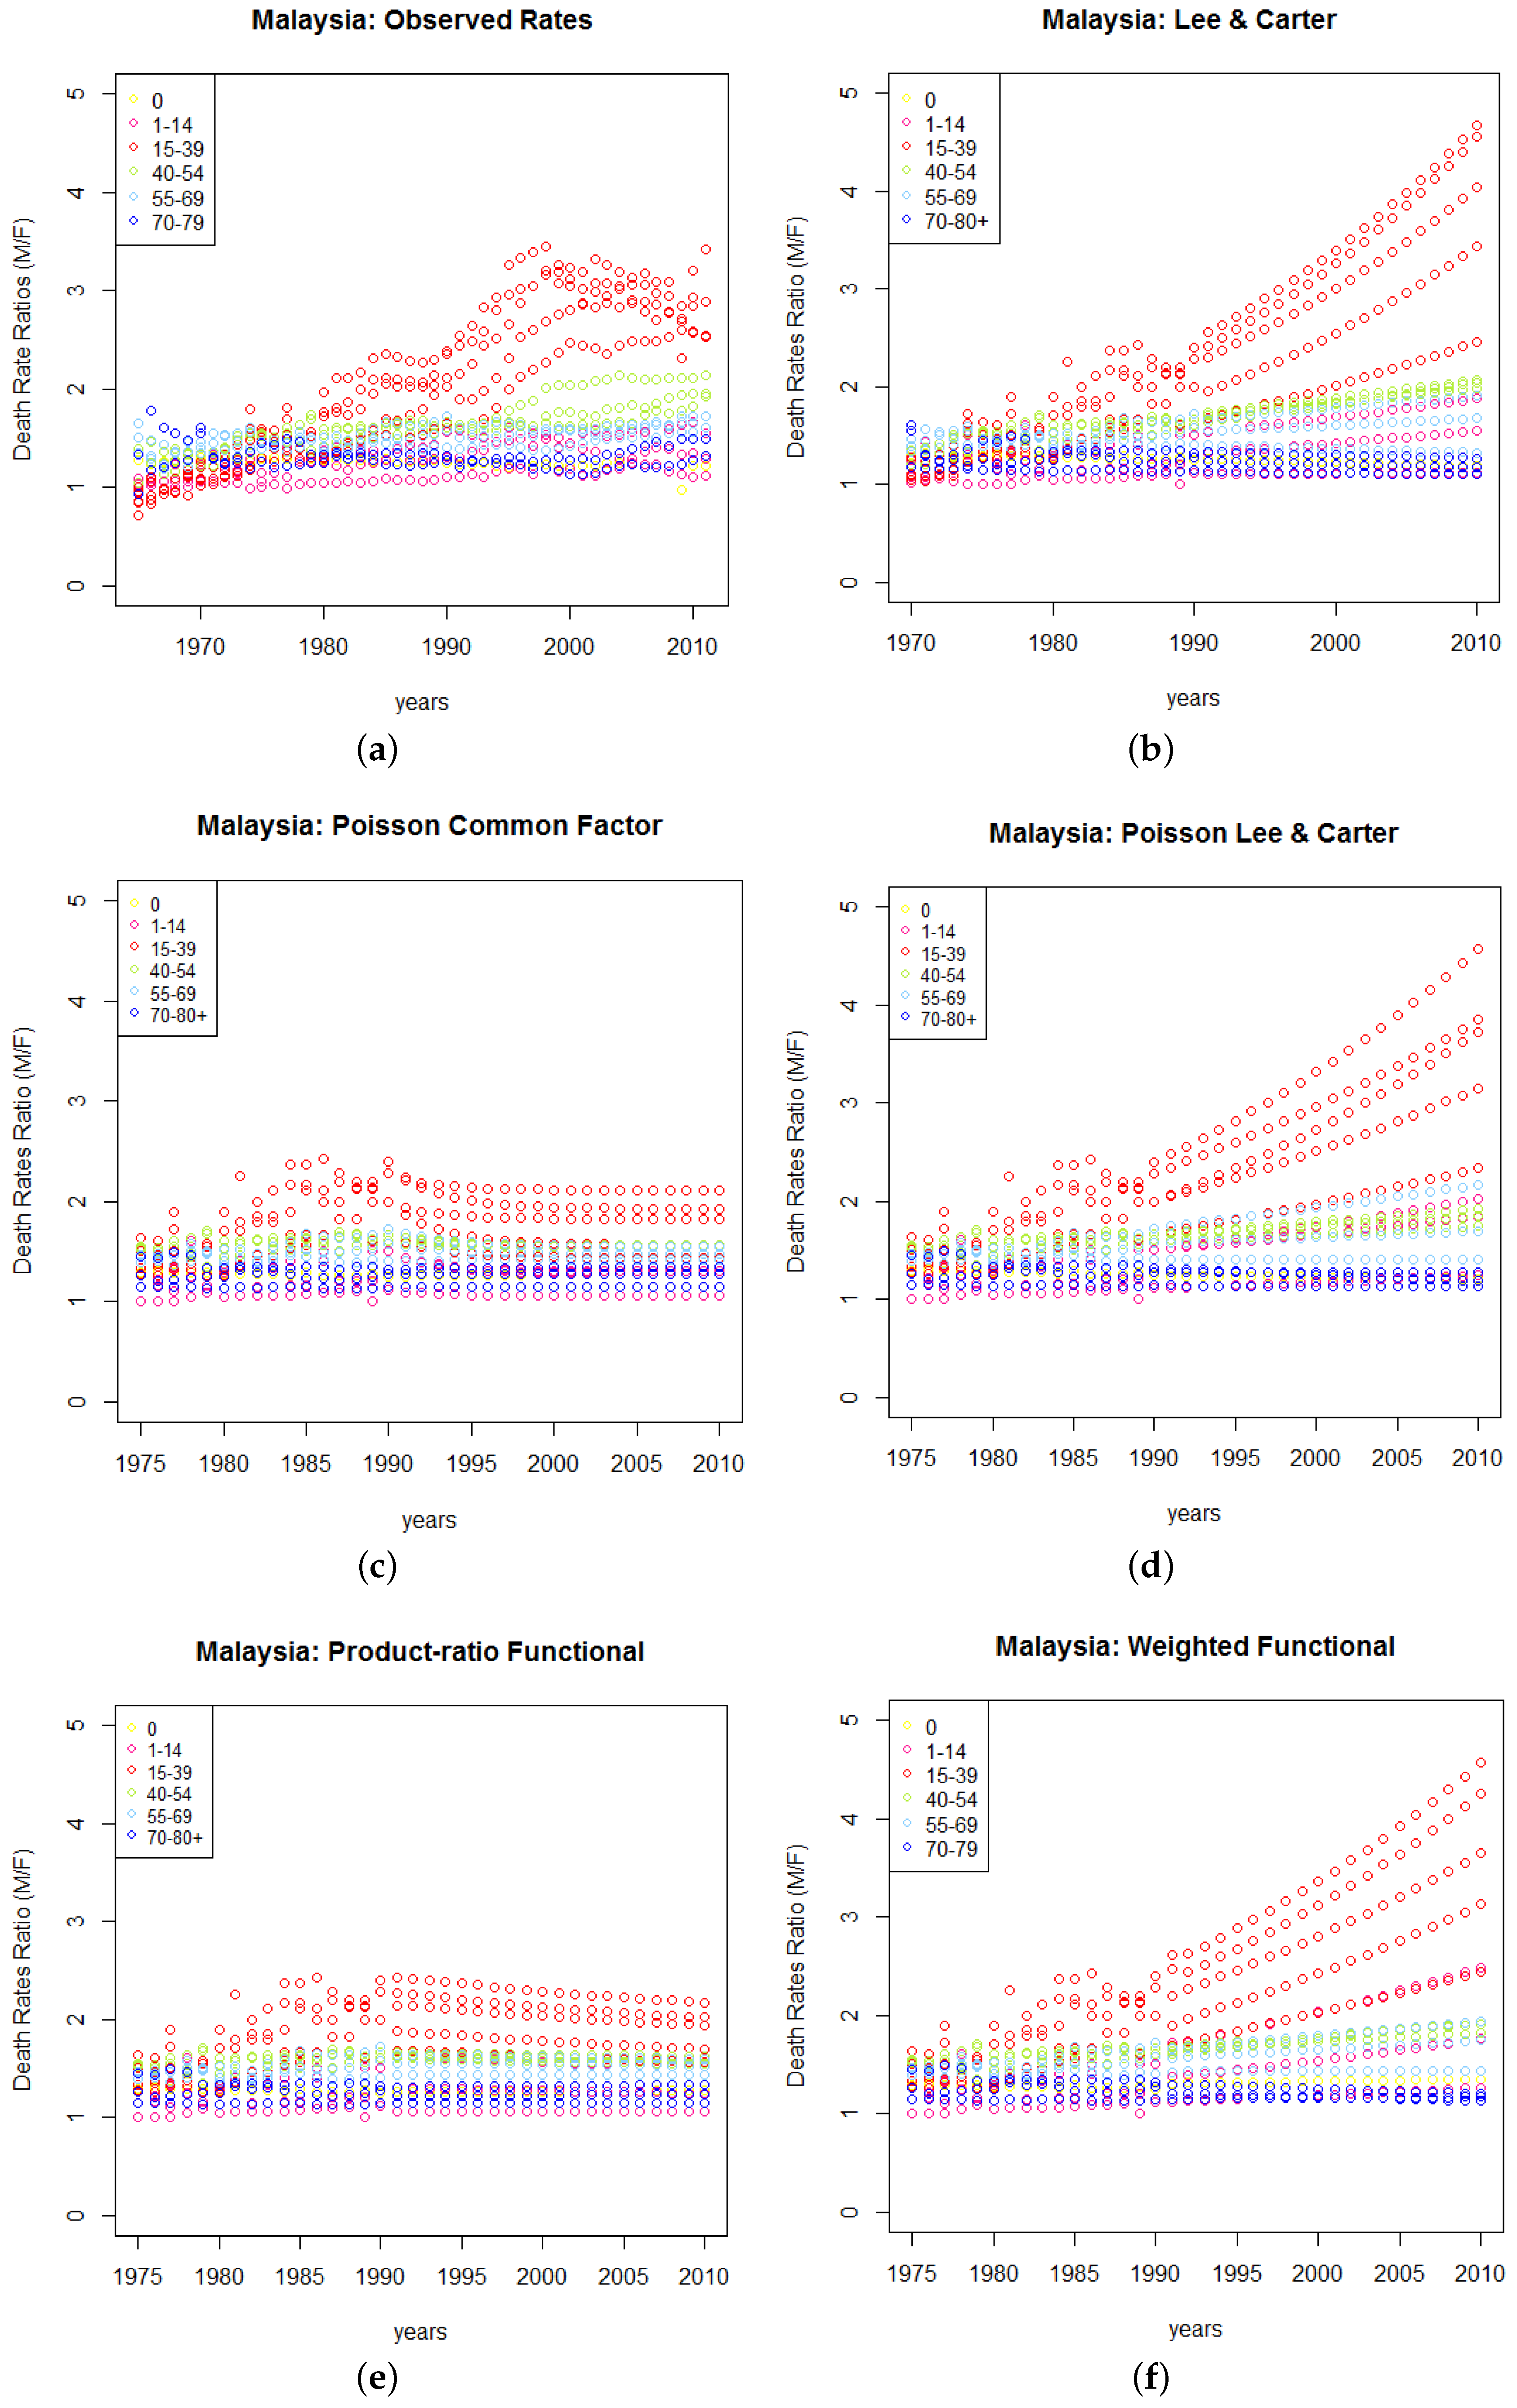
Figure 4 and Figure 5 present the forecasts of the male-to-female death rate ratio for Australia and Malaysia. As can be seen from both Figure 4 and Figure 5, the coherent models (left panel) produce constant forecast ratios in most of the age groups in contrast to the diverging rates under the independent models (right panel), especially for the 15 to 39 age groups.
4.3. Life Expectancy at Birth Forecasts
Next, we evaluate each model’s accuracy using life expectancy at birth as the outcome measure. Table 4 shows the Mean absolute Forecast Error () of life expectancy at birth by different methods. The overall errors in Table 4 appear to be consistent with the log death rates and male-to-female death rate ratio forecast errors in two ways. Firstly, the coherent models are more accurate than the independent models for Australia, but are less accurate for Malaysia. Secondly, the errors from the Lee–Carter extensions are reasonably similar. However, the error from the original Lee–Carter model is significantly higher for Australia.
Table 5 shows the Mean Forecast Error () of life expectancy at birth by different methods. From Table 5, it is clear that all models underestimate life expectancy at birth for both Australian males and females, with the forecast errors among males being more than double those of females. In other words, the methods used in this research tend to underestimate the rapid increase in life expectancy for Australian males that has occurred in recent years. In contrast, all of the models overestimate the life expectancy for Malaysian males, with the original Lee–Carter model providing the least error. The results for Malaysian females are less consistent.
As can be seen from Table 4 and Table 5, the Lee–Carter model is the most accurate model for Malaysian males. This suggests that in some cases, such as in a developing country like Malaysia, where the available observed data are not extensive (available only since 1965), the original Lee–Carter model may still be relatively reliable. In addition, consistent with [9], the results provide further empirical evidence that the most accurate model for mortality rates is not necessarily the best model for life expectancy.
Figure 6 shows that the Lee–Carter model significantly underestimates the life expectancy at birth for both genders in Australia. Conversely, this model outperforms the other models for Malaysian males. The significant underestimation of the Lee–Carter model for Australian life expectancy may be due to the fact that this model includes structural changes in the time-component that have happened since 1921. For Malaysia, there was no major structural change in the data after 1965; hence, the Lee–Carter model performs at least, as well as the other methods. Furthermore, the coherent forecasts (dashed lines) display proportional rates between males and females, whereas the independent forecasts (solid lines) tend to diverge and generally produce a bigger gap for the genders.
4.4. The Future Potential of Coherent Mortality Forecasting for Malaysia
Figure 2 shows that, from 1998 onwards (turquoise to purple), Malaysian male mortality for the accident hump group decreases consistently, in contrast to its earlier fluctuating pattern. This observation raises the question of whether this trend will continue in the future and thus improve the accuracy of the forecasts of the coherent models. For this section, we extend the fitting period for the Malaysia data to include the recent decreasing trend among males. About two thirds of the observations (i.e., from 1975 to 2001) are used for the fitting period, and rates are forecast for the remaining ten years (from 2002 to 2011). Table 6, Table 7 and Table 8 present the 10-year forecast errors of mortality rates, male-to-female death rates and life expectancy at birth.
Interestingly, the results show that for the 10-year forecasts, the coherent models are significantly more accurate than the independent models for both Malaysian genders. The error in the male-to-female death ratios at ages 15 to 39 is reduced substantially from 22.564 to 5.491 or by 76% for the Poisson common factor model and from 23.367 to 6.743 or by 71% for the product-ratio functional model, compared to the corresponding independent models (Table 7). These results confirm that the improvement in male mortality rates for people aged 15 to 39 plays an important role for the accuracy of coherent forecasts and consequently outperforms independent models. Nevertheless, the life expectancy forecasts show that the coherent models are still underperforming the independent models for Malaysia.
5. Forecast Evaluation of Coherent Models Using Malaysian Ethnic Group Mortality
Malaysia is a multicultural country, which consists of Malay and indigenous (henceforth Malay) groups (61.8%), Chinese (22.5%), Indian (6.7%), other ethnic groups (0.9%) and non-Malaysian citizens (8.1%) [21]. In this study, we exclude other ethnic groups and non-Malaysian citizens due to data limitations. In view of the diversity of the Malaysian population, we investigate the suitability of the coherent models to forecast the mortality rates of these ethnic groups. Gender-coherence models are applied separately to Malay males and females, Chinese males and females and Indian males and females. Furthermore, ethnic-coherence models are applied to Malay, Chinese and Indian males and Malay, Chinese and Indian females. We report the results below.
5.1. Gender-Coherence
Table 9 presents the log death rates forecast error of different methods. We exclude the Lee–Carter model from this application as we wish to focus only on the modified versions of the Lee–Carter model. The patterns of errors of the Malay population forecasts are consistent with those of the national forecasts: both coherent models are more accurate than the independent models for females, but less accurate for males, resulting in the coherent forecasts having less accuracy than the independent forecasts overall. This may be due to the size of the Malay group, as it represents the majority of the Malaysian population. For Indians, the coherent models are less accurate than the independent models for both males and females. For the Chinese females, the forecasts generate results that are different from national forecasts, but similar in the patterns of error to those of a low mortality country, Australia, for which both the coherent models are more accurate than the independent models for the overall forecasts. The comparison between the two coherent models for the Chinese indicates that the Poisson common factor model outperforms the product-ratio functional model in the overall forecasts.
The results4 for male-to-female death rate ratios tend to be consistent with the log death rates forecasts in terms of overall accuracy: the coherent models are less accurate than the independent models for Malays and Indians, but are more accurate than the independent models for Chinese. However, the life expectancy at birth forecasts show that the coherent models are less accurate than the independent models for all ethnic groups.
5.2. Ethnic-Coherence
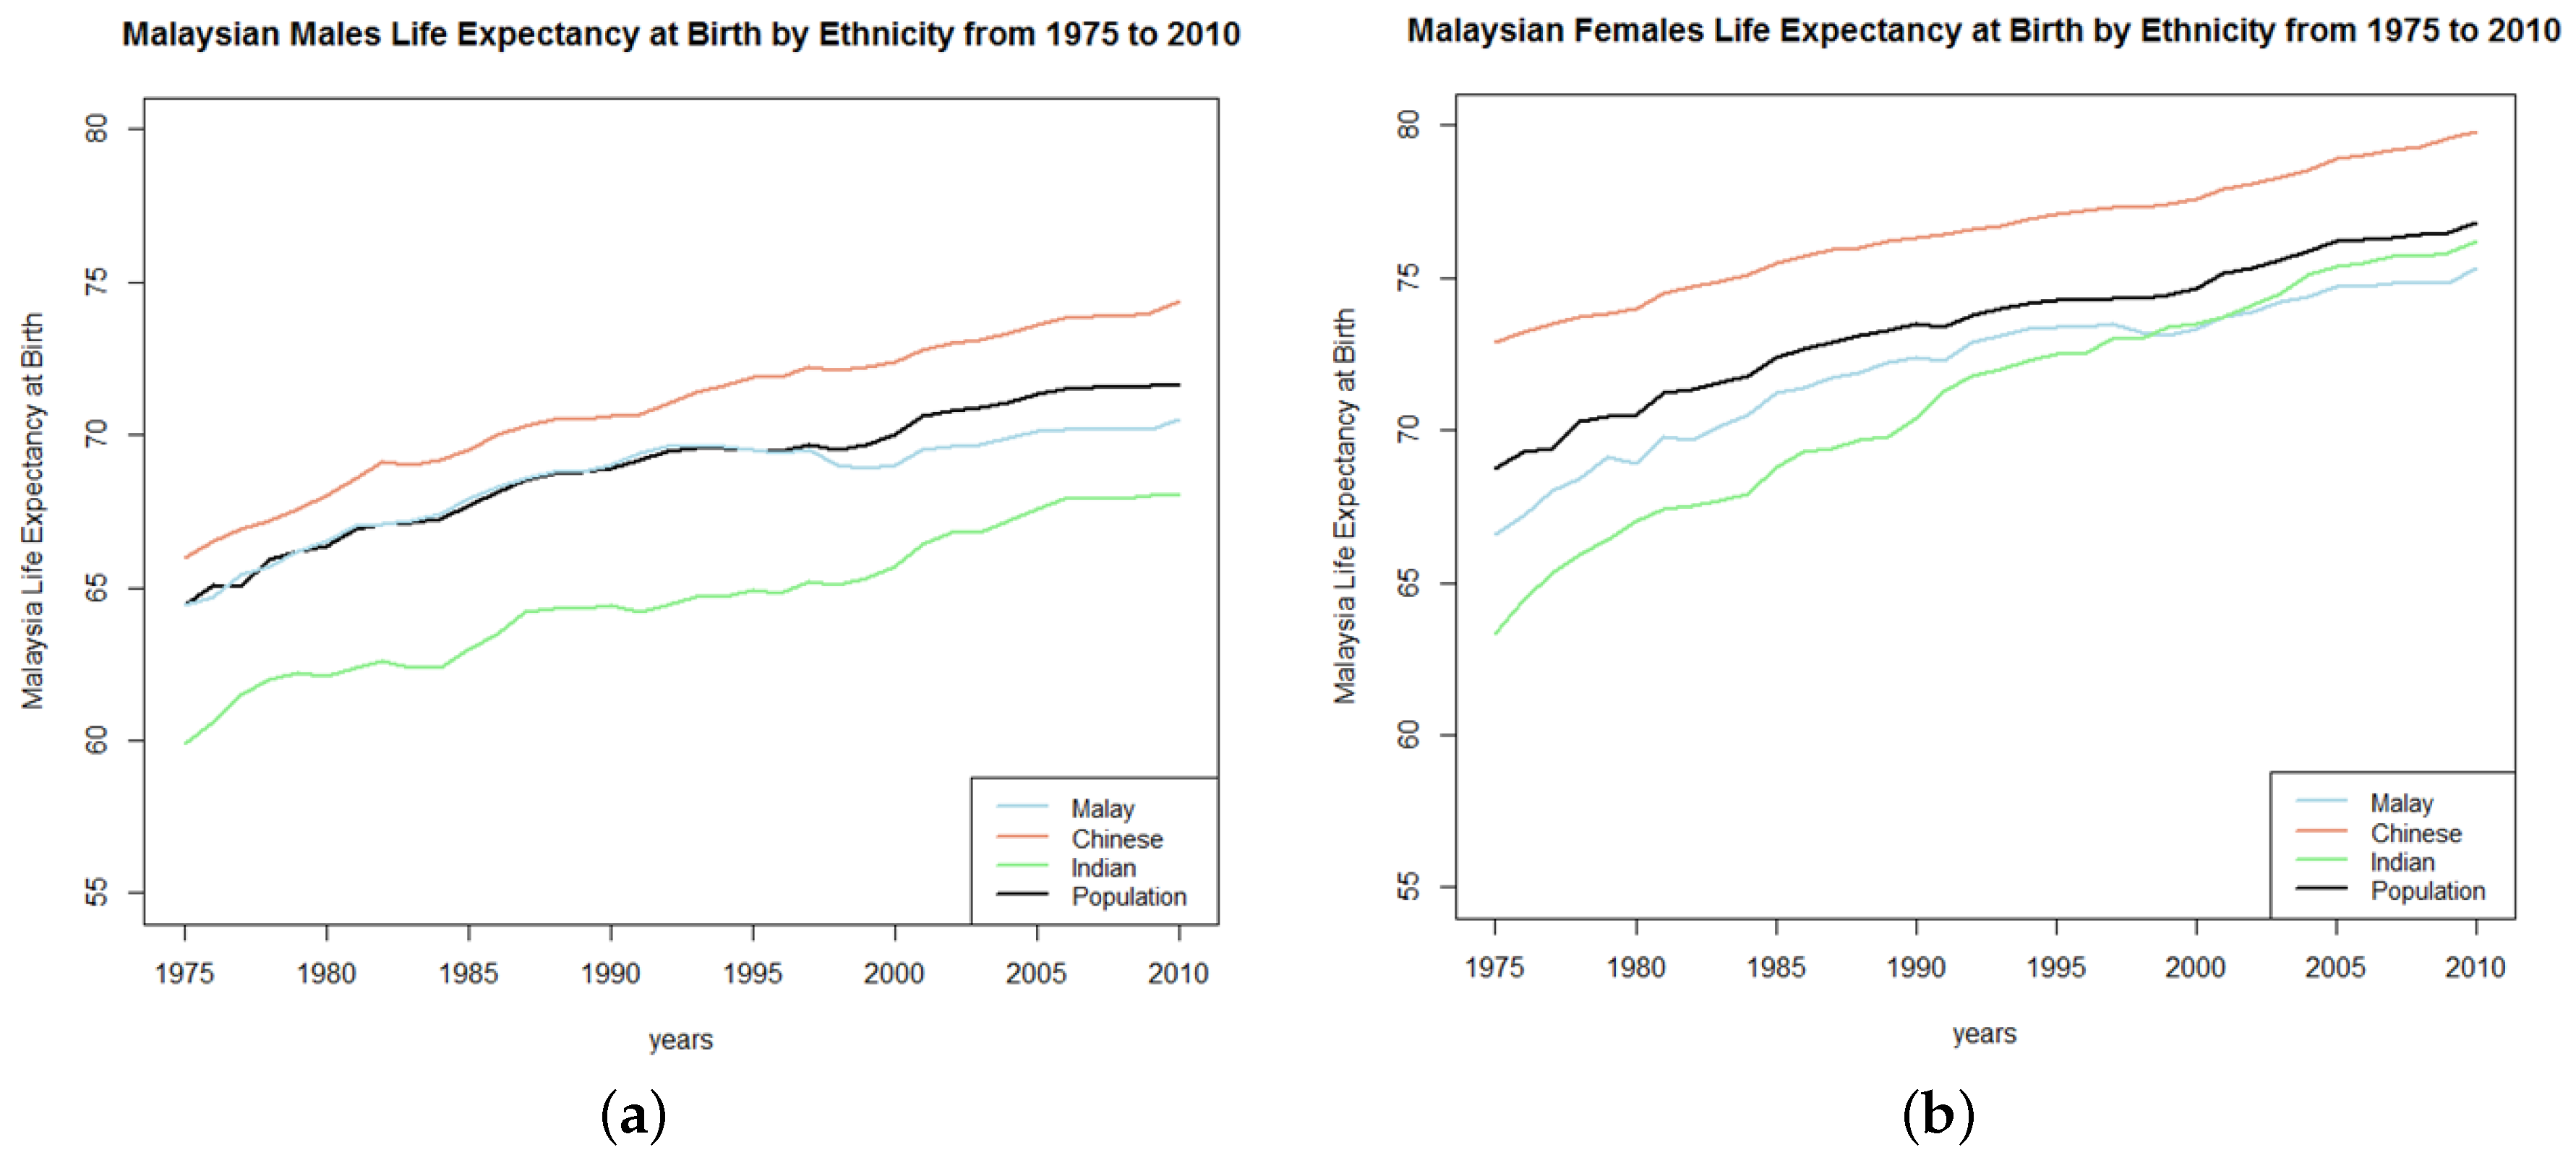
The application of coherent mortality forecasting models is extended to apply ethnic-coherence to male and female sub-ethnic populations and compare these results with those of the gender-coherence models. Past data suggest that Chinese mortality is consistently lower than Malay and Indian (refer to Figure 7). Therefore, we incorporate Chinese data in the forecasts of Malay and Indian mortality and report the impact of different types of coherency on the accuracy of coherent forecasts.
Table 10 shows that the coherent models that account for Chinese female mortality as part of the mortality reference for Malay females and Indian females (ethnic-coherence) can generally improve the forecasts of Malay females and Indian females. As can be seen in Table 10, the use of coherent (rather than independent) models reduces the error of Malay females from 0.182 to 0.142 and from 0.161 to 0.156. Similarly, the forecast errors of independent models are reduced from 0.187 to 0.152 and from 0.183 to 0.129 for Indian females. It is noteworthy that these improvements are attained at the expense of accuracy for Chinese female mortality, as indicated by the increase of errors from 0.136 to 0.179. For Chinese males, the coherent models consistently achieve higher forecast errors compared to the independent models; results for Malay males and Indian males are, however, mixed, resulting in the ethnic-coherence models underperforming the independent models in terms of overall errors.
In addition, the results show that the association of lower mortality groups of the same gender in the sub-population’s model can improve the forecast of high mortality groups better than the association of the lower mortality group of the opposite gender. For example, ethnic-coherence models (that account for Indian female, Malay female and Chinese female mortality as part of the mortality reference) for Indian females outperform independent models, whereas when using gender-coherence, the coherent models underperform independent models. Based on these findings, we suggest that the ethnic-coherence models are more accurate than the gender-coherence models for forecasting the mortality of Indian females.
6. Discussion
6.1. Coherent Mortality Forecasts for Gender Sub-Populations in Malaysia and Australia
6.1.1. Comparison between Coherent and Independent Models
The comparison of the mortality forecasts of the coherent models shows that the coherent models are more accurate than the independent models for both genders in Australia. In contrast, the coherent models are less accurate than the independent models for Malaysian males, but produce better results for females. In terms of overall accuracy, the coherent models perform less well than the independent models for Malaysia. The better performance of the coherent models for Australia is in line with the findings of [13], which show that coherent models tend to be more accurate overall than independent models for Swedish data. It may be that coherent models perform better than independent models for developed countries and are less accurate for developing countries like Malaysia.
It is noteworthy that the accuracy of the coherent models for Malaysian females is achieved at the expense of accuracy of Malaysian male mortality. Similarly, [13] found that coherency improved the accuracy of the mortality forecast of Swedish males at the expense of the accuracy of Swedish female mortality. According to [22], this trend is related to the first age component of the mortality reference ().
This study shows that improved forecasts of male-to-female death ratios are another way in which the coherent models produce a better overall performance than the independent models for Australia. However, the data suggest that the accuracy of the coherent models varies between different age groups. This might be due to the fact that coherent models were designed to produce non-divergent sub-populations forecasts, and therefore, they tend to perform better than the independent models if the differentials between male and female mortality in particular groups are within a defined constant. For example, the coherent models outperform the independent models for Malaysia at ages 0, 1 to 14, 55 to 69 and 70 to 80 and at the same time significantly underperform the independent models for the 15 to 39 and 40 to 54 age groups. The poorer performance for the young adult and middle-age groups might be due to a diverging gap between male and female mortality, which contributes to the larger errors for the overall accuracy in Malaysia. Furthermore, the life expectancy forecasts show that the coherent models tend to produce a smaller forecast gender gap, which is in contrast with recent trends in Malaysia and is aligned with recent trends in Australia. Indeed, Malaysian life expectancies for males and females in recent years have been diverging due to a slow increase in male life expectancy that may be explained by the fluctuations in death rates among young adult males. Therefore, the short-term accuracy of coherent models appears to be strongly influenced by the constant differential of mortality rates between sub-populations. In other words, if some signs of dissimilar patterns are discernible between male and female mortality, then coherent models may not be the best models to forecast those sub-populations.
There is some evidence from our research that indicates the constant differential between male and female mortality is achievable through a careful choice of fitting period. Although the coherent models are less accurate than the independent models for Malaysia in the 20-year forecasts, our results show that these models perform better than the independent models in 10-year forecasts. A shorter forecast period extends the fitting period to include more recent linear decreasing rates in male mortality; hence, the rates tend to be proportional to female rates. In this case, the non-divergent forecast from the coherent models is more consistent with the observations. This finding suggests that coherent models may in the future be better suited to the sub-populations of Malaysia, provided that the recently observed decreasing pattern of death rates for males, which is consistent with that for females, continues in the future.
6.1.2. Comparison between the Two Coherent Models
To the best of our knowledge, the comparison of the forecast accuracy between the coherent models has not been documented in the literature before. This research fills the gap by comparing two recently-developed forms of coherent models: the product-ratio functional and Poisson common factor models. These two models adopt different statistical procedures, which may impact on the accuracy of forecasts in different ways.
This study finds that the product-ratio functional model produces slightly better forecasts than the Poisson common factor for Australia in all forecast components: log mortality rates, male-to-female mortality ratios and life expectancy at birth. One of the possible reasons why the product-ratio functional model might be better is that the model was developed based on the weighted functional method framework that combines the non-parametric smoothing and geometrically-decaying weight procedures. The smoothing procedure allows the observed error to be treated separately from the time series forecast, while the weighting technique gives a greater weight to more recent than earlier data. Prior research confirms that this weighted functional model successfully reduced the forecast error from other independent models for many developed countries, including Australia [10]. Our findings support and complement this result by showing that the use of the weighted functional method in the product-ratio functional models can provide the most accurate forecast of the coherent models in Australia.
Nonetheless, this weighted functional technique does not seem to be suitable for Malaysian mortality and results in a less accurate performance of the product-ratio functional model compared to the Poisson common factor model. This might be because the observed Malaysian male mortality in the forecasting period is inconsistent with the most recent trend in the fitting period. Thus, applying greater weight on the most current trend may wrongly estimate the forecast trend. On the other hand, Australian male and female mortality and Malaysian female mortality in the forecasting period are in line with the most recent trends in the fitting period; hence, the weighting procedure tends to work more effectively for these groups.
6.2. Comparison between the Lee–Carter Model and Its Extensions
Our findings support previous studies by [2,9,10] in several ways. First, the original Lee–Carter model is substantially less accurate than all of the Lee–Carter extensions we consider in forecasting mortality. This may be due to the limitation of the Lee–Carter model, which requires a long data series for fitting. Hence, it violates the invariant age-component and linearly decreasing time-component assumptions. Longer fitting periods produce age-component estimates that are different from the age rate of change in the forecasting period and provide structural changes for the mortality index. Therefore the Lee–Carter model may be invalid for many developed countries.
Second, when forecasting life expectancy, the Lee–Carter model does not necessarily produce larger errors than its extensions. For example, we find that Lee–Carter forecasts produce the highest error for Malaysian overall log death rates and that, conversely, it produces the least error for overall life expectancy. According to [9], the life expectancy estimate involves two types of transformation of log death rates, namely exponentiation and the life table. There will be some cancellation of errors and implicit weights during the process, which eventually could provide a different degree of accuracy for this measure. Therefore, it is insufficient to evaluate the accuracy of a mortality forecasting model merely based on life expectancy error: the error in log death rates is essential to gain a comprehensive understanding of the forecast error. Third, this study found that the weighted functional Lee–Carter extension is consistently more accurate than the Poisson–Lee–Carter model for independent forecasts in Australia. This finding supports results from [9] that found that functional-based models produced the most accurate forecasts of log death rates. The work in [10] showed that functional methods are better than the Lee–Carter method; the weighted functional version is the best among the 10 models they considered for male and female log mortality forecasts.
6.3. Coherent Mortality Forecasts for Gender and Ethnicity Sub-Populations in Malaysia
The application of coherent models to the smaller sub-populations (Malay, Chinese and Indian) may be advantageous to forecasters as it provides additional information and results that are specific to these particular sub-populations. For the gender-coherence applications, Malaysia’s mortality forecasts indicate that the coherent models are less accurate than the independent models for overall accuracy. This result is applicable to the Malay population, which is the majority of the population. However, for the Chinese, we found that coherent models are more accurate than independent models, following the results for Australia. Therefore, preference between forecasting methods may differ between specific sub-populations.
Over recent decades, the life expectancy of the Chinese sub-population has been increasing and consistently higher than that of Malays and Indians for both genders. Our results suggest that the ethnic-coherence models are more accurate than the independent models and the gender-coherence model for the majority of sub-populations. This suggests that the incorporation of a lower mortality of the same gender sub-population in the coherent model increases accuracy by more than the incorporation of a lower mortality of the opposite gender sub-population.
For the Chinese, the ethnic-coherence models produce less accurate forecasts than gender-coherence forecasts. This indicates that the association of higher mortality population with lower mortality sub-populations in the model might jeopardize the accuracy for lower mortality groups. While Chinese female mortality is better forecast using gender-coherence, Chinese male mortality is better forecast individually or independently. Thus, it seems that Chinese males are the only group for which the best mortality reference is unavailable within the country.
Our findings suggest that coherent models have the potential to be more accurate than the independent models even when applied to high mortality populations provided an appropriate type of coherency is chosen. Further investigations are needed to establish the best mortality reference for the sub-populations. Other types of coherency, such as urban and rural coherence or developed and developing countries coherence, would make good topics for future research.
7. Conclusions
This research evaluated five mortality forecasting models: two coherent models (the product-ratio functional and the Poisson common factor models), their independent versions (the weighted functional model and the Poisson–Lee–Carter model) and the Lee–Carter model. All five models were applied to age- and gender-specific mortality rates from Australia and Malaysia in which gender-coherence was employed for coherent models.
The out-of-sample log death rate forecast errors of different models showed that both coherent models outperformed independent models for three out of the four sub-populations: Australian males and females and Malaysian females. In terms of overall accuracy (averaging over males and females), coherent models were more accurate than independent models for Australia, but less accurate for Malaysia. However, coherent models have the potential to outperform independent models for Malaysian sub-populations if an extended fitting period was employed, thus accounting for a recent decreasing mortality trend among Malaysian males in the estimation. Between coherent models, the Poisson common factor method was more accurate than the product-ratio functional method in Malaysia, while the reverse was true in Australia. It is noteworthy that the Lee–Carter model was significantly less accurate than the other models in both countries.
In addition to log death rates, we included the male-to-female death rate ratio and life expectancy at birth forecasts as outcomes to measure the performance of different mortality forecasting models. The out-of-sample male-to-female death ratio forecasts of independent models diverged, particularly for the 15 to 39 age group, whereas the forecasts from coherent models were approximately constant for almost all age groups, consistent with the observed pattern over the same time. The life expectancy at birth forecast errors showed similar results to the log death rates in which the overall errors indicated that coherent models were more accurate than independent models for Australia, but were less accurate for Malaysia.
Finally, the application of the coherent mortality models to age-, gender- and ethnic-specific mortality rates of Malaysian sub-populations showed that the association of a lower mortality group of the same gender (ethnic-coherence) in the sub-population’s model can improve the accuracy of forecast values more than the association of a lower mortality group of opposite gender (gender-coherence).
Acknowledgments
The authors thank the reviewers for their valuable suggestions. Syazreen Shair is grateful for research funds from the Faculty of Business and Economics at Macquarie University, Australia, and the Ministry of Higher Education, Malaysia, in conjunction with the University of Technology MARA.
Author Contributions
Nick Parr, Syazreen Shair and Sachi Purcal conceived of and designed the experiments. Syazreen Shair performed the experiments. Syazreen Shair and Sachi Purcal analysed the data. Nick Parr contributed analysis and a review of the literature. Syazreen Shair wrote the paper.
Conflicts of Interest
The authors declare no conflict of interest.
References
- R.D. Lee, and L.R. Carter. “Modelling and Forecasting U.S Mortality.” J. Am. Stat. Assoc. 87 (1992): 659–671. [Google Scholar]
- H. Booth, J. Maindonald, and L. Smith. “Applying Lee-Carter under condition of variable mortality decline.” Popul. Stud. 56 (2002): 325–336. [Google Scholar] [CrossRef] [PubMed]
- R. Lee, and T. Miller. “Evaluating the Performance of Lee-Carter Method for Forecasting Mortality.” Demography 38 (2001): 537–549. [Google Scholar] [CrossRef]
- J. Li. “Projections of New Zealand Mortality Using the Lee-Carter Model and its Augmented Common Factor Extensions.” N. Z. Popul. Rev. 36 (2010): 27–53. [Google Scholar]
- N. Brouhns, M. Denuit, and J.K. Vermunt. “A Poisson log-bilinear regression approach to the construction of projected life tables.” Insur. Math. Econ. 31 (2002): 372–393. [Google Scholar] [CrossRef]
- A. Renshaw, and S. Haberman. “Lee-Carter Mortality Forecasting: A Parallel Generalized Linear Modelling Approach for England and Wales Mortality Projections.” J. R. Stat. Soc. 52 (2003): 119–137. [Google Scholar] [CrossRef]
- R.J. Hyndman, and M.S. Ullah. “Robust Forecasting of Mortality and Fertility Rates: A Functional Data Approach.” Comput. Stat. & Data Anal. 51 (2007): 111–126. [Google Scholar]
- H. Booth, L. Tickle, and L. Smith. “Evaluation of the variants of Lee-Carter method of forecasting mortality: A multi-country comparison.” N. Z. Popul. Rev. 31 (2005): 13–34. [Google Scholar]
- H. Booth, R.J. Hyndman, L. Tickle, and P.D. Jong. “Lee-Carter Mortality Forecasting: A Multi-country Comparison of Variants and Extensions.” Demogr. Res. 15/9 (2006): 289–310. [Google Scholar] [CrossRef]
- H.L. Shang, H. Booth, and R.J. Hyndman. “Point and interval forecasts of mortality rates and life expectancy: A comparison of ten principal component methods.” Demogr. Res. 25 (2011): 173–214. [Google Scholar] [CrossRef]
- N. Li, and R. Lee. “Coherent Mortality Forecasts for a Group of Population: An Extension of the Lee-Carter Method.” Demography 42 (2005): 575–594. [Google Scholar] [CrossRef] [PubMed]
- J. Li. “A Poisson Common Factor Model for Projecting Mortality and Life Expectancy Jointly for Females and Males.” Popul. Stud. 67 (2013): 111–126. [Google Scholar] [CrossRef] [PubMed]
- R.J. Hyndman, H. Booth, and F. Yasmeen. “Coherent mortality forecasting: The product-ratio method with functional time series models.” Demography 50 (2013): 261–283. [Google Scholar] [CrossRef]
- J. Li, L. Tickle, and N. Parr. “A multi-population evaluation of the Poisson common factor model for projecting mortality jointly for both sexes.” J. Popul. Res. 33 (2016): 333–360. [Google Scholar] [CrossRef]
- R.J. Hyndman. “Demography: Forecasting Mortality, Fertility, Migration and Population Data, 2013.” R Package version 1.14. With Contributions from Heather Booth and Leonie Tickle and John Maindonald. Available online: http://robjhyndman.com/software/demography (accessed on 15 April 2013).
- University of California, Berkeley (USA), and Max Planck Institute for Demographic Research (Germany). “Human Mortality Database, 2013.” Available online: http://www.mortality.org (accessed on 19 June 2013).
- L. Mikkelsen, D. Phillips, C. AbouZahr, P. Setel, D. de Savigny, R. Lozano, and A. Lopez. “A global assessment of civil registration and vital statistics systems: Monitoring data quality and progress.” Lancet 386 (2015): 1395–1406. [Google Scholar] [CrossRef]
- N. Parr, J. Li, and L. Tickle. “A cost of living longer: Projections of the effects of prospective mortality improvements on economic support ratios for 14 advanced economics.” Popul. Stud. 70 (2016): 181–200. [Google Scholar] [CrossRef] [PubMed]
- J. Pollard. “On the Changing Shape of the Australian Mortality Curve.” Health Transit. Rev. 6 (1996): 283–300. [Google Scholar]
- B. Mohamed, A. Hamid, and Zolkepli. “Mortality rates by specific age group and gender in Malaysia: Trend of 16 years, 1995–2010.” J. Health Inf. Dev. Ctries. 6 (2012): 521–529. [Google Scholar]
- DOSM. Kadar Demografi Utama, 1911–2010, Malaysia; Technical Report; Putrajaya, Malaysia: Department of Statistics Malaysia, 2010.
- F. Yasmeen. “Functional Linear Models for Mortality Forecasting.” Ph.D. Thesis, Department of Econometrics and Business Statistics, Monash University, Australia, 2010. [Google Scholar]
- 1The time period begins with the establishment of the modern Malaysian state. Data are not available for ages above 80.
- 2Although Malaysian data runs to age 80, Australian data above age 80 were included in order to avoid loss of information.
- 3Means are over age groups and years in the out-of-sample period; ‘overall’ refers to the average of the male and female errors.
- 4While the results discussed in this paragraph are not displayed below, they are available from the authors on request.
Figure 1.
The mortality index, or time component, , estimated from the Lee–Carter model for the Australian total population from 1921 to 2009 (left) and for the Malaysian total population from 1965 to 2011 (right).
Figure 1.
The mortality index, or time component, , estimated from the Lee–Carter model for the Australian total population from 1921 to 2009 (left) and for the Malaysian total population from 1965 to 2011 (right).

Figure 2.
The rainbow age-specific log death rate plots for (a) Australian females, (b) Australian males, (c) Malaysian females and (d) Malaysian males.
Figure 2.
The rainbow age-specific log death rate plots for (a) Australian females, (b) Australian males, (c) Malaysian females and (d) Malaysian males.

Figure 3.
Mean Forecast Error () by age and methods for (a) Australian females, (b) Australian males, (c) Malaysian females and (d) Malaysian males.
Figure 3.
Mean Forecast Error () by age and methods for (a) Australian females, (b) Australian males, (c) Malaysian females and (d) Malaysian males.
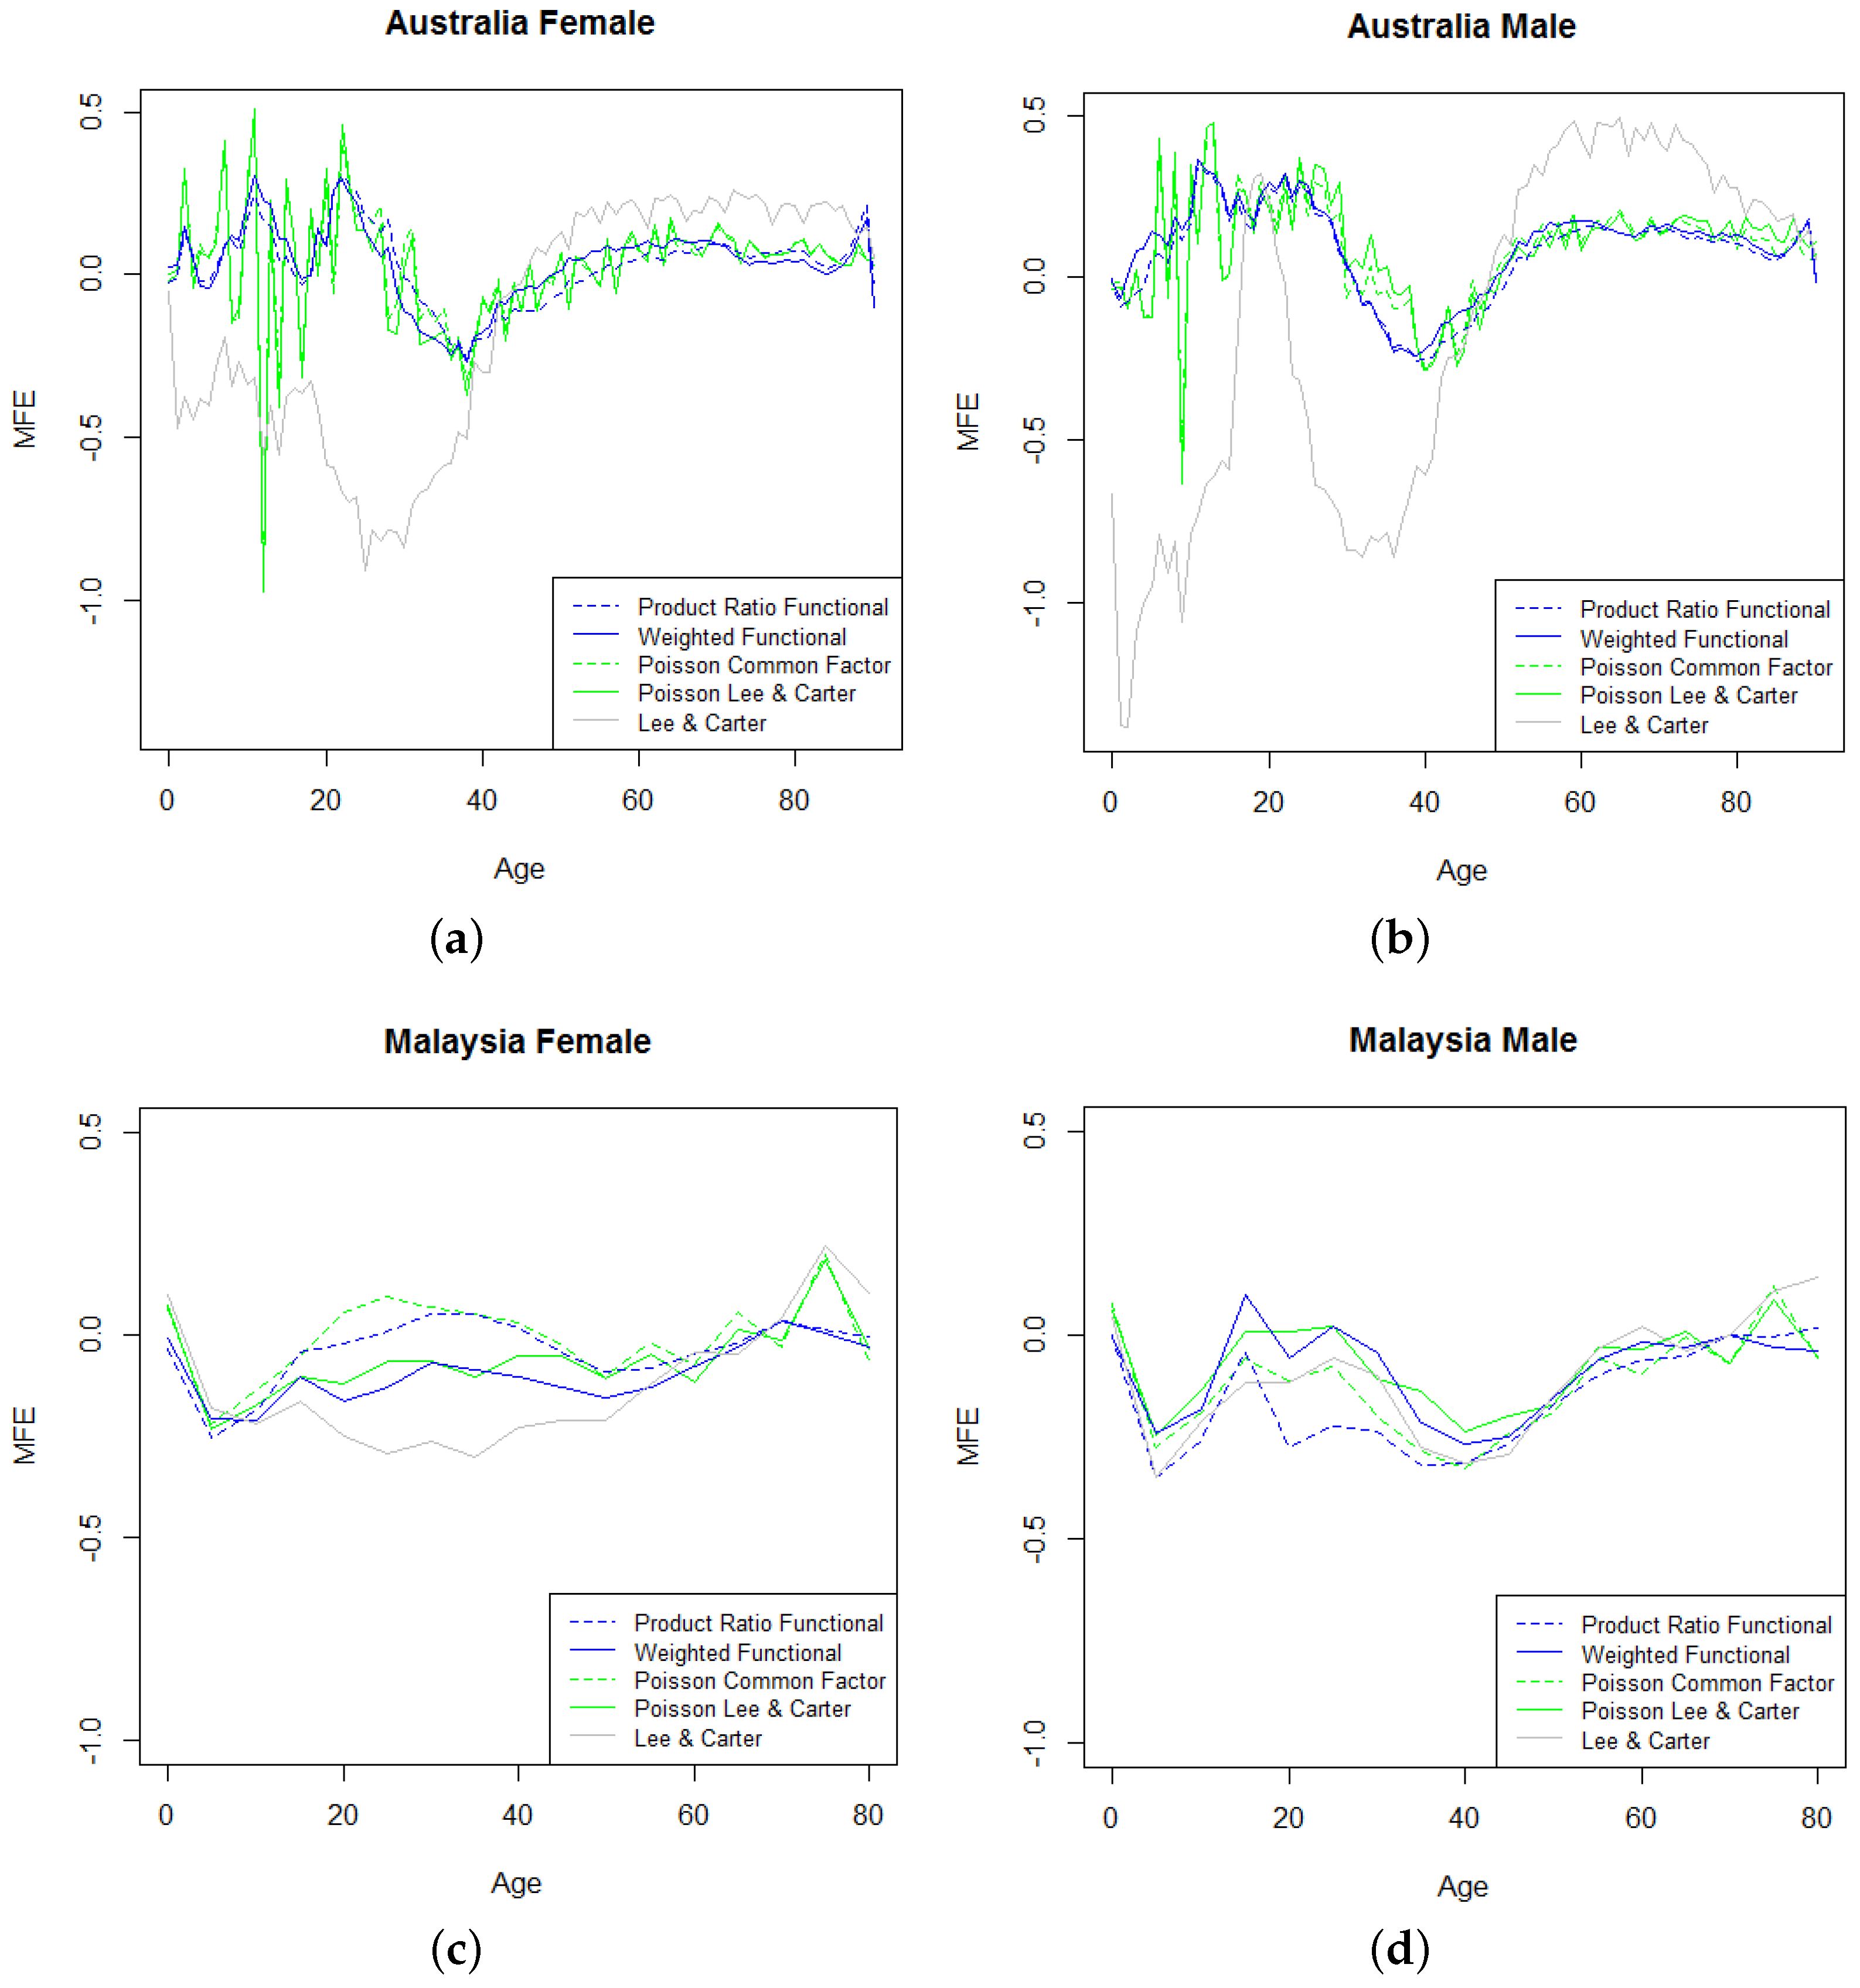
Figure 4.
(a) Australian observed male-to-female death rate ratios 1968–2009, followed by forecasts of these ratios from 1989–2009 using (b) Lee-Carter, (c) Poisson common factor, (d) Poisson-Lee-Carter, (e) Product-ratio functional and (f) Weighted functional models.
Figure 4.
(a) Australian observed male-to-female death rate ratios 1968–2009, followed by forecasts of these ratios from 1989–2009 using (b) Lee-Carter, (c) Poisson common factor, (d) Poisson-Lee-Carter, (e) Product-ratio functional and (f) Weighted functional models.
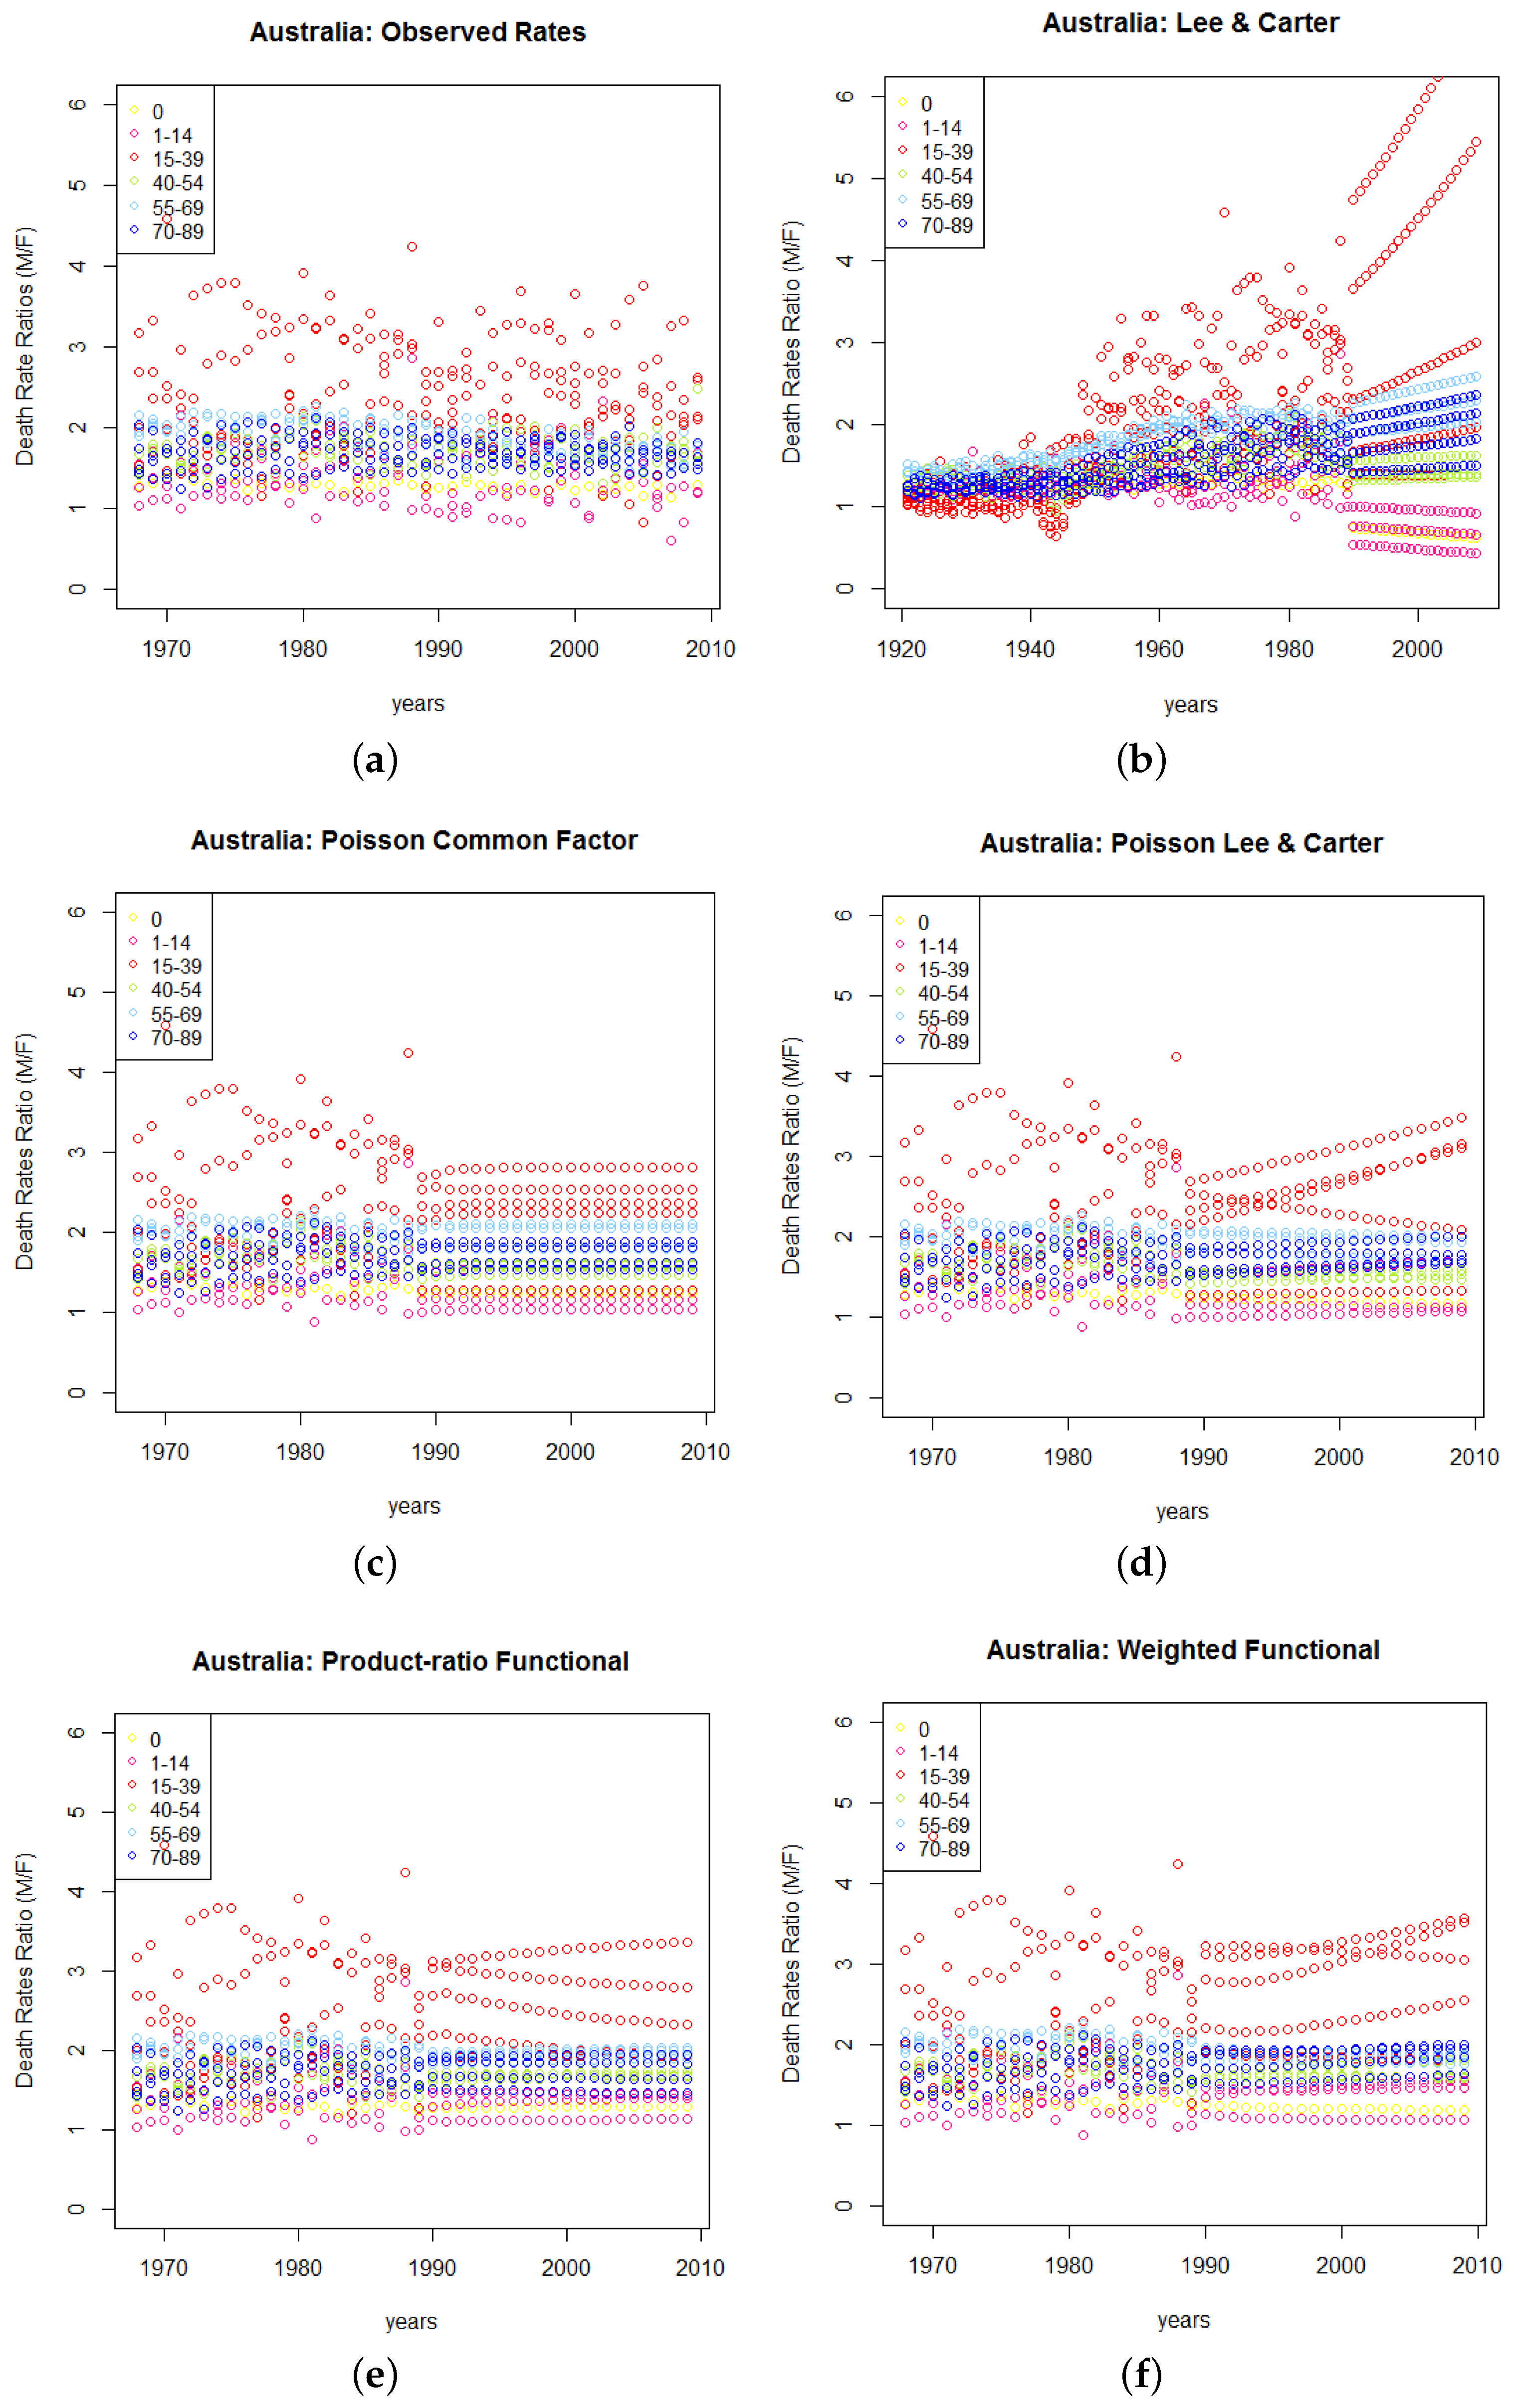
Figure 5.
(a) Malaysian observed male-to-female death rate ratios 1965–2011, followed by forecasts of these ratios from 1990–2010 using (b) Lee-Carter, (c) Poisson common factor, (d) Poisson-Lee-Carter, (e) Product-ratio functional and (f) Weighted functional models.
Figure 5.
(a) Malaysian observed male-to-female death rate ratios 1965–2011, followed by forecasts of these ratios from 1990–2010 using (b) Lee-Carter, (c) Poisson common factor, (d) Poisson-Lee-Carter, (e) Product-ratio functional and (f) Weighted functional models.

Figure 6.
Observed and 20-year forecasts of Australian (left) and Malaysian (right) life expectancies at birth for males and females.
Figure 6.
Observed and 20-year forecasts of Australian (left) and Malaysian (right) life expectancies at birth for males and females.
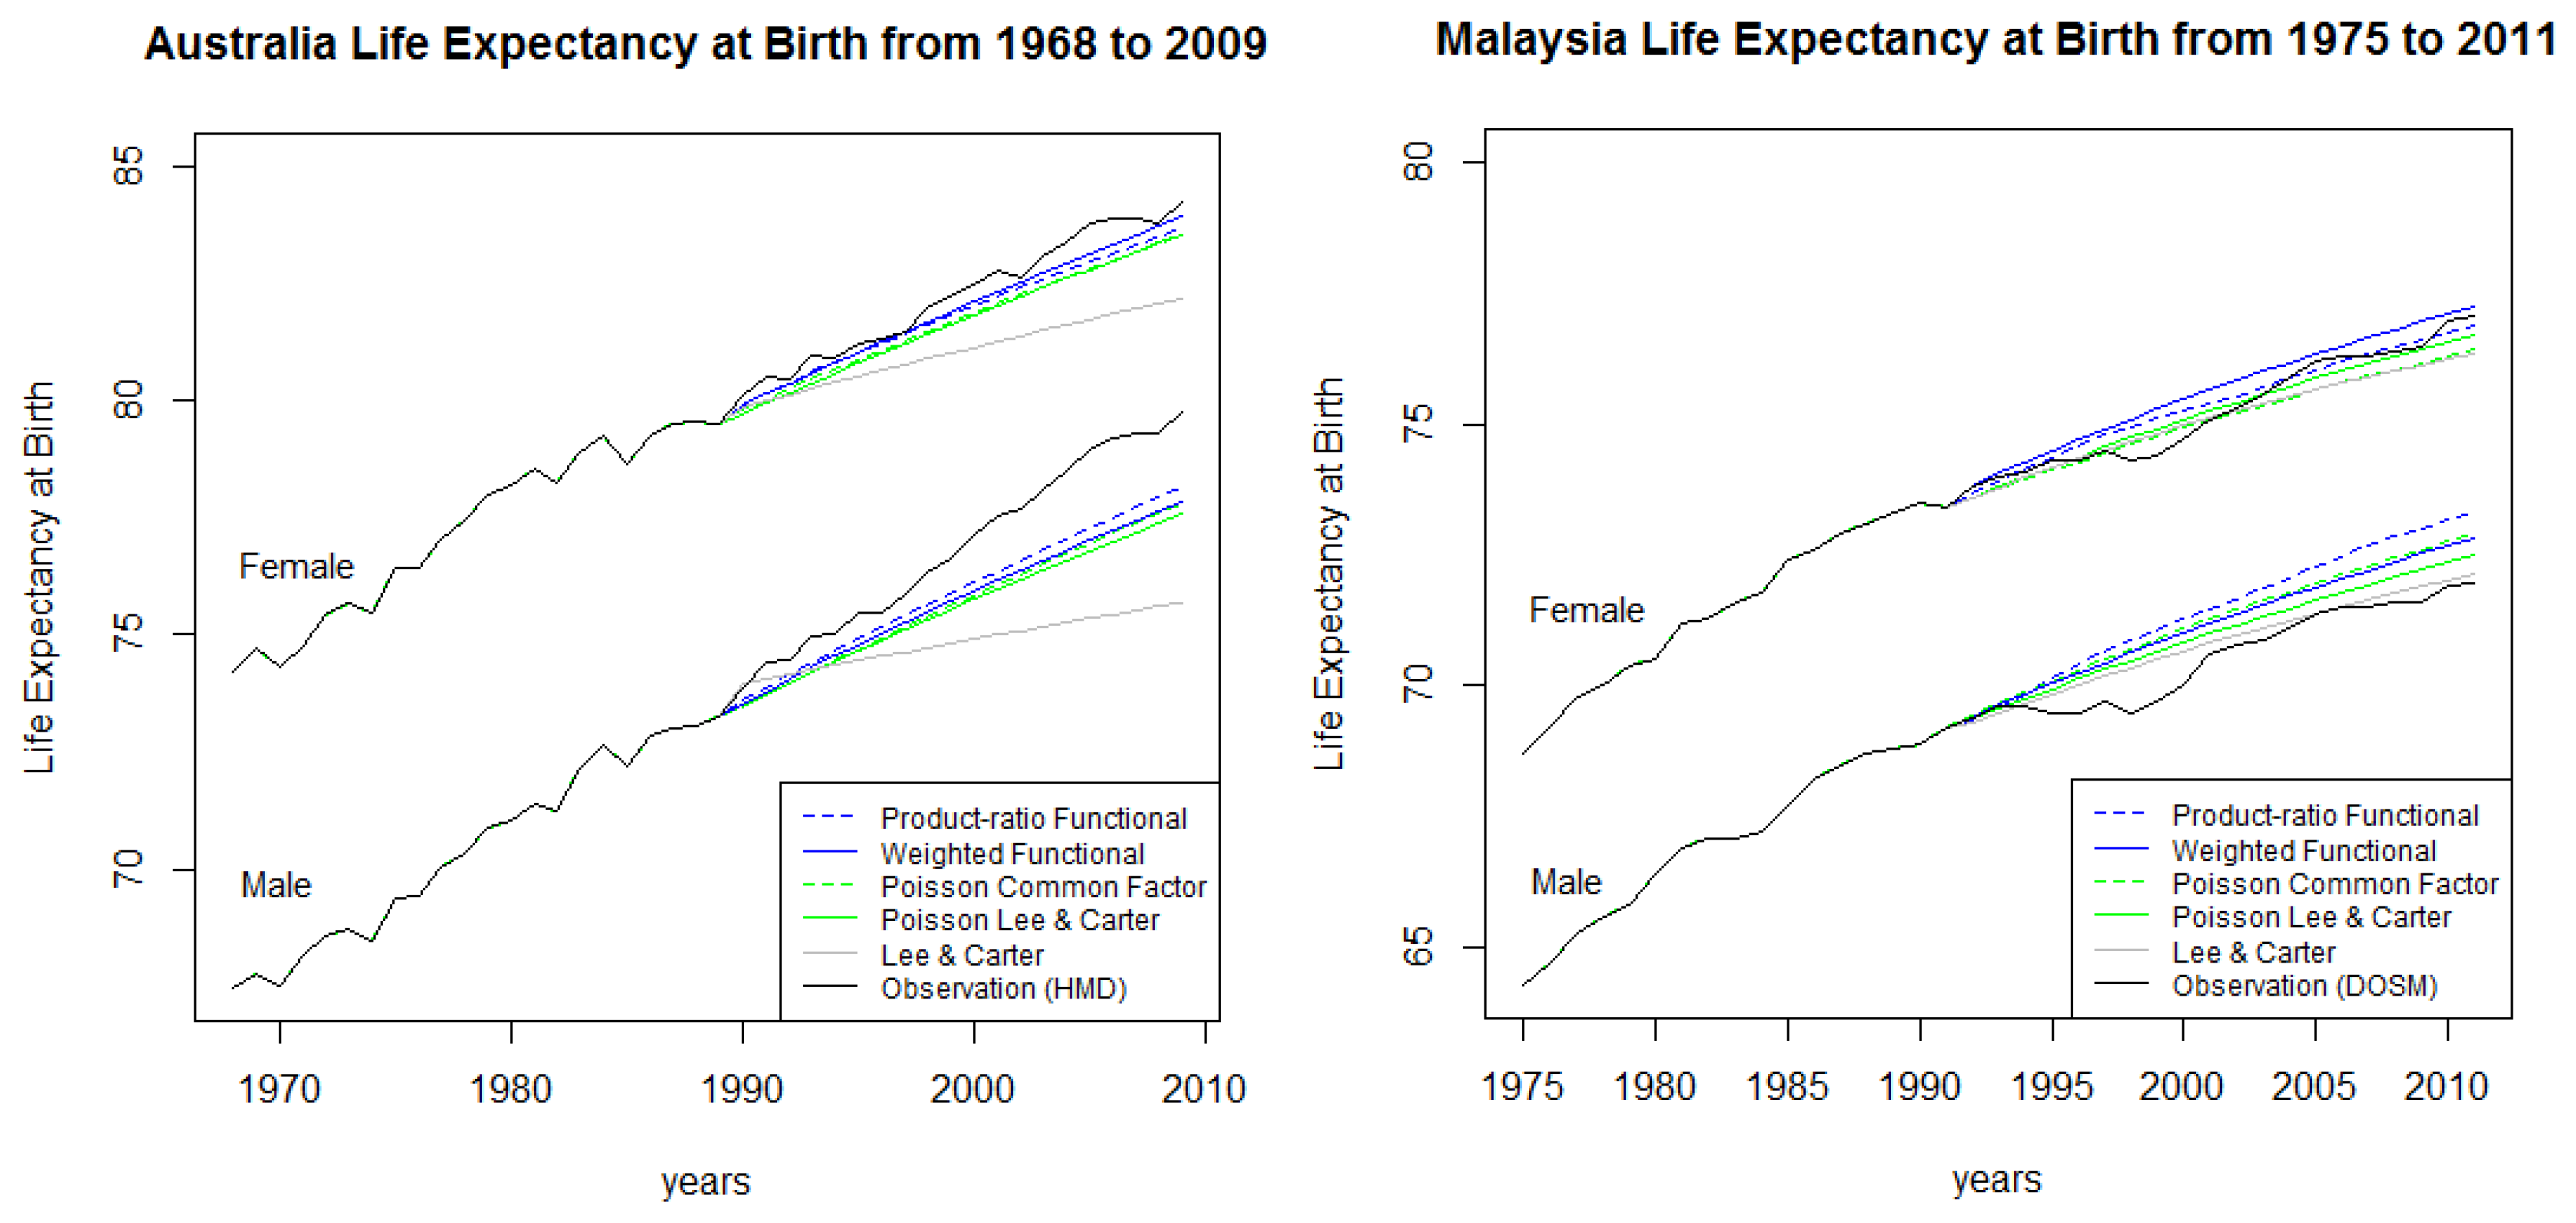
Figure 7.
Malaysian observed life expectancy at birth by ethnic groups from 1975 to 2010 for males (a) and females (b).
Figure 7.
Malaysian observed life expectancy at birth by ethnic groups from 1975 to 2010 for males (a) and females (b).


Table 1.
Mean Absolute Forecast Error () of log death rates for males and females by method, gender and country.
| Australia | Malaysia | ||||||
|---|---|---|---|---|---|---|---|
| Male | Female | Overall | Male | Female | Overall | ||
| 20-year forecasts | |||||||
| Poisson–Lee–Carter | 0.184 | 0.162 | 0.173 | 0.118 | 0.100 | 0.109 | |
| Poisson common factor | 0.175 | 0.156 | 0.166 | 0.152 | 0.089 | 0.120 | |
| Weighted functional | 0.171 | 0.135 | 0.153 | 0.123 | 0.111 | 0.117 | |
| Product-ratio functional | 0.163 | 0.134 | 0.149 | 0.170 | 0.077 | 0.124 | |
| Lee–Carter | 0.472 | 0.333 | 0.402 | 0.150 | 0.179 | 0.164 | |
Table 2.
Mean Forecast Error () of log death rates for males and females by method, gender and country.
| Australia | Malaysia | ||||||
|---|---|---|---|---|---|---|---|
| Male | Female | Overall | Male | Female | Overall | ||
| 20-year forecasts | |||||||
| Poisson–Lee–Carter | −0.094 | −0.024 | −0.059 | 0.072 | 0.060 | 0.066 | |
| Poisson common factor | −0.087 | −0.031 | −0.059 | 0.120 | 0.006 | 0.063 | |
| Weighted functional | −0.094 | −0.036 | −0.065 | 0.087 | 0.094 | 0.090 | |
| Product-ratio functional | −0.070 | −0.030 | −0.050 | 0.157 | 0.039 | 0.098 | |
| Lee–Carter | 0.148 | 0.142 | 0.145 | 0.102 | 0.122 | 0.112 | |
Table 3.
Mean Absolute Percentage Forecast Error () of the male-to-female death rate ratios by age, method and country.
| Australia | |||||||
| 20-Year Forecasts | 0 | 1 to 14 | 15 to 39 | 40 to 54 | 55 to 69 | 70 to 90 | Overall |
| Poisson–Lee–Carter | 4.60 | 62.07 | 30.21 | 11.64 | 9.41 | 8.90 | 21.14 |
| Poisson common factor | 3.74 | 55.31 | 23.15 | 11.65 | 11.46 | 6.21 | 18.59 |
| Weighted functional | 4.40 | 31.24 | 18.94 | 8.05 | 7.96 | 8.16 | 13.13 |
| Product-ratio functional | 3.67 | 30.36 | 15.93 | 8.46 | 10.00 | 5.13 | 12.26 |
| Lee–Carter | 45.78 | 41.39 | 45.23 | 14.45 | 26.22 | 10.89 | 30.66 |
| Malaysia | |||||||
| 20-Year Forecasts | 0 | 1 to 14 | 15 to 39 | 40 to 54 | 55 to 69 | 70 to 80 | Overall |
| Poisson–Lee–Carter | 3.24 | 8.35 | 14.67 | 7.67 | 5.20 | 6.20 | 7.55 |
| Poisson common factor | 2.28 | 4.71 | 22.32 | 10.61 | 4.32 | 5.32 | 8.26 |
| Weighted functional | 2.25 | 12.32 | 16.19 | 7.28 | 3.99 | 4.36 | 7.73 |
| Product-ratio functional | 3.71 | 6.35 | 24.98 | 10.58 | 3.25 | 4.14 | 8.84 |
| Lee–Carter | 6.79 | 10.18 | 18.70 | 7.66 | 4.20 | 7.54 | 9.18 |
| 20-Year Forecasts | Australia | Malaysia | |||||
|---|---|---|---|---|---|---|---|
| Male | Female | Overall | Male | Female | Overall | ||
| Poisson–Lee–Carter | 1.289 | 0.567 | 0.928 | 0.466 | 0.213 | 0.339 | |
| Poisson common factor | 1.202 | 0.521 | 0.861 | 0.724 | 0.295 | 0.509 | |
| Weighted functional | 1.123 | 0.290 | 0.706 | 0.660 | 0.371 | 0.516 | |
| Product-ratio functional | 0.945 | 0.355 | 0.650 | 0.945 | 0.223 | 0.584 | |
| Lee–Carter | 2.044 | 1.201 | 1.622 | 0.289 | 0.302 | 0.296 | |
| 20-Year Forecasts | Australia | Malaysia | |||||
|---|---|---|---|---|---|---|---|
| Male | Female | Overall | Male | Female | Overall | ||
| Poisson–Lee–Carter | −1.289 | −0.567 | −0.928 | 0.460 | −0.035 | 0.213 | |
| Poisson common factor | −1.202 | −0.521 | −0.861 | 0.724 | −0.203 | 0.261 | |
| Weighted functional | −1.123 | −0.290 | −0.706 | 0.660 | 0.372 | 0.516 | |
| Product-ratio functional | −0.945 | −0.335 | −0.650 | 0.938 | 0.131 | 0.534 | |
| Lee–Carter | −2.044 | −1.201 | −1.622 | 0.269 | −0.187 | 0.041 | |
Table 6.
Mean Absolute Forecast Error () and Mean Forecast Error () of log death rates for males and females by method and gender for Malaysia.
| 1 | |||||||
|---|---|---|---|---|---|---|---|
| 10-Year Forecasts | |||||||
| Male | Female | Overall | Male | Female | Overall | ||
| Poisson–Lee–Carter | 0.072 | 0.082 | 0.077 | −0.017 | 0.030 | 0.007 | |
| Poisson common factor | 0.059 | 0.059 | 0.059 | 0.022 | −0.002 | 0.010 | |
| Weighted functional | 0.111 | 0.076 | 0.093 | −0.049 | 0.012 | −0.018 | |
| Product-ratio functional | 0.071 | 0.060 | 0.065 | 0.024 | −0.007 | 0.009 | |
| Lee–Carter | 0.100 | 0.161 | 0.130 | 0.019 | 0.109 | 0.064 | |
Table 7.
Mean Absolute Percentage Forecast Error () of male-to-female death rate ratios by age and method for Malaysia.
| 10-Year Forecasts | 0 | 1 to 14 | 15 to 39 | 40 to 54 | 55 to 69 | 70 to 80 | Overall |
|---|---|---|---|---|---|---|---|
| Poisson–Lee–Carter | 4.228 | 7.158 | 22.564 | 5.291 | 2.928 | 9.599 | 8.628 |
| Poisson common factor | 3.622 | 4.572 | 5.491 | 5.565 | 3.209 | 6.700 | 4.860 |
| Weighted functional | 17.614 | 15.948 | 23.367 | 4.108 | 2.754 | 8.973 | 12.127 |
| Product-ratio functional | 3.502 | 4.121 | 6.743 | 6.762 | 4.683 | 6.646 | 5.409 |
| Lee–Carter | 5.231 | 11.907 | 35.384 | 3.070 | 4.483 | 8.778 | 11.475 |
Table 8.
Mean Absolute Forecast Error () and Mean Forecast Error () of life expectancy at birth for males and females by method for Malaysia.
| 10-Year Forecasts | |||||||
|---|---|---|---|---|---|---|---|
| Male | Female | Overall | Male | Female | Overall | ||
| Poisson–Lee–Carter | 0.092 | 0.315 | 0.203 | −0.073 | −0.315 | −0.194 | |
| Poisson common factor | 0.191 | 0.272 | 0.232 | 0.183 | −0.268 | −0.043 | |
| Weighted functional | 0.190 | 0.320 | 0.255 | −0.188 | −0.320 | −0.254 | |
| Product-ratio functional | 0.238 | 0.341 | 0.290 | 0.237 | −0.342 | −0.053 | |
| Lee–Carter | 0.076 | 0.268 | 0.172 | 0.029 | −0.246 | −0.109 | |
Table 9.
Mean Absolute Forecast Errors () according to ethnic groups and gender in Malaysia. Gender-coherence is imposed on coherent models for Malay, Chinese and Indians.
| 20-Year Forecasts | Malay | ||
| Male | Female | Overall | |
| Poisson–Lee–Carter | 0.157 | 0.182 | 0.133 |
| Poisson common factor | 0.229 | 0.129 | 0.179 |
| Weighted functional | 0.150 | 0.161 | 0.156 |
| Product-ratio functional | 0.238 | 0.094 | 0.166 |
| 20-Year Forecasts | Chinese | ||
| Male | Female | Overall | |
| Poisson–Lee–Carter | 0.144 | 0.136 | 0.140 |
| Poisson common factor | 0.150 | 0.111 | 0.131 |
| Weighted functional | 0.138 | 0.185 | 0.162 |
| Product-ratio functional | 0.165 | 0.120 | 0.142 |
| 20-Year Forecasts | Indian | ||
| Male | Female | Overall | |
| Poisson–Lee–Carter | 0.155 | 0.187 | 0.171 |
| Poisson common factor | 0.173 | 0.260 | 0.216 |
| Weighted functional | 0.166 | 0.183 | 0.174 |
| Product-ratio functional | 0.198 | 0.199 | 0.198 |
Table 10.
Mean Absolute Forecast Errors () by ethnic groups and gender in Malaysia. Ethnic-coherence is imposed on coherent models for males and females.
| Malaysian Males | Malay | Chinese | Indian | Overall |
| 20-year forecasts | ||||
| Poisson–Lee–Carter | 0.157 | 0.144 | 0.155 | 0.152 |
| Poisson common factor | 0.148 | 0.187 | 0.169 | 0.168 |
| Weighted functional | 0.150 | 0.138 | 0.166 | 0.151 |
| Product-ratio functional | 0.162 | 0.167 | 0.150 | 0.160 |
| Malaysian Females | Malay | Chinese | Indian | Overall |
| 20-year forecasts | ||||
| Poisson–Lee–Carter | 0.182 | 0.136 | 0.187 | 0.168 |
| Poisson common factor | 0.142 | 0.179 | 0.152 | 0.157 |
| weighted functional | 0.161 | 0.185 | 0.183 | 0.176 |
| Product-ratio functional | 0.156 | 0.185 | 0.129 | 0.157 |
© 2017 by the authors. Licensee MDPI, Basel, Switzerland. This article is an open access article distributed under the terms and conditions of the Creative Commons Attribution (CC BY) license ( http://creativecommons.org/licenses/by/4.0/).
Share and Cite
MDPI and ACS Style
Shair, S.; Purcal, S.; Parr, N. Evaluating Extensions to Coherent Mortality Forecasting Models. Risks 2017, 5, 16. https://doi.org/10.3390/risks5010016
AMA Style
Shair S, Purcal S, Parr N. Evaluating Extensions to Coherent Mortality Forecasting Models. Risks. 2017; 5(1):16. https://doi.org/10.3390/risks5010016
Chicago/Turabian StyleShair, Syazreen, Sachi Purcal, and Nick Parr. 2017. "Evaluating Extensions to Coherent Mortality Forecasting Models" Risks 5, no. 1: 16. https://doi.org/10.3390/risks5010016
Note that from the first issue of 2016, this journal uses article numbers instead of page numbers. See further details here.