Bond Yields, Sovereign Risk and Maturity Structure


Departamento de Dirección y Economía de la Empresa, Universidad de León, 24071 León, Spain
*
Author to whom correspondence should be addressed.
Risks 2018, 6(4), 109; https://doi.org/10.3390/risks6040109
Submission received: 8 August 2018
/
Revised: 25 September 2018
/
Accepted: 26 September 2018
/
Published: 30 September 2018
Abstract
:The aim of this paper is to analyze the relation between maturity structure, sovereign bond yields and sovereign risk in the Economic and Monetary Union for the period of 1990–2013. The results confirm the existence of an inverse relationship between sovereign bond yields, sovereign risk and the maturity structure of sovereign debt, regardless of the proxy that is used to measure sovereign risk and the time variance of the variables employed. The results indicate that risk shortens the maturity structure of sovereign debt because it reduces the stock of long-term debt. The relationship between maturity structure and sovereign bond yields differs depending on the risk of the countries analyzed (non-monotonic relationship) and the differences between peripheral and core countries are greater for higher levels of the yields. If we control for the indebtedness level of these countries, the results show that the relationship between the sovereign bond yields and maturity strengthens as the debt level increases.
JEL Classification:
G12; H63; C331. Introduction
The sovereign debt crisis has highlighted the importance of the management of public debt by monetary authorities and has become an important line of research. This crisis is especially important in Europe, particularly in peripheral countries (Portugal, Ireland, Italy, Greece and Spain, or PIIGS), where the turmoil in government bond markets reached hardly acceptable limits for the countries’ public finance systems. This economic shock created a context of political and economic uncertainty, leading to multiple challenges for policymakers and affecting financing costs and investment decisions (Baker et al. 2016; Davis 2016). Economic uncertainty also negatively affects sovereign risk, especially in peripheral countries (Boumparis et al. 2017). Within this context of crisis and economic uncertainty, the objective of this paper is to analyze the impact of sovereign risk on the maturity structure of sovereign debt for a group of Economic and Monetary Union (EMU) countries. For this purpose, we analyzed the maturity structure, measured as the percentage of long-term debt to total debt, and its relationship with sovereign bond yields and various proxies for sovereign risk; namely, the risk premium and sovereign ratings. Additionally, we studied the existence of a non-monotonic relationship between maturity structure, sovereign bond yields and risk premiums (Diamond 1991) by distinguishing two subgroups of countries (peripheral and core countries). Finally, this study differentiates between highly and less indebted countries to analyze the relationship between the maturity structure and sovereign bond yields and sovereign risk, following the approaches of Alesina et al. (1992) and Drudi and Giordano (2000).
Economic agents use the maturity structure of sovereign debt to postpone or advance their debt payment obligations depending on their liquidity needs. In this sense, the relationship between the maturity structure and credit risk has been analyzed in depth in the field of corporate finance, for instance in the works of Myers (1977), Flannery (1986) and Diamond (1991) and, more recently, in those of Baker et al. (2003) and Brunnermeier and Oehmke (2013), among others. However, there are fewer studies in the field of public finance in which the relationship between maturity and sovereign risk is analyzed, as public finance studies have paid more attention to other research topics, such as debt levels and risk premiums. Moreover, maturity structure is a fundamental tool in managing sovereign debt (Goudswaard 1990). Therefore, this paper attempts to extend the existing literature on this line of research, which is particularly interesting in the context of the current financial crisis.
The results showed that sovereign bond yields, sovereign risk and the maturity structure of sovereign debt are inversely related. This finding indicates that an increase in the risk level shortens the maturity structure for the sample. Furthermore, the analysis of the debt maturity structure suggests it is reduced when the sovereign risk increases as the proportion of long-term debt reduces. Another interesting result was the existence of a non-monotonic relationship between sovereign bond yields and the maturity structure debt. We found evidence that in high risk countries (i.e., peripheral countries), the maturity structure of the debt shortens because of the increase in sovereign bond yields. However, in countries with lower risk (i.e., core countries1), this inverse relationship is not as clear. If sovereign bond yields increase, the yields of long-term bonds from countries with higher sovereign risk (i.e., peripheral countries) increase to a greater extent than those of short-term bonds, i.e., the increase in the sovereign bond yields increases the term premium. Therefore, these countries resort to issuing short-term debt to reduce their funding costs. However, the yields of long-term government bonds hold constant for core countries and can even decrease, because they become safe havens. This finding is consistent with the idea that political uncertainty is related to those capital flights (Alesina and Tabellini 1989)2. Therefore, core countries can issue debt at longer maturities without drastically increasing their financing costs. Finally, we also found evidence that the relationship between sovereign bond yields and maturity is stronger when the indebtedness level of the country is high. However, this relationship disappeared when long-term refinancing operations (LTROs) were included. Therefore, those instruments, which are usually issued to relieve market pressure, contribute to shorten the debt maturity structure because the financial sector uses the liquidity provided by LTROs to buy short-term sovereign debt. This has important implications for public authorities, since the effect of LTROs could be the opposite of their aim as the maturity structure shortens and the risk of a debt crisis increases (Cole and Kehoe 2000). Therefore, authorities should monitor how the financial sector uses these LTROs in order to avoid shortening the debt maturity structure to an extent that is risky to the stability of debt. In the same sense, countries should adjust their maturity structure to the economic and financial context. At the beginning of a debt crisis, lengthening debt maturity can be a powerful barrier to avoiding financial market pressure on debt instruments.
The paper is organized as follows. The following section contains a summary of the literature on the relationship among average maturity, maturity structure and risk. In Section 3, we describe several proxies for sovereign risk identified in the literature. Section 4 presents the main hypotheses to be tested in the study. Section 5 describes the data and methodology. In Section 6, the results are presented. Finally, Section 7 summarizes the main conclusions.
2. Literature Review
The analysis of debt maturity structure and its relationship with the credit risk has been and remains a major research topic in the field of finance, especially corporate finance. One of the pioneering works in the study of the determinants of maturity structure is Myers (1977). He examined why some companies borrow more than others do, and why some do so with short-term instruments while others do so with long-term instruments. He determined that a firm’s debt structure depends on the present value of future growth opportunities, i.e., greater growth opportunities leads to less corporate borrowing. Moreover, he stated that one possible way to avoid debt issuance from inducing suboptimal investment decisions is to shorten debt maturity so that debt matures before investment options occur. Subsequently, Flannery (1986) proposed a model to analyze the maturity structure of corporate debt in the context of asymmetric information. They claimed that risk and debt maturity move in the same direction. Therefore, a higher credit risk implies a greater share of long-term debt, lengthening the maturity of sovereign debt. Diamond (1991) stated that the relationship between credit risk and debt maturity is not linear. He posited that a non-monotonic relationship exists, which indicates that companies with high or low credit risk behave differently from those with intermediate credit risk. In this sense, the latter have a greater portion of long-term debt, while firms with high and low risk have higher levels of short-term debt.
The works of Flannery (1986) and Diamond (1991), especially the latter, have been the basis for other authors to analyze the relationship between debt maturity and credit risk. Barclay and Clifford (1995) analyzed industrial companies and concluded that those with greater information asymmetries issue more short-term debt, which is consistent with the model proposed by Diamond (1991). The non-monotonic relationship between credit risk and debt maturity also appears in Stohs and Mauer (1996) and Scherr and Hulburt (2001). However, there are studies that contradict this hypothesis. Berger et al. (2005) compared the implications of the Flannery and Diamond models for a set of American companies until the mid-1990s. Their results showed that debt maturity is an increasing function of risk and therefore confirmed the arguments of Flannery (1986) and contradicted those of Diamond (1991), who suggested that higher risk companies borrow over the short term.
Berger et al. (2005) suggested that studies that analyze the Flannery and Diamond models may not be adequate, because their models take into account new debt issues and not the maturity of the stock of accumulated debt. In this sense, there are also studies that solve this problem and that focus on the maturity of new debt issues. Among them, Mitchell (1993) discussed signaling, tax and monitoring theories and their relationship with the maturity structure of corporate debt for a set of corporate bonds issued by industrial companies in the 1980s. She found evidence that lower risk firms have a longer average maturity of debt than higher risk companies.
Moreover, Baker et al. (2003) analyzed new debt issues and their relationship with the maturity structure of debt by using data on an annual basis for a set of U.S. companies for the period between 1953 and 2000. Their results showed an inverse relationship between the volume of long-term debt and the term premium (the difference between yields in the long and short term), as obtained in Guedes and Opler (1996).
Considering the literature review, we observed that there are many works that focus on analyzing the relationship between credit risk and maturity structure in corporate finance. However, in the field of the public finance, few studies analyzed debt maturity and its relation with sovereign risk. Within this line of research, Alfaro and Kanczuk (2009) discussed the advantages and disadvantages of borrowing over the short or long term and concluded that shortening the maturity structure implies higher levels of welfare. Park (1999) studied the management of U.S. debt. Specifically, he analyzed the influence of maturity on sovereign bond yields. The results indicated that shortening the debt maturity structure, i.e., using more short-term debt, reduces the yields of these instruments but increases those of long-term bonds. Arellano and Ramanarayanan (2012) applied a dynamic model that takes into account the possibility of default to analyze the optimal maturity structure in emerging countries. They obtained evidence that the composition of the maturity structure of sovereign debt is related to interest rate differentials. Hatchondo and Martinez (2013) analyzed the effect of sudden stops on duration3, and they found evidence that sudden stops increase the average optimal duration by one year and that the long-term debt to GDP ratio increases 10%. The authors indicated that this phenomenon is not convenient for countries that are facing a high sovereign risk. Lee et al. (2011) examined the relationship between Macaulay duration and sovereign risk for a sample of bonds issued in U.S. dollars by Asian countries for the period between 1997 and 2009. They found that risk reduced the duration of the bonds, and confirmed the results of Xie et al. (2009). Moreover, this effect was strengthened during recession periods and when sovereign credit ratings are worse.
Broner et al. (2014) indicated that the average maturity of sovereign debt in peripheral countries4 has increased since the creation of the euro—to levels similar to those existing in France and Germany—as a result of the financial stability introduced by the Monetary and Economic Union. A more detailed analysis of the relationship between debt maturity and sovereign risk is provided by Broner et al. (2013), who analyzed the relationship between those two variables for a set of emerging countries for the 1990s and the first decade of the century, taking into account the existence of a crisis during this period. They use the term “excess premium” to refer to the difference in the term premium between emerging and developed countries. They confirmed their hypothesis that investors ask for a higher risk premium on long-term bonds, which indicates that the countries analyzed prefer to issue short-term debt to reduce their funding costs. They also obtained evidence that this trend intensifies in times of crisis, since in this case, the risk premium that investors incorporate into long-term bonds is higher than that in times of financial stability. Drudi and Giordano (2000) deepened the analysis of the optimal maturity structure and found that lengthening the maturity structure decreased the risk of default whereas shortening the maturity structure increased default risk, therefore requiring that the optimal maturity structure be lengthened. However, they also stated that, for highly indebted countries, it is likely that the risk premium in long-term instruments is so high that issuing short-term debt is the only viable option. These results confirmed those reported by Alesina et al. (1992), who obtained an inverse relationship between the risk premium and average maturity only for countries with a high level of indebtedness.
This work is part of this last line of research, which focuses on analyzing the relationship between average debt maturity and sovereign risk in different countries and geographical areas. Specifically, the aim of this paper is to analyze this relationship for a sample of EMU countries by using different measures of sovereign risk.
3. Sovereign Risk Proxies
One of the main aspects of analyzing the impact of sovereign risk on the maturity structure of sovereign debt is determining which variables are used to measure the sovereign risk.
In the literature on corporate finance, various proxies are used to measure credit risk. Some studies have used the value obtained from the measure developed by Altman (1968) or the Altman Z (González 2009), whereas others have used the value of the spread between long and short-term bonds (Baker et al. 2003) or the ratings (Mitchell 1993). However, this work focuses on public finance, and although the proxies used in the literature on public finance are different, they share some similarities with those used in the literature on corporate finance.
In the case of sovereign risk, there are various proxies that approximate the value of the credit risk of a country or region. Ratings from rating agencies have been used in several studies (Datta et al. 1999; Remolona et al. 2007). However, the drawback of using ratings is that they are infrequently reviewed and, therefore, show low variability, making the proxy less dynamic for analysis. In addition, Altman and Rijken (2004) indicated that rating agencies focus on a long-term horizon and that they do not take into account short-term movements.
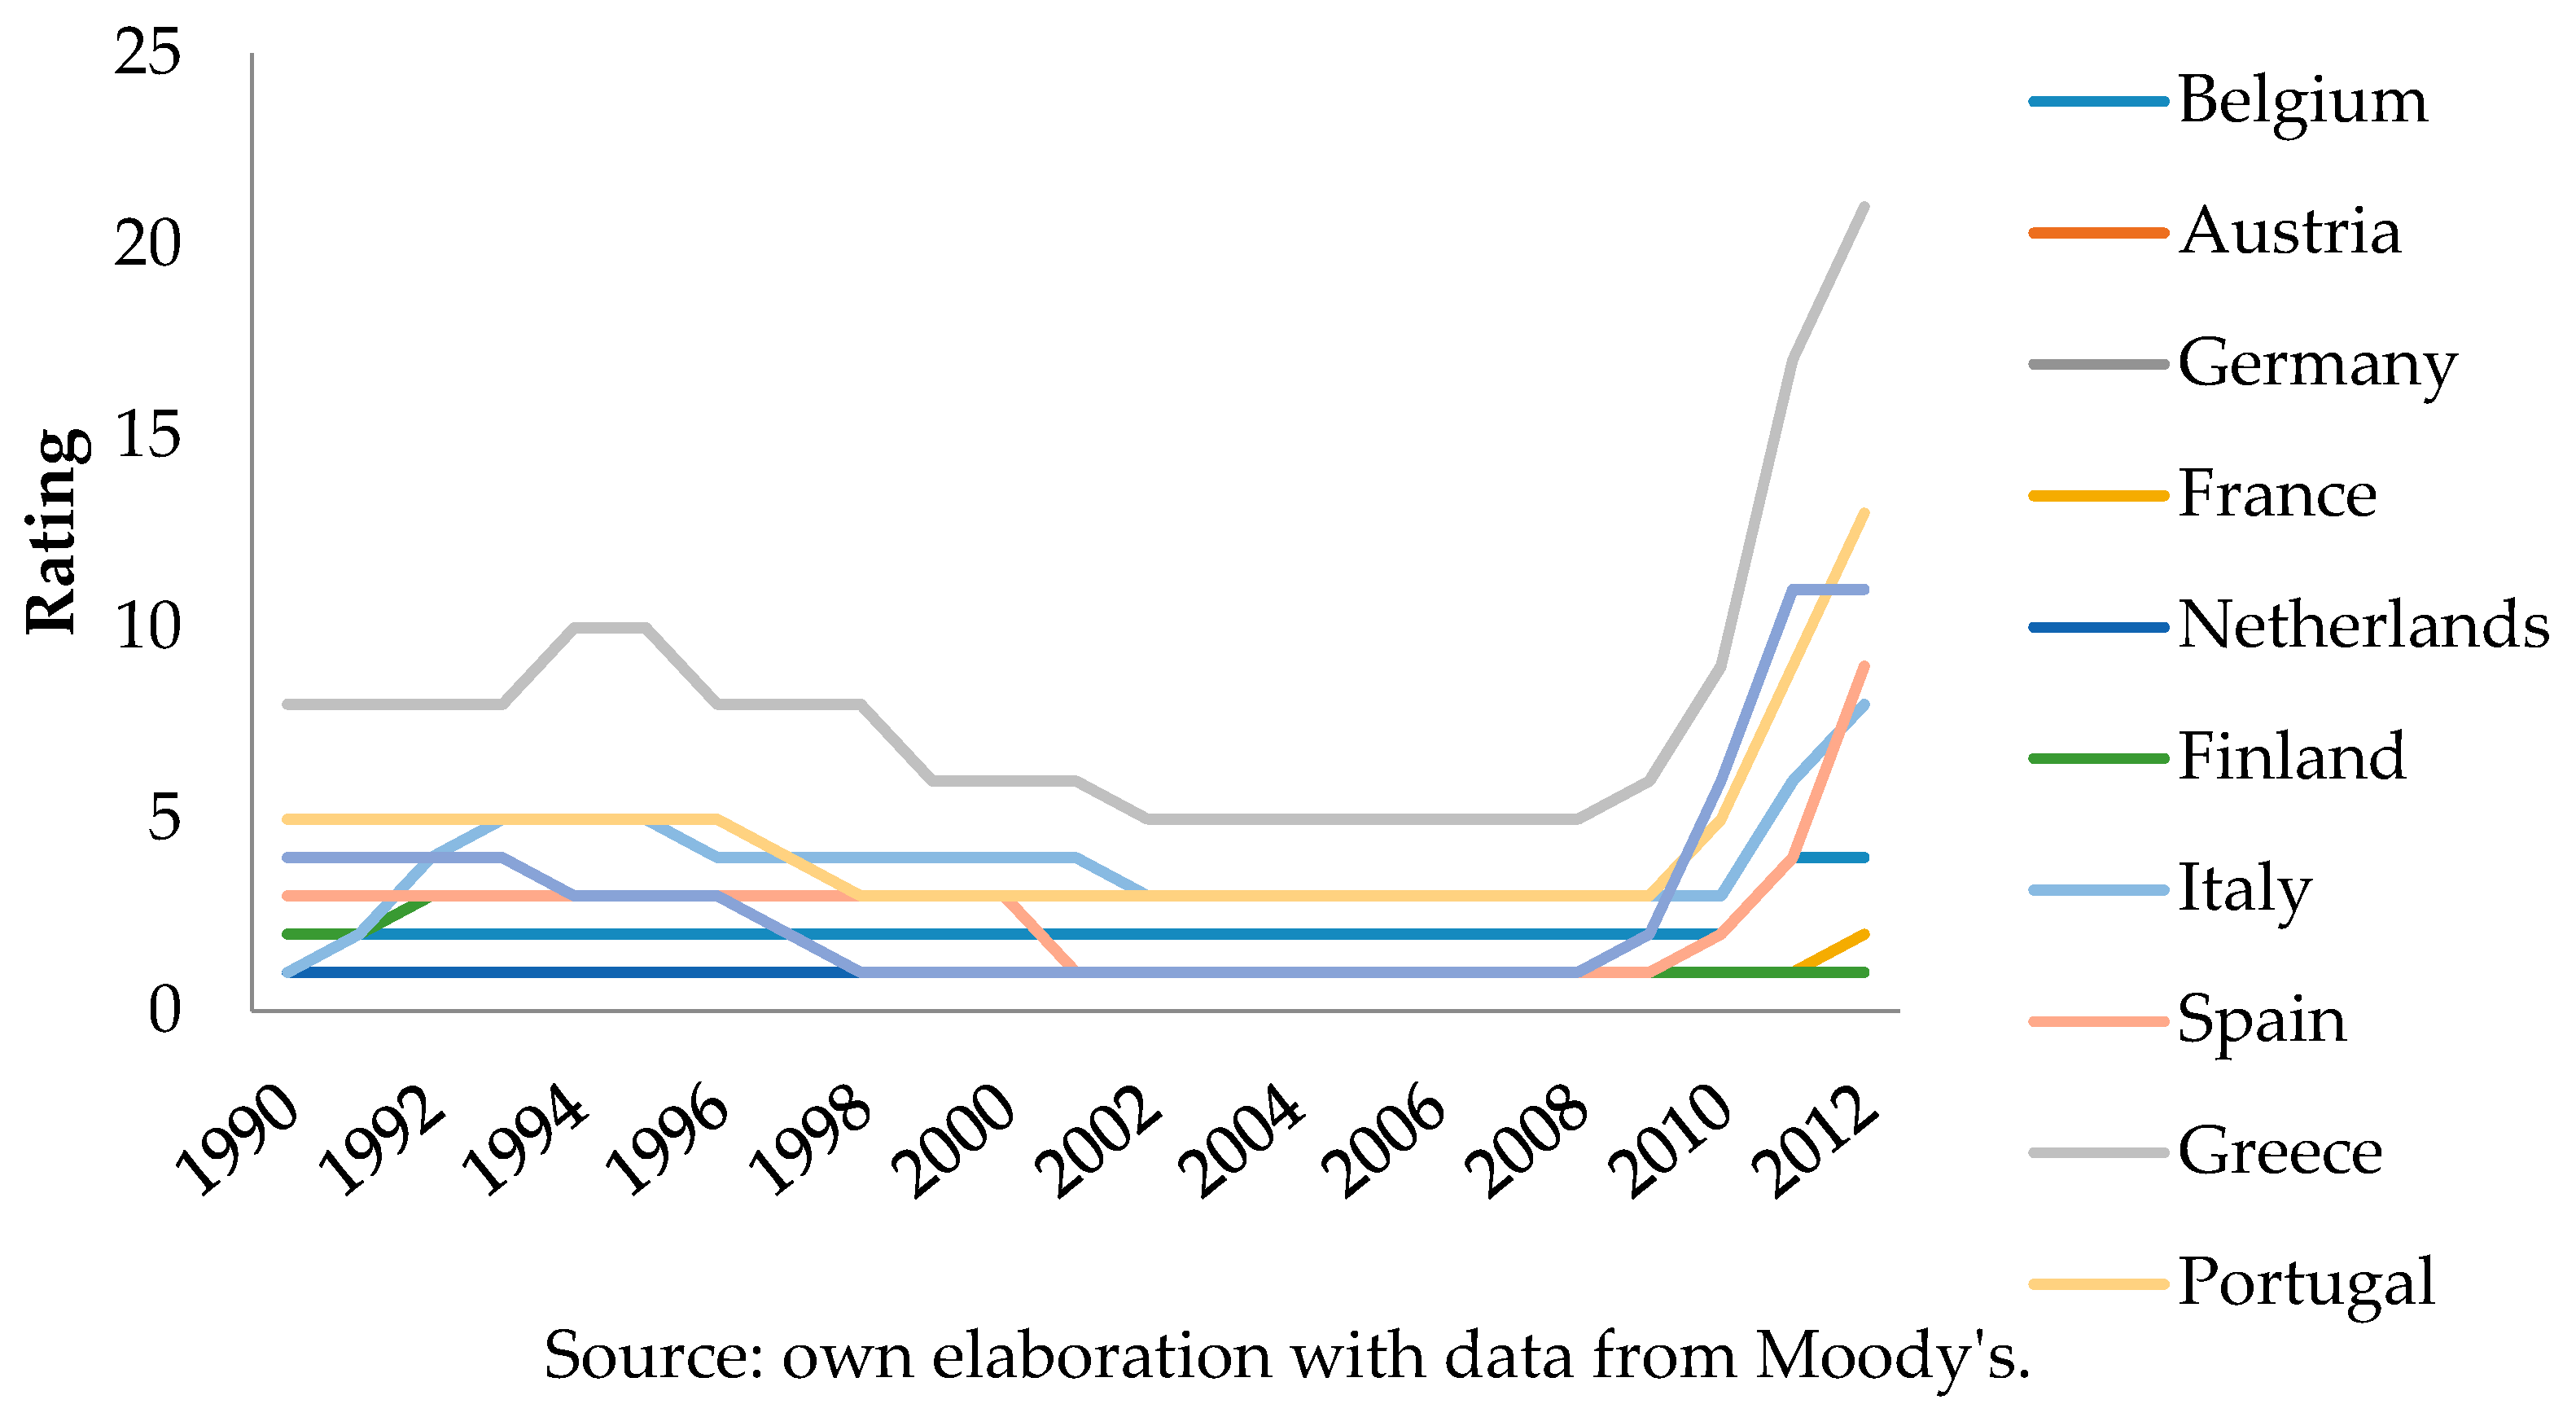
The evolution of the ratings, which are transformed into numerical values5, is shown in Figure 1. The ratings show low variability over the last 20 years for many countries (Germany, Finland and the Netherlands, among others). Moreover, since 2008, peripheral countries show a worsening of their ratings due to the greater perception in the measurement of sovereign risk by rating agencies.
The use of sovereign spreads is also common in the literature (Bayoumi et al. 1995; Bernoth et al. 2012; Ağca and Celasun 2012). Risk premiums represent the difference between the sovereign bond yields of a specific country and a specific maturity relative to a bond with similar characteristics for a country that acts as a benchmark6. Thus, one of the main disadvantages of using spreads is that it is necessary to exclude the benchmark country from the analysis.
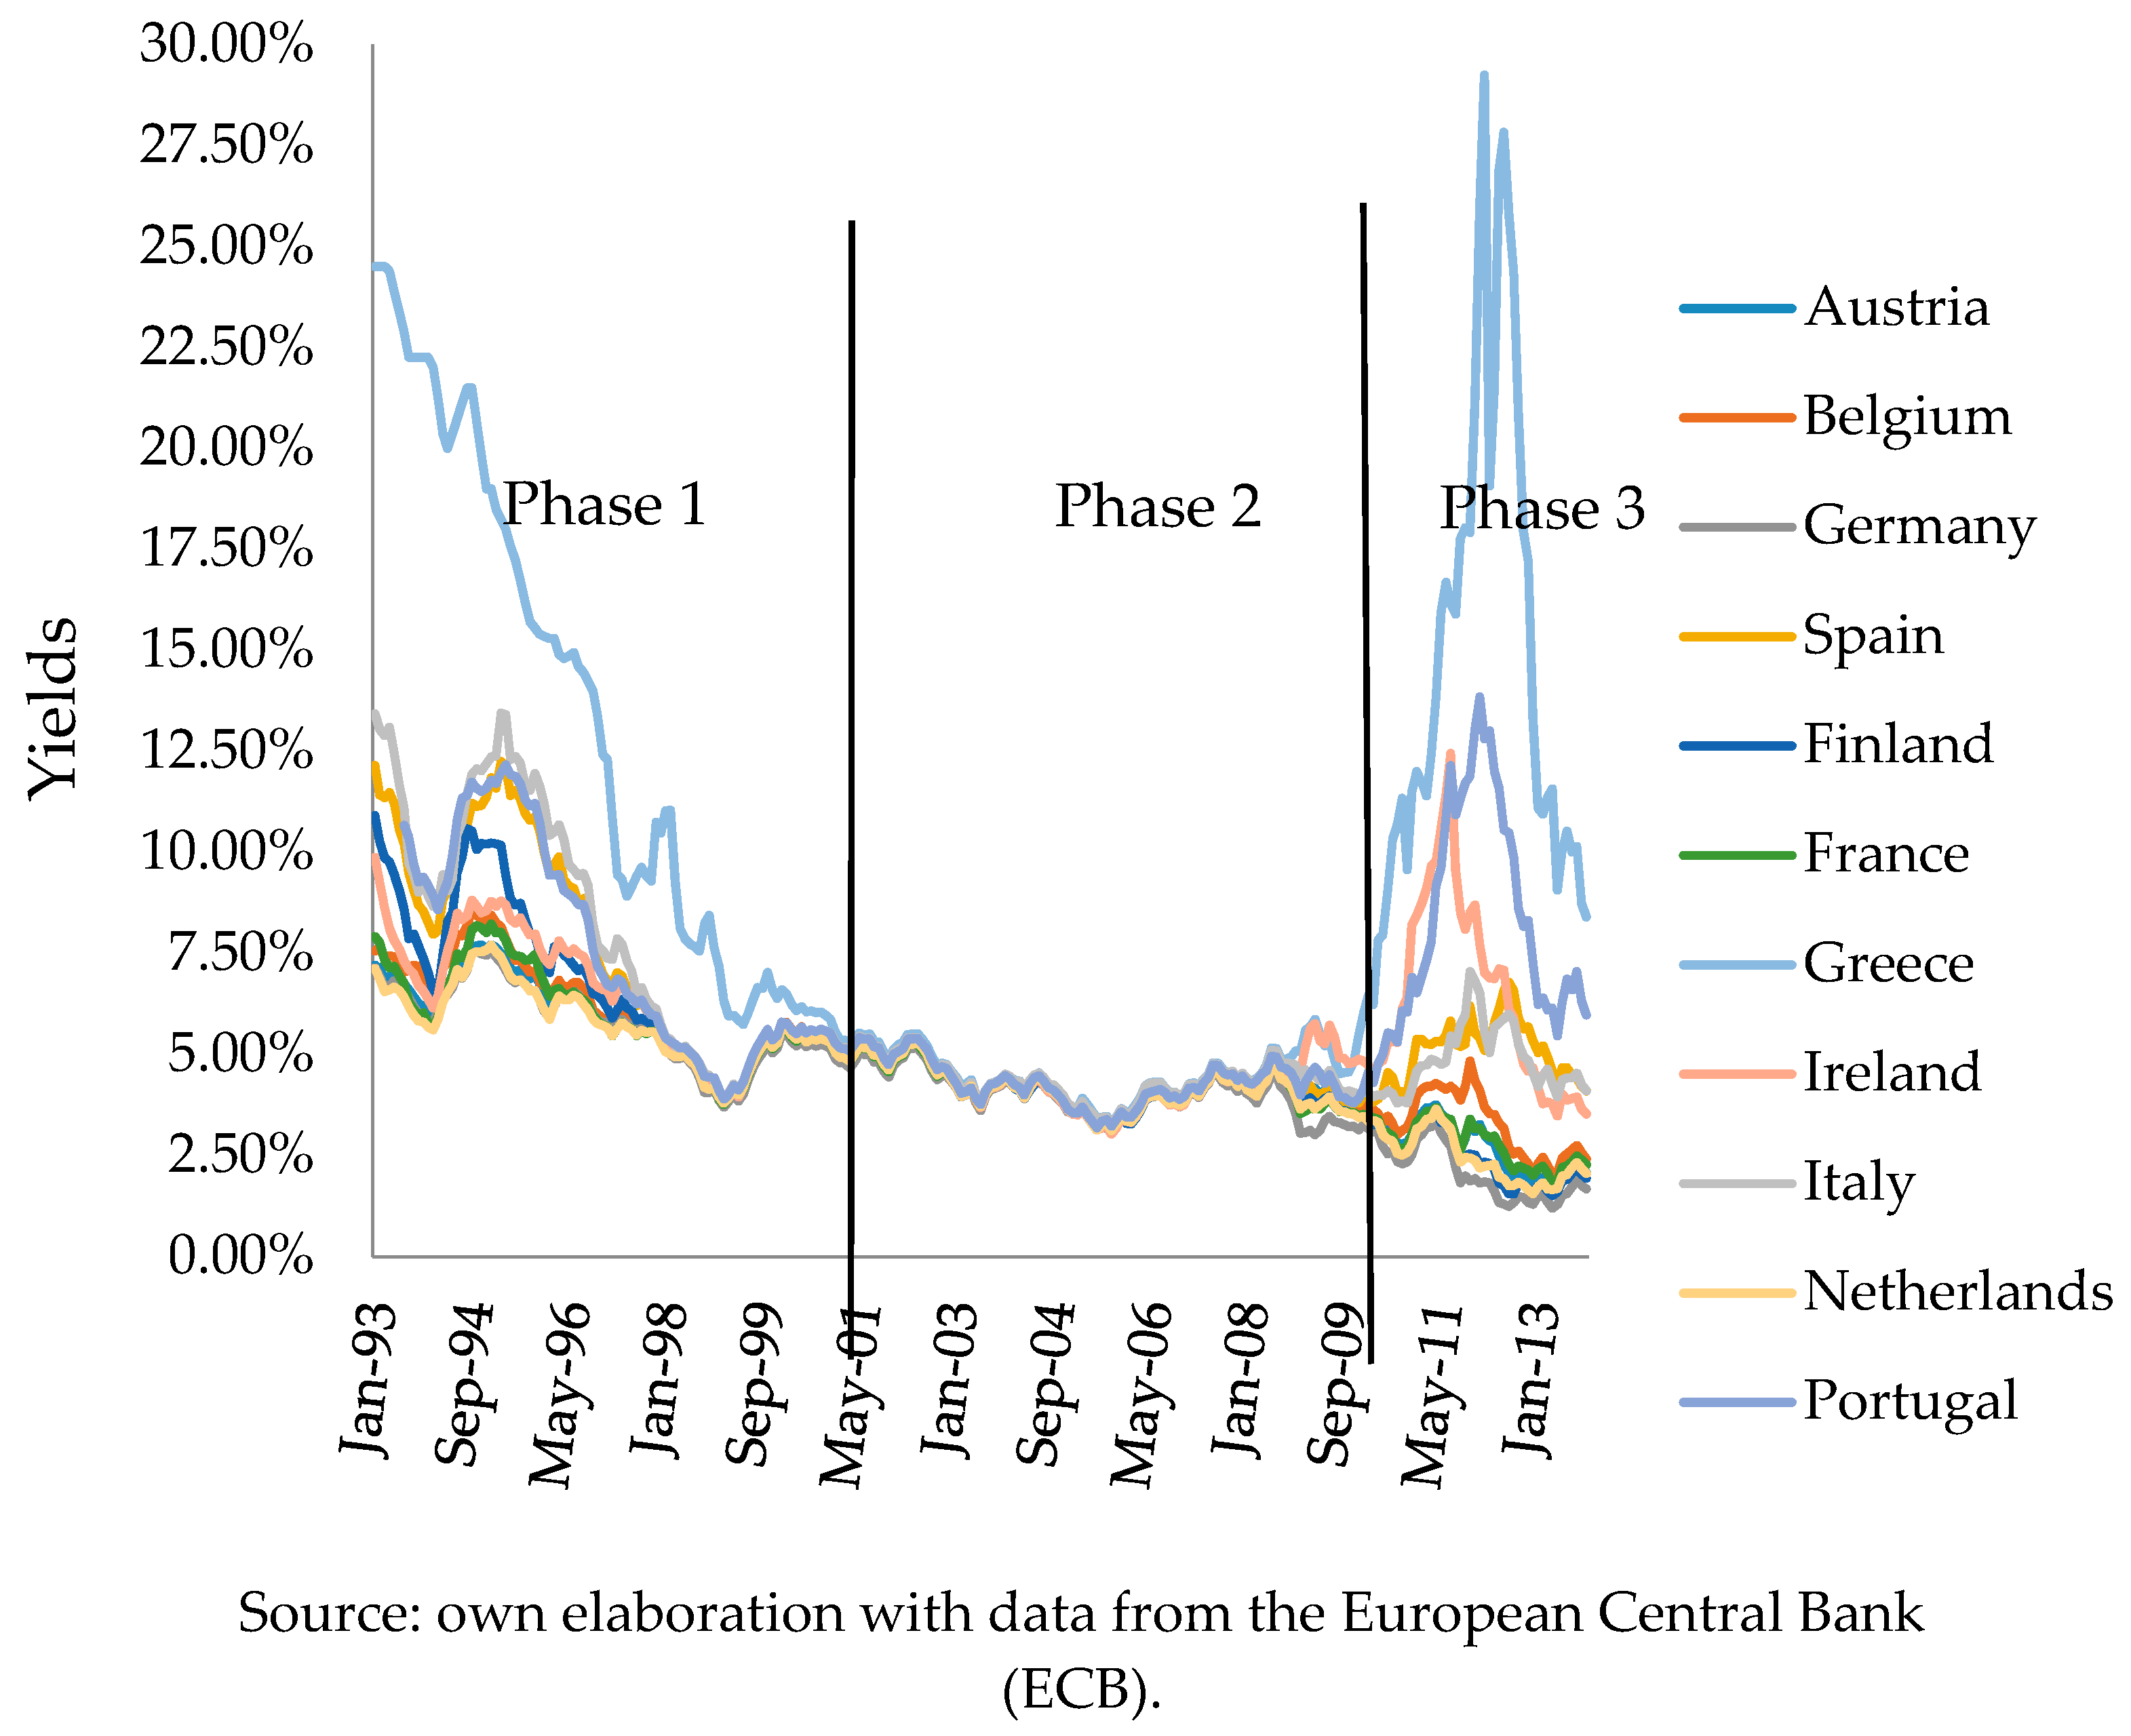
The evolution of the monthly bond yields of the 10-year sovereign bonds for the period between January 1993 and November 2013 for the 11 European countries included in the analysis is shown in Figure 2. We observed three different phases in the evolution of the sovereign yields. The first stage is a convergence phase that extends from the beginning of the time horizon until the end of 2001, coinciding with the start of the third stage of the EMU. At this point, all the countries showed a trend toward convergence, including Greece, which already showed higher yields than the rest of countries. The second phase starts in 2002, showing higher stability with yields of about 5%, and runs until the end of 2007, when the financial turmoil begins. Subsequently, the final phase extends from 2008 to the end of time horizon. At this stage, we can observe a dispersion of the yields, which increase sharply, especially in Greece, Portugal and Ireland, as well as in Italy and Spain, although with less intensity. In other countries, the yields decreased progressively to about 2.5%. The evolution of the spread relative to German bonds, which acts as a benchmark in Europe, shows the same trend that are observed for the yield.
However, in recent years, because of the financial turmoil, credit default swaps (CDSs) are frequently used (Delatte et al. 2012; Arce et al. 2013; Büchel 2013, among others). CDSs are contracts whereby one party ensures the payment compliance of a country’s sovereign bonds in exchange for an amount of money; hence, they resemble a sort of insurance on the probability of default or bankruptcy of a country. CDSs are the most appropriate proxy to analyze sovereign risk, as they are less distorted by the reduction in liquidity and funding that occurred in the financial markets as a result of the financial crisis that began in 2007 (Ejsing and Lemke 2011).
In short, any of these proxies7 can be used to measure or quantify sovereign risk, but each one of them presents advantages and disadvantages. In this paper, we used the spread referenced to the German bond, the spread referenced to the USA bond and the credit rating from Moody’s8 to measure sovereign risk, and we used the 10-year bond sovereign yields to approximate sovereign yields.
4. Hypotheses Formulation
In this section, we will propose the hypotheses to be tested in the study based on the arguments that have been previously discussed and analyzed in the literature and that serve to justify their formulation.
4.1. Relation between Sovereign Risk and Debt Maturity Structure
The first hypothesis concerns the direction of the relationship between the maturity structure of sovereign debt and sovereign bond yields and sovereign risk, regardless of the proxy used to measure risk. Most of the work on this subject has found an inverse relationship between these variables. Broner et al. (2013) reported that, in an environment where borrowers or investors are risk averse, the cost of long-term financing is greater than that of the short-term financing, which produces a term premium. Moreover, economic uncertainty affects this relationship. Boumparis et al. (2017) stated that in the context of the European debt crisis, an increase in economic uncertainty leads to an increase in bond yields. Therefore, in the presence of great uncertainty, risk-averse investors are more prone to invest in short-term debt (Broner et al. 2013), since they face more uncertainty when lending long-term (Perez 2017). If the risk rises, this term premium increases, as long-term bond yields experience a greater increase than those yielded by short-term instruments. The relationship between the measure of sovereign risk and maturity structure is indirect because an increase in the term premium shortens the maturity structure of sovereign debt. Moreover, all these proposed relationships intensify in times of crisis. These arguments are supported by the results of Xie et al. (2009) and Lee et al. (2011), who analyzed the relationship between sovereign risk and duration instead of maturity.
Broner et al. (2013) examined a scenario of risk-averse investors. In this context, sovereign risk is a direct function of time, and therefore, if the risk increases, it leads to a greater uncertainty in long-term investments. In this case, investors tend to protect themselves by choosing shorter maturities for investments and to incorporate term premiums in long-term bonds that leads governments to issue debt with shorter maturities to reduce their cost of funding.
According to the above arguments, we propose the following hypothesis:
Hypothesis 1.
An increase in sovereign bond yields or sovereign risk shortens the maturity structure of sovereign debt.
Under this hypothesis, an increase in the 10-year bond sovereign yields (or in the risk premium) and a downgrade in the sovereign rating leads states to issue more short-term debt and, therefore, to shorten the maturity structure of sovereign debt. Thus, the cost of borrowing is reduced because both the risk and term premium increase to a greater degree with longer bond maturities.
4.2. Diamond’s Model (1991) and Its Application in the Analysis of the Maturity Structure
As indicated in the literature review section, Diamond (1991) established that a non-monotonic relationship exists between credit risk and debt maturity in companies. This means that both variables are related in a different way depending on the level of risk. In companies with a high or low level of risk, an increase in the credit risk shortens the maturity structure. In contrast, companies with an intermediate level of risk resort to long-term funding. Subsequently, several studies have confirmed the existence of this non-monotonic relationship (Barclay and Clifford 1995; Stohs and Mauer 1996; Berger et al. 2005; González 2009, among others). We have transferred this hypothesis from the field of corporate finance to the set of countries analyzed in this study and determined the validity of the non-monotonic hypothesis in the field of public finance.
Therefore, the following hypothesis tests whether a non-monotonic relationship exists between sovereign risk and debt maturity for the countries in our sample, which are divided into two subgroups with different risk levels: on the one hand, peripheral countries, which are the countries that have suffered more strongly from the debt crisis and that show higher risk, and, on the other hand, core countries, which show the lowest risk. According to Diamond (1991), the relationship between sovereign risk and the debt maturity structure has to differ for the two subgroups.
Hypothesis 2.
The relation between sovereign bond yields, sovereign risk and the maturity structure of sovereign debt differs depending on the risk level.
We aimed to determine whether a non-monotonic relationship exists between the main variables of this analysis. Therefore, we distinguished two subgroups with different risk levels. Support for this hypothesis would allow us to transfer the theory of Diamond (1991) from the field of corporate finance to the field of public finance. Thus, in countries with a high risk level, the spread requested by investors in their long-term bonds can make the issuance of such instruments unaffordable. Therefore, the only viable option is short-term debt (Drudi and Giordano 2000). For countries with lower sovereign risk, this inverse relationship between risk and the maturity structure may not be as clear or may not even be a direct relationship. Within this non-monotonic relationship, the risk has an indirect influence in countries with high risk but a negligible or direct influence in countries with low risk.
4.3. Stock of Debt Influence on the Relationship between Sovereign Bond Yields, Sovereign Risk and Debt Maturity
Drudi and Giordano (2000) established that when the stock of debt is very high, the risk premium of long-term bonds may be unsustainable. In this case, governments are forced to issue short-term debt, and the maturity structure of the debt therefore is shortened. These results confirmed the results for a set of OECD (Organization for Economic Cooperation and Development) countries reported by Alesina et al. (1992). They indicated that the indirect relationship between maturity and sovereign risk, measured as the ratio and the difference between yields on public and private debt, is obtained only for highly indebted countries. On the basis of these arguments—and to complete the analysis—we propose the following hypothesis:
Hypothesis 3.
The indebtedness level of the analyzed countries influences the relationship between sovereign bond yields, sovereign risk and the maturity structure of sovereign debt.
This hypothesis attempts to analyze whether the relationship between sovereign risk and debt maturity differs for highly indebted countries.
The hypotheses in the study are shown in Table 1. The first hypothesis concerns the relation between sovereign bond yields, sovereign risk and debt maturity structure. We expect an indirect relationship; i.e., an increase in sovereign risk or in sovereign bond yields is expected to shorten the maturity structure. The second hypothesis attempts to confirm the theory of Diamond (1991), which proposes that a non-monotonic relationship exists between risk and debt maturity. In this sense, with a higher risk level, an inverse relationship exists between the variables, while the relationship is direct for countries with lower risk. The third hypothesis states that the indebtedness level of a country affects the relationship between the variables. It is expected that an inverse relationship exists between risk and maturity for highly indebted countries, while in other countries there is either no relationship (Alesina et al. 1992) or a direct relationship (Drudi and Giordano 2000).
5. Data and Methodology
In this section, we will describe the data and methodology that were used to analyze the relationship between sovereign debt maturity structure and sovereign risk to test the hypotheses. We used data, on an annual basis, for a sample of 11 European countries from the EMU (Germany, Austria, Belgium, Spain, Finland, France, Greece, Netherlands, Italy and Portugal) for the period between 1990 and 2013.
5.1. Data
The variables that were included in the analysis, as well as the data sources are as follows:
- The dependent variable is the ratio of long-term debt to total debt9. The ratio of long-term debt to total debt allows us to analyze the impact of sovereign risk on the maturity structure of sovereign debt. The data for this variable were obtained from the European Central Bank Statistical Data Warehouse, which collects data from the European System of Central Banks (ESCB), Eurostat and national central banks. This ratio represents the volume of long-term debt from all sectors of the economy to the total debt10.
- We included the average maturity of sovereign debt as the main determinant of the sovereign debt maturity structure. This variable represents residual maturity of sovereign debt expressed in years. The data were obtained from the European Central Bank Statistical Data Warehouse. We considered the following control variables as determinants of sovereign debt maturity structure:
- ▪
- Inflation (Missale and Blanchard 1994; Goudswaard 1990; De Haan et al. 1995): This variable was expressed as the increase compared to the previous period. It is expected that the coefficient for this variable has a negative sign because higher inflation increases uncertainty about the long-term bonds. This uncertainty generates a trend toward investing in short-term maturities. The data were obtained from the European Central Bank Statistical Data Warehouse.
- ▪
- Gross Domestic Product (GDP): This variable was used as a proxy for the business cycle (Goudswaard 1990) and to control the size of the economy. It is expected that an increase in GDP leads to an increase in the debt maturity and therefore a lengthening of the maturity structure. The data were obtained from the Eurostat Statistics Database.
- ▪
- Debt/GDP ratio (Missale and Blanchard 1994; De Haan et al. 1995; Bodnaruk 1999): Data for this variable were obtained from European Central Bank Statistical Data Warehouse11.
- ▪
- Borrowing requirements of the public administration: the borrowing requirement covers all financial transactions in government debt instruments. The data were obtained from European Central Bank Statistical Data Warehouse.
The correlations between the dependent and explanatory variables are showed in Table 2.
To analyze sovereign bond yields, sovereign risk and their relationship with maturity structure, we have selected the following variables:
- Annual 10-year sovereign bond yields: This proxy was calculated as the average of the monthly bond yields published in the European Central Bank Statistical Data Warehouse. A high value of returns is generally indicative of greater sovereign risk; therefore, we expect to find a negative relationship with the ratio of long-term debt to total debt.
- Spreads (Broner et al. 2013; Perez 2017): This proxy allowed us to measure the default risk of a country. Spreads were calculated as the difference between the 10-year sovereign bond yields and German bond yields of the same maturity, which were both obtained from European Central Bank Statistical Data Warehouse. We also used risk premiums relative to 10-year U.S. bonds (Bernoth et al. 2012) to include Germany in the study and as a robustness test. Data for U.S. bond yields were obtained from the database of the Federal Reserve Bank of St. Louis. A high spread indicates greater risk, and therefore, the expected sign for this variable is negative.
- Sovereign Ratings: We constructed a numerical variable to approximate the Moody’s agency ratings (Remolona et al. 2007). The scale assigned a greater score to ratings with higher risk; therefore, the sign of this variable is expected to coincide with the sign of the rest of sovereign risk proxies. We assigned a value of 1 to the rating Aaa, a value of 2 to Aa1 and so on12. The results are depicted in Figure 1. However, ratings have the disadvantage that their variability is not very high, as they are not frequently reviewed by rating agencies. We expect to find an inverse relation between this proxy and the maturity structure of sovereign debt, as with the other proxies for sovereign risk.
5.2. Methodology
The management of maturity structure of the different countries in the sample depends on their national contexts. For this reason, the results were not homogeneous for all countries; rather, they were conditioned by the circumstances of each state and its institutions, as well as their particular characteristics.
In this sense, every country had its own structural features that modify their maturity structure. Therefore, we considered the econometric panel data technique to suit the available data well and to allow us to determine whether there are differences between the countries included in the sample. Specifically, we considered a data set that includes 11 countries and 24 year periods to analyze the relationship between sovereign bond yields, sovereign risk and debt maturity according to the following equation:
where the subscripts i and t represent individuals and analysis periods, respectively. The dependent variable in the equation is the ratio of long-term debt to total debt (LTDebt/TDebt). AMit represents average maturity, Xit is a vector that represents the control variables included in the study as determinants of the maturity structure, Riskit represents the different proxies for sovereign risk, and its analysis is the fundamental objective of the study to draw conclusions about their relationships with the dependent variables. Finally, represents country fixed effects, δt shows time fixed effects and is the error term.
One aspect to consider in panel data methodology is the choice between fixed or random effects for the coefficient estimates. In the fixed effects model, is treated as another parameter regression, whereas the random effects model considers it to be part of the random disturbance. For this purpose, we used the Hausman (1978), which established as a null hypothesis that the individual effects of each country are not correlated with the other explanatory variables and, therefore, that the random effects model is appropriate. The rejection of the null hypothesis indicates that the fixed effects estimation is the most consistent13.
To analyze the relationship between sovereign risk and maturity according to the risk level of the country in order to detect a non-monotonic relationship, the sample has been split into two subgroups: on the one hand, countries with high risk (PIIGS) and low risk countries (core countries) on the other hand. Although intuitively and according to previous figures it is clear which countries are at more or less risk, we have run tests of differences in means and medians by using the Wilcoxon rank-sum test (Wilcoxon 1945; Mann and Whitney 1947) and the K-sample equality-of-medians test, respectively. These non-parametric tests14 for independent samples allowed us to determine whether there are differences between the groups according to the risk level. Thus, we tested whether subgroups are heterogeneous with respect to each other. Specifically, we used spreads to test whether differences exist between low and high risk countries.
6. Results and Discussion
In this section, we will present and discuss the results of the analysis. Namely, we will show the estimates of the relationship between sovereign bond yields, sovereign risk and the maturity structure of sovereign debt, as well as the results regarding these relations are the non-monotonic according to the risk and the indebtedness level.
6.1. Sovereign Bond Yields, Sovereign Risk and Maturity Structure
The first hypotheses proposed that a relationship exists between sovereign bond yields, sovereign risk and maturity structure, i.e., how debt maturities are managed by country authorities. The evolution of the average ratios of short and long-term debt to total debt shows an upward trend in long-term debt, which coincides with the period of convergence of bond yields. Subsequently, the ratio of long-term debt to total debt showed a period of stability that ends in 2007 with the outbreak of the financial crisis. The ratio of long-term debt to total debt reduced until 2010, after which it began to increase gradually. Similarly, a reduction in the volume of long-term debt was observed starting in 2007 as a result of the financial turmoil.
The main results of the analysis between the maturity structure and sovereign bond yields and sovereign risk are presented in Table 3.
We used the following control variables in all models: inflation, GDP and debt/GDP ratio. These variables were used in the literature (Goudswaard 1990; Missale and Blanchard 1994; De Haan et al. 1995; Bodnaruk 1999). We also added the average maturity of sovereign debt and the borrowing requirements of the public administration as explanatory variables. The explanatory variables: average maturity of sovereign debt and the borrowing requirements of the public administration show statically significant coefficients with the expected sign, and they seem to be the control variables that affected the maturity structure strongest.
Regarding the relationship between maturity structure and sovereign bond yields, an inverse relationship was found between 10-year bond yields and the maturity structure of sovereign debt. Subsequently, we used spreads relative to German bonds (Spread) and to U.S. bonds (Spread USA) as measures of sovereign risk. We found that the correlation between all variables that approximate sovereign risk and the maturity structure of debt was indirect and significant.
The signs of both the sovereign bond yields and the rest of sovereign risk variables are as expected. These results indicate that an increase in risk causes a decrease in the ratio of long-term debt to total debt. Therefore, the maturity structure of sovereign debt shortens with higher yields and higher risk, thus confirming hypothesis H1.
6.2. Robustness Tests
To ensure that the relationship between sovereign bond yields, sovereign risk and maturity structure remained robust, we ran different analyses to control the effects of different variables. In Table 4, we controlled for the time variability of the data. For this purpose we included time dummy variables and a time trend. In this way, we were able to control for temporal variation in our dependent variable16. We also added a time trend to capture the effect of the passage of time rather than control for a particular period.
The results show that the inverse relationship between sovereign bonds yields, sovereign risk and the maturity structure remains significant regardless of the temporal variation and the time trend. Therefore, the results are robust to the time variance and allowed us to confirm that an increase in the sovereign bond yields or risk premiums shortens the maturity structure of sovereign debt.
We also controlled for the international risk aversion and for the long-term refinancing operations (LTROs). The latter are three months liquidity providing operations that attempt to provide funds to the financial sector in the Euro area. To control for the international risk aversion, we used the S&P volatility index (VIX), and to control for the LTROs, we used the total annual allotted amount in logs. The results were quite striking, and they are shown in Table 5. We observed that the coefficients for the variables that approximate sovereign risk, including sovereign bond yields, lost their significance, and the coefficient for the LTROs was highly significant in the three models.
The results indicate that the effect of sovereign risk on the maturity structure disappear when we take into account the effect of the LTROs. The explanation for this result is that the financial sector obtains funds at a very low interest rate that are mostly used to buy sovereign debt at short maturities to obtain a profit in the operation. This operation relieves pressure on sovereign debt, and the effect of sovereign risk on debt maturity disappears. At the same time, these large LTROs, which have been particularly important after the financial crisis, lead to a shortening of the maturity structure of sovereign debt. Therefore, on the one hand, the LTROs served to alleviate the pressure of the sovereign risk premiums, but on the other hand, they shortened the maturity structure of sovereign debt, which can be harmful in the context of a debt crisis, even when the expansion of maturity is essential to reduce the risk of a crisis of these characteristics (Cole and Kehoe 2000).
In short, we have found evidence that an inverse relationship exists between sovereign bond yields, sovereign risk and the maturity structure of sovereign debt. This inverse relationship remained robust regardless of the temporal variance of the data, which allows us to confirm our first hypotheses. Nevertheless, the LTROs seem to have a more important effect on debt maturity than sovereign risk does.
6.3. Analysis of the Non-Monotonic Relation between Sovereign Bond Yields, Sovereign Risk and Maturity Structure
One objective of the study was to test whether there was a non-monotonic relationship between maturity structure and sovereign risk, which Diamond (1991) explained based on the existence of different relationships between these variables depending on the level of credit risk. To analyze this non-monotonic relationship in this study, we split the sample into two subgroups: the first one included peripheral countries, which are the countries in the Euro area with high risk, and the other one included core countries, which are the countries with a lower risk level.
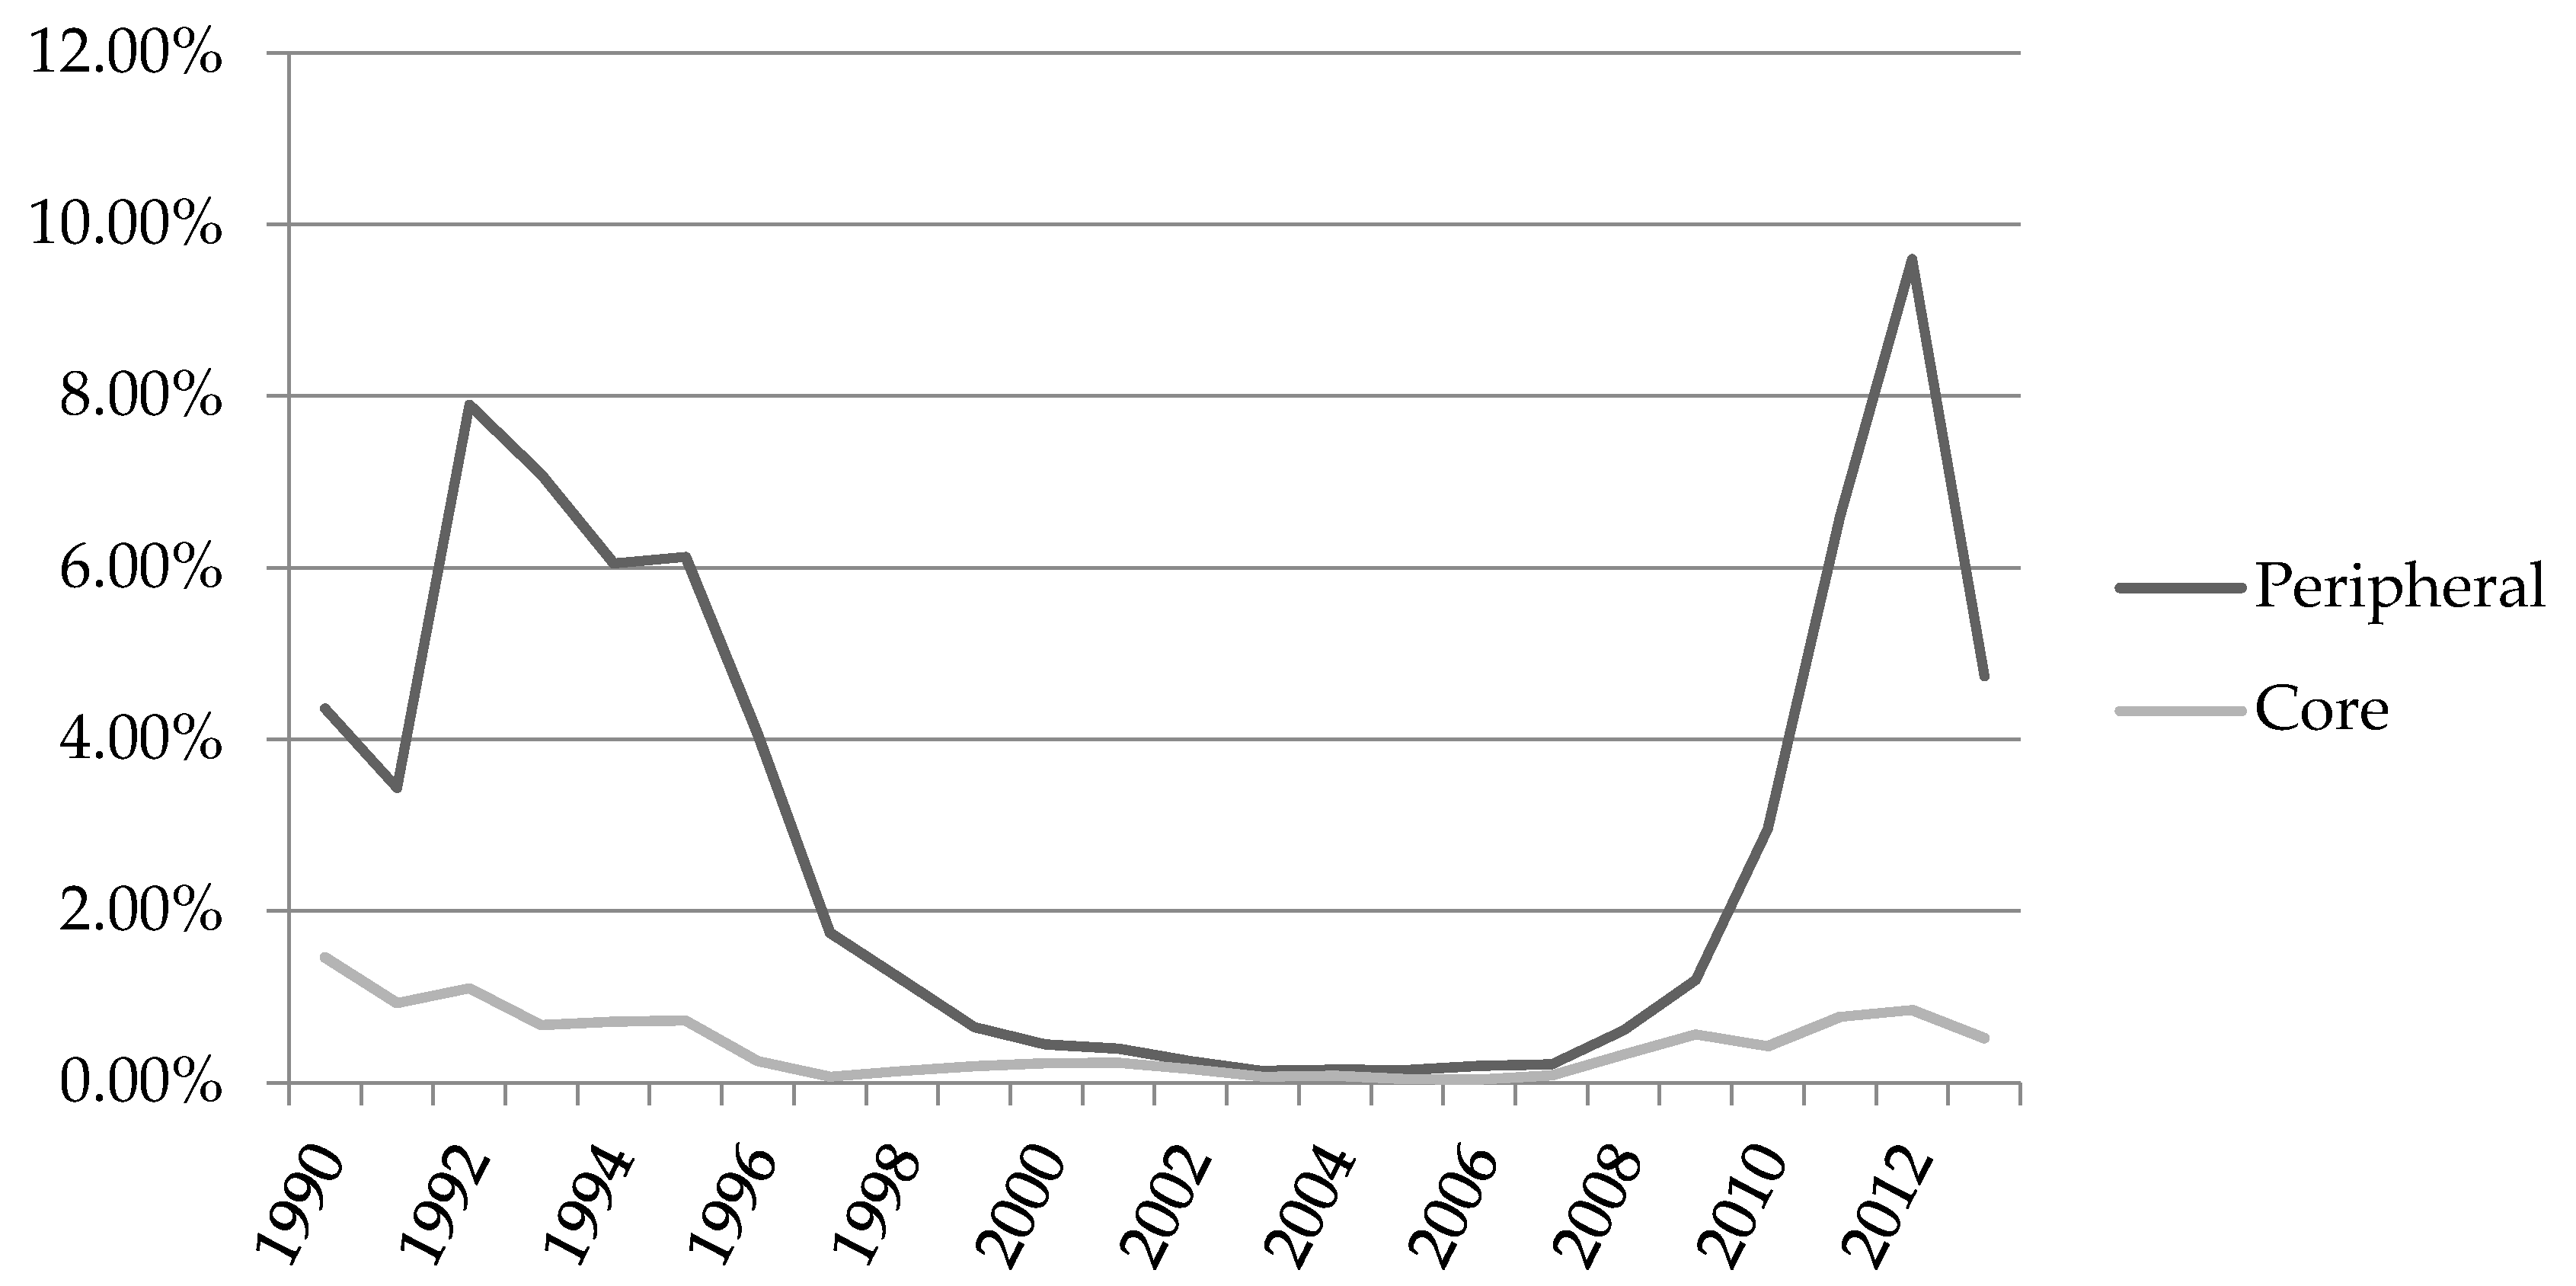
The annual evolution of the mean values of the sovereign spreads for the two subgroups of countries is presented in Figure 3. Peripheral countries showed great divergence from the core countries in the pre-Euro period and during the financial crisis stage. To verify this division of countries, we ran tests of differences in means and medians for the two subgroups (Table 6). These tests sought to determine whether the population means or medians are equal, which was the null hypothesis. If the null is rejected, we can assume that there are significant differences between the groups.
We obtained evidence of significant differences between the subgroups (i.e., peripheral and core countries), as the results of both the mean and median difference tests are statistically significant. Once we had verified the division of the sample, we proceeded to perform the panel data estimates for each of the subgroups (Table 7).
For this purpose, we used various interactions between the sovereign bond yields, the sovereign risk and a dummy variable that distinguish between peripheral and core countries. Namely, the variable taken was equal to one for peripheral countries, and zero otherwise.
The results show that only the interaction between sovereign bond yields and the dummy variable that captures the different effects between peripheral and core countries is significant and with the expected sign. By contrast, the coefficients for the spread on the German bond and the spread on the USA bond lose their significance and seem to be captured by the dummy variable. This result indicates that it is not the risk itself that influences maturity structure but whether we are considering a peripheral country or not.
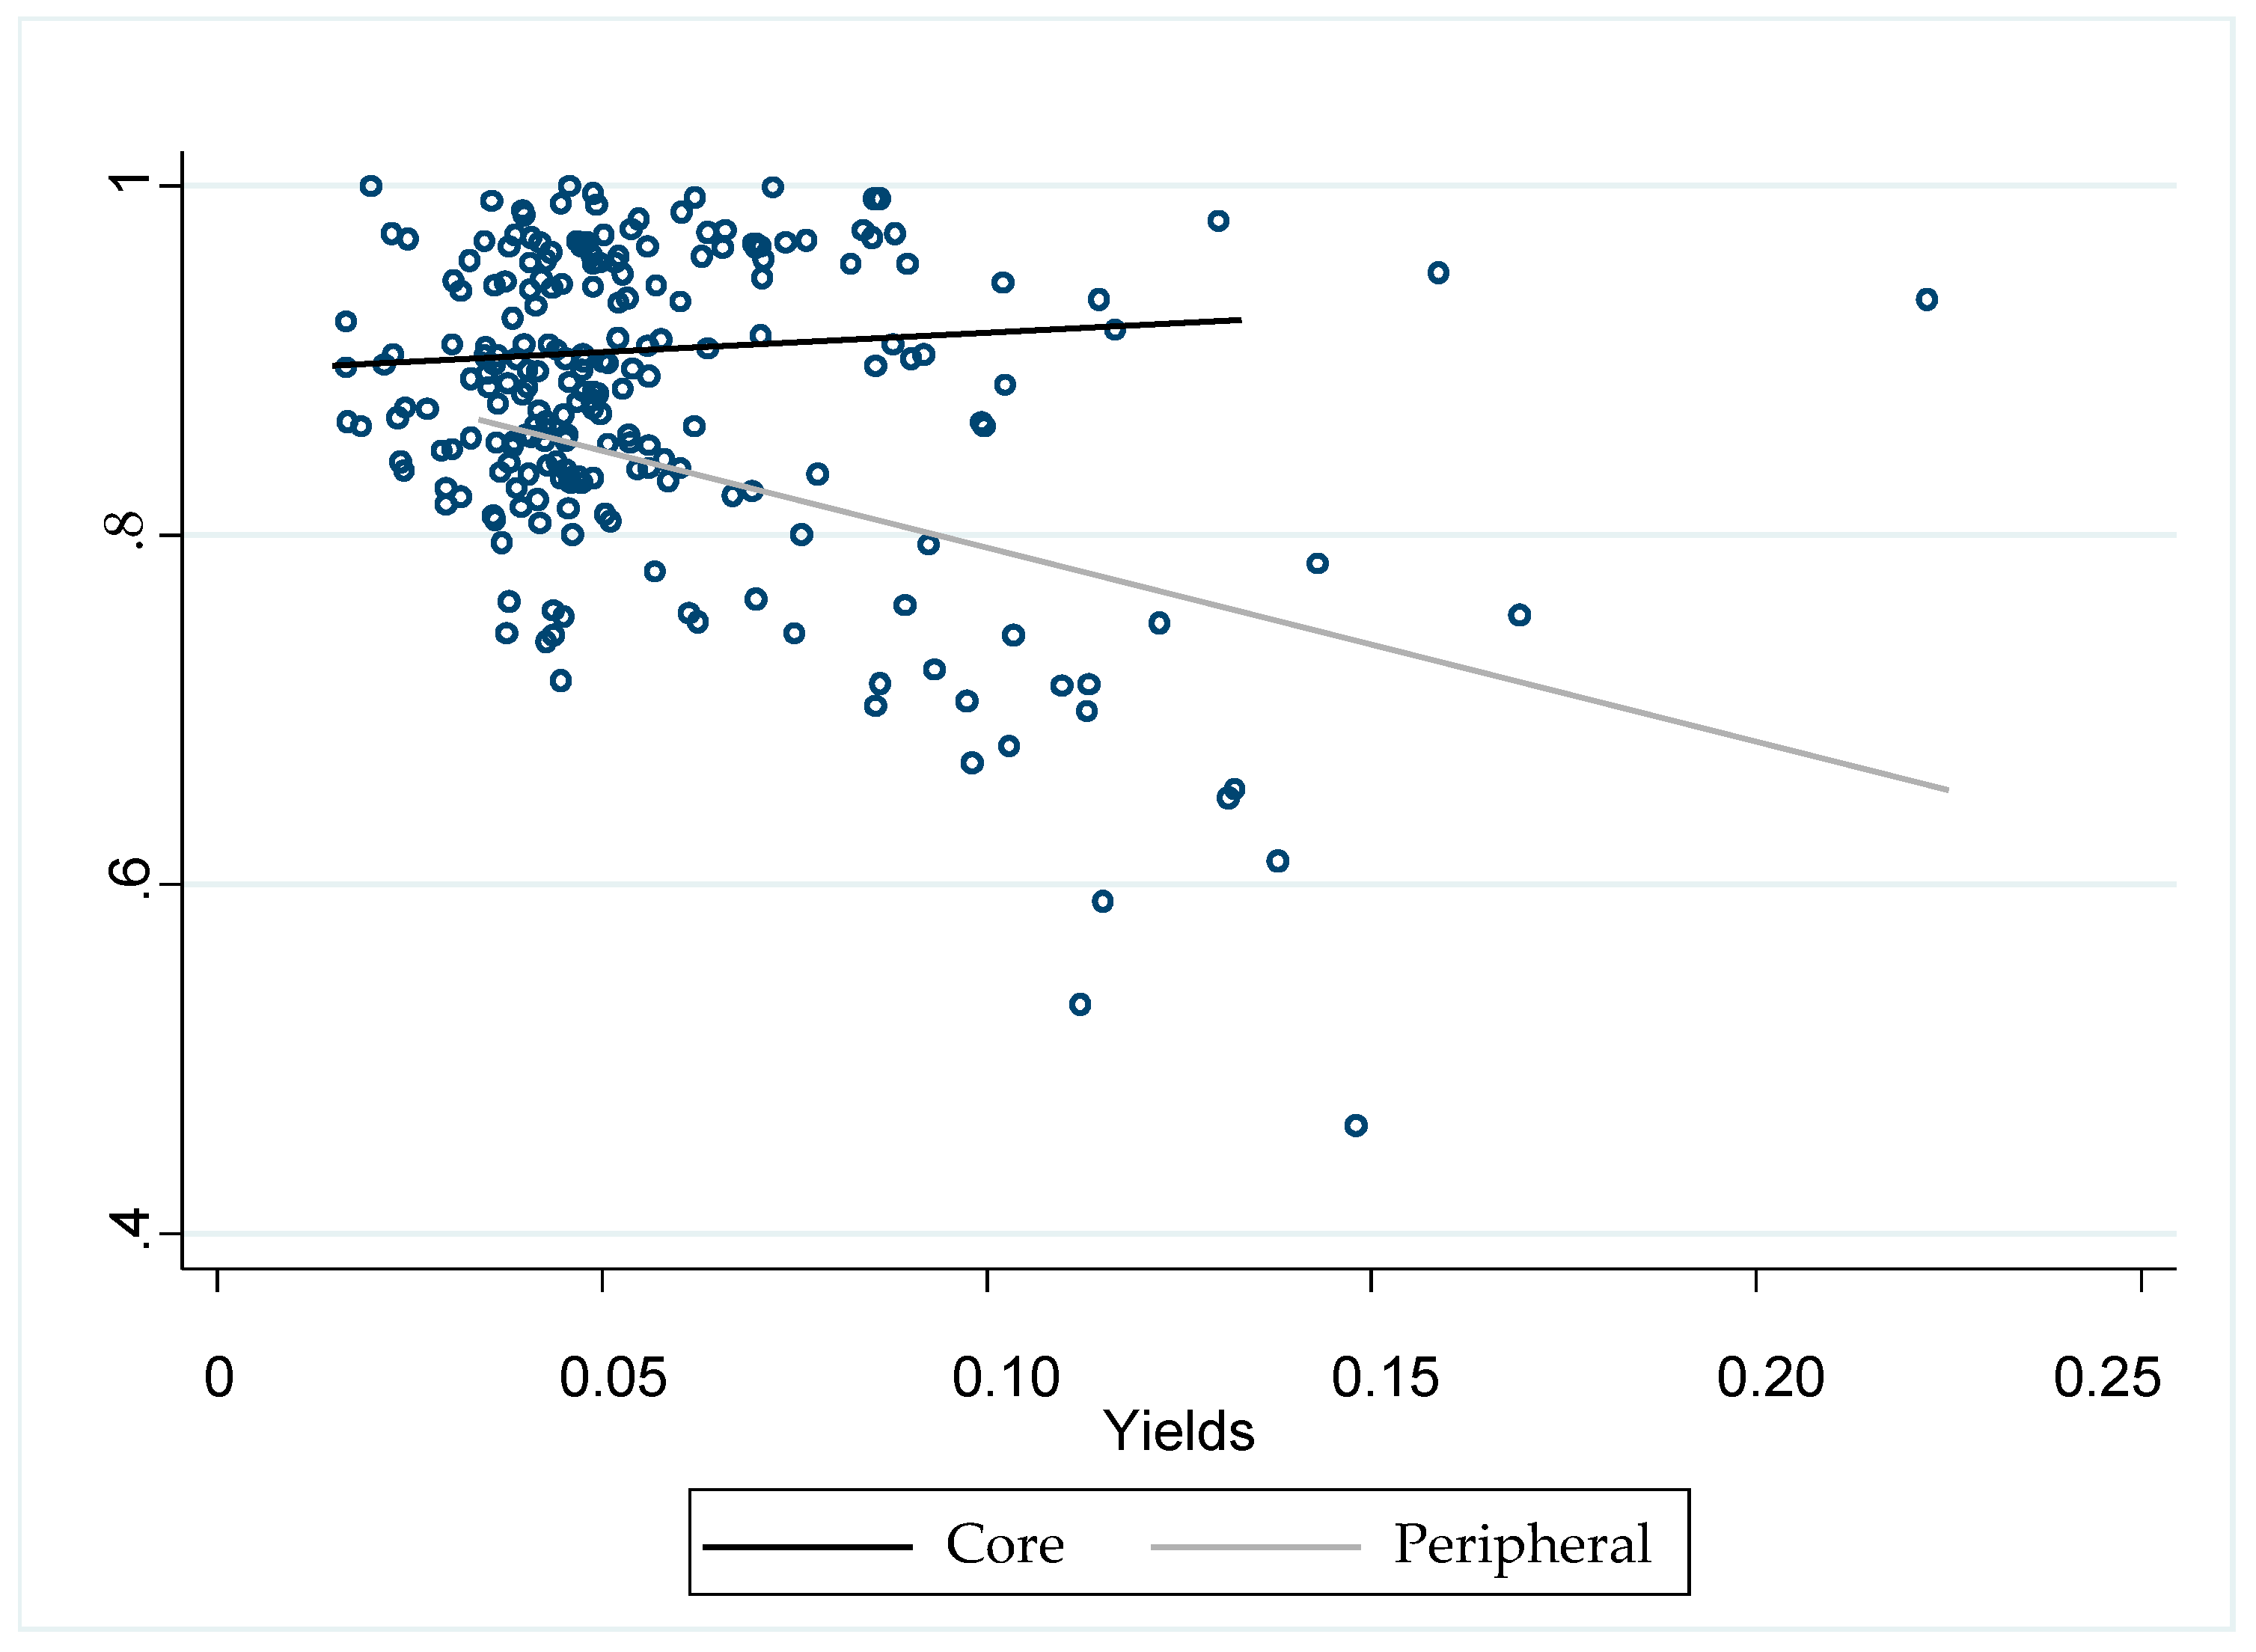
Regarding the sovereign bond yields and according to the results we observed that there exists a different relationship between the variables depending on the group of countries we are analyzing. In Figure 4, we can observe that the slopes for these subgroups of countries are different. For the peripheral countries, the graph shows a negative slope, indicating that for this subgroup an increase in sovereign yields shortens the maturity structure of sovereign debt. By contrast, for the core countries, the slope is slightly positive.
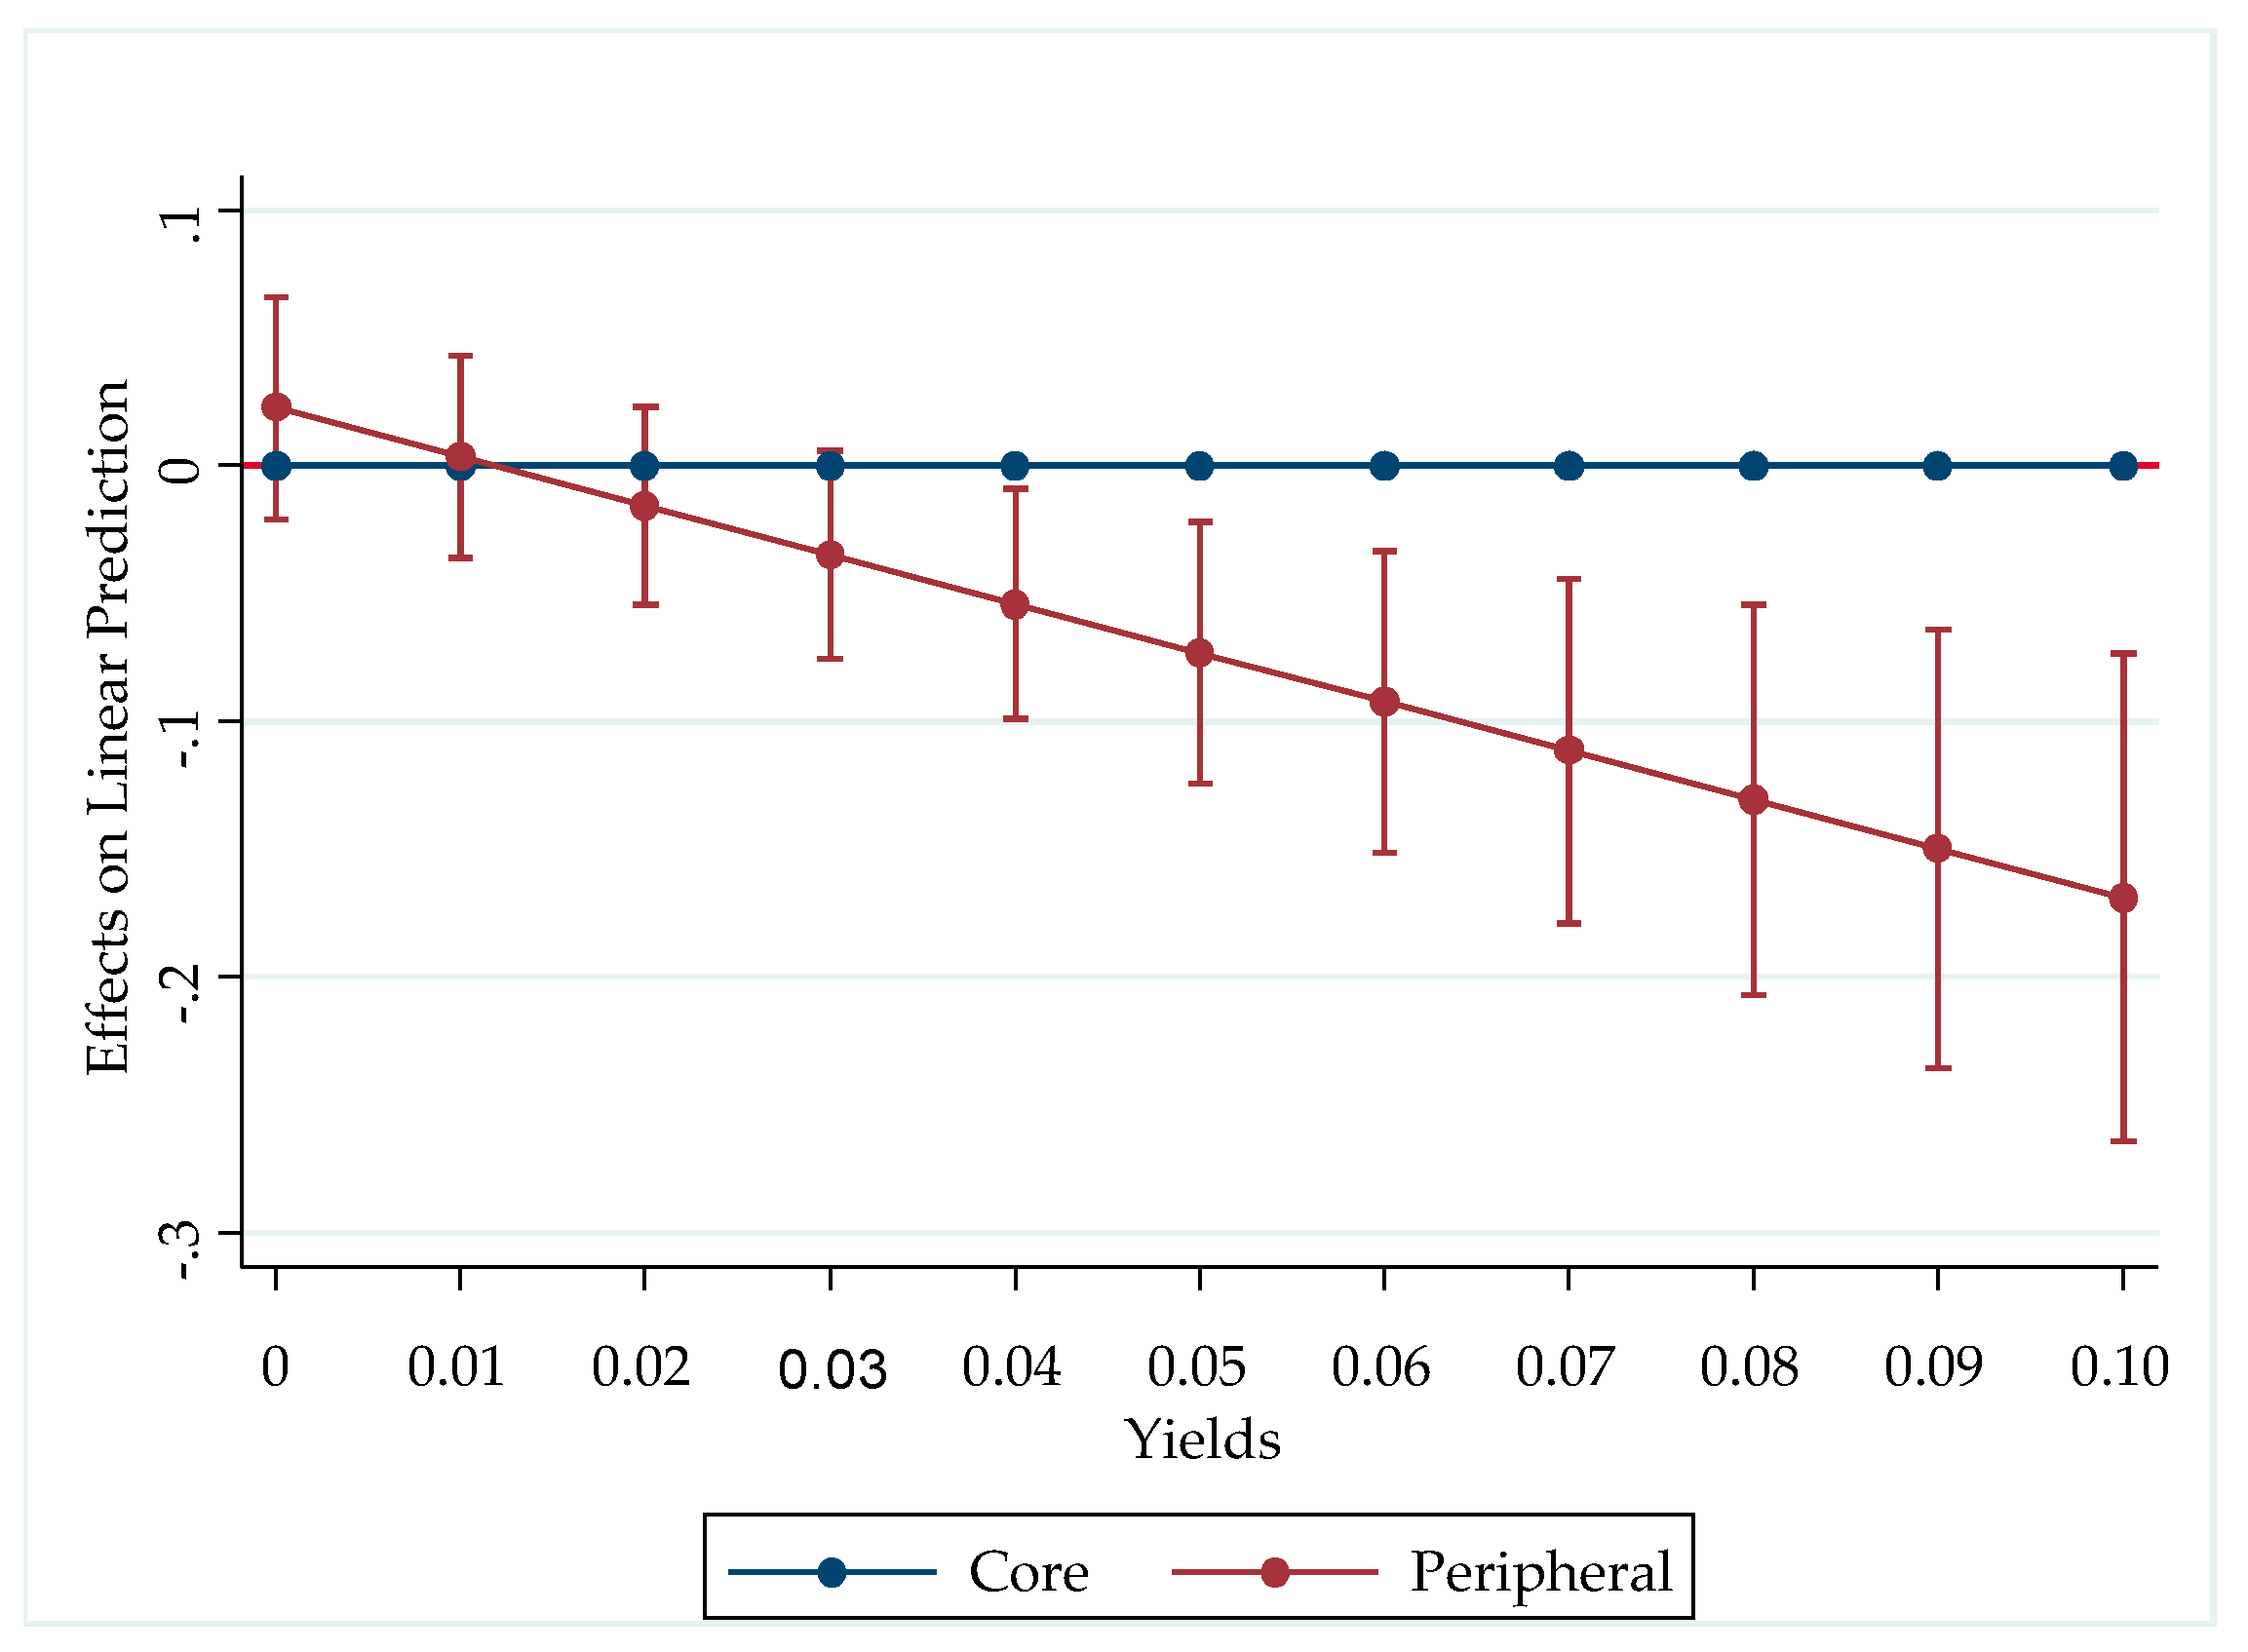
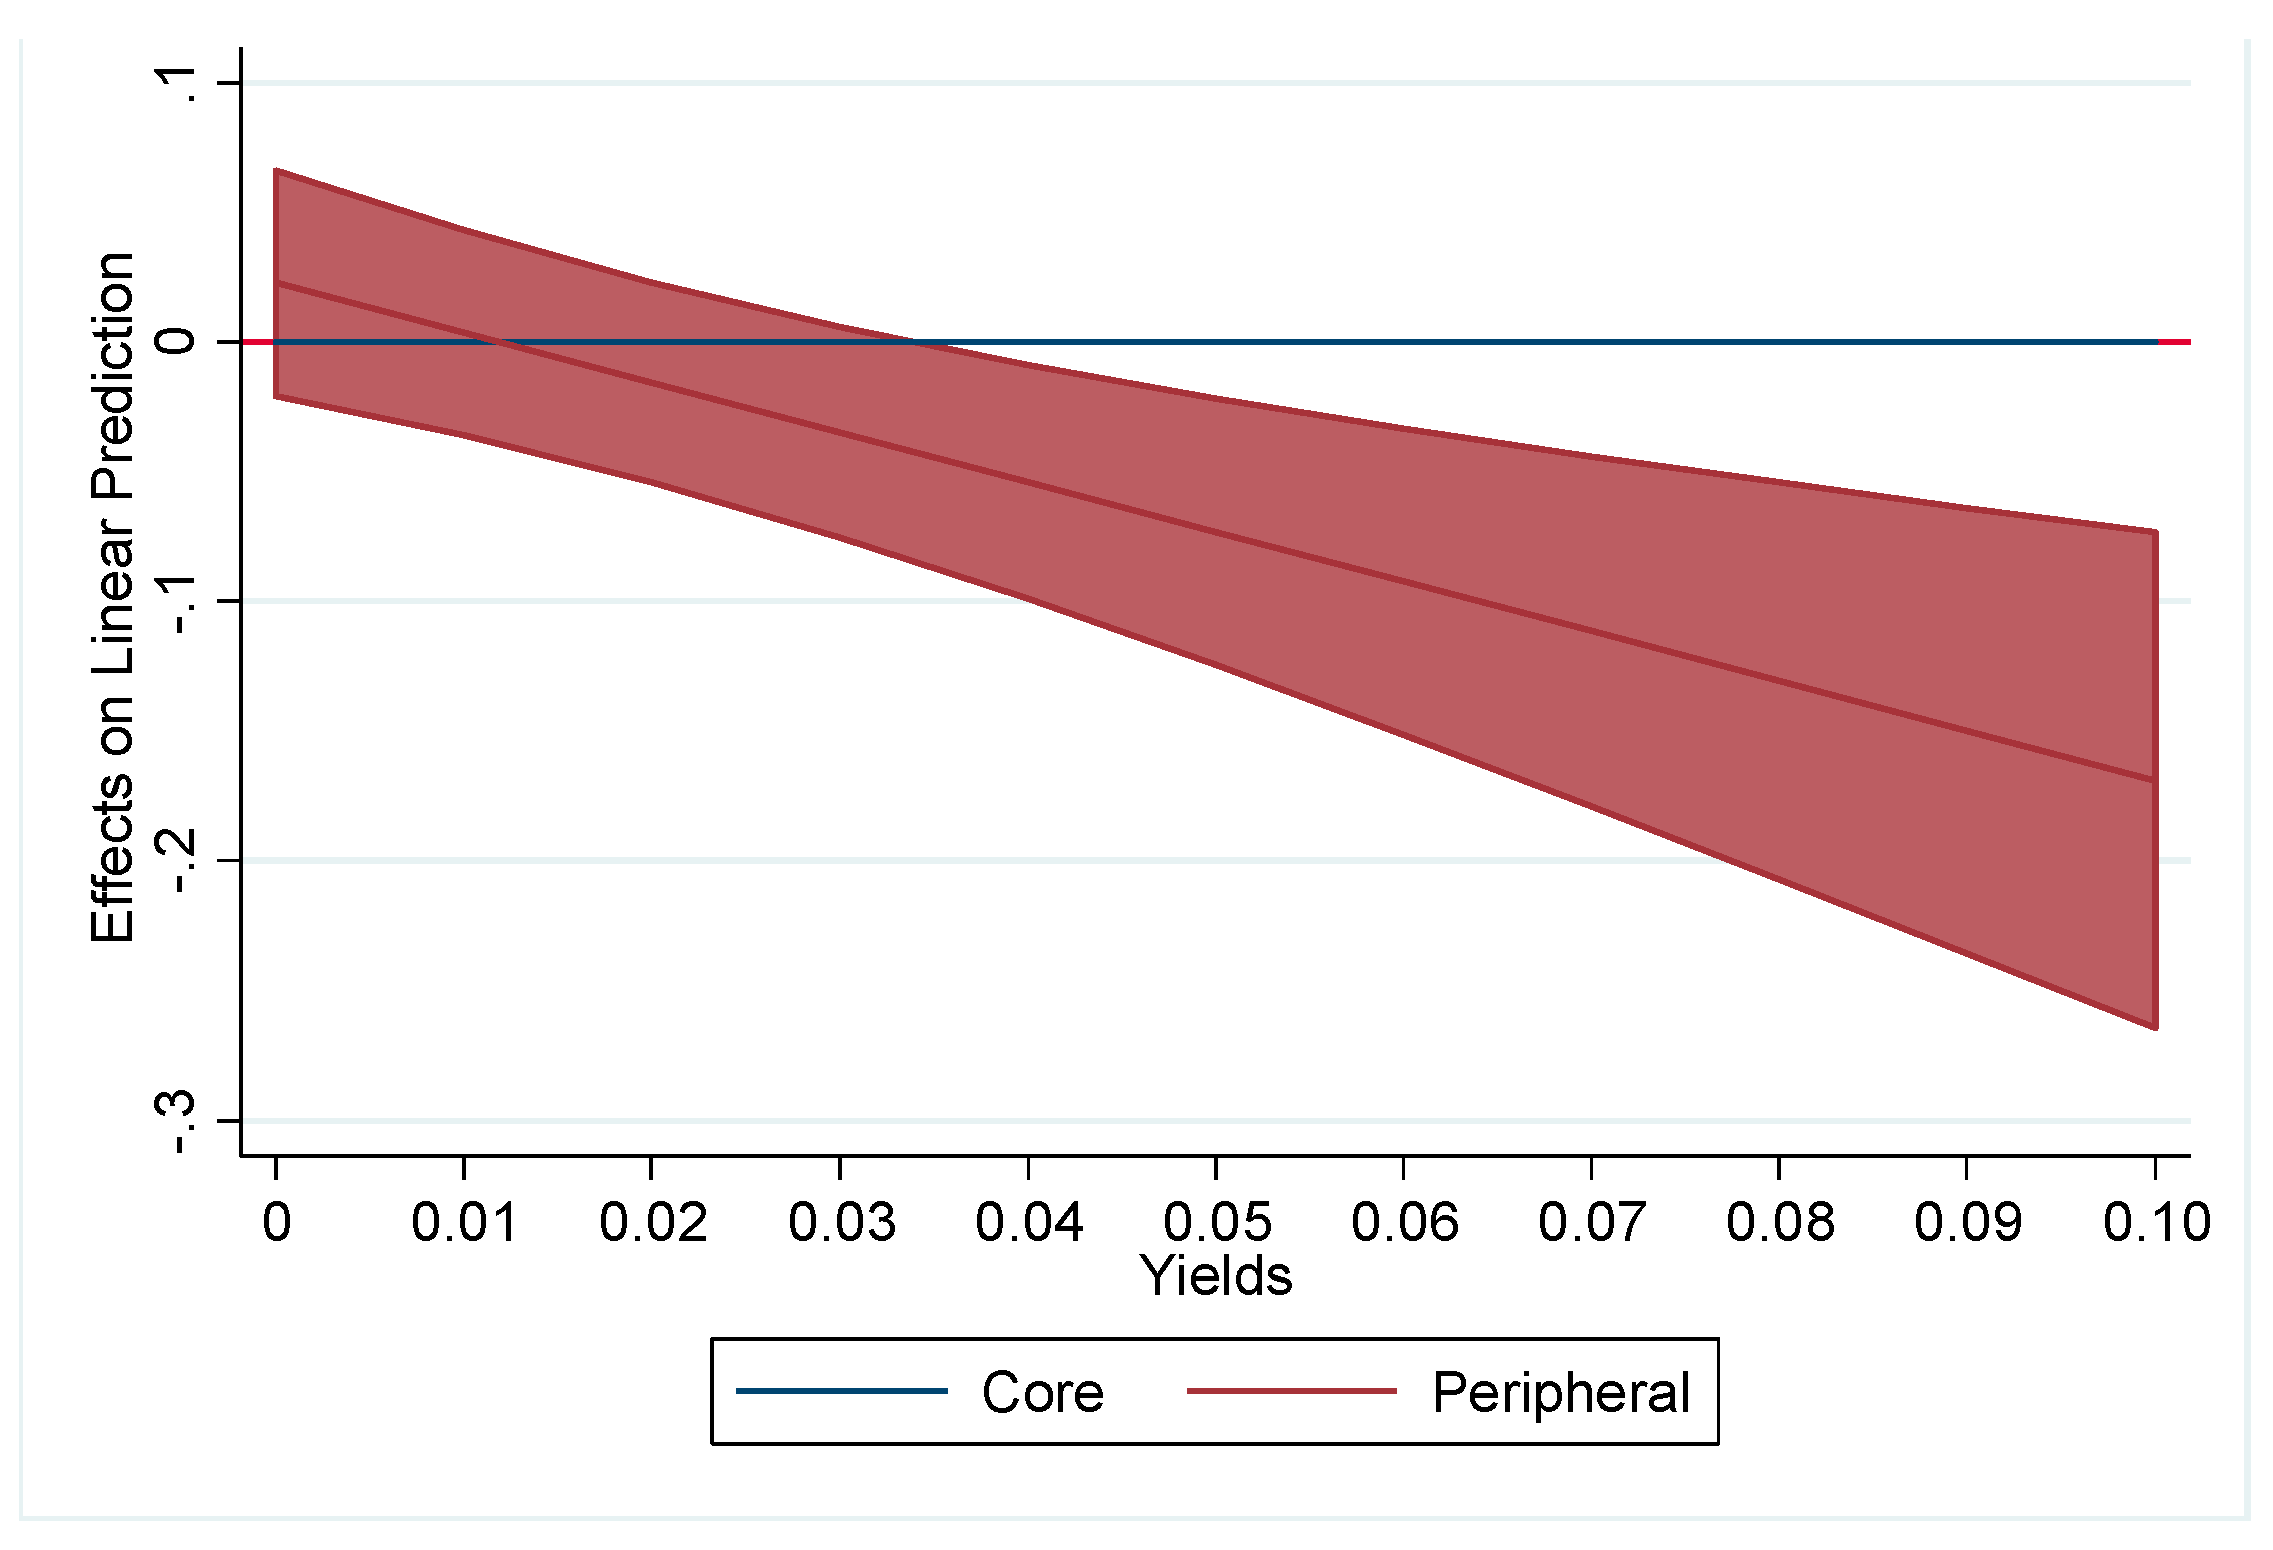
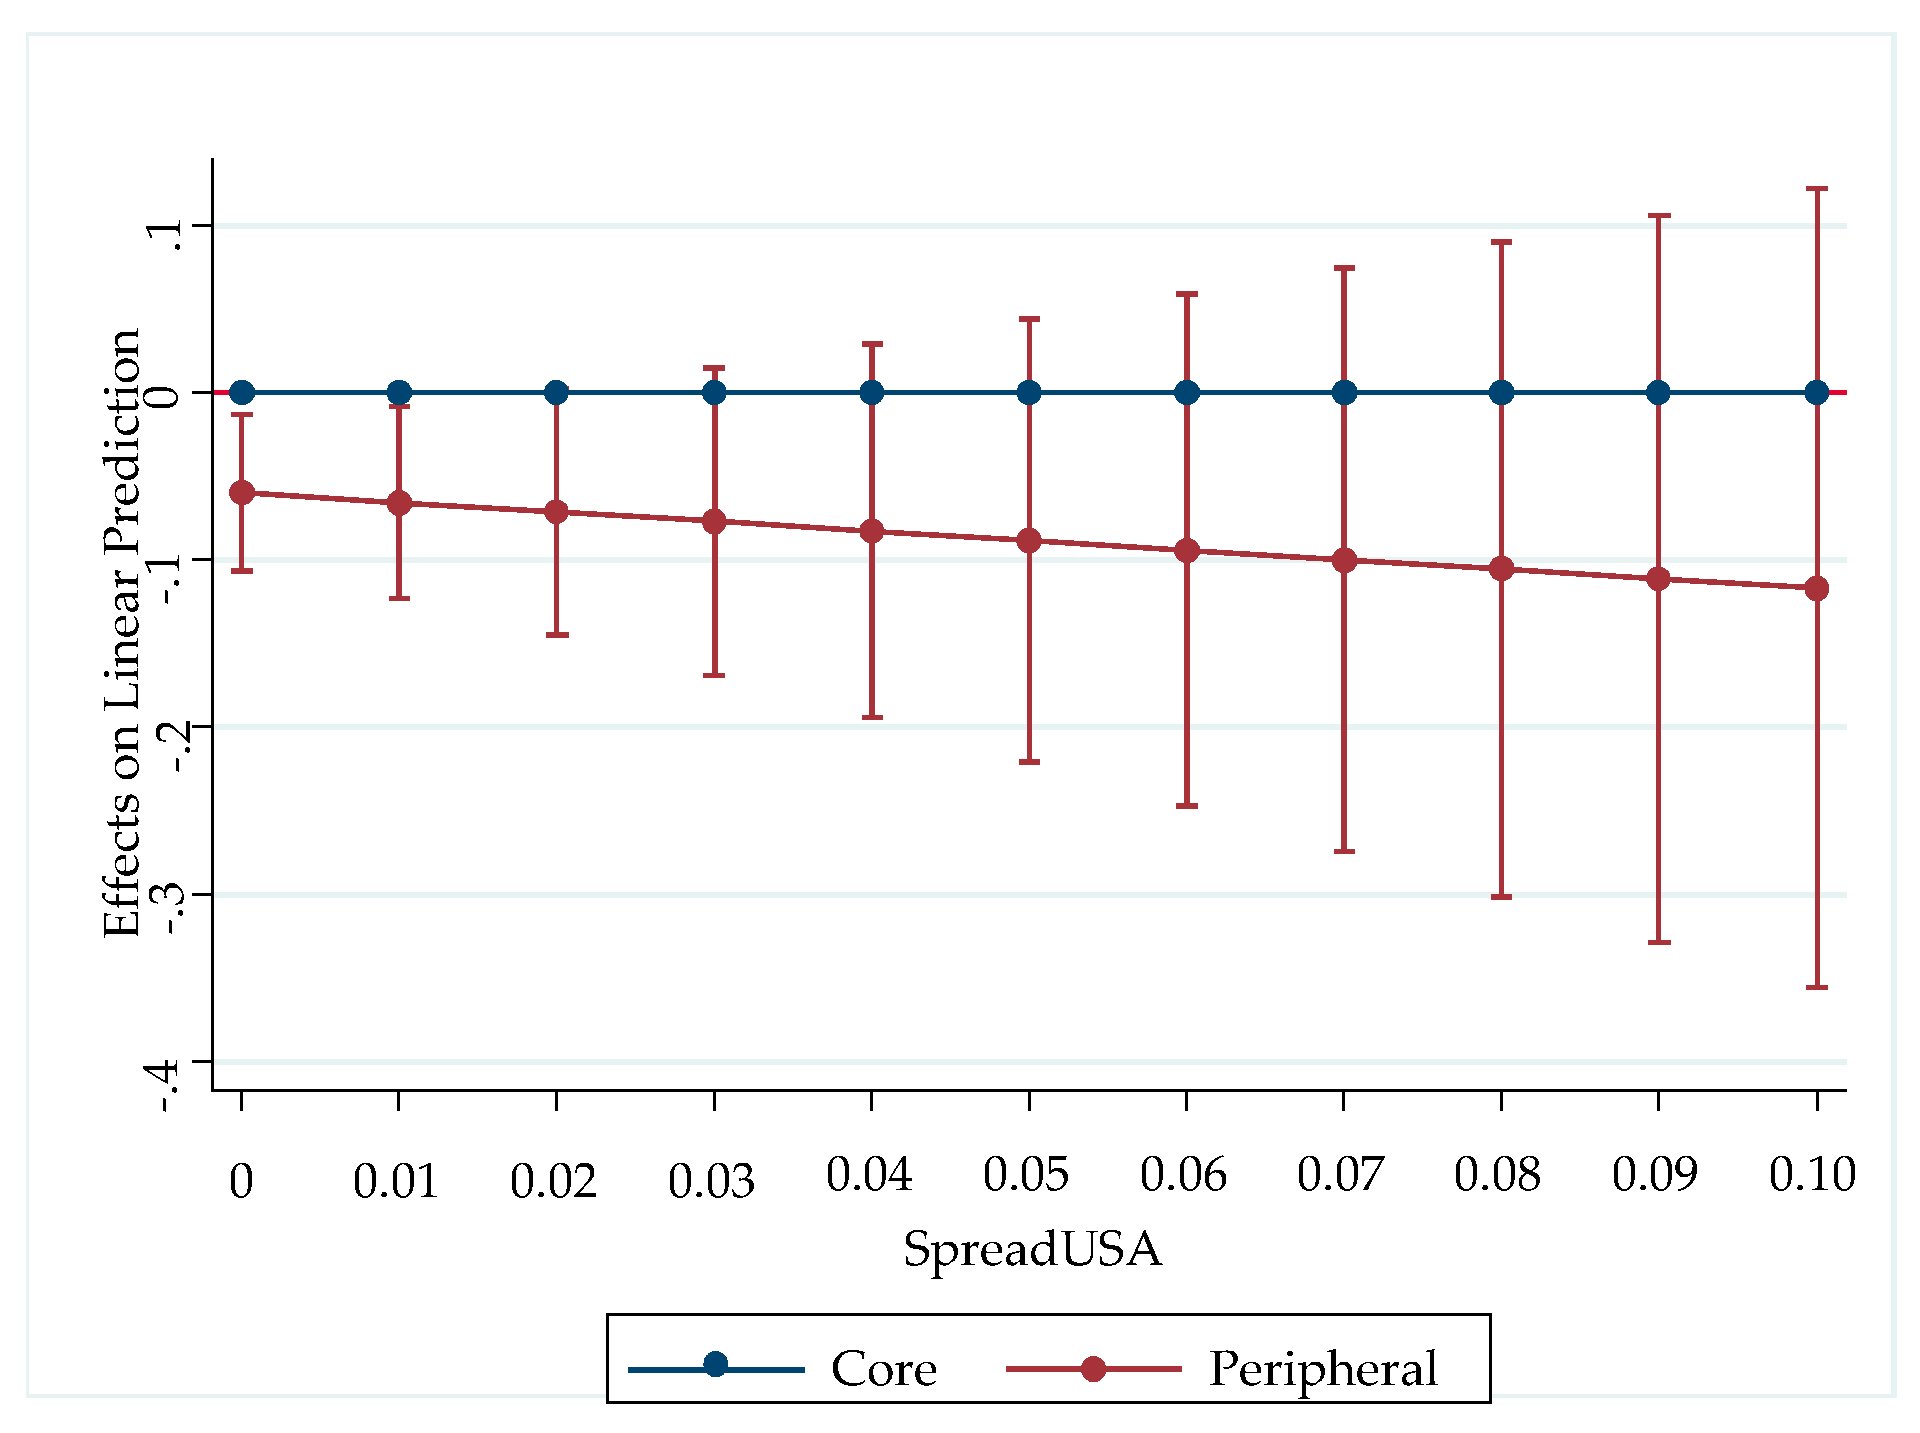
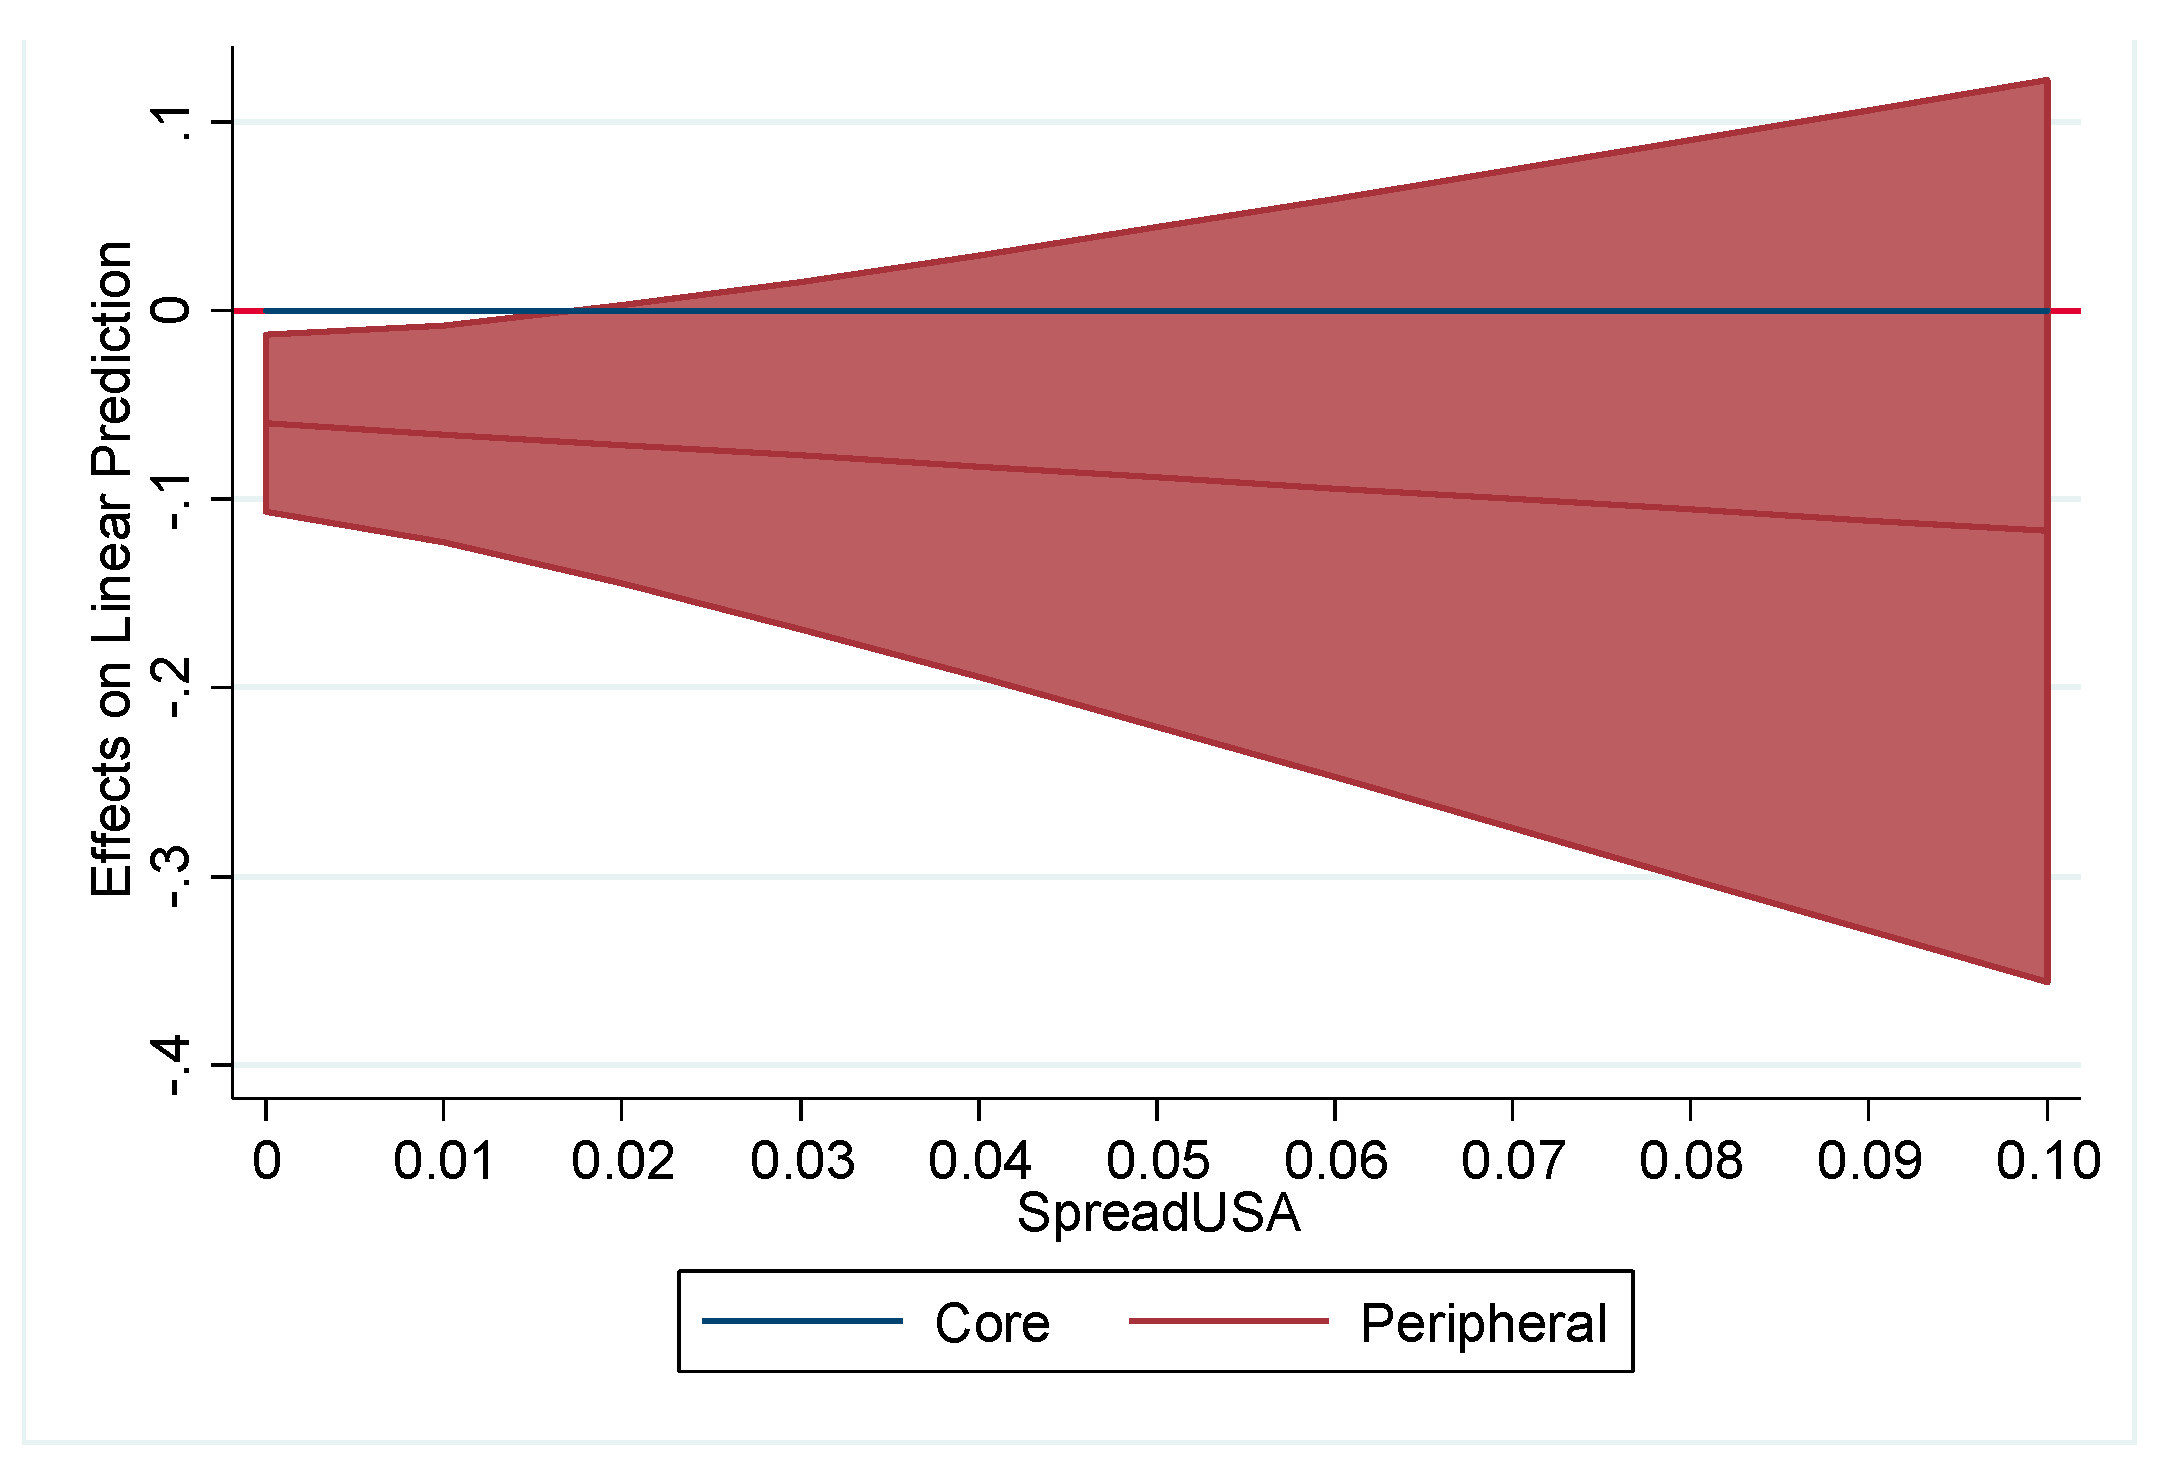
To be exhaustive in the analysis, we also calculated the average marginal effects for the yields on the dependent variable for the peripheral and core countries (Figure 5 and Figure 6). We can observe that the differences between peripheral and core countries are significant for values of the sovereign bond yields higher than 0.04.
The graphs show that the peripheral/core differences increase as the value of the yields increase; this difference is statistically significant for values greater than 4%. According to these results, we can confirm that a different behavior exists between sovereign bond yields and maturity structure, but only when the yields reach a value higher than 4%. Below this threshold, there are no differences between peripheral and core countries.
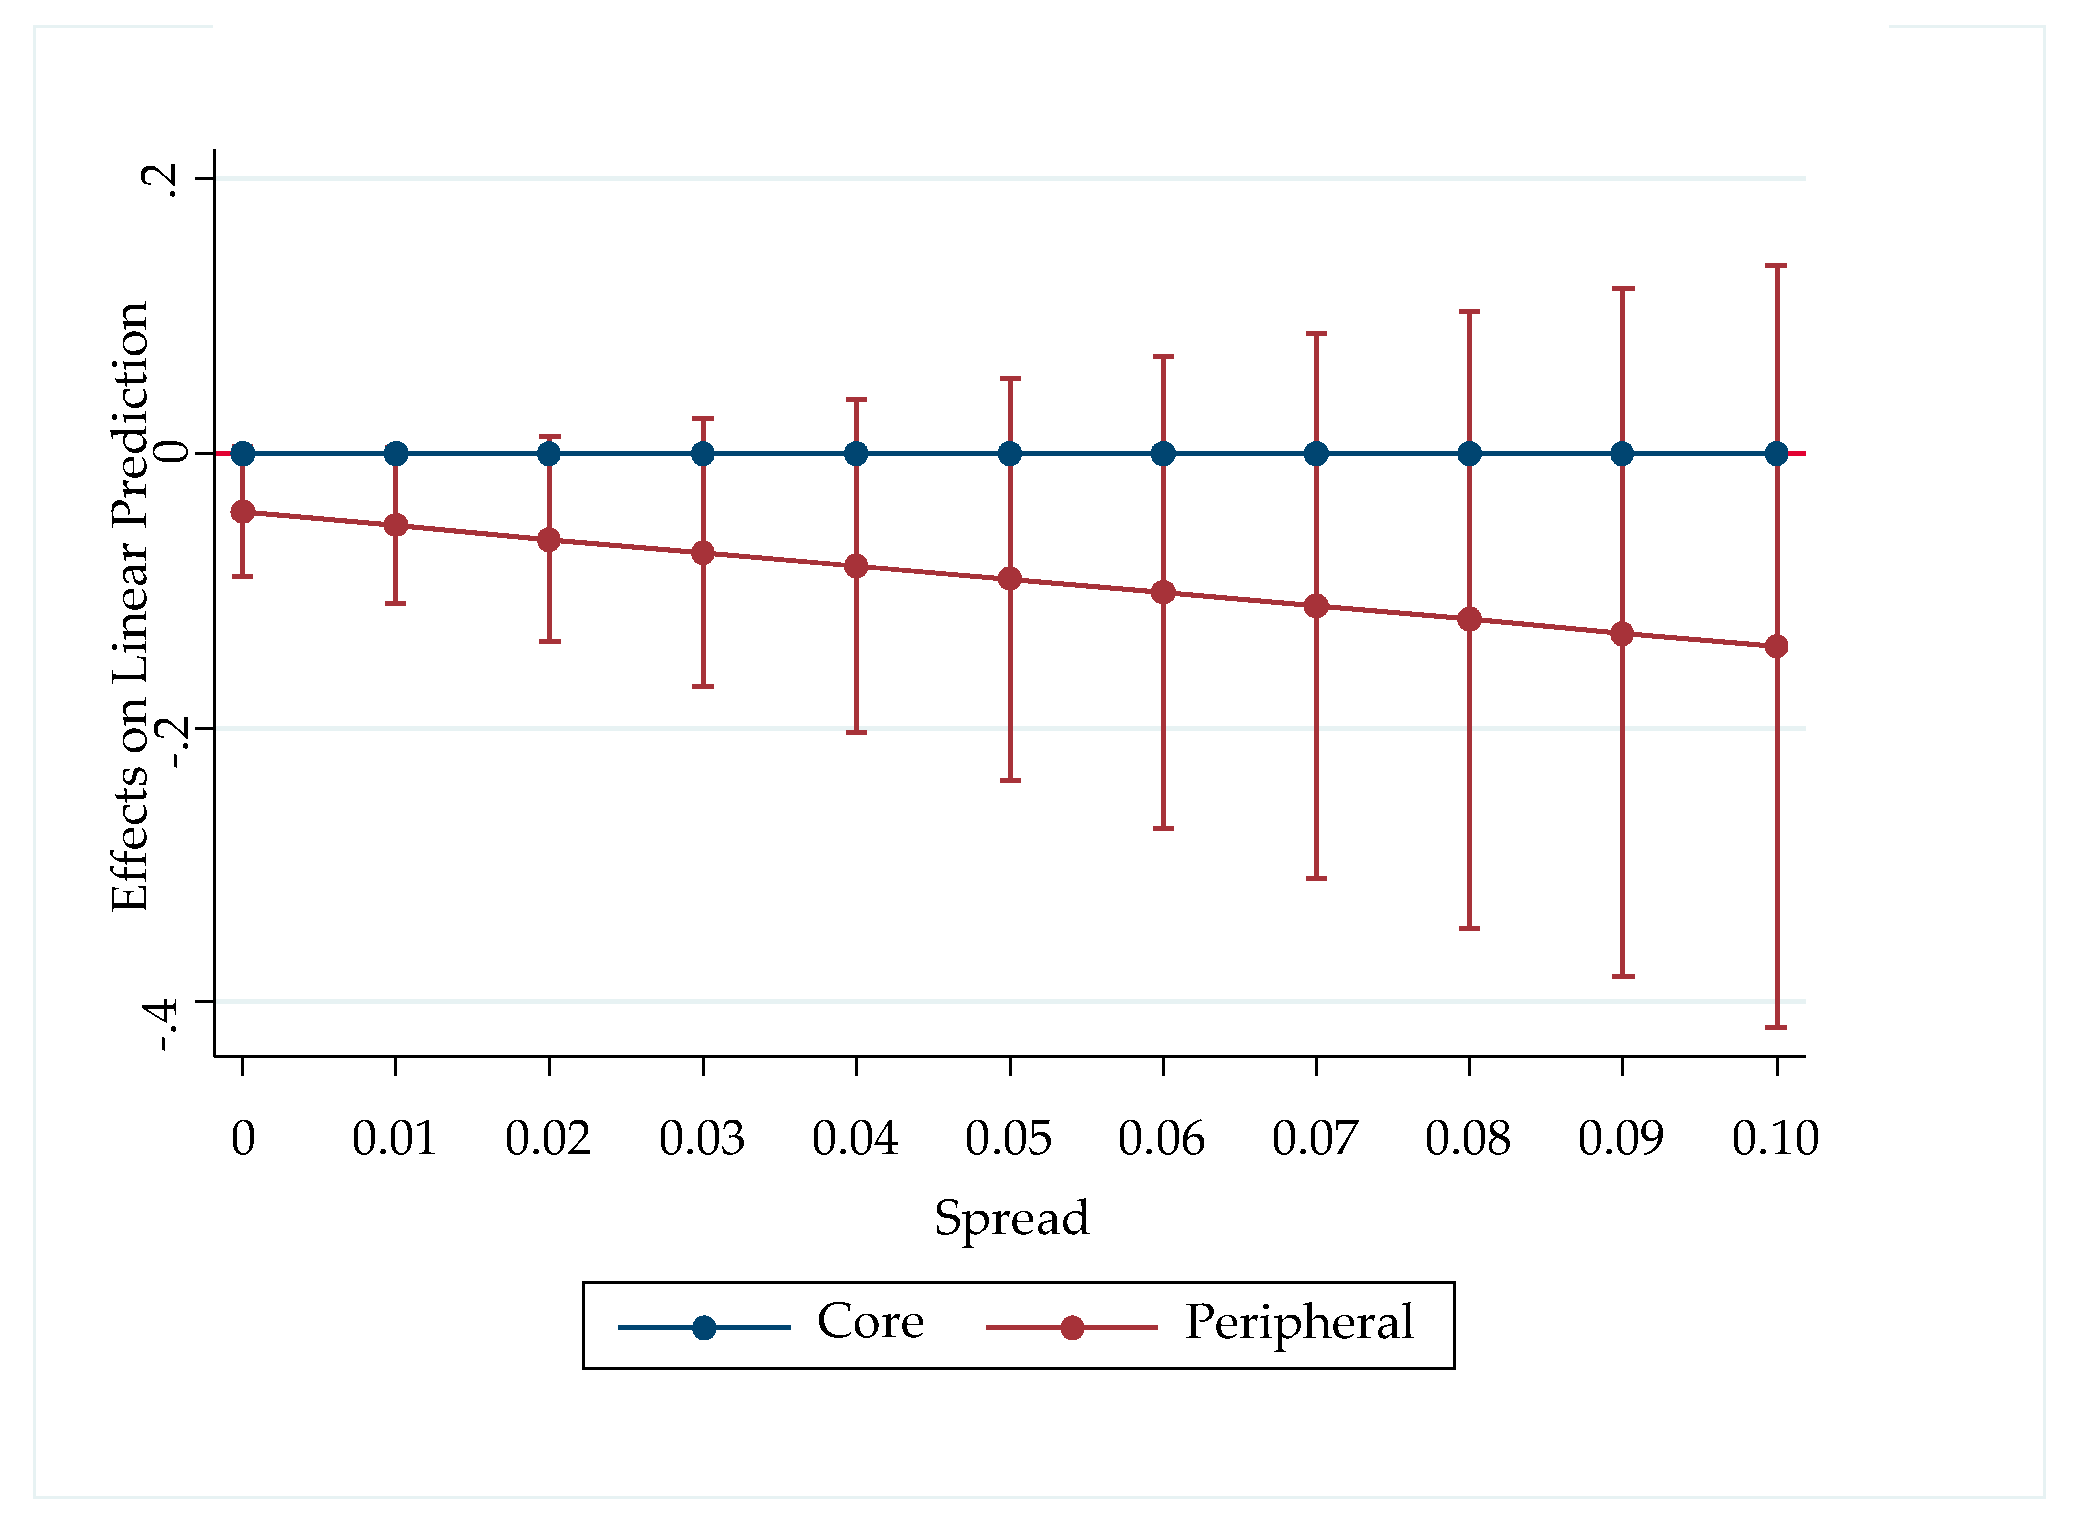
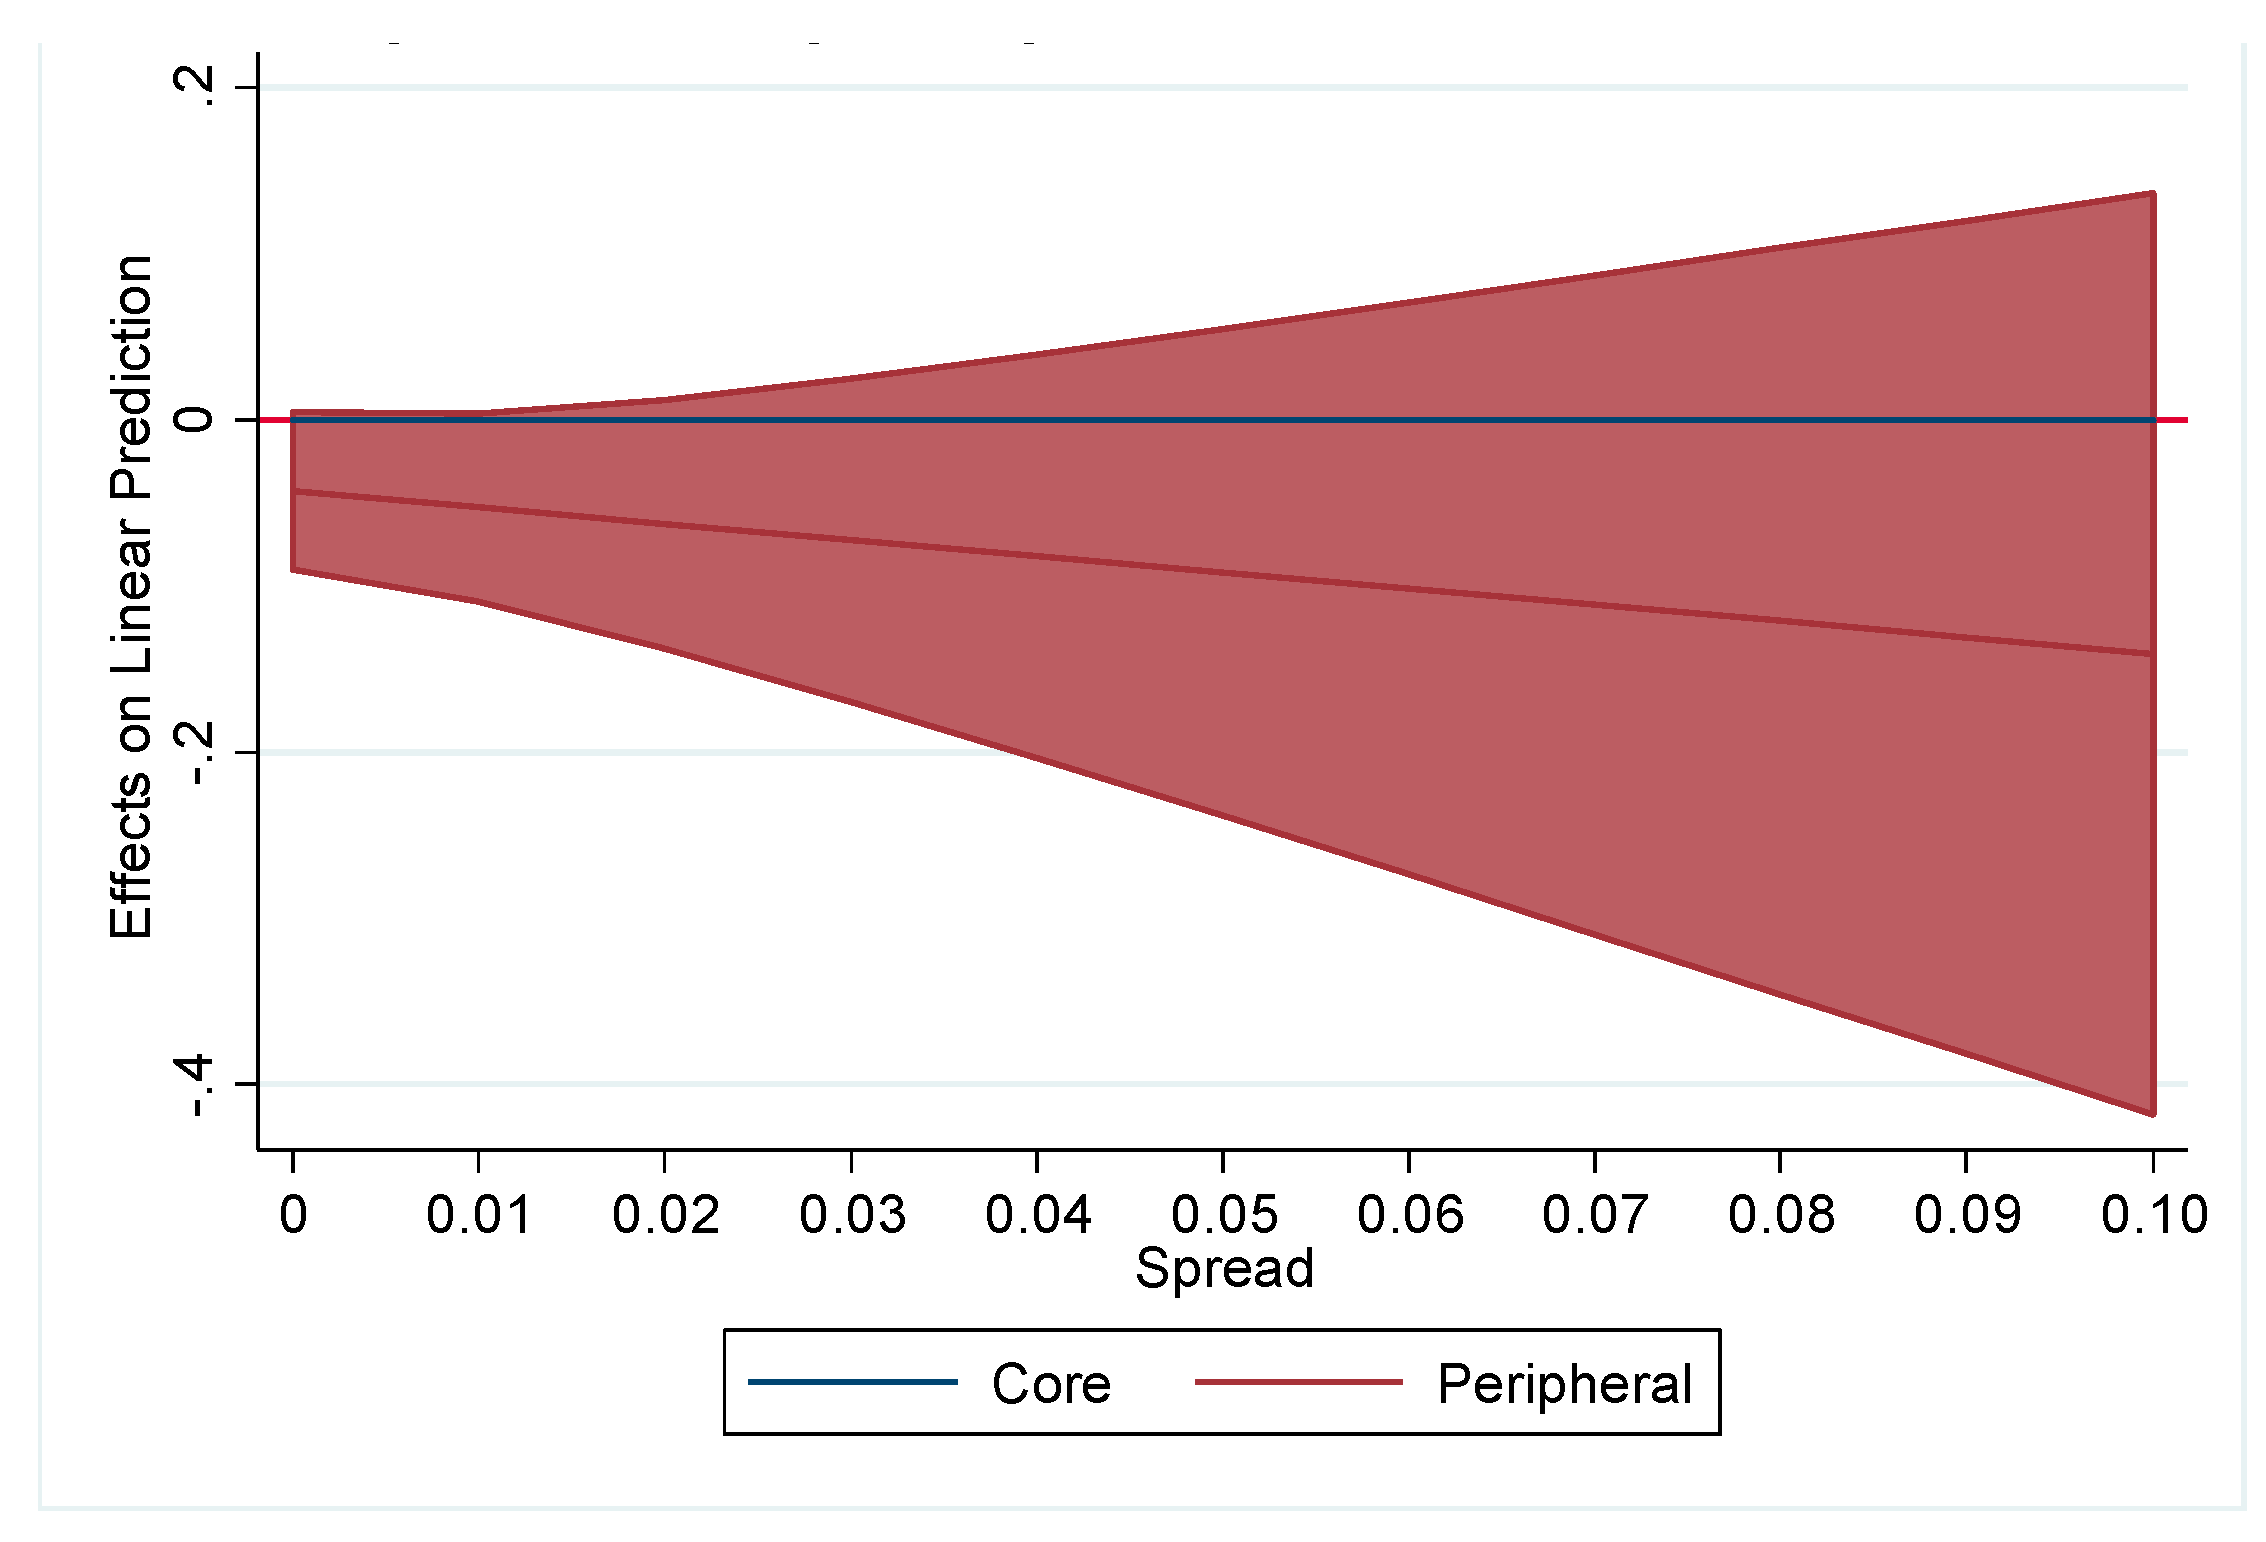
The average marginal effects for the spread on the German bond and for the spread on the USA bond are shown in Figure 7, Figure 8, Figure 9 and Figure 10, respectively. As we have deduced from the coefficients of the interaction term, there was no evidence of a significant difference in the effect of sovereign risk on the maturity structure of sovereign debt between peripheral and core countries.
The results show that there exists a non-monotonic relationship between maturity structure and sovereign bond yields in peripheral and core countries, but only when the yields exceed the 4% threshold. This non-monotonic relation can be explained by the high yields in the fixed income instruments in peripheral countries. Because of these high yields, these countries resorted to issuing short-term debt to reduce their funding costs, and as a result, the maturity structure of the debt shortened. However, countries with lower yields had lower term premiums, and their long-term yields may even decrease because they become safe havens. In this case, these countries can choose to issue long-term debt. Thus, they can defer the repayment of debt and can finance at a lower cost, which leads to a lengthening of the maturity structure of the debt
By contrast, we cannot confirm this different behavior depending on the risk level proxied by the spread on the German bond or the spread on the USA bond. According to these outcomes, we were not able to assert the existence of a non-monotonic relationship between the maturity structure and sovereign risk in the countries analyzed.
6.4. Relation between Sovereign Bond Yields, Sovereign Risk and Maturity Structure Depending on the Indebtedness Level
Another objective of the study was to analyze the relationship between sovereign bond yields, sovereign risk and the maturity structure of sovereign debt based on the level of indebtedness of the countries analyzed to evaluate the arguments of Alesina et al. (1992) and Drudi and Giordano (2000). According to these authors, the inverse relationship between the two variables is obtained only in highly indebted countries, because if the stock of debt is large, term premiums rise, and countries can only resort to issuing short-term to reduce the cost of debt.
For this purpose, we combined the variable debt/GDP ratio with the variables that approximate sovereign bond yields and sovereign risk, to analyze the existence of nonlinear effects. We present the estimates of the panel data regression for each of the groups (Table 8).
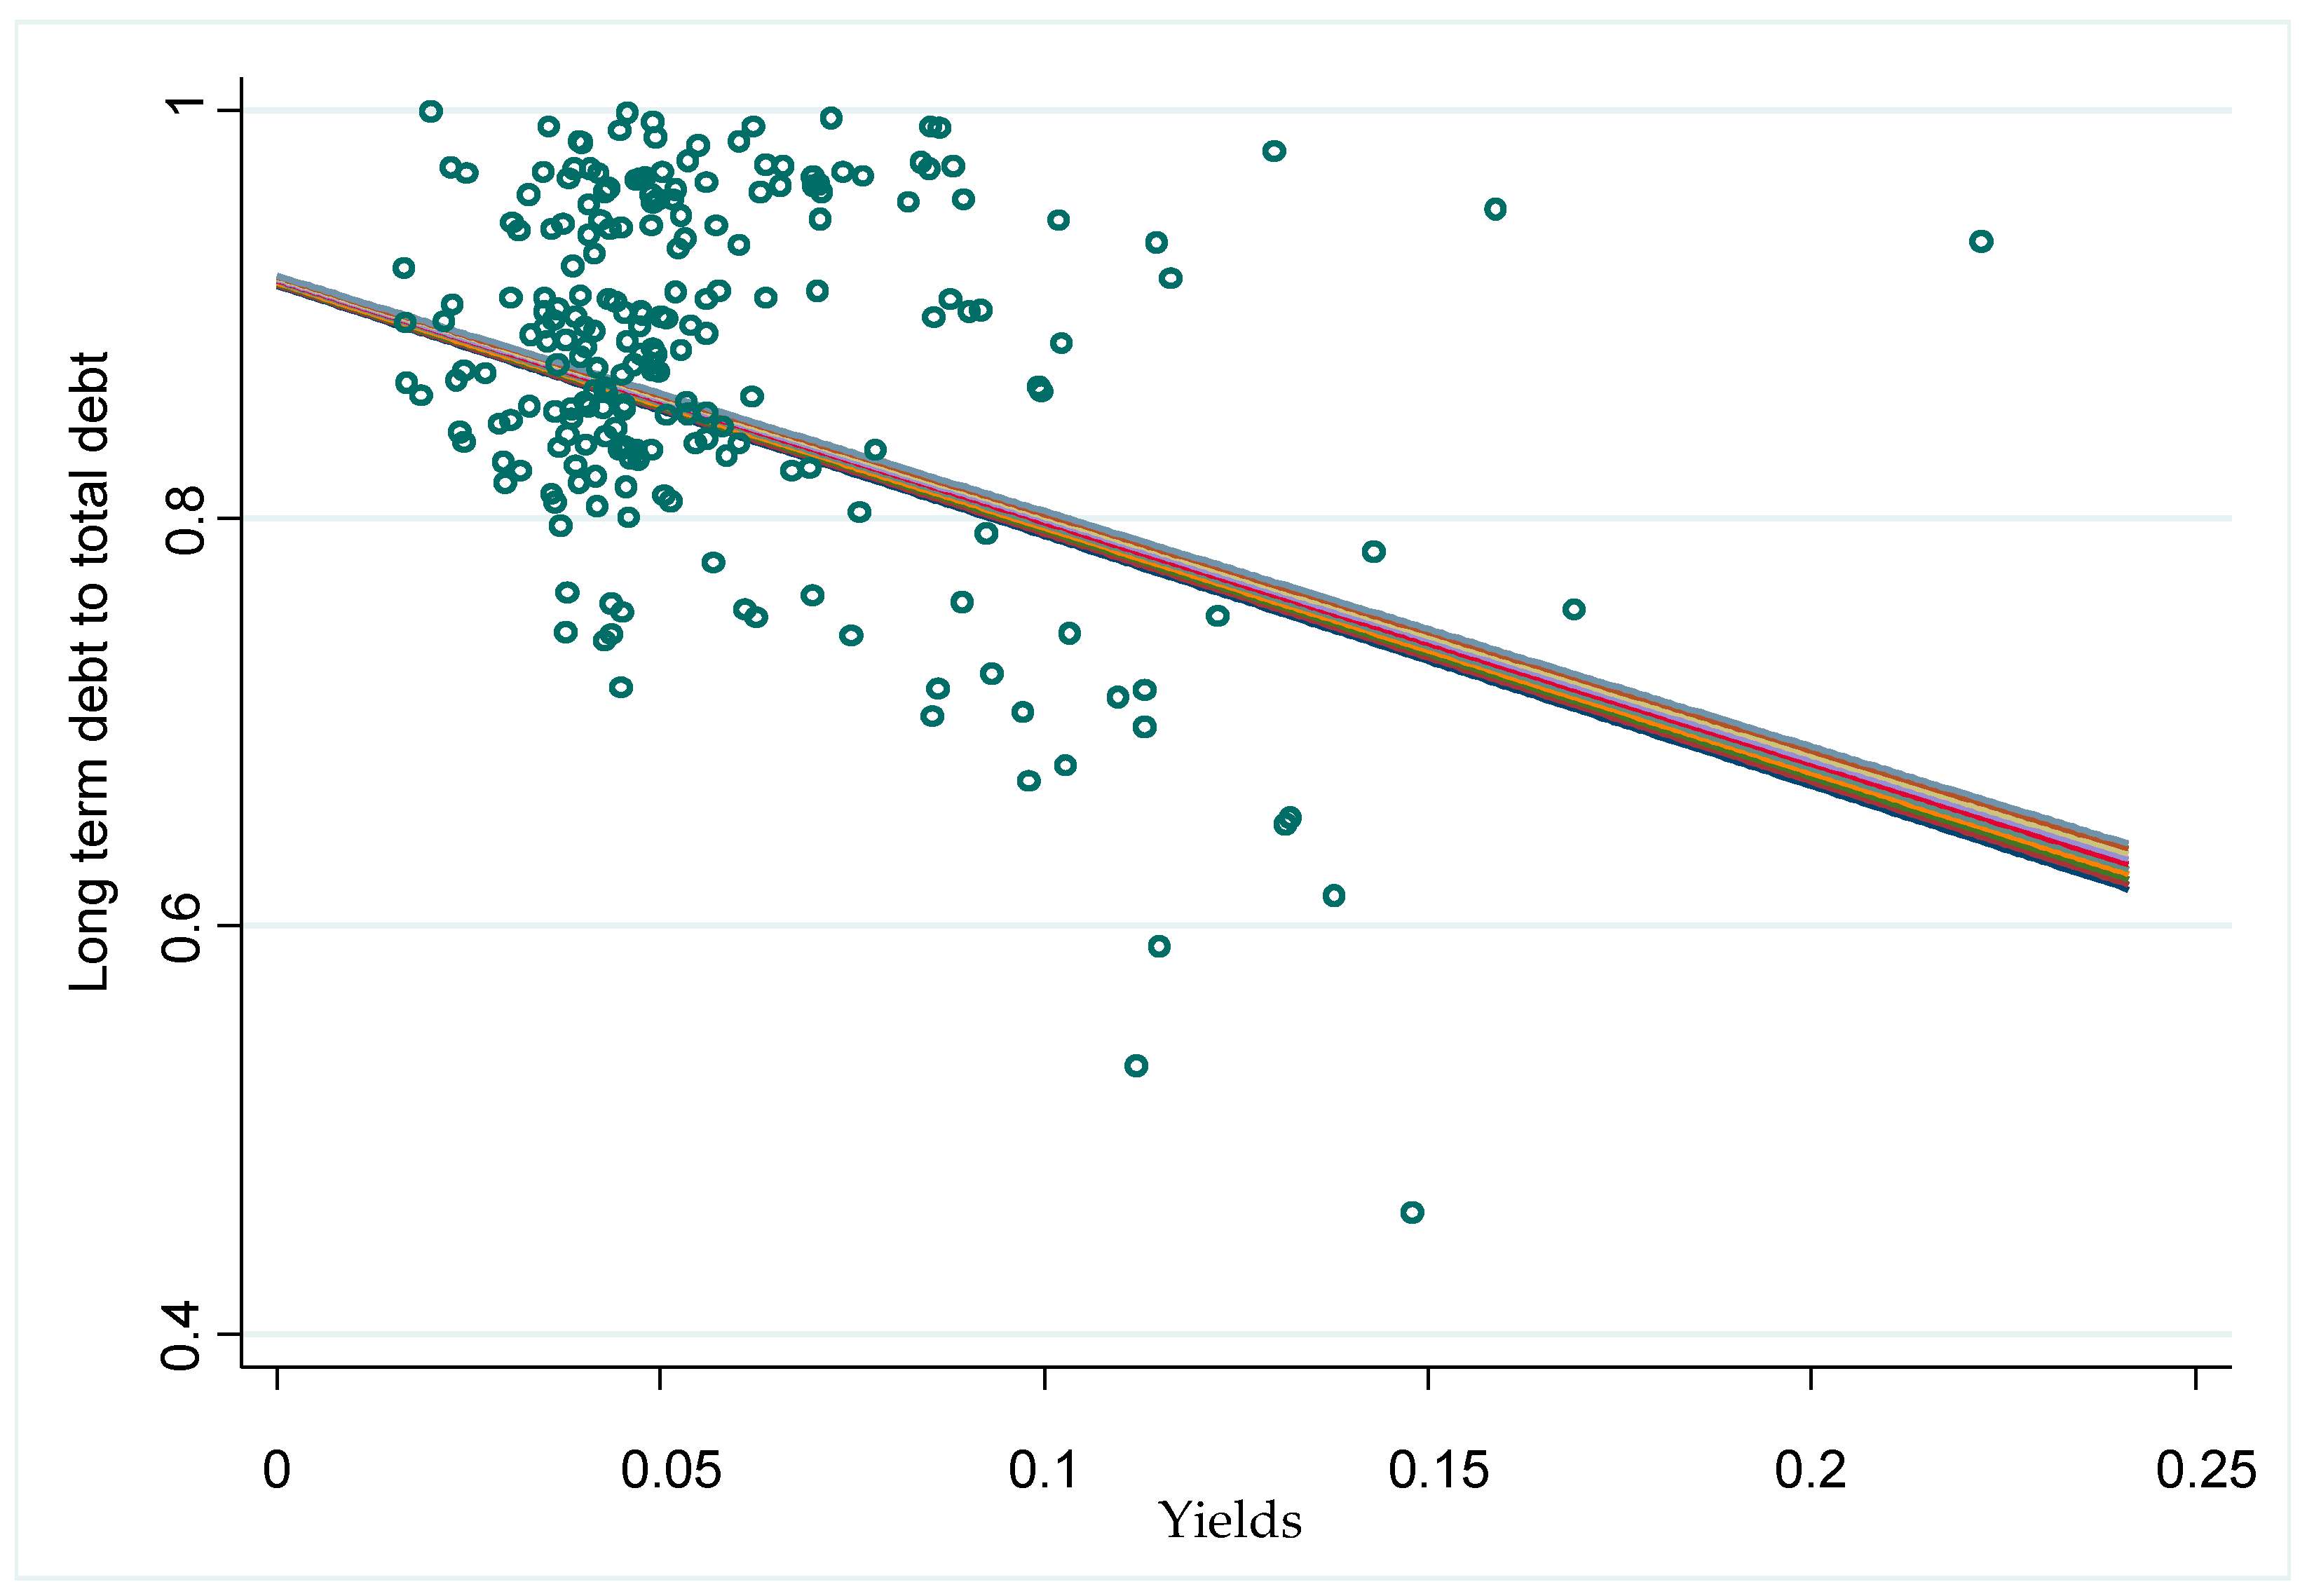
Based on these results, we found evidence that only the coefficient for the interaction between debt/GDP ratio and the sovereign bond yields is statistically significant with the expected negative sign. The results for the other proxies of sovereign risk did not provide significant results. Regarding the sovereign bond yields, as we can observe in Figure 11, an increase in the debt to GDP/ratio slightly increases the negative slope between the dependent variable and the yields.
Therefore, according to the results obtained, we cannot fully confirm the arguments of Drudi and Giordano (2000) and Alesina et al. (1992), who claimed that the inverse relationship between risk and maturity exists only for highly indebted countries. Nevertheless, we did find evidence that the inverse relationship between sovereign bond yields and maturity is stronger when the level of debt is higher. Thus, we can partially confirm hypothesis H3.
7. Conclusions
The aim of this paper was to deepen the analysis of the relationship between sovereign bond yields, sovereign risk and the maturity structure of sovereign debt for a set of countries in the European Monetary Union and thus to contribute in extending the existing literature on this matter (Broner et al. 2013; Xie et al. 2009, among others). In addition, we analyzed the existence of a non-monotonic relationship between sovereign bond yields, sovereign risk and maturity based on the arguments of Diamond (1991). Finally, we evaluated the arguments of Alesina et al. (1992) and Drudi and Giordano (2000), who suggested that the indebtedness level of the countries analyzed may influence the relationship between maturity and sovereign risk.
The results confirmed the existence of an inverse relationship between sovereign bond yields, sovereign risk and the maturity structure of sovereign debt, regardless of the proxy that is used to measure sovereign risk and the time variance of the variables employed. When sovereign bond yields or risk increased, risk premiums in long-term instruments increased more than the short-term instruments, which increased term premiums. In this context, states chose to issue more short-term debt to reduce their funding costs. Thus, the maturity structure of the debt shortened because more short-term fixed income instruments were issued. Therefore, sovereign debt increased the share of short-term debt to total debt. However, this inverse relationship did not appear when we take into account the effect of the LTROs that attempted to provide liquidity to the financial sector. In this case, it was not the risk variable that shortened the maturity structure, but the LTROs. The results provided evidence that these LTROs lead to the financial sector, but to large amounts of sovereign debt at short maturities, which shortened the maturity structure of sovereign debt absorbing the effect of sovereign bond yields and sovereign risk.
The analysis of whether a non-monotonic relationship exists between sovereign bond yields, sovereign risk and maturity structure also provided interesting results. According to the analysis performed, the relationship between sovereign bond yields and debt maturity show a negative slope for countries with a higher risk level (i.e., peripheral countries). However, for countries with lower sovereign risk (i.e., core countries), this inverse relationship was not significant. For these countries, the long-term yields were lower than those for peripheral countries and may even tend to decrease, as they become safe havens when the risk increases. Accordingly, core countries could finance themselves with longer maturities and simultaneously have low funding costs in a context of financial turmoil with risk-averse investors who seek protection for their sovereign debt. The results indicated that the differences between peripheral and core countries are greater for higher yields levels; the difference becomes significant for yields values larger than the 4% threshold
Finally, we analyzed the relation between sovereign bond yields, sovereign risk and maturity according to the indebtedness level of the countries. In this case, the results indicated that the effect of the sovereign bond yield on debt maturity structure was slightly enhanced for the effect of the indebtedness level of the country. Therefore, in countries with higher levels of debt, an increase in sovereign bond yields generated a higher shortening in the maturity structure of sovereign debt.
Author Contributions
Marcos González-Fernández and Carmen González-Velasco have contributed to the design of the research, to the elaboration of the theoretical background, to the analysis of the results and to the writing of the manuscript.
Acknowledgments
The authors gratefully thank the reviewers for their constructive comments and recommendations which definitely have helped to improve the quality of the article. We also thank the Assistant Editor Dennis Wang for his help and efficiency.
Conflicts of Interest
The authors declare no conflict of interest.
References
- Ağca, Şenay, and Oya Celasun. 2012. Sovereign debt and corporate borrowing costs in emerging markets. Journal of International Economics 88: 198–208. [Google Scholar] [CrossRef]
- Alesina, Alberto, Mark De Broeck, Alessandro Prati, and Guido Tabellini. 1992. Default risk on goverment debt in OECD countries. Economic Policy 7: 427–63. [Google Scholar] [CrossRef]
- Alesina, Alberto, and Guido Tabellini. 1989. External debt, capital flight and political risk. Journal of Development Economics 27: 199–220. [Google Scholar] [Green Version]
- Alfaro, Laura, and Fabio Kanczuk. 2009. Debt Maturity: Is Long-Term Debt Optimal? Review of International Economics 17: 890–905. [Google Scholar] [CrossRef]
- Altman, Edward I., and Herbert A. Rijken. 2004. How rating agencies achieve rating stability. Journal of Banking and Finance 28: 2679–714. [Google Scholar] [CrossRef]
- Altman, Edward I. 1968. Financial Ratios, Discriminant Analysis and the Prediction of Corporate Bankruptcy. The Journal of Finance 23: 589–609. [Google Scholar] [CrossRef]
- Arce, Oscar, Sergio Mayordomo, and Juan Ignacio Peña. 2013. Credit-risk valuation in the sovereign CDS and bonds markets: Evidence from the euro area crisis. Journal of International Money and Finance 35: 124–145. [Google Scholar] [CrossRef] [Green Version]
- Arellano, Cristina, and Ananth Ramanarayanan. 2012. Default and the Maturity Structure in Sovereign Bonds. Journal of Political Economy 120: 187–232. [Google Scholar] [CrossRef] [Green Version]
- Baker, Malcolm, Robin Greenwood, and Jeffrey Wurgler. 2003. The maturity of debt issues and predictable variation in bond returns. Journal of Financial Economics 70: 261–91. [Google Scholar] [CrossRef]
- Baker, Scott R., Nicholas Bloom, and Steven J. Davis. 2016. Measuring Economic Policy Uncertainty. The Quarterly Journal of Economics 131: 1593–636. [Google Scholar] [CrossRef]
- Barclay, Michael J., and Clifford W. Smith Jr. 1995. The Maturity Structure of Corporate Debt. The Journal of Finance 50: 609–31. [Google Scholar] [CrossRef]
- Bayoumi, Tamim, Morris Goldstein, and Geoffrey Woglom. 1995. Do Credit Markets Discipline Sovereign Borrowers? Evidence from U.S. States. Journal of Money, Credit and Banking 27: 1046–59. [Google Scholar] [CrossRef]
- Berger, Allen N., Marco A. Espinosa-Vega, W. Scott Frame, and Nathan H. Miller. 2005. Debt Maturity, Risk, and Asymmetric Information. The Journal of Finance 60: 2895–923. [Google Scholar] [CrossRef]
- Bernoth, Kerstin, Jürgen Von Hagen, and Ludger Schuknecht. 2012. Sovereign risk premiums in the European government bond market. Journal of International Money and Finance 31: 975–95. [Google Scholar] [CrossRef] [Green Version]
- Bodnaruk, Andriy. 1999. Determinants of Sovereign Debt Term for Transition Countries, EERC MA Program in Economics: Working Paper.
- Boumparis, Periklis, Costas Milas, and Theodore Panagiotidis. 2017. Economic policy uncertainty and sovereign credit rating decisions: Panel quantile evidence for the Eurozone. Journal of International Money and Finance 79: 39–71. [Google Scholar] [CrossRef]
- Büchel, Konstantin. 2013. Do words matter? The impact of communication on the PIIGS’ CDS and bond yield spreads during Europe’s sovereign debt crisis. European Journal of Political Economy 32: 412–431. [Google Scholar] [CrossRef]
- Broner, Fernando A., Guido Lorenzoni, and Sergio L. Schmukler. 2013. Why do emerging economies borrow short term? Journal of the European Economic Association 11: 67–100. [Google Scholar] [CrossRef]
- Broner, Fernando, Aitor Erce, Alberto Martin, and Jaume Ventura. 2014. Sovereign debt markets in turbulent times: Creditor discrimination and crowding-out effects. Journal of Monetary Economics 61: 114–42. [Google Scholar] [CrossRef]
- Brunnermeier, Markus K., and Martin Oehmke. 2013. The Maturity Rat Race. The Journal of Finance 68: 483–521. [Google Scholar] [CrossRef]
- Cole, Harold L., and Timothy J. Kehoe. 2000. Self-fulfilling debt crises. The Review of Economic Studies 67: 91–116. [Google Scholar] [CrossRef]
- Datta, Sudip, Mai Iskandar-Datta, and Ajay Patel. 1999. Bank monitoring and the pricing of corporate public debt. Journal of Financial Economics 51: 435–49. [Google Scholar] [CrossRef]
- Davis, Steven J. 2016. An Index of Global Economic Policy Uncertainty. No. w22740. Cambridge: National Bureau of Economic Research (NBER). [Google Scholar]
- De Haan, Jakob, Bernd Jan Sikken, and Andrew Hilder. 1995. On the relationship between the debt ratio and debt maturity. Applied Economics Letters 2: 484–86. [Google Scholar] [CrossRef]
- Delatte, Anne-Laure, Mathieu Gex, and Antonia López-Villavicencio. 2012. Has the CDS market influenced the borrowing cost of European countries during the sovereign crisis? Journal of International Money and Finance 31: 481–497. [Google Scholar] [CrossRef]
- Diamond, Douglas W. 1991. Debt Maturity Structure and Liquidity Risk. The Quarterly Journal of Economics 106: 709–37. [Google Scholar] [CrossRef]
- Drudi, Francesco, and Raffaela Giordano. 2000. Default risk and optimal debt management. Journal of Banking & Finance 24: 861–91. [Google Scholar]
- Ejsing, Jacob, and Wolfgang Lemke. 2011. The Janus-headed salvation: Sovereign and bank credit risk premia during 2008–2009. Economics Letters 110: 28–31. [Google Scholar] [CrossRef] [Green Version]
- Flannery, Mark J. 1986. Asymmetric Information and Risky Debt Maturity Choice. The Journal of Finance 41: 19–37. [Google Scholar] [CrossRef]
- Kalbaska, Alesia, and Mateusz Gątkowski. 2012. Eurozone sovereign contagion: Evidence from the CDS market (2005–2010). Journal of Economic Behavior & Organization 83: 657–73. [Google Scholar]
- González, Víctor M. 2009. Estructura de vencimiento de la deuda y riesgo de crédito en las empresas españolas. Universia Business Review 22: 88–101. [Google Scholar]
- Goudswaard, Kees P. 1990. Determinants of public debt maturities. De Economist 138: 33–46. [Google Scholar] [CrossRef]
- Guedes, Jose, and Tim Opler. 1996. The Determinants of the Maturity of Corporate Debt Issues. The Journal of Finance 51: 1809–33. [Google Scholar] [CrossRef]
- Hardouvelis, Gikas A., Georgios Karalas, Dimitrios Karanastasis, and Panagiotis Samartzis. 2018. Economic Policy Uncertainty, Political Uncertainty and the Greek Economic Crisis, SSRN Working Paper. Social Science Research Network.
- Hatchondo, Juan Carlos, and Leonardo Martinez. 2013. Sudden Stops, Time Inconsistency, and the Duration of Sovereign Debt. International Economic Journal 27: 217–28. [Google Scholar] [CrossRef]
- Hatchondo, Juan Carlos, Leonardo Martinez, and César Sosa-Padilla. 2011. Debt Dilution and Sovereign Default Risk. IMF Working Paper WP/11/70. Washington, DC: International Monetary Fund. [Google Scholar]
- Hausman, Jerry A. 1978. Specification test in econometrics. Econometrica 46: 1251–71. [Google Scholar] [CrossRef]
- Lee, Hei Wai, Yan Alice Xie, and Jot Yau. 2011. The impact of sovereign risk on bond duration: Evidence from Asian sovereign bond markets. International Review of Economics & Finance 20: 441–51. [Google Scholar]
- Mann, Henry B., and Donald R. Whitney. 1947. On a test of whether one of two random variables is stochastically than the other. Annals of Mathematical Statistics 18: 50–60. [Google Scholar] [CrossRef]
- Missale, Alessandro, and Olivier Jean Blanchard. 1994. The Debt Burden and Debt Maturity. The American Economic Review 84: 309–19. [Google Scholar]
- Mitchell, Karlyn. 1993. The debt maturity choice: an empirical investigation. The Journal of Financial Research 16: 309–20. [Google Scholar] [CrossRef]
- Myers, Stewart C. 1977. Determinants of corporate borrowing. Journal of Financial Economics 5: 147–75. [Google Scholar] [CrossRef]
- Park, Chul Woo. 1999. Maturity structure of public debt and expected bond returns. Journal of Banking & Finance 23: 1407–35. [Google Scholar]
- Perez, Diego J. 2017. Sovereign debt maturity structure under asymmetric information. Journal of International Economics 108: 243–59. [Google Scholar] [CrossRef]
- Remolona, Eli M., Michela Scatigna, and Eliza Wu. 2007. Interpreting sovereign spreads. BIS Quarterly Review, March 14, 27–39. [Google Scholar]
- Scherr, Frederick C., and Heather M. Hulburt. 2001. The debt maturity structure of small firms. Financial Management 30: 85–111. [Google Scholar] [CrossRef]
- Stohs, Mark Hoven, and David C. Mauer. 1996. The Determinants of Corporate Debt Maturity Structure. The Journal of Business 69: 279–312. [Google Scholar] [CrossRef]
- Wilcoxon, Frank. 1945. Individual comparisons by ranking methods. Biometrics Bulletin 1: 80–83. [Google Scholar] [CrossRef]
- Xie, Yan Alice, Sheen Liu, Chunchi Wu, and Bing Anderson. 2009. The effects of default and call risk on bond duration. Journal of Banking & Finance 33: 1700–8. [Google Scholar]
| 1 | Several papers refer to the countries of the Euro area that are not included within peripheral countries as core countries. See Kalbaska and Gątkowski (2012) in this regard. We consider the following core countries: Germany, Austria, Belgium, Finland, France and the Netherlands. |
| 2 | See also Hardouvelis et al. (2018) who analyze the effects of uncertainty in Greece and obtain similar results in the context of Greek debt crisis. Namely, they find that uncertainty lead to an increase in sovereign bond yields in Greek bonds. |
| 3 | See also Hatchondo et al. (2011) for further analysis of the relationship between duration and sovereign default risk. |
| 4 | The countries more affected by the European debt crisis: Greece, Ireland, Italy, Portugal and Spain. |
| 5 | We have used a scale to transform Moody’s ratings into numerical values. We assign the value 1 to the higher rating quality (Aaa), 2 for the following ranking (Aa1) and so on. |
| 6 | In the case of Europe, the difference between the sovereign 10-year bond yields from a European country and that from the same instrument in Germany is used. |
| 7 | Another measure to quantify the sovereign risk is used by Alesina et al. (1992), who use the ratio of sovereign bond yields to corporate bond yields, as well as the difference between them. |
| 8 | The proxies used to approximate sovereign risk are selected according to data availability. |
| 9 | The ECB provides the average maturity of sovereign debt for the period between 1990 and 2013 but does not include Germany and Spain. These data were obtained from the OECD database and the Spanish Treasury. |
| 10 | The ECB provides the ratio of short and long-term debt over GDP and the volumes of short and long-term debt. To construct the ratio of long-term debt to total debt, we consider total debt to be the sum of short and long-term debt, and we subsequently calculate the ratio. The ECB defines government debt as consolidated gross debt, including all sectors of the economy and excluding financial derivatives and loans. |
| 11 | The debt/GDP provided by the ECB includes all sectors of the economy, including regional and local debt and social security funds. |
| 12 | When there is more than one rating during the year, we calculate the average numerical value of the ratings. If there are favorable prospects, we round the value representing the lowest risk and vice versa. |
| 13 | The values of the Hausman (1978) provide a p-value that leads to the rejection of the null hypothesis in our models. Therefore, we choose to use the fixed effects instead of the random effects estimation. However, the results for the random effects estimation provide similar results to those obtained with the OLS or fixed effects estimation. These results are available upon request to the authors. |
| 14 | These tests are considered to be the most appropriate when the series does not follow a normal distribution and when the population variances are not equal. |
| 15 | We also use the Moody’s sovereign rating to measure sovereign risk, but it does not provide significant results, as this variable does not vary much with time. The results for this variable are available upon request to the authors. |
| 16 | A phenomenon can vary between years for reasons that are not adequately captured by the explanatory variables in the model. Therefore, not controlling for temporal variation may lead to a bias in the results. |
| 17 | We also use the VSTOXX index to approximate international risk aversion. The results do not vary regarding the presented in Table 5. |
Figure 1.
Evolution of Moody’s rating.

Figure 2.
Evolution of 10-year bond yields (1993–2013).

Figure 3.
Evolution of risk premium for peripheral and core countries.

Figure 4.
Maturity structure and yields in peripheral and core countries.

Figure 5.
Average Marginal Effects with level (95)% CIs. Peripheral and core countries (Yields)(I).

Figure 6.
Average Marginal Effects with level (95)% Cls. Peripheral and core countries (Yields)(II).
Figure 6.
Average Marginal Effects with level (95)% Cls. Peripheral and core countries (Yields)(II).

Figure 7.
Average Marginal Effects with level (95)% Cls. Peripheral and core countries (Spreads)(I).
Figure 7.
Average Marginal Effects with level (95)% Cls. Peripheral and core countries (Spreads)(I).

Figure 8.
Average Marginal Effects with level (95)% Cls. Peripheral and core countries (Spreads)(II).
Figure 8.
Average Marginal Effects with level (95)% Cls. Peripheral and core countries (Spreads)(II).

Figure 9.
Average Marginal Effects with level (95)% Cls. Peripheral and core countries (U.S. Spreads)(I).
Figure 9.
Average Marginal Effects with level (95)% Cls. Peripheral and core countries (U.S. Spreads)(I).

Figure 10.
Average Marginal Effects with level (95)% Cls. Peripheral and core countries (U.S. Spreads)(II).
Figure 10.
Average Marginal Effects with level (95)% Cls. Peripheral and core countries (U.S. Spreads)(II).

Figure 11.
Simple slopes for the interaction between debt/GDP ratio and yields.


Table 1.
Summary of the hypotheses.
| Hypotheses | Effect of Sovereign Risk on the Maturity Structure of Sovereign Debt | |
|---|---|---|
| If Risk Increases | If Risk Decreases | |
| H1: A variation in sovereign bond yields or in sovereign risk modifies the maturity structure of sovereign debt. | The maturity structure of sovereign debt is shortened | The maturity structure of sovereign debt is lengthened |
| H2: The relationship between, sovereign bond yields, sovereign risk and the maturity structure differs depending on the country risk level. | The maturity structure is shortened (peripheral countries) | The maturity structure is lengthened (peripheral countries) |
| The maturity structure is lengthened (core countries) | The maturity structure is shortened (core countries) | |
| H3: The indebtedness level of the countries influences the relationship between debt maturity and sovereign bond yields and sovereign risk. | The maturity structure is shortened (highly indebted countries) | The maturity structure is lengthened (highly indebted countries) |
| No relationship (less indebted countries) | No relationship (less indebted countries) | |
This table presents a summary of the hypotheses. The first column presents the assumptions, and columns 2 and 3 then indicate the expected effect of changes in sovereign risk on the maturity structure. Source: own elaboration.
Table 2.
Expected signs of the correlations between the dependent and the explanatory variables.
| Variables | Long-Term Debt to Total Debt Ratio | |
|---|---|---|
| Maturity | Average maturity | + |
| Control Variables | Inflation | + |
| GDP | – | |
| Debt/GDP | – | |
| Borrowing requirements | – | |
| Long-term sovereign bond returns | Yields | – |
| Sovereign risk proxies | Spread | – |
| Spread USA | – | |
| Ratings | – |
This table shows the expected signs for the correlations between the dependent variable (long-term debt to total debt ratio) and the rest of variables, which are divided into control variables, long-term sovereign bond returns and proxies for sovereign risk. Source: own elaboration.
Table 3.
Panel data regression of maturity structure on sovereign bond yields and on sovereign risk.
Table 3.
Panel data regression of maturity structure on sovereign bond yields and on sovereign risk.
| Dependent Variable: Long-Term Debt to Total Debt Ratio | OLS Estimation | Fixed Effects Estimation | ||||
|---|---|---|---|---|---|---|
| Model 1 | Model 2 | Model 3 | Model 4 | Model 5 | Model 6 | |
| Average maturity | 0.0207 *** | 0.0248 *** | 0.0231 *** | 0.0224 * | 0.0222 * | 0.0229 ** |
| (0.00297) | (0.00309) | (0.00300) | (0.0100) | (0.0101) | (0.00995) | |
| GDP (in logs) | −0.0301 *** | −0.0357 *** | −0.0245 *** | −0.0736 | −0.0342 | −0.0421 |
| (0.0109) | (0.00971) | (0.00901) | (0.0496) | (0.0457) | (0.0452) | |
| Debt/GDP | 0.00673 | 0.0210 | 0.0129 | 0.0157 | 0.0386 | 0.0312 |
| (0.0247) | (0.0243) | (0.0243) | (0.0654) | (0.0726) | (0.0717) | |
| Inflation | 0.00156 | 0.00317 | 0.00286 | 0.00418 | 0.00343 | 0.00432 |
| (0.00334) | (0.00338) | (0.00337) | (0.00486) | (0.00538) | (0.00518) | |
| Borrowing requirements | −0.00364 *** | −0.00295 ** | −0.00249 ** | −0.00305 * | −0.00319 * | −0.00262 * |
| (0.00115) | (0.00124) | (0.00126) | (0.00146) | (0.00146) | (0.00136) | |
| Yields | −0.296 * | −0.599 * | ||||
| (0.171) | (0.266) | |||||
| Spread | −0.574 ** | −0.552 * | ||||
| (0.232) | (0.292) | |||||
| Spread USA | −0.603 *** | −0.660 ** | ||||
| (0.220) | (0.249) | |||||
| Constant | 1.173 *** | 1.181 *** | 1.062 *** | 1.725 ** | 1.162 * | 1.271 ** |
| (0.143) | (0.122) | (0.116) | (0.613) | (0.555) | (0.555) | |
| Country fixed effect | No | No | No | Yes | Yes | Yes |
| Observations | 196 | 181 | 196 | 196 | 181 | 196 |
| R-squared | 0.263 | 0.274 | 0.276 | 0.283 | 0.277 | 0.286 |
This table shows the estimates of a panel data regression of the dependent variable and the long-term debt to total debt ratio on sovereign bond yields and on sovereign risk. The variable employed to measure sovereign yields is the 10-year government bond yields (Yields). The variables to measure sovereign risk are the risk premiums between 10-year bond yields and German bond yields of the same maturity (Spread) and the risk premiums for the benchmark of 10-year U.S. bonds (Spread USA)15. The control variables considered are the inflation, the logarithm of GDP, the debt/GDP ratio, the average maturity of sovereign debt and the borrowing requirements of public administrations as a share of the GDP. We present the OLS and fixed effect estimations. The R-squared shown in the table represents the within R-squared. Robust standard errors in parentheses. *** p < 0.01, ** p < 0.05, * p < 0.1.
Table 4.
Panel data regression of maturity structure on sovereign bond yields and sovereign risk with time dummy variables and a time trend.
Table 4.
Panel data regression of maturity structure on sovereign bond yields and sovereign risk with time dummy variables and a time trend.
| Dependent Variable: Long-Term Debt to Total Debt Ratio | Model 1 | Model 2 | Model 3 | Model 4 | Model 5 | Model 6 |
|---|---|---|---|---|---|---|
| Average maturity | 0.0239 ** | 0.0250 ** | 0.0237 * | 0.0228 * | 0.0239 ** | 0.0242 ** |
| (0.0106) | (0.00994) | (0.0108) | (0.0104) | (0.0106) | (0.0100) | |
| GDP (in logs) | 0.0620 | 0.0438 | 0.0381 | 0.000112 | 0.0620 | 0.0358 |
| (0.146) | (0.133) | (0.167) | (0.143) | (0.146) | (0.134) | |
| Debt/GDP | 0.0658 | 0.0599 | 0.0679 | 0.0496 | 0.0658 | 0.0583 |
| (0.0955) | (0.102) | (0.0936) | (0.0990) | (0.0955) | (0.101) | |
| Inflation | 0.00712 | 0.00475 | 0.00762 | 0.00326 | 0.00712 | 0.00418 |
| (0.00472) | (0.00482) | (0.00508) | (0.00511) | (0.00472) | (0.00506) | |
| Borrowing requirements | −0.000913 | −0.00252 | −0.000871 | −0.00314 * | −0.000913 | −0.00250 |
| (0.00205) | (0.00146) | (0.00207) | (0.00152) | (0.00205) | (0.00139) | |
| Yields | −0.696 ** | −0.735 ** | ||||
| (0.306) | (0.255) | |||||
| Spread | −0.713 ** | −0.550 * | ||||
| (0.305) | (0.292) | |||||
| Spread USA | −0.696 ** | −0.666 ** | ||||
| (0.306) | (0.253) | |||||
| Constant | −0.0262 | 0.230 | 0.210 | 0.730 | −0.0858 | 0.276 |
| (1.850) | (1.710) | (2.090) | (1.820) | (1.853) | (1.722) | |
| Time fixed effects | Yes | No | Yes | No | Yes | No |
| Trend | No | Yes | No | Yes | No | Yes |
| Observations | 196 | 196 | 181 | 181 | 196 | 196 |
| R-squared | 0.429 | 0.305 | 0.278 | 0.283 | 0.429 | 0.295 |
This table shows the estimates of a panel data regression of the dependent variable, long-term debt to total debt ratio on sovereign bond yields and on sovereign risk. The variable employed to measure sovereign yields is the 10-year government bond yields (Yields). The variables to measure sovereign risk are the risk premiums between 10-year bond yields and German bond yields of the same maturity (Spread) and the risk premiums for the benchmark of 10-year U.S. bonds (Spread USA). The explanatory variables that were considered are inflation, the logarithm of GDP and debt/GDP ratio, the average maturity of sovereign debt and the borrowing requirements of public administrations as a share of the GDP. We included time dummy variables and a time trend to control for the time variability in the variables. The results were obtained using the fixed effects estimation. The R-squared shown in the table represents the within R-squared. Robust standard errors in parentheses. ** p < 0.05, * p < 0.1.
Table 5.
Panel data regression of maturity structure on sovereign bond yields and on sovereign risk (robustness test).
Table 5.
Panel data regression of maturity structure on sovereign bond yields and on sovereign risk (robustness test).
| Dependent Variable: Long-term Debt to Total Debt Ratio | Model 1 | Model 2 | Model 3 |
|---|---|---|---|
| Average maturity | 0.00313 | 0.00274 | 0.00313 |
| (0.00299) | (0.00281) | (0.00299) | |
| GDP (in logs) | 0.121 | 0.105 | 0.121 |
| (0.0844) | (0.111) | (0.0844) | |
| Debt/GDP | 0.0363 | 0.0391 | 0.0363 |
| (0.0564) | (0.0541) | (0.0564) | |
| Inflation | 0.0118 ** | 0.0121 ** | 0.0118 ** |
| (0.00407) | (0.00443) | (0.00407) | |
| Borrowing requirements | −0.000651 | −0.000574 | −0.000651 |
| (0.00171) | (0.00174) | (0.00171) | |
| Yields | 0.172 | ||
| (0.330) | |||
| Spread | 0.142 | ||
| (0.340) | |||
| Spread USA | 0.172 | ||
| (0.330) | |||
| VIX | −0.00196 | −0.00203 | −0.00195 |
| (0.00118) | (0.00129) | (0.00117) | |
| LTROs (in logs) | −0.0275 ** | −0.0264 ** | −0.0275 ** |
| (0.00938) | (0.0105) | (0.00943) | |
| Constant | −0.208 | 0.00442 | −0.194 |
| (1.065) | (1.327) | (1.071) | |
| Time fixed effects | Yes | Yes | Yes |
| Observations | 144 | 132 | 144 |
| R-squared | 0.439 | 0.423 | 0.440 |
This table shows the estimates of a panel data regression of the dependent variable, long-term debt to total debt ratio on sovereign bond yields and on sovereign risk. The variable employed to measure sovereign yields is the 10-year government bond yields (Yields). The variables to measure sovereign risk are the risk premiums between 10-year bond yields and German bond yields of the same maturity (Spread) and the risk premiums for the benchmark of 10-year U.S. bonds (Spread USA). The explanatory variables that were considered are inflation, the logarithm of GDP and debt/GDP ratio, the average maturity of sovereign debt and the borrowing requirements of public administrations as a share of the GDP. We controlled for the international risk aversion using the volatility index (VIX index)17 and for the long-term refinancing operations (LTROs) of the Eurosystem. We included time dummy variables to control for the time variability in the variables in all models. The results were obtained using the fixed effects estimation. The R-squared shown in the table represents the within R-squared. Robust standard errors in parentheses. ** p < 0.05.
Table 6.
Difference in means and medians of risk premiums between peripheral and core countries.
| Group of Countries | Mean | Median |
|---|---|---|
| Peripheral countries | 0.029 | 0.010 |
| Core countries | 0.004 | 0.002 |
| Wilcoxon rank-sum test | 0.000 *** | |
| K-sample equality-of-medians test | 0.000 *** |
The table shows the results of the tests of differences in means (Wilcoxon rank-sum test) and medians (K-sample equality-of-medians test) for the variable risk premium. *** p < 0.01.
Table 7.
Panel data regression of maturity structure on sovereign bond yields and on sovereign risk distinguishing between peripheral and core countries.
Table 7.
Panel data regression of maturity structure on sovereign bond yields and on sovereign risk distinguishing between peripheral and core countries.
| Dependent Variable: Long-term Debt to Total Debt Ratio | Model 1 | Model 2 | Model 3 |
|---|---|---|---|
| Average maturity | 0.0296 *** | 0.0358 *** | 0.0330 *** |
| (0.00548) | (0.00592) | (0.00501) | |
| GDP (in logs) | −0.0111 | −0.0297 *** | −0.0160 |
| (0.0131) | (0.00920) | (0.0132) | |
| Debt/GDP | −0.0176 | −0.0105 | −0.0208 |
| (0.0503) | (0.0461) | (0.0489) | |
| Inflation | 0.0154 | 0.0126 | 0.00887 |
| (0.0132) | (0.0121) | (0.0127) | |
| Borrowing requirements | 0.00109 | 0.000554 | 0.00125 |
| (0.00216) | (0.00204) | (0.00228) | |
| Yields | 1.456 *** | ||
| (0.492) | |||
| Spread | 0.320 | ||
| (1.556) | |||
| Spread USA | 0.133 | ||
| (1.384) | |||
| Peripheral | 0.0229 | −0.0429 * | −0.0597 ** |
| (0.0221) | (0.0243) | (0.0240) | |
| PeripheralxYields | −1.918 *** | ||
| (0.546) | |||
| PeripheralxSpread | −0.976 | ||
| (1.374) | |||
| PeripheralxSpreadUSA | −0.571 | ||
| (1.126) | |||
| Constant | 0.683 *** | 1.010 *** | 0.879 *** |
| (0.197) | (0.138) | (0.156) | |
| Time fixed effects | Yes | Yes | Yes |
| Observations | 196 | 181 | 196 |
| R-squared | 0.484 | 0.389 | 0.377 |
This table shows the estimates of a panel data regression of the dependent variable, long-term debt to total debt ratio on sovereign bond yields and on sovereign risk. The variable employed to measure sovereign yields is the 10-year government bond yields (Yields). The variables to measure sovereign risk are the risk premiums between 10-year bond yields and German bond yields of the same maturity (Spread) and the risk premiums for the benchmark of 10-year U.S. bonds (Spread USA). The explanatory variables that were considered are inflation, the logarithm of GDP and debt/GDP ratio, the average maturity of sovereign debt and the borrowing requirements of public administrations as a share of the GDP. We included time dummy variables to control for the time variability in the variables in all models. We included the interaction between the sovereign bond yields and sovereign spreads and a dummy variable that is equal to one for peripheral countries and zero otherwise. The R-squared shown in the table represents the within R-squared. Robust standard errors in parentheses. *** p < 0.01, ** p < 0.05, * p < 0.1.
Table 8.
Panel data regression of maturity structure on sovereign bond yields and on sovereign risk distinguishing by the debt level.
Table 8.
Panel data regression of maturity structure on sovereign bond yields and on sovereign risk distinguishing by the debt level.
| Dependent Variable: Long-term Debt to Total Debt Ratio | Model 1 | Model 2 | Model 3 |
|---|---|---|---|
| Average maturity | 0.0237 * | 0.0258 * | 0.0252 ** |
| (0.0105) | (0.0114) | (0.0109) | |
| GDP (in logs) | 0.0851 | 0.0400 | 0.0672 |
| (0.151) | (0.174) | (0.150) | |
| Inflation | 0.00583 | 0.00518 | 0.00499 |
| (0.00427) | (0.00503) | (0.00477) | |
| Borrowing requirements | −0.00123 | −0.00180 | −0.00173 |
| (0.00183) | (0.00180) | (0.00175) | |
| Yields | 1.191 | ||
| (0.878) | |||
| Spread | 1.425 | ||
| (1.412) | |||
| Spread USA | −1.206 | ||
| (0.793) | |||
| Debt/GDP | 0.180 ** | 0.0995 | 0.0900 |
| (0.0773) | (0.0895) | (0.0908) | |
| Debt/GDPxYields | −1.436 ** | ||
| (0.547) | |||
| Debt/GDPxSpread | −1.464 | ||
| (0.891) | |||
| Debt/GDPxSpreadUSA | −1.206 | ||
| (0.793) | |||
| Constant | −0.506 | 0.128 | −0.197 |
| (1.916) | (2.175) | (1.907) | |
| Time fixed effects | Yes | Yes | Yes |
| Observations | 196 | 181 | 196 |
| R-squared | 0.482 | 0.456 | 0.451 |
This table shows the estimates of a panel data regression of the dependent variable, long-term debt to total debt ratio on sovereign bond yields and on sovereign risk. The variable employed to measure sovereign yields is the 10-year government bond yields (Yields). The variables to measure sovereign risk are the risk premiums between 10-year bond yields and German bond yields of the same maturity (Spread) and the risk premiums for the benchmark of 10-year U.S. bonds (Spread USA). The explanatory l variables that were considered are inflation, the logarithm of GDP and debt/GDP ratio, the average maturity of sovereign debt and the borrowing requirements of public administrations as a share of the GDP. We included time dummy variables to control for the time variability in the variables in all models. We included the interaction between the sovereign bond yields and sovereign spreads and the debt/GDP ratio. The R-squared shown in the table represents the within R-squared. Robust standard errors in parentheses. ** p < 0.05, * p < 0.1.
© 2018 by the authors. Licensee MDPI, Basel, Switzerland. This article is an open access article distributed under the terms and conditions of the Creative Commons Attribution (CC BY) license (http://creativecommons.org/licenses/by/4.0/).
Share and Cite
MDPI and ACS Style
González-Fernández, M.; González-Velasco, C. Bond Yields, Sovereign Risk and Maturity Structure. Risks 2018, 6, 109. https://doi.org/10.3390/risks6040109
AMA Style
González-Fernández M, González-Velasco C. Bond Yields, Sovereign Risk and Maturity Structure. Risks. 2018; 6(4):109. https://doi.org/10.3390/risks6040109
Chicago/Turabian StyleGonzález-Fernández, Marcos, and Carmen González-Velasco. 2018. "Bond Yields, Sovereign Risk and Maturity Structure" Risks 6, no. 4: 109. https://doi.org/10.3390/risks6040109
Note that from the first issue of 2016, this journal uses article numbers instead of page numbers. See further details here.