Abstract
We study the jump behaviour in the sovereign risks of major oil-exporting countries and examine whether it is affected by jumps in the price and volatility of crude oil. Data used are daily from 14 February 2011, to 31 July 2019. We detect the presence of jumps in many oil exporters and find evidence of less frequent jumps in the crude oil market. The jumps in sovereign risks of oil-exporters are significantly affected by oil volatility jumps, not by oil price jumps. These findings suggest that the sovereign risks of oil-exporters are affected by abrupt movements in oil implied volatility, which points to a contagion effect. The findings are useful not only for refining the prediction of the sovereign risks of oil-exporters but also in reducing the potential effect of price discontinuity of sovereign risks on public finances sustainability and financial health.
JEL Classification:
C22; G10
1. Introduction
Long-term macroeconomic stabilisation and fiscal sustainability are key elements of sustainable development policies. This is especially relevant to oil-exporting countries, where oil prices often shape energy export revenues, government expenditure, and fiscal balances. In fact, higher oil prices improve the public finances sustainability and the financial health of oil-exporters. This, in turn, leads to an improvement in the solvency of those countries. In contrast, lower oil prices often reduce the debt repayment ability in oil-exporting countries, which increases the cost of insuring exposure to sovereign bonds. Recently, the economies of oil-exporters seem to have reached a turning point with the recent deterioration in their financial sustainability. The oil price crash of 2014–2016 drove significant debate about the adverse impact of lower oil prices on the sovereign credit risk of oil-exporting countries (Shahzad et al. 2017; Bouri et al. 2018, 2019), which might suggest that the state of oil market conditions has the ability to support or damage sovereign creditworthiness and thus sovereign sustainability.
Default probabilities and investors’ perceptions of sovereign credit risk are generally reflected in the sovereign credit default swap (CDS) spreads that represent the cost of buying default protection against a sovereign entity (Koutmos 2019). The CDS contract is a very popular credit derivative security that is used by financial institutions to hedge their underlying bond exposures or to speculate on credit risk (Koutmos 2019). As in other financial markets, the arrival of new information in the CDS markets might induce rapid changes in spreads, called “jumps” or price discontinuities. For example, in response to negative shocks surrounding the sovereign debt, public finances, or other key economic and financial variables, investors in sovereign bonds may rush to buy default protection, leading to a jump in the sovereign CDS spreads and thus in the sovereign borrowing costs.
Surprisingly, the empirical evidence on the jump behaviour in the sovereign CDS markets is very limited, especially for oil-exporting countries. In such oil-dependent economies, crude oil exportation represents a major source of revenue1, and many studies highlight the importance of the crude oil market conditions to the sovereign risk of major oil-exporting economies (Sharma and Thuraisamy 2013; Bouri et al. 2017, 2018, 2019; Shahzad et al. 2017). Accordingly, one would expect jumps in sovereign CDS spreads of oil-exporting economies to be related to with jumps in crude oil prices and implied volatility. This assumption is relevant given that the period of the oil price crash of 2014–2016 witnessed sharp declines in crude oil prices, spikes in the implied volatility of crude oil prices as measured by the crude oil implied volatility index (OVX), and increases in the sovereign risk of some major oil-exporting economies. Remarkably, studies considering the price discontinuity in the sovereign CDS markets and its relationship with price discontinuities in the crude oil market are unprecedented.
In this paper, we address this research gap while answering the following questions: How often do jumps occur is sovereign CDS markets of oil exporters? What are their main characteristics in terms of occurrence and size? Are jumps in sovereign CDS markets of oil exporters affected by jumps in crude oil market conditions? From an econometric standpoint, we detect the presence of jumps in the CDS and oil markets via the semi-parametric approach of Laurent et al. (2016). This approach has been taken by recent studies (Charles and Darné 2017; Collet and Ielpo 2018), and has the ability to detect and date-stamp jumps in various markets. We use logistic regressions to examine the effect of jumps in the crude oil market on the jumps in the sovereign CDS spreads, which helps in making inferences regarding the impact of price discontinuities in the crude oil market on the price discontinuity in the sovereign risk of oil-exporters.
Our analysis would help investors, policymakers, and scholars refine their limited understanding of the factors affecting discontinuities in the price of sovereign default protection of oil-exporting economies. This is useful to investors, given that jumps can affect the structure of losses and profits related to their positions in the sovereign CDS markets. In fact, several studies indicate the presence of jumps in the crude oil market (see, among others, Wilmot and Mason 2013; Charles and Darné 2017; Chevallier and Ielpo 2014), implying the importance of detecting jumps for the sake of risk and portfolio management (Clements and Liao 2017; Ma et al. 2019). Such an analysis would also help policymakers in refining their policies regarding energy and public finance sustainability. For example, our analysis can help policymakers in managing and reducing the potential effect of price discontinuity of crude oil prices and volatility on sovereign risks and thus on public finances sustainability.
Our paper is related to the literature dealing with jumps in financial assets (Dungey and Hvozdyk 2012; Chevallier and Ielpo 2014; Gilder et al. 2014; Ma et al. 2019), including crude oil prices (Wilmot and Mason 2013; Charles and Darné 2017; Maslyuk-Escobedo et al. 2017) and their volatility. However, our current paper differs in its focus on the understudied sovereign CDS markets of major oil-exporting countries that are dependent on oil exports, and in relating jumps in sovereign CDS spreads to the jump behaviour in crude oil prices and implied volatility.
Our analyses show the following results. Firstly, there is strong evidence that the spreads of sovereign risks of oil exporters are jumpy. Secondly, more frequent jumps occur in the oil implied volatility index than in crude oil prices. Thirdly, the jump behaviour of sovereign risks is affected by jumps in the volatility of crude oil.
2. Research Background
The importance of jumps for asset pricing has been highlighted in the academic literature since the seminal work of Merton (1976). Most financial variables, including crude oil price series, exhibit fat tails in their return distributions (e.g., Wilmot and Mason 2013), and the academic literature highlights the role of jumps in capturing the empirical properties of an asset and in modelling volatility dynamics (Eraker et al. 2003; Driessen and Maenhout 2013). Recently, the empirical literature on the jump behaviour of assets has flourished, providing important implications for risk management, asset allocation and derivatives pricing (Oliva and Renò 2018; Ma et al. 2019).
The presence of jumps in conventional assets such as equities, currencies, and commodities is well documented (Bollerslev et al. 2008; Chevallier and Ielpo 2014; Gilder et al. 2014; Ma et al. 2019). However, the jump behaviour in sovereign CDS markets is extremely understudied, especially for oil-exporting economies. Such economies benefit from high oil prices, given their reliance on the revenues of crude oil exports. In fact, higher revenues from crude oil exports enhance government spending and economic activity and strengthen the budget balance (e.g., El Anshasy and Bradley 2012; Bouri et al. 2017, 2019). Further motivation regarding potential relationships between crude oil and sovereign credit risk markets are given in the recent academic literature. For example, Sharma and Thuraisamy (2013) show that oil price volatility Granger causes the sovereign CDS spreads of Asian economies. Liu et al. (2016) indicate that oil price volatility can increase the volatility of the country risk rating of oil-exporters. Bouri et al. (2017) report evidence of a significant association between the volatility of commodities and energy commodities and the sovereign risk of oil-exporters such as Russia and Brazil. Shahzad et al. (2017) show that the volatility of crude oil prices can predict the CDS spreads of oil-exporting countries. Lee et al. (2017) show that country risk in oil-exporters (Canada, UK) is shaped by crude oil returns. Bouri et al. (2019) show that the sovereign CDS spreads of MENA oil-exporters and importers are directionally predicted by shocks in oil prices and oil volatility. Furthermore, they indicate that the impact of shocks in oil prices and oil volatility occurs in a very short time span. Van Eyden et al. (2019) indicate that crude oil-producers are adversely affected by oil price volatility. Interestingly, the oil price crash of 2014–2016 drove debate about the adverse impact of lower oil prices on the sovereign credit risk of oil-exporting countries. For example, Bouri et al. (2017, 2018, 2019) argue that crude oil volatility is a common risk factor for the sovereign risk of oil-exporting countries, especially during the oil price crash of 2014–2016. However, less is known about whether the CDS spreads of oil-exporters are jumpy or whether their jumps are affected by with jumps in crude oil prices and the oil implied volatility index. This is where we provide our main contribution.
3. Data Description
Our daily dataset comprises CDS spreads for seven main oil-exporters (Russia, Brazil, South Africa, Abu Dhabi, Dubai, Kazakhstan, and Mexico)2. It also comprises Brent crude oil spot prices and the crude oil implied volatility index (OVX). The latter is computed by the Chicago Board Options Exchange (CBOE), reflecting market expectations of the 30-day implied volatility of oil prices. Following the related literature, spreads of five-year sovereign CDS contracts are used, as these contracts are the most liquid (Bouri et al. 2019). All data series are sourced from DataStream and cover the period 14 February 2011, to 31 July 2019. The starting date is constrained by the lack of liquidity in some CDS spreads before 14 February 2011. Interestingly, our sample period includes the period from 30 June 2014, to 29 February 2016, during which crude oil prices decreased sharply and crude oil implied volatility spiked, reflecting heightened uncertainty in the crude oil market. At the same time, the sovereign risk of many oil-exporting countries increased, reflecting instability and decline in external revenues from oil exportation (see Figure A1 in the Appendix A). The empirical analyses are conducted with logarithmic-returns of crude oil prices, changes in oil implied volatility, and changes in sovereign CDS spreads3.
Table 1 shows the summary statistics for those data series, where the oil exporters have a negative mean CDS. Russia has the highest mean CDS spread and the highest standard deviation. Regarding crude oil and OVX, the former has a negative mean return, whereas the latter has a positive mean. The presence of large kurtosis in all cases, especially in CDS spreads, generally points to the presence of extreme events. Table 1 also presents the results of the augmented Dickey-Fuller (ADF) test, which indicates that all series are stationary at the 1% significance level. The ARCH-LM test (Engle 1982) with 10 lags indicates that all series exhibit evidence of heteroskedasticity, suggesting the appropriateness of using GARCH-based models to capture volatility clustering and persistence.

Table 1.
Summary statistics and unit root results.
Table 2 presents the pairwise correlation coefficients between the changes in sovereign CDS spreads and each of crude oil returns and changes in oil volatility. Generally, the correlation is weakly negatively between most of the changes in sovereign CDS spreads and crude oil returns. The strongest correlations are seen for Abu Dhabi, Kazakhstan, and Russia, while the weakest correlation is reported for Mexico. Regarding the correlation between the changes in sovereign CDS spreads and changes in oil volatility, it is positive and stronger than that for crude oil returns. The highest (lowest) correlation is shown for Mexico (Abu Dhabi).
Table 2.
Pairwise correlation matrix.
4. Methodology
We detect jumps via the semi-parametric test of Laurent et al. (2016)4, which is used by many studies focusing on various financial markets (Charles and Darné 2017; Collet and Ielpo 2018). Then, the effect of oil price/volatility jumps on the jumps in sovereign CDS spreads is studied using logistic regressions.
4.1. Testing for Jumps
Let (rt) be a random return described by an AR(1)-GJR-GARCH(1,1) model such as:
where and are, respectively, the conditional mean and the conditional variance of , is the residual term (), and is the white noise process. takes the value of 1 if . The observed returns can be written as:
where, is an independent jump component, is a binary variable equal to 1 in the case of a jump and 0 otherwise, represents the jump size. Notably, the conditional variance at t+1 ( is not affected by (Laurent et al. 2016).
Given the bounded innovation propagation (BIP)-AR(1) of Muler et al. (2009) and the BIP-GARCH(1,1) of Muler and Yohai (2008), the estimates of and (respectively and ) are obtained. They are robust to potential jumps.
The standardized return on day t is given by:
Accordingly, it is possible to test for the presence of jumps by testing against . The null hypothesis is rejected if , where is the maximum of for and gT,λ is the critical value. In the case of the rejection of the null hypothesis, Laurent et al. (2016) propose the following binary variable:
where I(.) is the indicator function, with equals one if a jump is detected on day t.
4.2. Studying the Effect of Oil Price/Volatility Jumps on the Jumps in Sovereign CDS Spreads
We apply a logistic regression to the detected jumps. The dependent variable is a binary variable taking the value of 1 when there is a jump in the sovereign CDS spreads of country i (i = 1, 2…7) and 0 otherwise. The effect of oil price jumps on the jumps in sovereign CDS spreads is estimated in Equation (6) as follows:
where is a binary variable representing the occurrence of a jump in oil price at time t−1.
As for the effect of oil volatility jumps on the jumps in sovereign CDS spreads, it is estimated in Equation (7) as follows:
where is a binary variable representing the occurrence of a jump in oil volatility at time t−1.
In Equations (6) and (7), the distribution of the residual term (ϵt) tracks the logistic regression.
5. Results and Discussion
5.1. Results for Jumps
We first examine jumps in sovereign CDS markets. Table 3 presents statistics of the detected jumps, while Figure A2 in the Appendix A shows the jumps on the series. Jumps are more present in certain CDS spreads than others. For example, the largest number of jumps are shown for Dubai (217) and Abu Dhabi (177), representing 9.82% and 8.02% of days, respectively. In contrast, Mexico and South Africa show relatively fewer jumps (26 and 29), representing 1.18% and 1.31% of days, respectively. This finding suggests that jumps do occur much more frequently in Dubai and Abu Dhabi than other cases such as Mexico and South Africa. Furthermore, the largest proportion of the jump activity in CDS spreads occurs in 2015, which can be related to the large fluctuations in the crude oil market during the period June 2014–February 2016, when crude oil prices decreased by almost 70%, driven by a slowdown in global economic activity as well as supply and demand shocks in the oil market. The overall results indicate evidence of infrequent rapid changes in the CDS spreads, which might suggest the need to account for such changes in any volatility modelling and risk measures. Not accounting for such infrequent rapid changes in the CDS spreads (i.e., jumps) can make the tails fatter, which in turn might magnify risk measures and affect options pricing (Clements and Liao 2017; Oliva and Renò 2018; Ma et al. 2019).
Table 3.
Statistics of jumps.
Considering the crude oil market, the number of jumps is much lower than in the CDS markets, especially jumps in oil prices as compared to jumps in oil implied volatility. In fact, OVX and crude oil have jumped with a proportion of 1.31% and 0.82%, respectively.
To show the impact of jumps on the series under study, we report in Table 4 the correlations between the jump-filtered series (i.e., series without jumps), which can be compared to the correlations between the raw series previously shown in Table 2. Table 4 shows large differences in the correlations, especially between the jump filtered series of the changes in sovereign CDS spreads and changes in oil volatility. This might suggest that jumps tend to occur at the same time between CDS spreads and oil implied volatility, which intensifies the correlations.
Table 4.
Pairwise correlation between the jump-filtered series.
5.2. Results of the Effect of Oil Price/Volatility Jumps on the Jumps in Sovereign CDS Spreads
We present the results of the effect of oil price/volatility jumps on the jumps in sovereign CDS spreads, using the logistic regression described in Section 4.2. The results are reported in Table 5. They show that the jump activity in sovereign CDS markets (except for Dubai) is positively affected by jumps in OVX. Accordingly, today’s occurrence of a jump in the oil volatility index increases the likelihood of having a jump on the next day in the sovereign risks of oil exporters. In contrast, the effect of oil price jumps on the jumps in sovereign CDS spreads is insignificant, suggesting that today’s jump in sovereign risk is independent of tomorrow’s jump in oil prices. Given that the OVX and crude oil prices are often seen as suitable hedges for some conventional assets such as global equity indices, the findings have potential implications for whether the OVX or crude oil price is more suitable for diversifying sharp fluctuations, i.e., jumps, in the sovereign CDS markets. The fact that jumps in CDS spreads and crude oil prices are independent can be appreciated by investors as it may indicate the possibility of using crude oil prices as a diversifier of the risk of jumps in sovereign CDS spreads of major oil exporters6.
Table 5.
Analysis of the effect of oil price/volatility jumps on the jumps in credit default swap (CDS) spreads.
Taken together, the above results indicate that jumps in most sovereign CDS spreads are positively affected by the probability of the occurrence of jumps in the OVX. For example, the occurrence of today’s jumps in the Russian CDS spread increases with the tomorrow’s presence of jumps in the OVX, whereas it is independent of the occurrence of jumps in crude oil prices. This finding generally accords with previous evidence showing significant volatility predictability of the CDS spreads of oil exporters based on crude oil volatility (Bouri et al. 2017, 2018, 2019; Shahzad et al. 2017). The results can also be related to the contagion effect in the price discontinuity between equity markets (e.g., Jawadi et al. 2015). However, in our case, the effect is significant between the sovereign risk of oil exporters and the uncertainty in the crude oil market, an unprecedented finding.
We assess the robustness of our results against the choice of the volatility index. To this end, we use the realized volatility of crude oil futures, calculated using the method of Andersen and Bollerslev (1998), based on 5-min data (Sévi 2014). Unreported results based on the methods described in Section 4 confirm our main findings that jumps in the sovereign CDS spreads of major oil-exporters are affected by the jumps in the volatility of crude oil prices.
6. Concluding Remarks
A financially sustained government is supposed to pursue its ongoing public benefit missions while meeting its financial obligations on time. Remarkably, in oil-exporting countries, this financial capacity is mostly shaped by oil export revenues that in turn affect the sovereign borrowing costs. Undoubtedly, higher oil prices improve the financial health of oil-exporting countries and thus the public finance sustainability. However, if abrupt movements in crude oil prices and volatility can spill over to the sovereign risk of oil-exporters and heighten its level, the sovereign borrowing costs in international capital markets can be adversely affected, which jeopardizes the financial stability of oil-exporters. In this paper, we determine the presence of jumps in the sovereign CDS spreads of major oil exporters and associate it to the jumps in crude oil market conditions. Such an analysis would put more emphasis on potential implications regarding energy policy and public finance sustainability. The empirical results show evidence of jumps in the CDS spreads of major oil exporters, whereas less frequent jumps occur in crude oil prices and volatility. Importantly, we show that jumps in sovereign risks are positively affected by jumps in crude oil volatility, whereas they are independent of jumps in crude oil prices. This interesting finding suggests that the sovereign risks of oil exporters are affected by events that disrupt crude oil implied volatility, which points to a contagion between the sovereign CDS and oil market uncertainty. This finding has implications regarding macroeconomic stabilisation and financial sustainability, which is reflected in the adverse impact of price discontinuities in oil volatility on the sovereign credit risk of oil-exporters. Given that sovereign CDS spreads reflect the credit quality of the sovereign issuer and potentially the level of risk in the financial system, understanding the jump behaviour in sovereign CDS spreads and the possibility to predict it by jumps in oil implied volatility are important elements of policy formulation and public finance sustainability. The fact that more sustainable governments are less risky and face lower financing costs (Capelle-Blancard et al. 2019) suggests that the positive association between the jumps in sovereign risk and crude oil volatility can adversely affect public finance sustainability. This requires prudential policy actions that might include the reduction of the country’s dependence on oil and the diversification of its economic resources. Each of these two potential actions can act as a buffer against jump spillovers from the oil volatility to the sovereign risk of oil-exporters. In fact, it can make a country less risky and less susceptible to face higher financing costs, enhancing its level of financial sustainability. Our main findings also matter to portfolio managers and speculators, who would benefit from identifying the drivers of sovereign risks, especially in oil-exporters where crude oil uncertainty seems to affect energy security and sometimes social-political stability. For example, speculators might make profits from hunting for jumps in the CDS spreads of an oil-exporter based on jumps in the oil implied volatility index. Furthermore, the main findings imply not only the need to account for price discontinuities in modelling the spreads of sovereign risks but also the need to account for the effect of price discontinuity of crude oil volatility on that of sovereign risks of oil exporters. Such implications affect asset and option pricing (Driessen and Maenhout 2013; Clements and Liao 2017) and refine the predictability of models (Oliva and Renò 2018) involving crude oil volatility and sovereign CDS spreads of large oil exporters.
A natural extension of our current study would be to consider whether OPEC news and macroeconomic news could affect jumps in sovereign risk and crude oil markets. Another extension would involve adding jumps to the model of Capelle-Blancard et al. (2019).
Funding
The author acknowledges the financial support of the CNRS-L/USEK. The views and opinions articulated in this paper are solely those of the author and do not necessarily reflect those of the CNRS-L or USEK.
Conflicts of Interest
The author declares no conflict of interest.
Appendix A
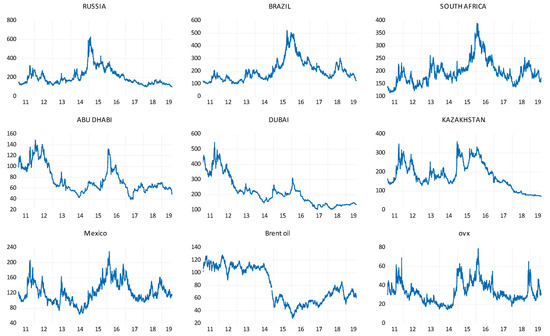
Figure A1.
Plots of level series of sovereign CDS spreads, crude oil prices, and oil implied volatility.
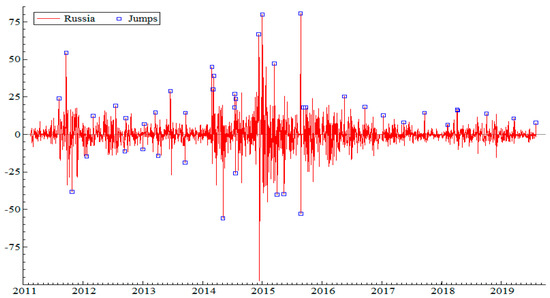
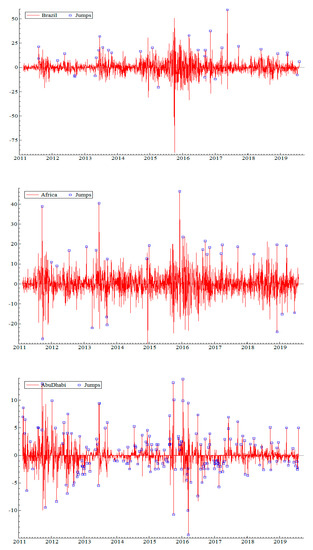
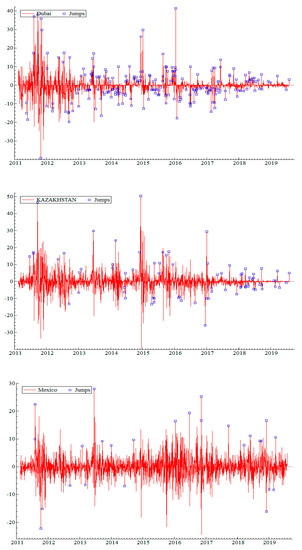
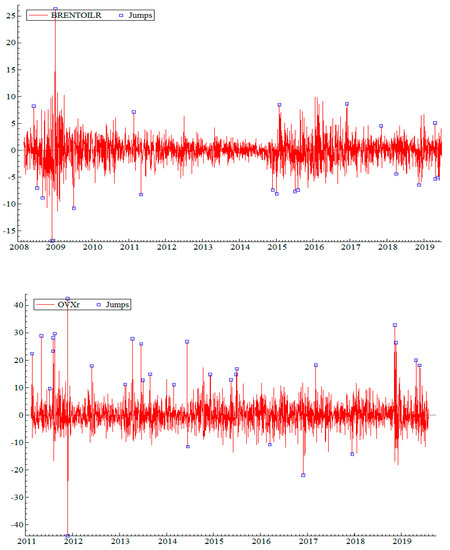
Figure A2.
Jumps in the series of changes in sovereign CDS spreads, returns of crude oil, and changes in oil implied volatility.
References
- Andersen, Torben G., and Tim Bollerslev. 1998. Answering the skeptics: yes, standard volatility models do provide accurate forecasts. International Economic Review 39: 885–905. [Google Scholar] [CrossRef]
- Bollerslev, Tim, Tzuo Hann Law, and George Tauchen. 2008. Risk, jumps, and diversification. Journal of Econometrics 144: 234–56. [Google Scholar] [CrossRef]
- Bouri, Elie, Imad Kachacha, and David Roubaud. 2019. Oil market conditions and sovereign risk in MENA oil exporters and importers. Energy Policy. [Google Scholar] [CrossRef]
- Bouri, Elie, Maria E. de Boyrie, and Ivelina Pavlova. 2017. Volatility transmission from commodity markets to sovereign CDS spreads in emerging and frontier countries. International Review of Financial Analysis 49: 155–65. [Google Scholar] [CrossRef]
- Bouri, Elie, Syed Jawad Hussain Shahzad, Naveed Raza, and David Roubaud. 2018. Oil volatility and sovereign risk of BRICS. Energy Economics 70: 258–69. [Google Scholar] [CrossRef]
- Capelle-Blancard, Gunther, Patricia Crifo, Marc-Arthur Diaye, Rim Oueghlissi, and Bert Scholtens. 2019. Sovereign bond yield spreads and sustainability: An empirical analysis of OECD countries. Journal of Banking & Finance 98: 156–69. [Google Scholar]
- Charles, Amélie, and Olivier Darné. 2017. Forecasting crude-oil market volatility: Further evidence with jumps. Energy Economics 67: 508–19. [Google Scholar] [CrossRef]
- Chevallier, Julien, and Florian Ielpo. 2014. Twenty years of jumps in commodity markets. International Review of Applied Economics 28: 64–82. [Google Scholar] [CrossRef]
- Clements, Adam, and Yin Liao. 2017. Forecasting the variance of stock index returns using jumps and cojumps. International Journal of Forecasting 33: 729–42. [Google Scholar] [CrossRef]
- Collet, Jerome, and Florian Ielpo. 2018. Sector spillovers in credit markets. Journal of Banking & Finance 94: 267–78. [Google Scholar]
- Driessen, Joost, and Pascal J. Maenhout. 2013. The world price of jump and volatility risk. Journal of Banking & Finance 37: 518–36. [Google Scholar]
- Dungey, Mardi, and Lyudmyla Hvozdyk. 2012. Cojumping: Evidence from the US Treasury bond and futures markets. Journal of Banking & Finance 36: 1563–75. [Google Scholar]
- El Anshasy, Amany A., and Michael D. Bradley. 2012. Oil prices and the fiscal policy response in oil-exporting countries. Journal of Policy Modeling 34: 605–20. [Google Scholar] [CrossRef]
- Engle, Robert F. 1982. Autoregressive conditional heteroscedasticity with estimates of the variance of United Kingdom inflation. Econometrica: Journal of the Econometric Society 50: 987–1007. [Google Scholar] [CrossRef]
- Eraker, Bjørn, Michael Johannes, and Nicholas Polson. 2003. The impact of jumps in volatility and returns. The Journal of Finance 58: 1269–300. [Google Scholar] [CrossRef]
- Gilder, Dudley, Mark B. Shackleton, and Stephen J. Taylor. 2014. Cojumps in stock prices: Empirical evidence. Journal of Banking & Finance 40: 443–59. [Google Scholar]
- Jawadi, Fredj, Waël Louhichi, and Abdoulkarim Idi Cheffou. 2015. Testing and modeling jump contagion across international stock markets: A nonparametric intraday approach. Journal of Financial Markets 26: 64–84. [Google Scholar] [CrossRef]
- Koutmos, Dimitrios. 2019. Asset pricing factors and bank CDS spreads. Journal of International Financial Markets, Institutions and Money 58: 19–41. [Google Scholar] [CrossRef]
- Laurent, Sébastien, Christelle Lecourt, and Franz C. Palm. 2016. Testing for jumps in conditionally Gaussian ARMA–GARCH models, a robust approach. Computational Statistics & Data Analysis 100: 383–400. [Google Scholar]
- Lee, Chi-Chuan, Chien-Chiang Lee, and Shao-Lin Ning. 2017. Dynamic relationship of oil price shocks and country risks. Energy Economics 66: 571–81. [Google Scholar] [CrossRef]
- Lee, Suzanne S., and Per A. Mykland. 2008. Jumps in financial markets: A new nonparametric test and jump dynamics. The Review of Financial Studies 21: 2535–63. [Google Scholar] [CrossRef]
- Liu, Chang, Xiaolei Sun, Jianming Chen, and Jianping Li. 2016. Statistical properties of country risk ratings under oil price volatility: Evidence from selected oil-exporting countries. Energy Policy 92: 234–45. [Google Scholar] [CrossRef]
- Ma, Feng, Yaojie Zhang, M. I. M. Wahab, and Xiaodong Lai. 2019. The role of jumps in the agricultural futures market on forecasting stock market volatility: New evidence. Journal of Forecasting 38: 400–14. [Google Scholar] [CrossRef]
- Maslyuk-Escobedo, Svetlana, Kristian Rotaru, and Alexander Dokumentov. 2017. News sentiment and jumps in energy spot and futures markets. Pacific-Basin Finance Journal 45: 186–210. [Google Scholar] [CrossRef]
- Merton, Robert C. 1976. Option pricing when underlying stock returns are discontinuous. Journal of Financial Economics 3: 125–44. [Google Scholar] [CrossRef]
- Muler, Nora, and Victor J. Yohai. 2008. Robust estimates for GARCH models. Journal of Statistical Planning and Inference 138: 2918–40. [Google Scholar] [CrossRef]
- Muler, Nora, Daniel Pena, and Victor J. Yohai. 2009. Robust estimation for ARMA models. The Annals of Statistics 37: 816–40. [Google Scholar] [CrossRef]
- Oliva, Immacolata, and Roberto Renò. 2018. Optimal portfolio allocation with volatility and co-jump risk that Markowitz would like. Journal of Economic Dynamics and Control 94: 242–56. [Google Scholar] [CrossRef]
- Sévi, Benoît. 2014. Forecasting the volatility of crude oil futures using intraday data. European Journal of Operational Research 235: 643–59. [Google Scholar] [CrossRef]
- Shahzad, Syed Jawad Hussain, Nader Naifar, Shawkat Hammoudeh, and David Roubaud. 2017. Directional predictability from oil market uncertainty to sovereign credit spreads of oil-exporting countries: Evidence from rolling windows and crossquantilogram analysis. Energy Economics 68: 327–39. [Google Scholar] [CrossRef]
- Sharma, Susan Sunila, and Kannan Thuraisamy. 2013. Oil price uncertainty and sovereign risk: Evidence from Asian economies. Journal of Asian Economics 28: 51–57. [Google Scholar] [CrossRef]
- Van Eyden, Renee, Mamothoana Difeto, Rangan Gupta, and Mark E. Wohar. 2019. Oil price volatility and economic growth: Evidence from advanced economies using more than a century’s data. Applied Energy 233: 612–21. [Google Scholar] [CrossRef]
- Wilmot, Neil A., and Charles F. Mason. 2013. Jump processes in the market for crude oil. The Energy Journal 34: 33–48. [Google Scholar] [CrossRef]
| 1 | Empirical evidence suggests that lower oil prices can shape energy export revenues, government expenditure, and fiscal balances of oil dependent economies (see, among others, El Anshasy and Bradley 2012). |
| 2 | The choice of these five countries and two emirates is determined by the availability of sovereign CDS data. Unfortunately, the daily CDS spreads of Saudi Arabia and Qatar are very illiquid. |
| 3 | Since both CDS spreads and oil implied volatility are measured in percentage points or basis points, taking ‘ordinary’ first differences should be sufficient. |
| 4 | This test is quite similar to the non-parametric tests of Lee and Mykland (2008). |
| 5 | Our estimated results are not sensitive to the choice between the AR-GJR-GARCH and AR-GARCH models. |
| 6 | The lack of relationships between the price discontinuities of crude oil prices and CDS spreads of major oil exporters allows us to give some insights about diversifying the risk of jumps between the two variables. In fact, evidence that jumps of crude oil prices and CDS spreads are unrelated represent good news to investors who may use crude oil prices as a diversifier of the jump risk of sovereign CDS spreads. |
© 2019 by the author. Licensee MDPI, Basel, Switzerland. This article is an open access article distributed under the terms and conditions of the Creative Commons Attribution (CC BY) license (http://creativecommons.org/licenses/by/4.0/).