
Exploring How Healthcare Organizations Use Twitter: A Discourse Analysis

1
Department of Computer Science, Lakehead University, Thunder Bay, ON P7B 3S3, Canada
2
School of Health Policy and Management, York University, Toronto, ON M3J 1P3, Canada
*
Author to whom correspondence should be addressed.
Informatics 2023, 10(3), 65; https://doi.org/10.3390/informatics10030065
Submission received: 22 June 2023
/
Revised: 3 August 2023
/
Accepted: 5 August 2023
/
Published: 8 August 2023
(This article belongs to the Special Issue Novel Informatics Algorithms and Applications to Biomedicine and Healthcare)
Abstract
:The use of Twitter by healthcare organizations is an effective means of disseminating medical information to the public. However, the content of tweets can be influenced by various factors, such as health emergencies and medical breakthroughs. In this study, we conducted a discourse analysis to better understand how public and private healthcare organizations use Twitter and the factors that influence the content of their tweets. Data were collected from the Twitter accounts of five private pharmaceutical companies, two US and two Canadian public health agencies, and the World Health Organization from 1 January 2020, to 31 December 2022. The study applied topic modeling and association rule mining to identify text patterns that influence the content of tweets across different Twitter accounts. The findings revealed that building a reputation on Twitter goes beyond just evaluating the popularity of a tweet in the online sphere. Topic modeling, when applied synchronously with hashtag and tagging analysis can provide an increase in tweet popularity. Additionally, the study showed differences in language use and style across the Twitter accounts’ categories and discussed how the impact of popular association rules could translate to significantly more user engagement. Overall, the results of this study provide insights into natural language processing for health literacy and present a way for organizations to structure their future content to ensure maximum public engagement.
1. Introduction
1.1. Background and Literature Review
The use of social media platforms for information dissemination has grown significantly in the last decade. Among them, Twitter has emerged as a preferred platform, with seven out of 10 American adults using it as a daily source of news [1]. Health-related content is one of the crucial types of information shared on the micro-blogging platform, often disseminated by over 2000 healthcare professionals worldwide [2]. Existing research has focused on analyzing important social dimensions, such as audience reach (e.g., followers and subscribers) and post interactivity (e.g., retweets and likes), to identify the impact of online content [3]. However, there is a dearth of studies that explore the underlying textual patterns in the content shared by healthcare organizations on Twitter.
Twitter has been widely used for real-time infoveillance of health messages and has been studied for content analysis by health practitioners, researchers, and computer scientists [4,5]. Previous research has examined Twitter data to identify top technologies in the health domain using hashtag analysis [6]. In addition, Broniatowski et al. have explored the use of Twitter bots to amplify vaccine hesitancy [7]. Other studies have focused on health literacy promotion through Twitter and identifying health-related causalities from tweets, such as stress, insomnia, and headache [8,9]. Twitter has also been investigated for COVID-19-related health beliefs [10]. Various techniques are available to identify stakeholder characteristics on social media platforms (SMPs), including topic-clustering and content analysis [11,12]. In the context of pharmaceutical companies, research has focused on public opinions related to COVID-19 vaccines [13,14]. Using techniques such as latent Dirichlet allocation (LDA) and valence-aware dictionary and sentiment reasoner (VADER), researchers have analyzed topics, trends, and sentiments over time [13].
Association rule mining is a data mining technique used to identify relationships between variables in a large dataset by analyzing their co-occurrences. Previous research in social media analysis has utilized association rule mining to understand human behavior [15]. One study on social media involved conducting feature-based opinion analysis using an evolutionary approach with association rule mining, as well as performing interest mining to reveal the relationship between interests and their application value [16]. Other studies have explored the importance of public engagement on Twitter, association rule mining for topic extraction on social media platforms, and the use of centrality measures for detecting influential users on social media [17,18,19]. Recent research has also used association rule mining to extract meaningful information from social media data. For example, researchers have used association rule mining to identify depression symptoms on Twitter and to predict drug usage on the platform [20,21]. Gender differences in internet users have also been identified through aggregation-based data mining algorithms [22]. In addition, researchers have explored the use of word embedding techniques for medication usage classification on Twitter and for the classification of tweets based solely on COVID-19 symptoms [23,24]. Overall, association rule mining has proven to be an effective tool for social media analysis and has been used in a variety of contexts to gain insights into human behavior and social trends.
In recent years, the field of causality analysis in social media has garnered significant interest, as social media platforms generate vast amounts of data that have the potential to reveal causal relationships between variables of interest [25]. For instance, natural experiments have been used to assess the causal impact of social media on political participation, whereas regression discontinuity design has been employed to identify the causal impact of social media on mental health outcomes [26,27]. These studies illustrate the potential of causal inference techniques to enhance our understanding of the intricate relationships in social media data.
1.2. Objective
In the context of the global pandemic caused by SARS-CoV-2 (COVID-19), it is essential to understand the impact of social media content on users. As a means of communicating medical information, healthcare organizations make use of social media platforms. Identifying underlying text patterns on Twitter can be challenging due to the large volume of data generated on the platform, as well as the unstructured and noisy nature of the data. Unlike structured data found in databases or spreadsheets, where each data point has a specific field and format, Twitter data contains various types of information such as text, images, videos, hashtags, mentions, and URLs, all mixed together in a single tweet. This lack of uniformity makes it challenging to process and analyze Twitter data using traditional data analysis methods. Due to the informal nature of tweets and the limited character count, users may use abbreviations, slang, emojis, or misspellings, leading to ambiguities in the data. In addition, the use of hashtags and mentions can make it challenging to distinguish between topics and identify relevant tweets. Finally, the rapidly changing nature of Twitter content means that patterns and trends can emerge and disappear quickly. Therefore, this study focuses on two primary research questions:
1.2.1. Research Question 1: What Are the Significant Text Patterns That Shape the Content of Tweets by Health Agencies and Pharmaceutical Companies in the US and Canada, and How Do They Compare with the WHO?
Understanding the topics and information that attract Twitter users can help organizations create content that maximizes user engagement. Identifying underlying text patterns in tweets can provide valuable insights into the topics that are most relevant to a given audience. This information can be used by organizations to tailor their content and messaging to better engage their target audience. In addition, analyzing text patterns can help organizations gain a deeper understanding of how they are discussing specific topics, identify key influencers, and track emerging trends. All of this information can help organizations make informed decisions about their social media strategies and ultimately improve their outreach efforts. Moreover, visualizing the inter-relationship between words of interest, i.e., rules and word patterns, can highlight impactful language styles and text patterns. To achieve these goals, we applied topic modeling and association rule mining to our dataset.
Findings: Pharmaceutical companies shared a more diverse range of content compared to other organizations, and COVID-19 was the most commonly discussed topic across all of them. More details are available in Section 3.1 and Section 3.2.
1.2.2. Research Question 2: How Can We Analyze and Evaluate the Impact of Word Patterns on the Content Shared by Healthcare Organizations on Twitter?
Twitter users interact with the content shared on the micro-blogging platform in various ways, including likes, reshares, replies, and others. Additionally, every word pattern and rule generated through association rule mining has specific metrics linked with it. To evaluate the relationship between the two, we employed two evaluation metrics: tweet popularity and rule support. Identifying the relationship between tweet popularity and text patterns can help healthcare professionals understand how users engage with content shared by healthcare organizations on Twitter. In order to determine whether a change in one variable, such as the use of association rule, hashtag, or mention, leads to changes in tweet popularity, we conducted causality analysis. This information can be useful in understanding the effectiveness of communication strategies and identifying what types of content resonate with users, which can lead to more effective dissemination of information. To identify potential confounding factors that could impact tweet popularity, we conducted causality analysis on the following hypotheses:
Hypothesis 1.
Twitter posts having top hashtags and mentions receive more retweets, i.e., they are more popular.
Hypothesis 2.
Twitter posts having popular association rules receive more retweets, i.e., they are more popular.
Findings: Both hypotheses were confirmed, with the presence of popular association rules resulting in a higher probability of increased tweet popularity. More details are available in Section 3.3.
The ultimate objective of this study is to provide valuable insights into the use of textual features for structuring online content, thereby enhancing public engagement. This paper is organized as follows: Section 2 describes the dataset, content analysis, association rule mining, and causality analysis. Section 3 presents the study’s findings, followed by a discussion in Section 4. Lastly, Section 5 concludes the paper.
2. Materials and Methods
Resource Availability:
The Supplementary Materials for this study are available here (https://github.com/aditya-ml/Association-Rule-Mining, accessed on 4 August 2023). Any additional information required to reanalyze the code/data reported in this paper is available from the lead contact upon request.
2.1. Dataset
This study utilized Twitter data from ten major healthcare organizations in North America and the World Health Organization (WHO). Focusing on a specific geographical region, such as North America, provides us with a context-specific approach, which may affect how health information is communicated and received on social media platforms. This approach enables a deeper understanding of the unique features and factors that impact Twitter usage and the dissemination of health information in that context. Pharmaceutical companies play an important role in developing and producing medical products, including vaccines, which were important in the context of the COVID-19 pandemic. Analyzing their use of Twitter can provide insights into their messaging and communication strategies, which can be useful for both the pharmaceutical companies themselves and for public health organizations looking to work with them. Furthermore, comparing the Twitter usage of public health agencies and private pharmaceutical companies in the US and Canada with that of the WHO allows us to gain insights into the differences in content and messaging strategies employed by organizations with different levels of reach and influence. This is valuable for organizations looking to improve their own social media strategies, as the WHO’s Twitter usage may serve as a benchmark for best practices in health communication on social media. By combining these diverse data sources, our Twitter dataset becomes a rich and multi-faceted resource for studying health-related conversations and information dissemination on social media. It allows us to explore how different stakeholders, including government agencies, indigenous organizations, pharmaceutical companies, and international bodies, contribute to the health information landscape on Twitter. Additionally, analyzing these data can provide insights into potential disparities in health information and communication across various entities, helping inform more inclusive and equitable health communication strategies in the future. We collected a total of 104,347 tweets from 1 January 2020, to 31 December 2022, using Twitter Academic API for Research v2. National public health agencies, indigenous health agencies, and the top five private pharmaceutical companies by market capitalization (https://www.globaldata.com/companies/top-companies-by-sector/healthcare/us-companies-by-market-cap/, accessed on 4 August 2023) in the United States and Canada were selected for this research. These pharmaceutical companies were at the forefront of vaccine development during COVID-19 and the main revenue generators in the healthcare industry. Table 1 outlines the number of tweets for each organization, and Figure 1 presents an overview of the research framework.
2.2. Content Analysis
In order to understand the textual content of the tweets, we perform the following analyses:
2.2.1. Topic Modeling
Topic modeling is a statistical technique widely used in natural language processing to identify latent topics within a collection of documents. In social media, it can be used to analyze the content of tweets shared by healthcare organizations and identify the key themes that emerge. By identifying these themes, we extract the topics that are most relevant to users and can develop content that is tailored to their interests. The process of topic modeling involves identifying a set of latent topics and then analyzing the frequency of words and phrases that are associated with each topic. We first pre-processed the data to remove all non-alphabet characters such as punctuation, numbers, new-line characters, and extra spaces using regex (https://pypi.org/project/regex/, accessed on 4 August 2023) (regular expression) module 2.2.1. Then, we tokenized it using the nltk (https://nltk.readthedocs.io/en/latest/, accessed on 4 August 2023) 3.2.5 library and performed stemming and lemmatization using PorterStemmer and WordNetLemmatizer, respectively.
In this study, we utilized the term frequency–inverse document frequency (TF-IDF) method to create document embeddings for tweets [28]. The resulting embeddings were then preprocessed and fed into four different clustering algorithms, including the latent Dirichlet allocation (LDA), non-negative matrix factorization (NMF), latent semantic indexing (LSI), and the hierarchical Dirichlet process (HDP). The clustering algorithms were executed five times using varying random seed values to account for the short and noisy nature of tweets. Table 2 shows model parameters for topic clustering. To ensure consistency in performance across multiple runs, the coherence scores of the topic models were calculated using both the cumass and cv methods [29,30]. The Gensim LDA (https://radimrehurek.com/gensim/models/ldamodel.html, accessed on 4 August 2023) and Gensim LSI (https://radimrehurek.com/gensim/models/nmf.html, accessed on 4 August 2023) models were used for the analysis, and online NMF (https://radimrehurek.com/gensim/models/lsimodel.html, accessed on 4 August 2023) for large corpora and online variational inference models were used for NMF and HDP (https://radimrehurek.com/gensim/models/hdpmodel.html, accessed on 4 August 2023) models, respectively.
2.2.2. Heatmaps
Creating heatmaps on topics of tweets shared by healthcare organizations helps us visualize the distribution of topics across different organizations and time periods. This can show which topics are most commonly discussed by healthcare organizations and how these topics may change over time. By examining the heatmap, we identify trends in the distribution of topics and patterns in how different organizations discuss certain topics. This information can be useful for organizations looking to improve their social media strategies, as they can identify which topics are most relevant to their audience and develop content accordingly. Heatmaps also help us identify topics that are commonly discussed by multiple organizations, as these topics may be particularly important or relevant to the broader healthcare community. By identifying these topics, we understand areas of shared interest and potential opportunities for collaboration among healthcare organizations. We created heatmaps to visually analyze the number of tweets for each topic. We used the best-performing topic model to generate them, and each cell in the heatmap represented the total count of tweets for a specific topic by an organization. The cells in the heatmap are color coded based on the prevalence of the topic. The darker the color, the higher the prevalence of the topic.
2.2.3. Hashtags and Mentions
Hashtags and mentions can serve as indicators of the conversations and communities that are engaged in a particular topic, as well as the influencers and thought leaders who are driving the discussion. By analyzing their frequency and patterns, we gain a better understanding of how organizations are engaging with health-related topics on social media and which topics are generating the most engagement and interest. This information can be useful for healthcare organizations to tailor their social media strategies and content to better engage with their audience and promote their messaging effectively. The advertools (https://pypi.org/project/advertools/, accessed on 4 August 2023) 0.13.2 module was used to analyze the top 10 hashtags and mentions in the data.
2.3. Association Rule Mining
Association rule mining is used to uncover the co-occurrence of specific words or phrases, which can provide insights into the topics that are frequently discussed together in tweets. These can be used to inform content creation and messaging strategies for healthcare organizations on social media platforms such as Twitter. In addition, association rule mining helps to identify potentially useful combinations of keywords or phrases that can be used to optimize search queries and information retrieval in the context of health information dissemination. By identifying which keywords or phrases are frequently mentioned together in tweets, we can develop more effective search strategies that take into account the associations and relationships between different concepts in the domain of health communication.
The mlxtend python library was utilized for association rule mining in our study (https://github.com/rasbt/mlxtend, accessed on 4 August 2023). The dataset was cleaned (as described in previous section), encoded as Numpy arrays using the TransactionEncoder() API, and transformed into a one-hot-encoded Numpy boolean array using the fit and transform methods. It was then converted into a pandas DataFrame. To perform association rule mining on the tweets, we utilized the Apriori algorithm, which is a classic and widely-used algorithm for mining frequent itemsets [31,32] by employing the function from mlxtend.frequent_patterns. We generated rules of the form X→Y [33] by performing a grid search, where X and Y refer to the antecedent and consequent, respectively. These rules were evaluated based on metrics such as support, confidence, and lift to determine their strength and significance. Table 3 displays the parameters that were used for grid search to determine the number of relevant association rules for each Twitter group, and the corresponding parameters utilized for deriving these association rules.
The confidence metric was calculated to determine interesting rules:
where
For instance, a support threshold of 0.5 (50%) means that a set of items should appear together in at least 50% of all transactions in the database. When both antecedent and consequent always occur together, the confidence is 1. We filter rules using the lift metric, which ensures that antecedents and consequents are statistically independent, i.e., .
2.3.1. Graphical Visualizations
Graphical visualizations of association rules obtained provide valuable insights into the relationships between different topics and concepts. By representing these relationships visually, we can more easily identify patterns and trends in the data that might be difficult to discern from raw numbers or statistics alone. In our study, we utilized the D3JS (https://d3js.org, accessed on 4 August 2023) JavaScript library, a popular tool for generating interactive network visualizations, to create hierarchical edge bundling charts. In these charts, we map the antecedents and consequents obtained from the association rules as the source and target, respectively. This helps us to identify clusters of related terms, as well as any outliers or unexpected relationships between terms. Furthermore, graphical visualizations make it easier to communicate the results of the analysis to a broader audience, including healthcare professionals, policymakers, and members of the public who may not have a technical background. The visual nature of these representations can make the findings more accessible and easier to understand, which can be particularly important in the context of public health communication.
2.3.2. Quantitative Analysis
Calculating tweet popularity and rule support for association rules obtained from tweets shared by healthcare organizations is important for evaluating the significance and relevance of the rules. Following Mahdikhani’s approach, we measure tweet popularity as the count of retweets [34].
Rule support is a measure of the frequency with which a rule occurs in the data set. By calculating tweet popularity for tweets associated with certain rules, we identify which rules are associated with tweets that have the most engagement, indicating that these topics or themes are more interesting or relevant to the audience. We calculate rule support as the summation of antecedent support, consequent support, overall support, confidence, lift, leverage, and conviction metrics.
2.4. Causality Analysis
Causality analysis, also known as causal inference, is a statistical method used to determine if there is a causal relationship between two or more variables [35]. It involves identifying a potential causal relationship between an independent variable and a dependent variable and then determining whether that relationship is actually causal or just a result of some other factor, called a confounding variable. To analyze the causal relationship between the occurrence of top hashtags, mentions, association rules, and tweet popularity, we construct a dataset by comparing their frequencies in the top 10% and the bottom 10% of the tweets ranked by popularity. We assign a binary value of 1 if they occur, and 0 if they do not. We then use the CausalInferenceModel from the CausalNLP (https://github.com/amaiya/causalnlp, accessed on 4 August 2023) package along with an LGBMClassifier that has 500 leaves as the base learner. We consider the overall treatment effect across all observations in the dataset.
2.5. Computational Resources
This study utilized the advanced research computing (ARC), research data management (RDM), and research software (RS) resources provided by Compute Canada, now known as the Digital Research Alliance of Canada. Specifically, we used one of the clusters called Graham, which offered the following computing resources:
- Central processing unit (CPU): 2x Intel E5-2683 v4 [email protected] GHz
- Memory (RAM): 30 GB
3. Results
3.1. Content Analysis
The output of topic modeling is a set of topics, each of which is characterized by a set of words or phrases that are most closely associated with that topic. These topics can then be used to discern the content of tweets shared by healthcare organizations and identify patterns and trends in how health information is communicated on social media. The most relevant topic contents were generated by: NMF for public health agencies (cumass = −3.58) and WHO (cumass = −4.22), and HDP for pharmaceutical companies (cv = 0.74) as shown in Table 4. After extracting the contents, we analyzed the topic keywords to suggest a relevant topic name for each, as shown in Table 5. This provides an overview of the main topics discussed by each group on Twitter, based on the keywords used in their tweets. For example, the table shows that public health agencies focus heavily on topics related to COVID-19, such as pandemic, death, vaccine, and coronavirus. On the other hand, the pharmaceutical companies group discussed a wider range of topics, such as communication, shortage, and misinformation, in addition to COVID-19-related topics. Similarly, the WHO discussed topics such as world regions, diseases, and health emergencies. Overall, this table provides a perspective into the different priorities and focuses of each Twitter group, which is useful in understanding their messaging and strategies on social media.
The heatmap in Table 6 displays the distribution of topics among the different healthcare organizations. It reveals that GovCanHealth was the most active health agency across all topics. In contrast, the distribution of topics among private pharmaceutical companies was more evenly spread, with Pfizer having the highest number of posts related to COVID-19, whereas Merck, LillyPad, and AbbVie focused more on community health, in line with WHO’s activity. The heatmap helps to identify any patterns or trends in the social media activity of the organizations and provides insights into their communication strategies.
The hashtag #COVID-19 was most frequently used by private pharmaceutical companies, public health agencies, and WHO, as shown in Figure 2. The most tagged Twitter accounts were the US FDA, the Chief Public Health Officer of Canada, and the Director-General of the World Health Organization, respectively. This provides insight into which individuals and organizations are most active in the healthcare industry on social media platforms, indicating their influence or authority in the field.
3.2. Association Rule Mining
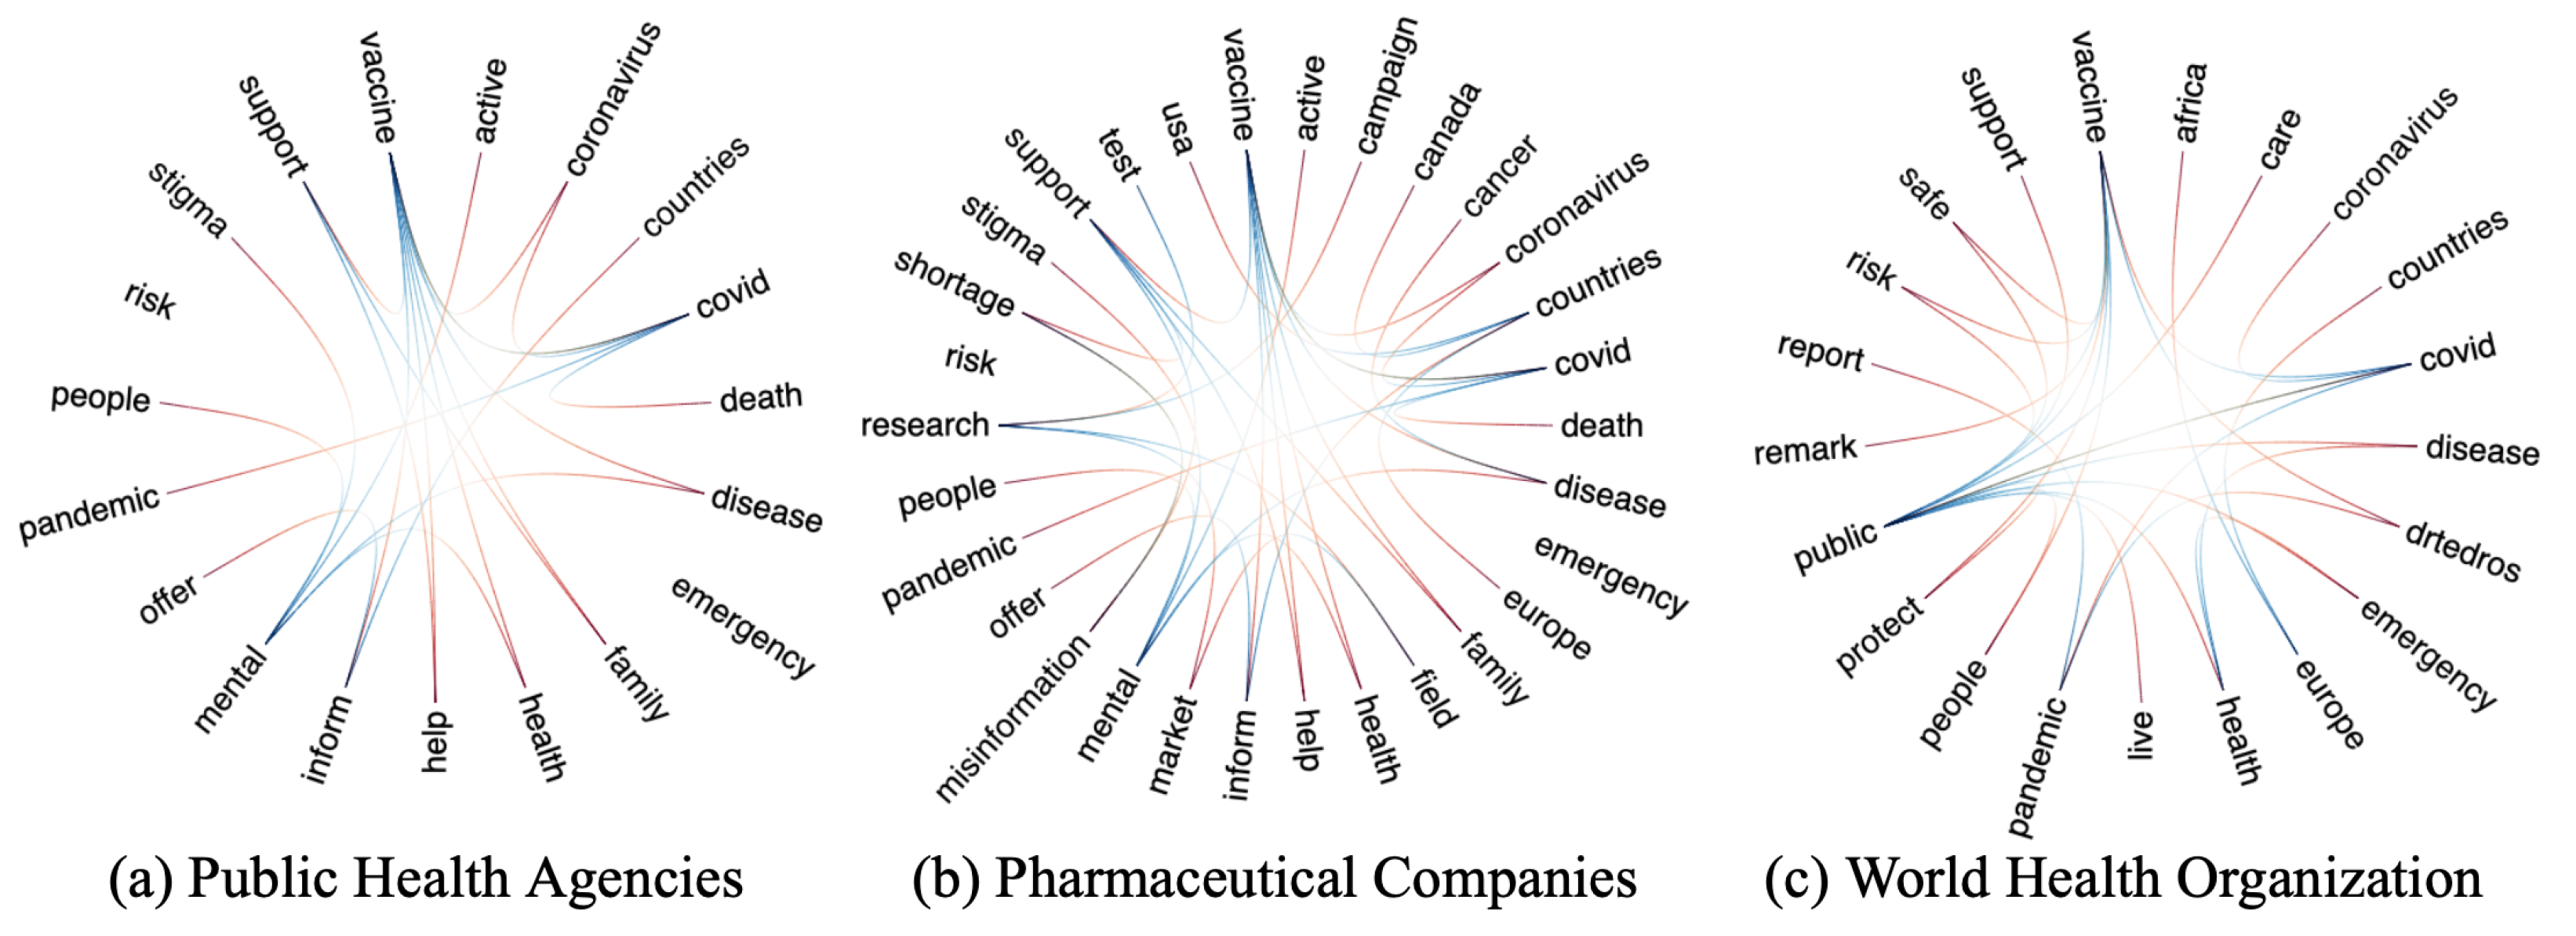
The figures in Figure 3 display the visualized association rules for each Twitter group. The antecedents (or sources) are represented in blue, whereas the consequents (or targets) are shown in red. These visualizations illustrate the most frequent association rules present in our data set. Upon analysis, we observed that the association rule pairs from public health agencies and WHO were fewer and more precise as compared to those from pharmaceutical companies. In the case of public health agencies, the most impactful antecedent–consequent pairs were associated with COVID-19, including ‘COVID-vaccine’ and ‘vaccine-mental’. Conversely, the highest ranked association rules from pharmaceutical companies such as ‘test-research’, ‘market-research’, and ‘vaccine-COVID’ explored topics beyond the pandemic, such as communication and innovation. Association rules obtained for WHO included ‘public-health’ in addition to rules denoting regional WHO offices such as ‘europe-africa’ (for WHO Europe and Africa). These findings can inform organizations in the healthcare industry on how to structure their tweets to achieve maximum engagement from their target audience.
We rank tweets in each Twitter group based on their tweet popularity metric and association rules according to rule support in descending order. Table 7 lists the top association rules and performance metrics obtained for each Twitter group, which are a combination of individual words.
3.3. Causality Analysis
Table 8 summarizes the findings of our study that examined the effect of hashtags, mentions, and association rules on the popularity of tweets in the online sphere. The analysis revealed that tweets that included these elements were more likely to be shared. The study tested two hypotheses. The first hypothesis showed that the presence of top hashtags and mentions increased the likelihood of a post being shared by 14.90% and 14.55% for public health agencies and WHO, respectively. In contrast, for pharmaceutical companies, the probability increased significantly by 25.70%. The second hypothesis examined the impact of top association rules and found that their presence increased the probability of a tweet being popular by 45.05% and 50.05% for public health agencies and pharmaceutical companies, respectively. However, the chance of popularity for WHO was lower at 15.70%, potentially due to its global presence and the higher impact of its regional arms, as suggested by the topic modeling results. Overall, this highlights the importance of using association rules as compared to hashtags and mentions to increase the likelihood of a tweet being shared in the online sphere.
4. Discussion
In this study, we performed content analysis, association rule mining, and causality inference on a large database of tweets from healthcare organizations to understand the textual patterns and their impact on driving engagement. Based on our analyses, the principal findings are:
4.1. RQ1: What Are the Significant Text Patterns that Shape the Content of Tweets by Health Agencies and Pharmaceutical Companies in the US and Canada, and How Do They Compare with the WHO?
The study used topic modeling to identify the main text patterns present in tweets by health agencies and pharmaceutical companies in the US and Canada, as well as the WHO. The analysis revealed that public health agencies and the WHO focused heavily on COVID-19-related topics, whereas pharmaceutical companies covered a wider range of topics, including communication and innovation. The distribution of topics among the different organizations was also visualized using a heatmap, which showed that GovCanHealth was the most active health agency across all topics. The study also identified the most frequently used hashtag (#COVID-19) and tagged Twitter accounts in the healthcare industry, providing insight into the most active and influential individuals and organizations. Finally, the study analyzed association rules to identify the most impactful antecedent–consequent pairs in tweets by each group. The findings suggest that public health agencies and the WHO generated fewer but more precise association rules related to COVID-19, whereas pharmaceutical companies explored topics beyond the pandemic. These results can help organizations in the healthcare industry to structure their tweets to achieve maximum engagement from their target audience, and this approach is especially beneficial for organizations that seek to align their content with a common goal, as it enables them to synergize their efforts toward creating effective messaging.
4.2. RQ2: How Can We Analyze and Evaluate the Impact of Word Patterns on the Content Shared by Healthcare Organizations on Twitter?
In order to effectively analyze the impact of word patterns, we calculated two metrics: tweet popularity (count of retweets) and rule support (sum of all performance metrics). These metrics can be used to rank tweets and association rules in each Twitter group. In addition to analyzing association rules, the study also examined the effect of hashtags, mentions, and association rules on the popularity of tweets in the online sphere. The analysis revealed that tweets that included these elements were more likely to be shared. We also tested two hypotheses, which showed that the presence of top hashtags and mentions increased the likelihood of a post being shared, and that the presence of top association rules significantly increased the probability of a tweet being popular.
As we explored the use of textual features to structure online content and enhance public engagement, we recognize the importance of effective health communication. Social media platforms offer a promising avenue for translating evidence-based information into practical knowledge for the public. By gaining valuable insights into how text features can influence engagement, we can promote health literacy and empower individuals to make informed decisions about their well-being. Overall, this study highlights the importance of using association rules as compared to hashtags and mentions to increase the likelihood of a tweet being shared in the online sphere. It also provides insights into the impact of word patterns on the content shared by healthcare organizations on Twitter and offers a way to evaluate their effectiveness. By analyzing the language and style used in popular tweets, organizations can gain insights into what resonates with their audience and adjust their messaging accordingly. This leads to better communication of health information, increased engagement, and better health outcomes. Finally, this research can serve as a stepping stone in fostering conversations about the stewardship of health information accuracy on digital platforms, ultimately contributing to a more informed and health-conscious society.
4.3. Limitations and Future Research Directions
This study focuses on textual features of Twitter content and their relationship to user engagement. Although the data were collected from official Twitter accounts, we could not verify the authenticity of the tweets. Private pharmaceutical companies may have utilized external software programs, such as bots, to fabricate and enhance their content. Future studies can use bot detection methods, such as those outlined in [36]. Furthermore, they often share information about medical breakthroughs, drug research, and advancements in healthcare technologies, which can contribute to a more comprehensive understanding of the current healthcare landscape, but could also inadvertently shape public perception or influence health-related discussions on Twitter. In addition, although causality analysis is a powerful tool for identifying causal relationships between variables, it is important to recognize that causality cannot be established definitively in all cases. There may be other variables, such as images or videos, that are not included in the analysis that could be driving the observed associations. In light of the post-pandemic landscape, the findings and methodologies established in this research can be extended to other health domains, such as diabetes information, cardiovascular health information, lifestyle health data, and more. By leveraging the insights gained from analyzing social media content, our future work will develop innovative approaches to enhance public engagement and health literacy in diverse health-related topics. Future research would also focus on investigating the effectiveness of social media campaigns and interventions on health-related outcomes on visibility and audience engagement.
5. Conclusions
As social media platforms become ubiquitous in our daily lives, healthcare organizations can leverage them to increase public engagement. This study examined the content shared by healthcare organizations on Twitter by performing content analysis, association rule mining and causality analysis. NLP methods, such as topic modeling, help identify the overall themes and topics of the tweets, but association rule mining can help identify which words, phrases, or language patterns are associated with higher or lower tweet popularity, allowing organizations to adjust their messaging and communication strategies accordingly. Using popular association rules also significantly increases the probability of a tweet getting reshared across all categories. Overall, the methodology presented here can help healthcare organizations fine-tune their content for their audience.
Supplementary Materials
The following supporting information can be downloaded at: https://github.com/aditya-ml/Association-Rule-Mining, accessed on 4 August 2023.
Author Contributions
Conceptualization, A.S. and V.M.; methodology, A.S.; writing—original draft, A.S.; writing—review and editing, A.S. and V.M.; funding acquisition, V.M.; supervision, V.M. All authors have read and agreed to the published version of the manuscript.
Funding
This research was funded by NSERC Discovery Grant (RGPIN-2017-05377).
Institutional Review Board Statement
Not applicable.
Informed Consent Statement
Not applicable.
Data Availability Statement
Data available in a publicly accessible repository. The data presented in this study are openly available at https://github.com/aditya-ml/Association-Rule-Mining, accessed on 4 August 2023.
Acknowledgments
The authors thank DaTALab members at Lakehead University for valuable discussions. Digital Research Alliance of Canada provided computing resources to conduct this study. A.S. is supported by the Vector Scholarship in Artificial Intelligence from the Vector Institute, Toronto, Canada and the funding provided by V.M. from their NSERC Discovery Grant (RGPIN-2017-05377). The publication cost is covered by York University’s startup funds for V.M.
Conflicts of Interest
The authors declare no competing interests.
References
- Mitchell, A.; Shearer, E.; Stocking, G. News on Twitter: Consumed by Most Users and Trusted by Many; Pew Research Center: Washington, DC, USA, 2021. [Google Scholar]
- Pershad, Y.; Hangge, P.T.; Albadawi, H.; Oklu, R. Social medicine: Twitter in healthcare. J. Clin. Med. 2018, 7, 121. [Google Scholar] [CrossRef] [PubMed] [Green Version]
- Zhou, L.; Zhang, D.; Yang, C.C.; Wang, Y. Harnessing social media for health information management. Electron. Commer. Res. Appl. 2018, 27, 139–151. [Google Scholar] [CrossRef] [PubMed]
- Colditz, J.B.; Chu, K.H.; Emery, S.L.; Larkin, C.R.; James, A.E.; Welling, J.; Primack, B.A. Toward real-time infoveillance of Twitter health messages. Am. J. Public Health 2018, 108, 1009–1014. [Google Scholar] [CrossRef] [PubMed]
- Mendhe, C.H.; Henderson, N.; Srivastava, G.; Mago, V. A scalable platform to collect, store, visualize, and analyze big data in real time. IEEE Trans. Comput. Soc. Syst. 2020, 8, 260–269. [Google Scholar] [CrossRef]
- Grover, P.; Kar, A.K.; Davies, G. “Technology enabled Health”—Insights from twitter analytics with a socio-technical perspective. Int. J. Inf. Manag. 2018, 43, 85–97. [Google Scholar] [CrossRef]
- Broniatowski, D.A.; Jamison, A.M.; Qi, S.; AlKulaib, L.; Chen, T.; Benton, A.; Quinn, S.C.; Dredze, M. Weaponized health communication: Twitter bots and Russian trolls amplify the vaccine debate. Am. J. Public Health 2018, 108, 1378–1384. [Google Scholar] [CrossRef]
- Zhou, J.; Liu, F.; Zhou, H. Understanding health food messages on Twitter for health literacy promotion. Perspect. Public Health 2018, 138, 173–179. [Google Scholar] [CrossRef]
- Doan, S.; Yang, E.W.; Tilak, S.S.; Li, P.W.; Zisook, D.S.; Torii, M. Extracting health-related causality from twitter messages using natural language processing. BMC Med. Inform. Decis. Mak. 2019, 19, 71–77. [Google Scholar] [CrossRef] [Green Version]
- Wang, H.; Li, Y.; Hutch, M.; Naidech, A.; Luo, Y. Using tweets to understand how COVID-19–Related health beliefs are affected in the age of social media: Twitter data analysis study. J. Med. Internet Res. 2021, 23, e26302. [Google Scholar] [CrossRef] [PubMed]
- Lu, Y.; Wu, Y.; Liu, J.; Li, J.; Zhang, P. Understanding health care social media use from different stakeholder perspectives: A content analysis of an online health community. J. Med. Internet Res. 2017, 19, e109. [Google Scholar] [CrossRef]
- Tyrawski, J.; DeAndrea, D.C. Pharmaceutical companies and their drugs on social media: A content analysis of drug information on popular social media sites. J. Med. Internet Res. 2015, 17, e130. [Google Scholar] [CrossRef] [PubMed]
- Chandrasekaran, R.; Mehta, V.; Valkunde, T.; Moustakas, E. Topics, trends, and sentiments of tweets about the COVID-19 pandemic: Temporal infoveillance study. J. Med. Internet Res. 2020, 22, e22624. [Google Scholar] [CrossRef]
- Poddar, S.; Mondal, M.; Misra, J.; Ganguly, N.; Ghosh, S. Winds of Change: Impact of COVID-19 on Vaccine-related Opinions of Twitter users. In Proceedings of the International AAAI Conference on Web and Social Media, Limassol, Cyprus, 5–8 June 2022; Volume 16, pp. 782–793. [Google Scholar]
- Raihan, M.; Islam, M.T.; Ghosh, P.; Hassan, M.M.; Angon, J.H.; Kabiraj, S. Human behavior analysis using association rule mining techniques. In Proceedings of the IEEE 2020 11th International Conference on Computing, Communication and Networking Technologies (ICCCNT), Kharagpur, India, 1–3 July 2020; pp. 1–5. [Google Scholar]
- Meesala, S.R.; Subramanian, S. Feature based opinion analysis on social media tweets with association rule mining and multi-objective evolutionary algorithms. Concurr. Comput. Pract. Exp. 2022, 34, e6586. [Google Scholar] [CrossRef]
- Singhal, A.; Baxi, M.K.; Mago, V. Synergy Between Public and Private Health Care Organizations During COVID-19 on Twitter: Sentiment and Engagement Analysis Using Forecasting Models. JMIR Med. Inform. 2022, 10, e37829. [Google Scholar] [CrossRef]
- Koukaras, P.; Tjortjis, C.; Rousidis, D. Mining association rules from COVID-19 related twitter data to discover word patterns, topics and inferences. Inf. Syst. 2022, 109, 102054. [Google Scholar] [CrossRef] [PubMed]
- Agouti, T. Graph-based modeling using association rule mining to detect influential users in social networks. Expert Syst. Appl. 2022, 202, 117436. [Google Scholar] [CrossRef]
- Ma, L.; Wang, Y. Constructing a semantic graph with depression symptoms extraction from twitter. In Proceedings of the 2019 IEEE Conference on Computational Intelligence in Bioinformatics and Computational Biology (CIBCB), Siena, Italy, 9–11 July 2019; pp. 1–5. [Google Scholar]
- Tassone, J.; Yan, P.; Simpson, M.; Mendhe, C.; Mago, V.; Choudhury, S. Utilizing deep learning and graph mining to identify drug use on Twitter data. BMC Med. Inform. Decis. Mak. 2020, 20, 1–15. [Google Scholar] [CrossRef] [PubMed]
- Wibowo, W.; Sari, N.P.; Wilantari, R.N.; Abdul-Rahman, S. Association rule mining method for the identification of internet use. In Proceedings of the Journal of Physics: Conference Series, Thessaloniki, Greece, 16–19 June 2021; IOP Publishing: Bristol, UK, 2021; Volume 1874, p. 012009. [Google Scholar]
- Jiang, K.; Feng, S.; Calix, R.A.; Bernard, G.R. Assessment of word embedding techniques for identification of personal experience tweets pertaining to medication uses. In International Workshop on Health Intelligence; Springer: Cham, Switzerland, 2019; pp. 45–55. [Google Scholar]
- Gilbert, J.P.; Niu, J.; de Montigny, S.; Ng, V.; Rees, E. Machine learning identification of self-reported COVID-19 symptoms from Tweets in Canada. In International Workshop on Health Intelligence; Springer: Cham, Switzerland, 2021; pp. 101–111. [Google Scholar]
- George, G.; Osinga, E.C.; Lavie, D.; Scott, B.A. Big data and data science methods for management research. Acad. Manag. J. 2016, 59, 1493–1507. [Google Scholar] [CrossRef] [Green Version]
- Gil de Zúñiga, H.; Molyneux, L.; Zheng, P. Social media, political expression, and political participation: Panel analysis of lagged and concurrent relationships. J. Commun. 2014, 64, 612–634. [Google Scholar] [CrossRef]
- Chen, S.; Geldsetzer, P.; Bärnighausen, T. The causal effect of retirement on stress in older adults in China: A regression discontinuity study. SSM-Popul. Health 2020, 10, 100462. [Google Scholar] [CrossRef]
- Lilleberg, J.; Zhu, Y.; Zhang, Y. Support vector machines and word2vec for text classification with semantic features. In Proceedings of the 2015 IEEE 14th International Conference on Cognitive Informatics & Cognitive Computing (ICCI* CC), Beijing, China, 6–8 July 2015; pp. 136–140. [Google Scholar]
- Newman, D.; Lau, J.H.; Grieser, K.; Baldwin, T. Automatic evaluation of topic coherence. In Proceedings of the Human Language Technologies: The 2010 annual Conference of the North American Chapter of the Association for Computational Linguistics, Los Angeles, CA, USA, 2–4 June 2010; pp. 100–108. [Google Scholar]
- Röder, M.; Both, A.; Hinneburg, A. Exploring the space of topic coherence measures. In Proceedings of the Eighth ACM International Conference on Web Search and Data Mining, Shanghai, China, 2–6 February 2015; pp. 399–408. [Google Scholar]
- Agrawal, R.; Imielinski, T.; Swami, A. Mining associations between sets of items in large databases. In Proceedings of the ACM SIGMOD International Conference on Management of Data, Washington, DC, USA, 25–28 May 1993; pp. 207–216. [Google Scholar]
- Agrawal, R.; Srikant, R. Fast algorithms for mining association rules. In Proceedings of the 20th International Conference on Very Large Data Bases, Santiago, Chile, 12–15 September 1994; Volume 1215, pp. 487–499. [Google Scholar]
- Tan, P.N.; Steinbach, M.; Kumar, V. Introduction to Data Mining; Pearson Education: Noida, India, 2016. [Google Scholar]
- Mahdikhani, M. Predicting the popularity of tweets by analyzing public opinion and emotions in different stages of COVID-19 pandemic. Int. J. Inf. Manag. Data Insights 2022, 2, 100053. [Google Scholar] [CrossRef]
- Nogueira, A.R.; Pugnana, A.; Ruggieri, S.; Pedreschi, D.; Gama, J. Methods and tools for causal discovery and causal inference. Wiley Interdiscip. Rev. Data Min. Knowl. Discov. 2022, 12, e1449. [Google Scholar] [CrossRef]
- Galgoczy, M.C.; Phatak, A.; Vinson, D.; Mago, V.K.; Giabbanelli, P.J. (Re) shaping online narratives: When bots promote the message of President Trump during his first impeachment. PeerJ Comput. Sci. 2022, 8, e947. [Google Scholar] [CrossRef] [PubMed]
Figure 1.
Overview of research framework.

Figure 2.
Top hashtags and mentions for each group of healthcare organizations.

Figure 3.
Graph networks showing antecedent–consequent pairs. Public health agencies and WHO generate sparse graphs focused on COVID-19, whereas pharmaceutical companies generate a denser graph with words from different topics.
Figure 3.
Graph networks showing antecedent–consequent pairs. Public health agencies and WHO generate sparse graphs focused on COVID-19, whereas pharmaceutical companies generate a denser graph with words from different topics.


Table 1.
Number of tweets for each organization.
| Organization (Twitter Account) | Number of Tweets |  |
| Public Health Agencies | ||
| Centers for Disease Control and Prevention (@CDCgov) | 8629 | |
| Indian Health Service (@IHSgov) | 1832 | |
| Health Canada and PHAC (@GovCanHealth) | 52,518 | |
| Government of Canada for Indigenous (@GCIndigenous) | 3833 | |
| Total | 66,812 | |
| Pharmaceutical Companies | ||
| Pfizer (@pfizer) | 2813 | |
| Johnson & Johnson (@JNJNews) | 2538 | |
| Eli Lilly and Company (@LillyPad) | 2078 | |
| Merck (@Merck) | 2204 | |
| AbbVie (@abbvie) | 1913 | |
| Total | 11,546 | |
| Non-governmental Organization | ||
| World Health Organization (@WHO) | 25,989 | |
Table 2.
Model parameters for topic clustering using term frequency–inverse document frequency embeddings.
Table 2.
Model parameters for topic clustering using term frequency–inverse document frequency embeddings.
| Clustering Algorithm | Epochs | Chunk Size | A-Priori Belief on Doc-Topic Distribution | A-Priori Belief on Topic-Word Distribution | Gradient Descent Step Size |
|---|---|---|---|---|---|
| LDA | 50 | 1000 | 0.01 | 0.9 | NA |
| LSI | NA | 1000 | NA | NA | NA |
| NMF | 50 | 1000 | NA | NA | 1 |
| HDP | NA | 1000 | 0.01 | NA | 1 |
LDA: latent Dirichlet allocation, LSI: latent semantic indexing, NMF: non-negative matrix factorization, HDP: hierarchical dirichlet process.
Table 3.
Grid search parameters used for obtaining association rules.
| Twitter Group | Support Value | Confidence Value | Final Support Threshold | Final Confidence Threshold | Number of Rules | ||||
|---|---|---|---|---|---|---|---|---|---|
| Start | End | Step Size | Start | End | Step Size | ||||
| Public Health Agencies | 0.0095 | 0.105 | 0.001 | 0.5 | 1 | 0.1 | 0.1 | 0.9 | 980 |
| Pharmaceutical Companies | 0.03 | 0.04 | 0.001 | 0.5 | 1 | 0.1 | 0.034 | 0.5 | 278 |
| World Health Organization | 0.01 | 0.02 | 0.001 | 0.5 | 1 | 0.1 | 0.015 | 0.8 | 451 |
Table 4.
Mean coherence scores for topic modeling using different clustering algorithms. The models with the most coherent topic keywords are highlighted in green.
Table 4.
Mean coherence scores for topic modeling using different clustering algorithms. The models with the most coherent topic keywords are highlighted in green.
| Clustering Algorithm | Public Health Agencies | Pharmaceutical Companies | World Health Organization | |||
|---|---|---|---|---|---|---|
| cv | cumass | cv | cumass | cv | cumass | |
| LDA | 0.4240202647 | −4.494327319 | 0.4937176966 | −4.736215923 | 0.383932226 | −4.571343897 |
| NMF | 0.5105442417 | −3.58084239 | 0.5955689283 | −4.569011046 | 0.4195732471 | −4.223622355 |
| LSI | 0.4274006726 | −4.217779619 | 0.450525174 | −4.790466135 | 0.3155738006 | −4.245038402 |
| HDP | 0.6681490255 | −18.13566144 | 0.7406355945 | −19.83139046 | 0.7215923057 | −19.2754207 |
LDA: latent Dirichlet allocation, NMF: non-negative matrix factorization, LSI: latent semantic indexing, HDP: hierarchical Dirichlet process.
Table 5.
List of topics obtained for each Twitter group.
| Public Health Agencies | Pharmaceutical Companies | World Health Organization | |||
|---|---|---|---|---|---|
| Topic | Topic Keywords | Topic | Topic Keywords | Topic | Topic Keywords |
| Communication | [‘receive’,‘inform’, ‘reply’,‘offer’] | Communication | [‘shortage’,‘misinformation’] | Leadership | [‘drtedro’,‘meet’,‘report’, ‘remark’] |
| COVID-19 | [‘covid’,‘pandemic’, ‘death’,‘vaccine’,‘coronavirus’] | COVID-19 | [‘covid’,‘omicron’,‘vaccine’, ‘virus’,‘coronavirus’] | COVID-19 | [‘covid’,‘pandemic’,‘death’, ‘vaccine’,‘coronavirus’] |
| Community Healthcare | [‘support’,‘resource’, ‘family’,‘opportunity’,‘help’] | Community Healthcare | [‘cancer’,‘heart’,‘pregnancy’, ‘myeloma’,‘gene’,‘haemophilia’] | Community Healthcare | [‘support’,‘people’,‘live’, ‘protect’,‘safe’,‘risk’,‘care’] |
| General health | [‘disease’,‘mental’, ‘health’,‘stigma’] | Health announcements | [‘market’,‘field’,‘campaign’] | General Health | [‘health’,‘disease’, ‘emergency’] |
| Youth health | [‘youth’,‘active’,‘profession’] | World Regions | [‘europe’,‘usa’,‘canada’] | World Regions | [‘europe’,‘afro’,‘africa’, ‘country’,‘countries’] |
Table 6.
Heatmaps showing topic distribution for each organization.
| Topics | |||||
|---|---|---|---|---|---|
| Organization | Communication | COVID-19 | Community Health | General Health | Youth Health |
| CDCgov | 719 | 2306 | 2067 | 1850 | 195 |
| IHSgov | 148 | 329 | 438 | 602 | 103 |
| GovCanHealth | 17,989 | 18,170 | 27,937 | 13,353 | 4112 |
| GCIndigenous | 338 | 381 | 956 | 376 | 156 |
| Topics | |||||
| Organization | Communication | COVID-19 | Community Health | Health announcements | World Regions |
| pfizer | 8 | 551 | 450 | 17 | 27 |
| JNJNews | 3 | 393 | 162 | 42 | 23 |
| Merck | 3 | 145 | 450 | 14 | 8 |
| LillyPad | 8 | 36 | 73 | 5 | 14 |
| abbvie | 2 | 70 | 188 | 23 | 13 |
| Topics | |||||
| Organization | Leadership | COVID-19 | Community Health | General Health | World Regions |
| WHO | 1646 | 7165 | 11,486 | 8473 | 4097 |
Table 7.
Top association rules and performance metrics obtained.
| Twitter Group | Antecedents | Consequents | Antecedent Support |
Consequent Support |
Overall Support | Confidence | Lift | Leverage | Conviction |
|---|---|---|---|---|---|---|---|---|---|
| Public Health Agencies | covid | vaccine | 0.11 | 0.11 | 0.10 | 0.99 | 8.61 | 0.10 | 6851.90 |
| Pharmaceutical Companies | test | research | 0.03 | 0.03 | 0.03 | 0.99 | 28.72 | 0.03 | 388.03 |
| World Health Organization | public | health | 0.038 | 0.23 | 0.03 | 0.80 | 3.42 | 0.02 | 3.85 |
Table 8.
Results of causality analysis using two hypotheses to analyze the impact on tweet popularity.
Table 8.
Results of causality analysis using two hypotheses to analyze the impact on tweet popularity.
| Twitter Group | Hypothesis 1: Increase in Tweet Popularity Using Hashtags and Mentions | Hypothesis 2: Increase in Tweet Popularity Using Association Rules |  |
| Public Health Agencies | 14.90% | 45.50% | |
| Pharmaceutical Companies | 25.70% | 50.05% | |
| World Health Organization | 14.55% | 15.70% |
Disclaimer/Publisher’s Note: The statements, opinions and data contained in all publications are solely those of the individual author(s) and contributor(s) and not of MDPI and/or the editor(s). MDPI and/or the editor(s) disclaim responsibility for any injury to people or property resulting from any ideas, methods, instructions or products referred to in the content. |
© 2023 by the authors. Licensee MDPI, Basel, Switzerland. This article is an open access article distributed under the terms and conditions of the Creative Commons Attribution (CC BY) license (https://creativecommons.org/licenses/by/4.0/).
Share and Cite
MDPI and ACS Style
Singhal, A.; Mago, V. Exploring How Healthcare Organizations Use Twitter: A Discourse Analysis. Informatics 2023, 10, 65. https://doi.org/10.3390/informatics10030065
AMA Style
Singhal A, Mago V. Exploring How Healthcare Organizations Use Twitter: A Discourse Analysis. Informatics. 2023; 10(3):65. https://doi.org/10.3390/informatics10030065
Chicago/Turabian StyleSinghal, Aditya, and Vijay Mago. 2023. "Exploring How Healthcare Organizations Use Twitter: A Discourse Analysis" Informatics 10, no. 3: 65. https://doi.org/10.3390/informatics10030065
Note that from the first issue of 2016, this journal uses article numbers instead of page numbers. See further details here.