Article

Analysis of Factors Associated with Highway Personal Car and Truck Run-Off-Road Crashes: Decision Tree and Mixed Logit Model with Heterogeneity in Means and Variances Approaches

by
Thanapong Champahom
1,
Panuwat Wisutwattanasak
2,
Chamroeun Se
2,
Chinnakrit Banyong
3,
Sajjakaj Jomnonkwao
3,* and
Vatanavongs Ratanavaraha
3
1
Department of Management, Faculty of Business Administration, Rajamangala University of Technology Isan, Nakhon Ratchasima 30000, Thailand
2
Institute of Research and Development, Suranaree University of Technology, Nakhon Ratchasima 30000, Thailand
3
School of Transportation Engineering, Institute of Engineering, Suranaree University of Technology, Nakhon Ratchasima 30000, Thailand
*
Author to whom correspondence should be addressed.
Informatics 2023, 10(3), 66; https://doi.org/10.3390/informatics10030066
Submission received: 4 July 2023 / Revised: 10 August 2023 / Accepted: 15 August 2023 / Published: 18 August 2023
(This article belongs to the Special Issue Feature Papers in Big Data)

Abstract

:
Among several approaches to analyzing crash research, the use of machine learning and econometric analysis has found potential in the analysis. This study aims to empirically examine factors influencing the single-vehicle crash for personal cars and trucks using decision trees (DT) and mixed binary logit with heterogeneity in means and variances (RPBLHMV) and compare model accuracy. The data in this study were obtained from the Department of Highway during 2011–2017, and the results indicated that the RPBLHMV was superior due to its higher overall prediction accuracy, sensitivity, and specificity values when compared to the DT model. According to the RPBLHMV results, car models showed that injury severity was associated with driver gender, seat belt, mount the island, defect equipment, and safety equipment. For the truck model, it was found that crashes located at intersections or medians, mounts on the island, and safety equipment have a significant influence on injury severity. DT results also showed that running off-road and hitting safety equipment can reduce the risk of death for car and truck drivers. This finding can illustrate the difference causing the dependent variable in each model. The RPBLHMV showed the ability to capture random parameters and unobserved heterogeneity. But DT can be easily used to provide variable importance and show which factor has the most significance by sequencing. Each model has advantages and disadvantages. The study findings can give relevant authorities choices for measures and policy improvement based on two analysis methods in accordance with their policy design. Therefore, whether advocating road safety or improving policy measures, the use of appropriate methods can increase operational efficiency.

1. Introduction

Thailand, classified as a middle-income country, faces a significant number of serious crashes. As of 2018, the fatality rate stood at 32.7 per 100,000 people, ranking it eighth globally [1]. An analysis of data from the Highway Crash Information Management System [2] reveals that between 2011 and 2017, Thailand experienced the highest proportion of run-off-road crashes, accounting for approximately 52% (Figure 1). The current focus on addressing road accidents has led to increasing interest in the use of automated vehicles (AVs) as a potential solution. Scholars have highlighted the advantageous features of AVs, such as driving assistance systems and advanced sensors, which contribute to their ability to prevent accidents [3,4]. Moreover, the rise of AVs aligns with the growing popularity of electric vehicles, leading to not only a reduction in road risks but also the promotion of a greener environment and the advancement of industry 4.0 technology [5,6]. This aligns with the Sustainable Development Goals (SDGs) established to foster sustainability. However, it is important to acknowledge that before fully embracing these automatic and green industries, developing countries must first tackle the immediate issue of road accidents. Researchers have studied factors that affect the severity of collision crashes using various methods to solve road crash problems, as well as the correlation between driver factors and crash occurrence [7]. Figure 2 provides valuable insights into the fatality rate associated with crashes involving personal cars and trucks. Although these vehicles account for 46% of all crashes [1], it is important to note that they represent the medium- and large-sized vehicle categories. Literature findings from sources such as [8,9,10] further support the notion that car and truck-related crashes tend to result in more severe injuries and cause greater damage to both private and public properties compared to smaller groups of road users like pedestrians and motorcyclists. Additionally, it is worth highlighting that among the different types of crashes, single-vehicle incidents hold the highest proportion [11,12]. This information underscores the significance of considering the factors contributing to and consequences of single-vehicle crashes in efforts to enhance road safety [13].
Nowadays, numerous types of machine learning (ML) are applied in the study of crash severity; the decision tree (DT) is the method applied to algorithms’ arrangements to recognize the proportion of data based on determining variables. Thus, the researcher can use appropriate data to analyze complicated independent data [14,15]. The use of DT as an ML model offers a distinct advantage over other models, such as Artificial Neural Networks. Specifically, DT has the ability to determine the order of influence of independent variables on dependent variables through nodes and branches. In contrast, other ML models that utilize Blackbox algorithms cannot reveal the priority of factors. It is worth noting that DT is not able to improve model depth or increase accuracy when there is unobserved heterogeneity, unlike some other ML models. Nevertheless, the ability to obtain the order of important variables and a classification tree structure allows for meaningful comparisons with other econometric models, such as the logit model. According to the literature, it has been applied to crash analysis and predicted non-injury crashes in Malaysia [16] and crashes at the crosspoint between roads and railways in the United States [15]. In Thailand, the DT model was also used for analyzing rear-end collisions on Thai highways [17]. Nevertheless, if we can compare the unique results of DT with another method, it will give us different aspects.
Additionally, the logit model is a widely used method for predicting crashes and illustrates the comparison of the characteristics of different severity levels [18]. For example, Champahom, et al. [18] compared the severity of crash-related incidents on urban and rural roads in Thailand, Chen, et al. [19] studied the severity of injuries among truck drivers, and Huang, et al. [20] studied the severity of driver injury and vehicle damage in traffic congestion at intersections in Singapore [19,21]. The traditional logit model, on the other hand, appears to be an inefficient method for analyzing data with a large number of variables. Nowadays, scholars have established a random parameter model that can capture the variation and complexity of the model [22,23,24]; the extension of logit can describe the relationship between the fixed parameters of the model and can also explain the model’s variation. Moreover, researchers recently uncovered the concept of unobserved heterogeneity (in means and variances), which can apply to random parameters (probit) logit model in the analysis of traffic crash injury severity [25,26]; this represents a hidden influence (layer 2) that can affect the direction of random parameters of the model, this method could influence model complexity.
The aforementioned methods have been used in crash analysis and are based on the researcher’s objectives, which vary according to the research context and objectives, as each model has a different form of operation (algorithm). However, the proposed studies of DT and RPBLHMV analysis have not yet been discovered. Due to the quite different functions of the model, a study that can compare the significant results and the model’s performance of each method could reveal the model’s advantages and disadvantages and lead to efficient use [27].
This study foresees the potential for predicting the crash injury outcome of both models and the explanatory significance of significant results. So, the objective is to compare the crash data analysis from contributing factors, such as vehicle factors, driver factors, and road and environmental factors, to determine how they affect crash severity (fatal and non-fatal). To achieve this objective, this study mainly used two different techniques: The first is the data-driven technique (DT), and the second is econometric analysis (random parameters binary logit model with heterogeneity in means and variances: RPBLHMV) to analyze factors associated with drivers’ injury severity among personal car and truck run-off-road crashes. Past studies have confirmed that both methods have potential in crash analysis and revealed the associating factors, resulting in plans, measures, or policies that will help reduce road crashes. In addition to affecting factors, this study wants to compare the model accuracy (predicting outcome) between the DT and RPBLHMV models, including overall accuracy, sensitivity, and specificity. The contribution of the study is that it enables readers to understand the advantages and disadvantages of each model and then select the appropriate method for analyzing run-off-road crashes on highways (among personal car and truck drivers). In addition, these findings can give relevant authorities the contributing factors for establishing policies and measures to reduce the severity of run-off-road crashes. Good mitigation can result in both injury-related and property damage reduction.

2. Materials and Methods

2.1. Data Collection and Descriptive Statistics

This study used the crash database from the Department of Highways of Thailand, which comprised two parts: (1) data on highway crashes in Thailand from 2011 to 2017, as reported by police officers and recorded in the Highway Crash Information System Management (HAIMS), comprising causes, severity, driver characteristics, crash characteristics, vehicle characteristics, road characteristics, and environmental context. This dataset was screened for only personal car (total of 3448 cases) and truck (including at least 6-wheeled vehicles; a total of 1375 cases) crashes related to run-off-road collisions. In addition, collisions are categorized into two levels of severity: fatal (severe injury or fatality) and non-fatal (property-damaged only or minor injury) injuries. Variables are coded and described in Table 1.
To avoid multicollinearity among the observed indicators, this study had to ensure that no pair of components exhibited a high correlation. Table A1 and Table A2 illustrated correlations between the input indicators of personal car and truck models, respectively. According to Mukaka [28], correlations between relevant variables should be less than 0.800, and the findings confirm that the statistical values fall within an acceptable range.

2.2. Decision Tree (DT)

For data analysis, this study used the DT model, which comprises two components [29]. The first component was the decision model structure, which comprises (a) the decision node, which functions as a node representing variables used for data sorting; (b) the branches representing the variables’ values used to sort the data of each decision node; and (c) the leaf node showing the final result of sorting data of that variable. The second component was algorithms, which include (a) splitting, for selecting and dividing variable values in data sorting; (b) stopping, for controlling the model’s establishment and termination based on specified conditions, ensuring that the model is not overfitting or underfitting; and (c) pruning, for adapting the model to optimize the model’s suitability. This study applied the CART algorithm, which has the following advantages: (1) it analyzes both category and continuous variables [29]; (2) it has a binary splitting node format, suitably used for interpretation in crash data analysis [14]; (3) it analyzes the influence of the independent variables on the dependent variables [29], and uses the widely employed Gini algorithms.

2.3. Random Parameters (Mixed) Binary Logit Model

In this research, the mixed binary logit model was used to examine the factors affecting the severity of driver injuries as classified by the following involved vehicles: cars and trucks. This study adopted the random parameters binary logit model for the model analysis. The model begins by defining the severity function S j m of crash m sustaining injury severity j as follows (Equation (1)) [12]:
S j m = β j X j m + ε j m
where X j m denotes a vector of the crash-level factors (independent variables) with β j as a vector of estimable parameters, and ε j m is an error term. Taking into account crash-specific unobserved heterogeneity, the outcome probabilities of random parameters logit model of car and truck driver-injury severities can be defined [30]
P m ( j ) = E X P ( β j X j m ) j E X P ( β j X j m ) f ( β | ρ ) d β j
where P m ( j ) defines the probability of driver injury severities j in crash m, f ( β | ρ ) is the density function of β with ρ being vector of parameters (means and variances). To account for possibility of unobserved heterogeneity in the means and variances of random parameters, the Equation is as follows
β j m = β j + Φ j m Z j m + σ j m E X P ( ω j m W j m ) V j m
where β j m is a vector of estimated parameters that varies across crashes. β j refers to the mean parameter estimate across all crashes, Z j m is a vector of the explanatory variable that captures heterogeneity in the mean that influences severities level j, Φ j m represents a vector of estimable parameters, W j m refers to a vector of crashes-specific variables that captures heterogeneity in the standard deviation σ j m with corresponding vector ω j m , and disturbance term is denoted by V j m .

2.4. Classification Accuracy

Model efficiency performance can be verified by using statistical values: true positive true negative, false positive, and false negative (Table 2). To build the metrics validating data of the model and covering model performance evaluation, we calculated the model by using Equations (4)–(6), respectively. The obtained results from the model test [31] are as follows:
A c c u r a c y = T P + T N T P + T N + F N + F P
S e n s i t i v i t y = T P T P + F N
S p e c i f i c i t y = T N F P + T N

3. Results and Discussion

In this section, two statistical models (DT and RPBLHMV) were analyzed, and their independent variable importance was presented. Then, each model was used to test the most efficient model’s performance in analyzing factors affecting the severity of run-off-road crashes (car and truck).

3.1. The Comparison of Model Prediction Accuracy

This study has compared the model accuracy for factors affecting drivers’ injury severity in run-off-road crashes among cars and trucks on Thai highways. The presentation of DT and RPBLHMV found that each model could have advantages and disadvantages in the present study. The model’s performance was measured based on its ability to predict with overall accuracy, sensitivity (predicting the true positive), and specificity (predicting the true negative), as shown in Table 3 below. We considered evaluating the ability to predict as a measure of the model’s accuracy.
In terms of the DT model (Table 4), the overall prediction accuracy between the car and truck models is quite similar. However, upon closer examination of sensitivity, it was observed that the truck model failed to predict any fatal crashes (0%). This limitation may stem from the smaller sample size of truck crashes (1375 cases), which falls below the required number for accurate measurement indicators. In light of previous findings by McNamara, et al. [32] and Genç and Mendeş [33], the necessary sample size may vary based on the type of measurement indicators or data used. Nevertheless, larger samples tend to yield more stable estimations and higher prediction accuracy.
While the car model exhibited a sensitivity greater than zero (24.85%), it still falls short when compared to the results obtained from mixed logit models. Notably, the prediction efficiency of the mixed logit models, encompassing both personal cars and trucks, proved intriguing. These models demonstrated the ability to correctly predict overall accuracy at a rate exceeding 80%, with sensitivity surpassing 40% and an almost perfect specificity of close to 100%. The performance of the RPBLHMV model also aligns with prior literature [34], which has confirmed its superior predictive accuracy compared to traditional models due to its capability to capture hidden effects of unobserved heterogeneity (i.e., layer-2 effect) among crashes. Based on these findings, it can be concluded that the RPBLHMV models exhibit superiority over the DT models, particularly in terms of predicting sensitivity.
Additionally, to effectively choose a model, a model with 0% accuracy for some factors can be a problem for model analysis when you need to predict some level of outcome (only non-fatal or fatal), not the overall outcome. Thus, a model with low prediction error must be selected for analyzing factors related to crashes [35,36]. The results of RPBLHMV, therefore, appeared to be an appropriate method for explaining and predicting the run-off-road crashes in this study, considering the low percentage of errors.

3.2. Results of the Decision Tree Model

3.2.1. Personal Car Classification

According to Figure 3, the results found four variables related to the dependent variable (injury severity). Off-road crashes on straight roads are the most variable factor that is significantly associated with the severity of a car driver’s injury in a run-off-road crash. The results revealed that 53.9% of drivers who ran off the road on a straight route were more likely to die. There is evidence that straight roads (no curves) cause drivers to drive faster, resulting in greater injury severity when crashes occur (consistent with the finding of Obaid, et al. [37]). Further, the significant variable related to driver injury was a raised median [17]; the statistical results revealed that 36.5% of off-road drivers with a raised median have a greater chance of becoming more severe. Going off-road on curves is a significant variable in driver fatalities; the results revealed that off-road on curves cause drivers to fall into severe injury (36.5%) when compared to others [38]. This evidence could imply that run-off-road crashes on highways were found to be severe problems that had to be mitigated. Furthermore, 42.9% of drivers who suffer off-road on curves were found to be more likely to die when driving on dry roads, which is consistent with the findings of Peng and Boyle [39].

3.2.2. Truck Classification

The results of DT for truck drivers also found four variables related to the crash injury severity as well (as shown in Figure 4). Off-road crashes that go straight and strike safety equipment are the most significantly associated factor; results show that safety equipment (a safety barrier or guardrail) can save a driver’s life (81.5% of crashes that strike safety equipment result in minor injury or PDO). Followed by mounted the traffic island, the results illustrated that truck drivers who are not mounting the island and have not off-straight road ben associated with minor injuries. Further, hitting safety equipment on curves is related to the level of severity (27.7% chance of fatal injuries). These findings suggest that a safety barrier or guardrail could reduce the severity of single-vehicle truck crashes (fewer fatalities) [40]. The last variable is road surface; this result is in line with the car model. The status of the road surface is one of the major factors that could influence the control of the vehicle while driving and result in levels of injury severity when suffering crashes, as confirmed by the evidence in related literature [39].

3.3. Results of Random Parameters Binary Logit Model with Unobserved Heterogeneity

3.3.1. Explaining the Fix Parameters

According to Table 5 results, it was found that various factors related to run-off-road crashes could influence personal car and truck driver injury severity. The results found that McFadden R2 of the car model was 0.0595 and 0.0502 for the truck model; that is, the variance of the data was explained at 5.95% and 5.02%, respectively [41]. The value of McFadden R2 is dependent on the data used, as confirmed by related literature [42,43,44], which indicated their McFadden R2 ranges from 0.03 to 0.08. Although the model exhibits a low R2, it still has potential in terms of explaining variables. Furthermore, the model’s performance can be assessed through prediction ability, such as overall accuracy, sensitivity, and specificity, as shown in Table 4. Additionally, the RPBLHMV captures the random parameters of the model, which can impact the variance and introduce complexity for both car and truck drivers. Moreover, we tested the statistical fit of the model using a likelihood ratio test, as described in Equation (7):
χ 2 = 2 [ L L β R P B L H M V L L ( β w i t h o u t R P ) ]
The results demonstrate that the RPBLHMV significantly outperforms the traditional model (without random parameters and heterogeneities). Specifically, we observed a significant improvement in the RPBLHMV for both car and truck models at a 99% confidence interval.
The RPBLHMV model was analyzed in terms of factors related to non-fatal or fatal crashes. The driver factors of personal cars with seat-belt-wearing behavior were significantly related to the reduction in deaths from crashes because wearing seat belts helps prevent the driver’s physical severity in injury from being crushed in the crash and bouncing off the vehicle, which is consistent with related literature [12]. Following gender, the findings revealed that male drivers were more likely to sustain serious injuries in run-off-road collisions; this finding is in line with Al-Balbissi [45], who reported that there was a definite trend toward significantly higher accident rates for male drivers compared with female drivers.
Factors related to crash characteristics have a significant effect on the risk faced by private car and truck occupants. A finding of this study was that road crashes within a vehicle mounted on the median had fewer chances of death for private car and truck users [12]. Furthermore, personal car crashes that are caused by passing in front of an occupant car and defective equipment of vehicle influence the drivers to become less likely to die. This is consistent with a finding of Behnood and Mannering [46]. Additionally, the truck model illustrated that a road divided by raised or barrier median could potentially save truck drivers from the risk of fatality; this finding is in accordance with relevant literature [11,46].
Further, personal car and truck drivers who have a crash by driving vehicles off the road, whether on the straight or curve, and hitting safety equipment (barrier or guardrail) on the roadside, the likelihood of fatal crashes is potentially reduced (the same is true for truck crashes with a barrier median). This finding is consistent with that of Roque, et al. [40] and Chitturi, et al. [47]; that is, the unavailability of roadside safety equipment in the case of run-off-road crashes would result in increasing fatality. Roque, et al. [40] also revealed that roadside features such as safety barriers and guardrails significantly reduce the fatality risk for drivers. This result is logical and meets the purpose of the implementation. In addition, this study also found that roadsides without safety barriers or guardrails could cause severe injuries to car and truck drivers.

3.3.2. Influence of Random Parameters and Unobserved Heterogeneity

In the case of random parameters, the factors that have the potential to be random parameters of car drivers are raised, and barrier median. This study found that car drivers who have a crash at a raised median or road with a slope are less likely to die. These results also found truck drivers who have crashed at the no-road divider areas tend to decrease the level of severity.
This study also captured the unobserved heterogeneity in the means of the data. The personal car results illustrated that crashes caused by falling asleep can increase the likelihood of death in crashes on grading roads [48]. In contrast, fall-asleep indicators have been found to decrease injury severity when a crash occurred on the raised median. For truck drivers, falling asleep also influences the injury severity of crashes at no median road. In addition, The result of the personal car model illustrated the crash occurred at an intersection as representative of heterogeneity in variances that can decrease the variation of injury severity of crash at raised median and slope. A previous study reported that intersection area generally creates a number of conflicts with traffic [49]; as a result, they become a cautious area where driver drive with greater caution and slow their vehicle down while driving within these areas. Therefore, even if encountering a crash, it probably does not cause more serious injury to the driver (this is consistent with Ma, et al. [50]). Regarding truck results, driving at nighttime and off-road crash on strength could influence the proportion of death in truck driver crashes.

4. Conclusions

The purpose of this study was to compare two potential analysis concepts (data-driven and econometric analysis) in the study of run-off-road injury severity. The data was obtained from Thailand’s Department of Highways, which contained statistics on car and truck run-off-road crashes on highways between 2011 and 2017. The dependent variable is divided into two categories consisting of non-fatal and fatal injuries. The study results are presented as follows:
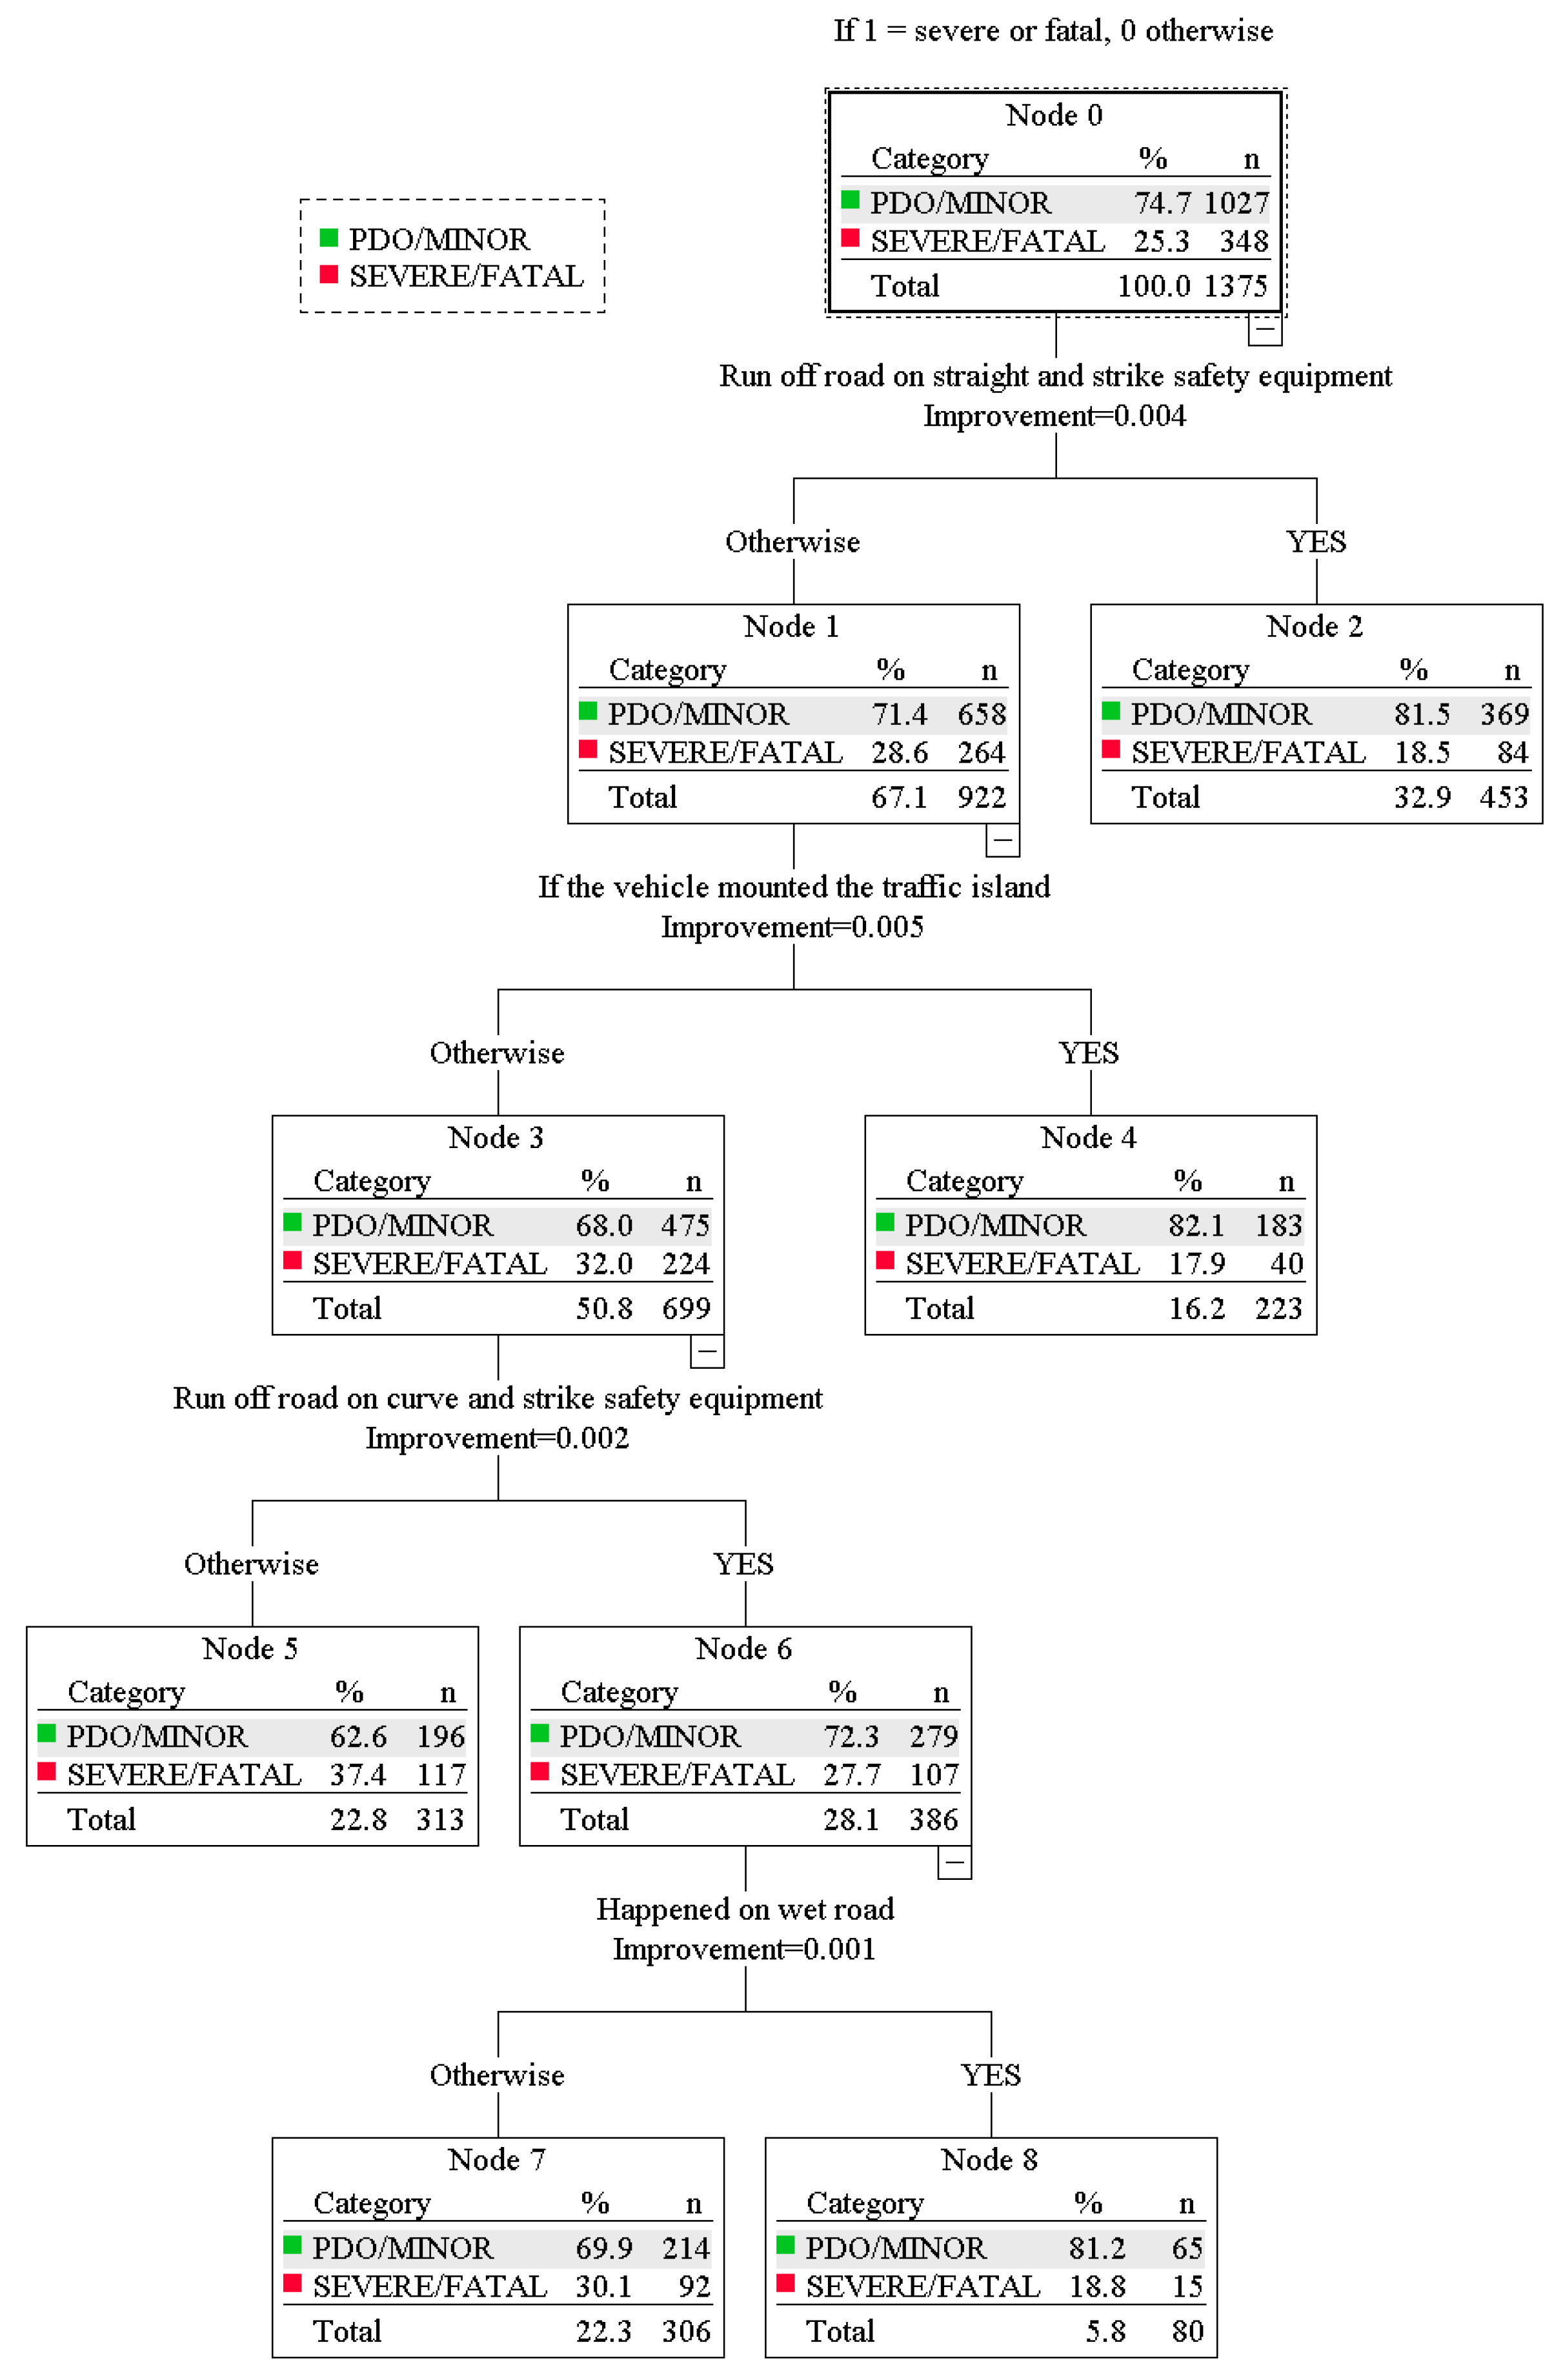
Regarding DT results, it was indicated that there is a difference between the variables important to the model among personal car and truck run-off-road crashes on highways. Off-road conditions on straight and curved roads raised medians, and wet surfaces were found to be of variable importance in causing car crashes in this study. Furthermore, wet surfaces, off-roading with striking safety equipment (both straight and curved), and traffic island mounting were discovered to be of variable importance depending on the truck model.
According to the RPBLHMV analysis results, factors associated with crash severity were classified as non-random, random parameters, and unobserved heterogeneity in means and variances. The car model demonstrates that the driver’s use of a seat belt reduces the risk of fatality. Crash characteristics, including off-roading with striking safety equipment, can reduce the risk of death. Furthermore, raised median and slope were representations of the model random parameter. Falling asleep and encountering intersections play a heterogeneous role in means and variances, respectively. For the truck model, it was found that intersections, raised and barrier medians, and mounted traffic islands can affect the crash injury severity, and it was also captured that crashes at no median area could influence the model’s variation. In addition, falling asleep, nighttime, and strong off-road crash represented the model’s heterogeneity in means and variance.
Practical implications arise from considering the associated factors, thereby emphasizing the need for relevant agencies involved in policy design to prioritize certain measures. These include promoting legislation on seat belt usage [51] and enhancing knowledge through safe driving training courses, enabling drivers to exercise caution and attentiveness while operating vehicles [52]. These factors hold a significant influence over personal car drivers. Additionally, the potential of guardrails and other safety equipment in reducing fatality risks for both car and truck drivers, as observed in both RPBLHMV and DT models, suggests the importance of strategically installing such safety measures to enhance overall road safety effectiveness.
Furthermore, the RPBLHMV model demonstrates its ability to capture unobserved heterogeneity, which plays a crucial role in accounting for hidden effects and enhancing the explanatory power of the model. On the other hand, the DT model offers a straightforward approach to identifying variable importance in relation to injury severity by prioritizing factors through sequencing, thereby providing valuable insights into the most significant factors.
In terms of the comparative method employed in this study, it reveals the advantages and disadvantages of utilizing both machine learning (ML) and econometric analysis concepts. This comparison enables authorities to make informed model choices that align with their specific objectives and facilitates the design of appropriate measures and policies accordingly. By understanding the strengths and weaknesses of each approach, decision-makers can effectively tailor their strategies to achieve desired outcomes.
In terms of related areas, as per recommendations, around the routes prone to crashes, the involved agencies should design protective equipment in such areas. In addition, to reduce the likelihood of death and the damage associated with other road users from run-off-road collisions, safety barriers and guard rails should be installed to prevent vehicles from deviating from the routes [53].
As per research limitations, this study only focused on factors associated with run-off-road crashes; this type of crash may have some different attributes when compared to others [54]; a study on another type of crash could produce different results. In this study, DT can be easily used to provide variable importance in the model but has limitations in terms of providing direction for independent variables on crash severity. However, the RPBLHMV has the potential to address such a problem and showed greater overall prediction accuracy than DT. However, the McFadden R2 and AIC scores remain relatively low, particularly for the truck model. This indicates that despite the overall improvement in model accuracy compared to the DT approach, there is still a limited extent to which the model explains the variance in the data. To enhance the model’s explanatory power in future research, it may be necessary to adjust the model parameters or consider alternative methods that better fit the data. Furthermore, it is recommended to explore comparative methods utilized in other geographical areas beyond Thailand, as well as conduct more comprehensive comparisons. Incorporating numerical values from relevant literature into the comparative analysis can yield more efficient and effective results. By broadening the scope of the comparison and delving deeper into the existing body of knowledge, researchers can gain valuable insights and enhance the robustness of their findings. Based on the specific advantages and disadvantages of data-driven and econometric analysis, the method potentially empowers researchers to determine the method appropriate to the educational context.

Author Contributions

Conceptualization, T.C. and P.W.; methodology, T.C. and C.B.; software, S.J. and V.R.; validation, C.S.; formal analysis, P.W.; resources, V.R.; data curation, T.C.; writing—original draft preparation, T.C. and P.W.; writing—review and editing, P.W.; visualization, C.S.; supervision, C.B.; project administration, V.R.; funding acquisition, S.J. All authors have read and agreed to the published version of the manuscript.

Funding

This research was supported by (i) Suranaree University of Technology (SUT), (ii) Thailand Science Research and Innovation (TSRI), and (iii) the National Science, Research and Innovation Fund (NSRF) (project code: 4284945) (Grant number: Full-time61/02/2566).

Institutional Review Board Statement

The study was conducted according to the guidelines of the Declaration of Helsinki and approved by the Ethics Committee of Suranaree University of Technology (COE.5/2565).

Informed Consent Statement

Not applicable.

Data Availability Statement

Data available on request due to restrictions.

Conflicts of Interest

The authors declare no conflict of interest.

Appendix A

Table A1. Correlations between related indicators of personal car data.
SEVV1V2V3V4V5V6V7V8V9V10V11V12V13V14V15
SEV1−0.0190.006−0.0020.0220.031−0.034 *0.040 *−0.0280.035 *0.036 *−0.009−0.028−0.022−0.0240.020
V1−0.0191−0.403 **−0.288 **−0.229 **−0.041 *−0.0080.033−0.002−0.015−0.0210.055 **0.014−0.021−0.040 *0.032
V20.006−0.403 **1−0.202 **−0.161 **0.0220.014−0.012−0.005−0.0040.018−0.0120.0020.0110.051 **−0.019
V3−0.002−0.288 **−0.202 **1−0.115 **0.0060.002−0.024−0.0100.011−0.0070.007−0.013−0.0030.0120.005
V40.022−0.229 **−0.161 **−0.115 **10.069 **0.031−0.024−0.0180.034 *0.005−0.0240.0120.0140.0090.001
V50.031−0.041 *0.0220.0060.069 **1−0.0160.0030.0160.001−0.020−0.0290.0070.0150.0210.020
V6−0.034 *−0.0080.0140.0020.031−0.01610.029−0.061 **0.050 **0.0170.074 **0.039 *0.0120.0040.004
V70.040 *0.033−0.012−0.024−0.0240.0030.0291−0.132 **−0.0290.0040.0100.039 *0.024−0.0220.031
V8−0.028−0.002−0.005−0.010−0.0180.016−0.061 **−0.132 **1−0.756 **−0.005−0.0030.044 *−0.047 **0.018−0.009
V90.035 *−0.015−0.0040.0110.034 *0.0010.050 **−0.029−0.756 **1−0.0040.010−0.055 **0.020−0.011−0.011
V100.036 *−0.0210.018−0.0070.005−0.0200.0170.004−0.005−0.0041−0.039 *−0.0090.055 **0.0200.000
V11−0.0090.055 **−0.0120.007−0.024−0.0290.074 **0.010−0.0030.010−0.039 *10.059 **−0.030−0.034 *0.011
V12−0.0280.0140.002−0.0130.0120.0070.039 *0.039 *0.044 *−0.055 **−0.0090.059 **1−0.044 **−0.066 **−0.021
V13−0.022−0.0210.011−0.0030.0140.0150.0120.024-.047 **0.0200.055 **−0.030−0.044 **10.106 **0.107 **
V14−0.024−0.040 *0.051 **0.0120.0090.0210.004−0.0220.018−0.0110.020−0.034 *−0.066 **0.106 **10.015
V150.0200.032−0.0190.0050.0010.0200.0040.031−0.009−0.0110.0000.011−0.0210.107 **0.0151
V160.0210.011−0.0260.0290.0140.021−0.0100.050 **−0.074 **0.0260.0070.125 **0.127 **−0.039 *−0.187 **−0.002
V17−0.034 *0.041 *−0.003−0.048 **−0.0080.0220.024−0.021−0.064 **0.036 *0.0080.049 **0.0190.018−0.063 **0.003
V18−0.048 **−0.003−0.016−0.0170.0070.008−0.049 **0.0060.064 **−0.070 **−0.005−0.084 **−0.066 **0.115 **0.279 **0.034 *
V190.042 *−0.0300.0280.0130.010−0.0200.066 **−0.036 *0.0280.037 *−0.029−0.030−0.098 **−0.088 **−0.037 *−0.025
V20−0.0040.0180.020−0.002−0.055 **−0.036 *−0.038 *−0.0200.023−0.0260.057 **−0.070 **0.059 **−0.006−0.040 *−0.010
V21−0.055 **−0.038 *0.030−0.0040.0010.004−0.058 **−0.0150.062 **−0.046 **−0.017−0.063 **−0.140 **0.101 **0.330 **0.015
V22−0.024−0.0160.0000.028−0.0050.0120.013−0.019−0.291 **−0.052 **0.001−0.022−0.0060.034 *0.0160.027
V23−0.023−0.0130.0300.029−0.015−0.0030.015−0.015−0.228 **−0.041 *−0.003−0.031−0.0250.0000.008−0.011
V24−0.030−0.0200.086 **0.001−0.008−0.0200.047 **0.0100.121 **−0.111 **−0.0150.063 **0.104 **−0.012−0.007−0.027
V250.014−0.0070.013−0.0230.016−0.001−0.003−0.0080.018−0.0230.046 **0.019−0.0190.0200.043 *−0.006
V26−0.036 *0.0000.068 **−0.002−0.006−0.0170.0310.0170.124 **−0.116 **−0.0170.062 **0.085 **−0.004−0.002−0.023
V270.0010.068 **−0.019−0.050 **−0.112 **0.078 **−0.0250.079 **−0.0020.0140.016−0.051 **−0.067 **0.064 **0.099 **0.008
V280.230 **−0.0030.000−0.0030.016−0.0180.0150.042 *−0.092 **0.096 **0.041 *0.026−0.085 **−0.066 **−0.114 **−0.024
V29−0.084 **−0.005−0.020−0.010−0.0010.006−0.024−0.040 *−0.045 **0.059 **−0.010−0.004−0.171 **0.015−0.087 **0.017
V300.049 **0.017−0.0040.0120.0070.0190.0300.006−0.001−0.040 *0.0110.037 *0.153 **−0.024−0.073 **−0.012
V31−0.085 **0.047 **−0.0140.011−0.022−0.0060.057 **0.0090.072 **−0.065 **−0.034 *0.055 **0.360 **−0.051 **−0.136 **−0.020
V16V17V18V19V20V21V22V23V24V25V26V27V28V29V30V31
V161−0.140 **−0.376 **−0.438 **−0.138 **−0.291 **0.013−0.013−0.0270.016−0.0110.0040.069 **0.066 **0.087 **0.146 **
V17−0.140 **1−0.144 **−0.168 **−0.053 **−0.075 **0.0240.046 **−0.001−0.014−0.0100.046 **−0.0250.074 **−0.0060.025
V18−0.376 **−0.144 **1−0.452 **−0.142 **0.397 **0.0230.0070.0310.035 *0.035 *0.124 **−0.155 **−0.220 **−0.047 **−0.051 **
V19−0.438 **−0.168 **−0.452 **1−0.166 **−0.024−0.041 *−0.014−0.018−0.035 *−0.027−0.128 **0.090 **0.094 **−0.057 **−0.100 **
V20−0.138 **−0.053 **−0.142 **−0.166 **1−0.082 **−0.004−0.0010.031−0.0140.021−0.0270.0000.048 **0.042 *−0.013
V21−0.291 **−0.075 **0.397 **−0.024−0.082 **1−0.009−0.021−0.0030.041 *0.0170.135 **−0.232 **−0.397 **−0.141 **−0.279 **
V220.0130.0240.023−0.041 *−0.004−0.0091−0.016−0.044 *−0.009−0.053 **−0.038 *−0.0090.040 *0.001−0.042 *
V23−0.0130.046 **0.007−0.014−0.001−0.021−0.0161−0.026−0.007−0.029−0.0270.0160.0140.007−0.027
V24−0.027−0.0010.031−0.0180.031−0.003−0.044 *−0.02610.0260.888 **−0.088 **−0.033−0.094 **0.089 **0.091 **
V250.016−0.0140.035 *−0.035*−0.0140.041 *−0.009−0.0070.02610.0230.033−0.011−0.0320.005−0.006
V26−0.011−0.0100.035*−0.0270.0210.017−0.053 **−0.0290.888 **0.0231−0.044 *−0.029−0.102 **0.083 **0.081 **
V270.0040.046 **0.124 **−0.128 **−0.0270.135 **−0.038 *−0.027−0.088 **0.033−0.044 *1−0.066 **−0.013−0.087 **−0.022
V280.069 **−0.025−0.155 **0.090 **0.000−0.232 **−0.0090.016−0.033−0.011−0.029−0.066 **1−0.279 **−0.099 **−0.196 **
V290.066 **0.074 **−0.220 **0.094 **0.048 **−0.397 **0.040 *0.014−0.094 **−0.032−0.102 **−0.013−0.279 **1−0.170 **−0.336 **
V300.087 **−0.006−0.047 **−0.057 **0.042 *−0.141 **0.0010.0070.089 **0.0050.083 **−0.087 **−0.099 **−0.170 **1−0.119 **
V310.146 **0.025−0.051 **−0.100 **−0.013−0.279 **−0.042 *−0.0270.091 **−0.0060.081 **−0.022−0.196 **−0.336 **−0.119 **1
Note: ** indicates that correlation is significant at 0.01 level (2-tailed). * indicates that correlation is significant at 0.05 level (2-tailed).
Table A2. Correlations between related indicators of truck data.
SEVV1V2V3V4V5V6V7V8V9V10V11V12V13V14V15
SEV1
V1−0.0421
V20.038−0.485 **1
V3−0.004−0.336 **−0.326 **1
V40.020−0.176 **−0.171 **−0.118 **1
V50.001−0.0330.0310.0040.0231
V6−0.0280.0200.002−0.002−0.0390.0061
V70.009−0.0240.0150.026−0.0210.008−0.0111
V8−0.0360.0470.009−0.0450.012−0.0100.003−0.0381
V90.0300.012−0.0080.008−0.056 *0.015−0.034−0.010−0.622 **1
V10−0.001−0.0100.014−0.007−0.0020.0150.028−0.0140.017−0.0271
V11−0.025−0.0270.028−0.0230.017−0.0250.050−0.011−0.078 **0.033−0.0111
V120.070 **−0.0130.0130.0220.0240.0470.052−0.0430.005−0.133 **−0.0020.0461
V13−0.070 **−0.0160.020−0.004−0.0090.0010.0090.0050.038−0.063 *0.032−0.054 *−0.106 **1
V14−0.054 *−0.0040.016−0.0260.007−0.0450.0070.0160.013−0.0070.0000.002−0.098 **0.073 **1
V15−0.019−0.0170.003−0.0240.0100.0090.043−0.008−0.008−0.038−0.0150.025−0.0270.055 *0.0111
V160.080 **−0.0480.0210.0360.0120.0360.0320.027−0.079 **−0.047−0.0160.130 **0.377 **−0.088 **−0.173 **−0.020
V17−0.0060.018−0.0490.0030.010−0.029−0.037−0.0150.004−0.0110.024−0.003−0.0360.037−0.0430.120 **
V18−0.087 **0.048−0.023−0.014−0.012−0.037−0.071 **0.0040.049−0.060 *−0.018−0.146 **−0.164 **0.202 **0.165 **−0.044
V19−0.0040.009−0.009−0.019−0.0070.0220.076 **−0.0110.0040.126 **0.0090.008−0.248 **−0.078 **0.079 **0.027
V20−0.020−0.0220.041−0.0040.006−0.036−0.068 *−0.0230.070 **−0.0520.027−0.0300.022−0.011−0.041−0.026
V21−0.075 **0.028−0.023−0.0460.009−0.022−0.065 *0.0320.057 *−0.036−0.0350.031−0.195 **0.057 *0.279 **0.022
V22−0.013−0.0260.0050.029−0.028−0.0270.048−0.016−0.283 **−0.074 **−0.0300.049−0.061 *0.0460.0260.115 **
V230.022−0.081 **−0.0050.056 *0.072 **−0.0070.0150.012−0.407 **−0.107 **−0.0070.0240.111 **−0.017−0.026−0.025
V24−0.064 *−0.0130.0170.054 *−0.0230.0080.0070.0430.189 **−0.133 **−0.0130.068 *−0.0260.0370.0530.031
V25−0.0130.000−0.022−0.0030.078 **0.0060.042−0.006−0.0290.0050.058 *0.0180.0220.019−0.016−0.006
V26−0.070 **−0.0060.0200.055 *−0.0310.0110.0290.0390.186 **−0.149 **−0.0070.075 **−0.0240.0450.0430.028
V270.0000.0220.030−0.066 *−0.0210.0000.087 **−0.003−0.058 *0.138 **0.028−0.010−0.004−0.0360.032−0.016
V280.090 **0.013−0.011−0.016−0.0050.003−0.0230.031−0.132 **0.159 **−0.0060.056*−0.097 **−0.035−0.045−0.003
V29−0.109 **0.0230.007−0.029−0.016−0.0010.055 *−0.005−0.0160.064 *0.011−0.097 **−0.268 **0.047−0.0290.001
V300.083 **−0.007−0.0170.0340.0080.028−0.042−0.025−0.010−0.072 **0.053 *0.0460.244 **−0.070 **−0.071 **−0.028
V310.035−0.0290.0050.0500.018−0.0110.055 *−0.0340.069 *−0.108 **−0.0210.0380.373 **−0.046−0.110 **−0.024
V16V17V18V19V20V21V22V23V24V25V26V27V28V29V30V31
V161−0.131 **−0.346 **−0.555 **−0.200 **−0.282 **−0.067 *0.113 **−0.085 **−0.002−0.056 *−0.022−0.042−0.182 **0.173 **0.344 **
V17−0.131 **1−0.083 **−0.134 **−0.048−0.055 *0.039−0.0300.007−0.012−0.0100.0130.0010.100 **−0.036−0.045
V18−0.346 **−0.083 **1−0.355 **−0.128 **0.254 **0.020−0.0100.096 **0.055 *0.101 **−0.049−0.073 **−0.032−0.061 *−0.117 **
V19−0.555 **−0.134 **−0.355 **1−0.206 **0.127 **0.014−0.084 **−0.002−0.027−0.0230.068 *0.123 **0.150 **−0.143 **−0.229 **
V20−0.200 **−0.048−0.128 **−0.206 **1−0.058 *0.030−0.0260.015−0.018−0.002−0.027−0.0380.0470.058 *−0.011
V21−0.282 **−0.055 *0.254 **0.127 **−0.058 *10.052−0.0210.077 **0.0310.079 **0.020−0.141 **−0.308 **−0.129 **−0.275 **
V22−0.067 *0.0390.0200.0140.0300.0521−0.049−0.041−0.012−0.036−0.031−0.0030.028−0.039−0.069 *
V230.113 **−0.030−0.010−0.084 **−0.026−0.021−0.0491−0.117 **−0.018−0.095 **−0.098 **−0.024−0.0480.075 **0.031
V24−0.085 **0.0070.096 **−0.0020.0150.077 **−0.041−0.117 **1−0.0050.923 **−0.075 **−0.022−0.0510.0090.012
V25−0.002−0.0120.055 *−0.027−0.0180.031−0.012−0.018−0.00510.0190.011−0.0210.0010.021−0.017
V26−0.056 *−0.0100.101 **−0.023−0.0020.079 **−0.036−0.095 **0.923 **0.0191−0.040−0.026−0.062 *−0.0080.039
V27−0.0220.013−0.0490.068 *−0.0270.020−0.031−0.098 **−0.075 **0.011−0.04010.0130.057 *−0.106 **0.020
V28−0.0420.001−0.073 **0.123 **−0.038−0.141 **−0.003−0.024−0.022−0.021−0.0260.0131−0.225 **−0.094 **−0.200 **
V29−0.182 **0.100 **−0.0320.150 **0.047−0.308 **0.028−0.048−0.0510.001−0.062 *0.057 *−0.225 **1−0.206 **−0.438 **
V300.173 **−0.036−0.061 *−0.143 **0.058 *−0.129 **−0.0390.075 **0.0090.021−0.008−0.106 **−0.094 **−0.206 **1−0.183 **
V310.344 **−0.045−0.117 **−0.229 **−0.011−0.275 **−0.069 *0.0310.012−0.0170.0390.020−0.200 **−0.438 **−0.183 **1
Note: ** indicates that correlation is significant at 0.01 level (2-tailed). * indicates that correlation is significant at 0.05 level (2-tailed).

References

  1. World Health Organization. Global Status Report on Road Safety 2018: Summary. Available online: http://roadsafety.disaster.go.th/upload/minisite/file_attach/196/5c40605487b65.pdf (accessed on 20 June 2022).
  2. Department of Highway. Thailand Traffic Accident on National Highway in 2016. Available online: http://bhs.doh.go.th/download/accident (accessed on 20 June 2022).
  3. Paliotto, A.; Alessandrini, A.; Mazzia, E.; Tiberi, P.; Tripodi, A. Assessing the Impact on Road Safety of Automated Vehicles: An Infrastructure Inspection-Based Approach. Future Transp. 2022, 2, 522–540. [Google Scholar] [CrossRef]
  4. Deng, M.; Guo, Y.; Fu, R.; Wang, C. Factors influencing the user acceptance of automated vehicles based on vehicle-road collaboration. IEEE Access 2020, 8, 134151–134160. [Google Scholar] [CrossRef]
  5. Rehman Khan, S.A.; Ahmad, Z.; Sheikh, A.A.; Yu, Z. Digital transformation, smart technologies, and eco-innovation are paving the way toward sustainable supply chain performance. Sci. Prog. 2022, 105, 1–26. [Google Scholar] [CrossRef]
  6. Khan, S.A.; Umar, M.; Asadov, A.; Tanveer, M.; Yu, Z. Technological Revolution and Circular Economy Practices: A Mechanism of Green Economy. Sustainability 2022, 14, 4524. [Google Scholar] [CrossRef]
  7. Kalyoncuoglu, S.F.; Tigdemir, M. An alternative approach for modelling and simulation of traffic data: Artificial neural networks. Simul. Model. Pract. Theory 2004, 12, 351–362. [Google Scholar] [CrossRef]
  8. Islam, S.; Jones, S.L.; Dye, D. Comprehensive analysis of single- and multi-vehicle large truck at-fault crashes on rural and urban roadways in Alabama. Accid. Anal. Prev. 2014, 67, 148–158. [Google Scholar] [CrossRef] [PubMed]
  9. Chen, F.; Chen, S. Injury severities of truck drivers in single- and multi-vehicle accidents on rural highways. Accid. Anal. Prev. 2011, 43, 1677–1688. [Google Scholar] [CrossRef]
  10. Wen, H.; Ma, Z.; Chen, Z.; Luo, C. Analyzing the impact of curve and slope on multi-vehicle truck crash severity on mountainous freeways. Accid. Anal. Prev. 2023, 181, 106951. [Google Scholar] [CrossRef]
  11. Hou, Q.; Huo, X.; Leng, J.; Cheng, Y. Examination of driver injury severity in freeway single-vehicle crashes using a mixed logit model with heterogeneity-in-means. Phys. A Stat. Mech. Its Appl. 2019, 531, 121760. [Google Scholar] [CrossRef]
  12. Se, C.; Champahom, T.; Jomnonkwao, S.; Karoonsoontawong, A.; Ratanavaraha, V. Temporal stability of factors influencing driver-injury severities in single-vehicle crashes: A correlated random parameters with heterogeneity in means and variances approach. Anal. Methods Accid. Res. 2021, 32, 100179. [Google Scholar] [CrossRef]
  13. Razi-Ardakani, H.; Mahmoudzadeh, A.; Kermanshah, M. A Nested Logit analysis of the influence of distraction on types of vehicle crashes. Euro. Transp. Res. Rev. 2018, 10, 44. [Google Scholar] [CrossRef]
  14. Yan, X.; Radwan, E. Analyses of rear-end crashes based on classification tree models. Traffic Inj. Prev. 2006, 7, 276–282. [Google Scholar] [CrossRef] [PubMed]
  15. Zheng, Z.; Lu, P.; Tolliver, D. Decision Tree Approach to Accident Prediction for Highway–Rail Grade Crossings: Empirical Analysis. Transp. Res. Rec. 2016, 2545, 115–122. [Google Scholar] [CrossRef]
  16. Sapri, F.E.; Nordin, N.S.; Hasan, S.M.; Wan Yaacob, W.F.; Md Nasir, S.A. Decision tree model for non-fatal road accident injury. Int. J. Adv. Sci. Eng. Inf. Technol. 2017, 7, 63–70. [Google Scholar] [CrossRef]
  17. Champahom, T.; Jomnonkwao, S.; Chatpattananan, V.; Karoonsoontawong, A.; Ratanavaraha, V. Analysis of rear-end crash on Thai highway: Decision tree approach. J. Adv. Transp. 2019, 2019, 2568978. [Google Scholar] [CrossRef]
  18. Champahom, T.; Jomnonkwao, S.; Watthanaklang, D.; Karoonsoontawong, A.; Chatpattananan, V.; Ratanavaraha, V. Applying hierarchical logistic models to compare urban and rural roadway modeling of severity of rear-end vehicular crashes. Accid. Anal. Prev. 2020, 141, 105537. [Google Scholar] [CrossRef]
  19. Chen, C.; Zhang, G.; Tian, Z.; Bogus, S.M.; Yang, Y. Hierarchical Bayesian random intercept model-based cross-level interaction decomposition for truck driver injury severity investigations. Accid. Anal. Prev. 2015, 85, 186–198. [Google Scholar] [CrossRef]
  20. Huang, H.; Chin, H.C.; Haque, M.M. Severity of driver injury and vehicle damage in traffic crashes at intersections: A Bayesian hierarchical analysis. Accid. Anal. Prev. 2008, 40, 45–54. [Google Scholar] [CrossRef]
  21. Chen, Y.; Wang, K.; King, M.; He, J.; Ding, J.; Shi, Q.; Wang, C.; Li, P. Differences in factors affecting various crash types with high numbers of fatalities and injuries in China. PLoS ONE 2016, 11, e0158559. [Google Scholar] [CrossRef]
  22. Wang, W.; Yuan, Z.; Liu, Y.; Yang, X.; Yang, Y. A Random Parameter Logit Model of Immediate Red-Light Running Behavior of Pedestrians and Cyclists at Major-Major Intersections. J. Adv. Transp. 2019, 2019, 2345903. [Google Scholar] [CrossRef]
  23. Ye, F.; Cheng, W.; Wang, C.; Liu, H.; Bai, J. Investigating the severity of expressway crash based on the random parameter logit model accounting for unobserved heterogeneity. Adv. Mech. Eng. 2021, 13, 1–13. [Google Scholar] [CrossRef]
  24. Šarić, Ž.; Xu, X.; Xiao, D.; Vrkljan, J. Exploring injury severity of pedestrian-vehicle crashes at intersections: Unbalanced panel mixed ordered probit model. Euro. Transp. Res. Rev. 2021, 13, 63. [Google Scholar] [CrossRef]
  25. Fu, C.; Sayed, T. Random-Parameter Bayesian Hierarchical Extreme Value Modeling Approach with Heterogeneity in Means and Variances for Traffic Conflict–Based Crash Estimation. J. Transp. Eng. 2022, 148, 04022056. [Google Scholar] [CrossRef]
  26. Yan, X.; He, J.; Zhang, C.; Liu, Z.; Wang, C.; Qiao, B. Temporal analysis of crash severities involving male and female drivers: A random parameters approach with heterogeneity in means and variances. Anal. Methods Accid. Res. 2021, 30, 100161. [Google Scholar] [CrossRef]
  27. Zhang, J.; Li, Z.; Pu, Z.; Xu, C. Comparing prediction performance for crash injury severity among various machine learning and statistical methods. IEEE Access 2018, 6, 60079–60087. [Google Scholar] [CrossRef]
  28. Mukaka, M.M. Statistics corner: A guide to appropriate use of correlation coefficient in medical research. Malawi Med. J. 2012, 24, 69–71. [Google Scholar]
  29. Song, Y.-Y.; Lu, Y. Decision tree methods: Applications for classification and prediction. Shanghai Arch Psychiatry 2015, 27, 130–135. [Google Scholar]
  30. Mannering, F.L.; Shankar, V.; Bhat, C.R. Unobserved heterogeneity and the statistical analysis of highway accident data. Anal. Methods Accid. Res. 2016, 11, 1–16. [Google Scholar] [CrossRef]
  31. Parikh, R.; Mathai, A.; Parikh, S.; Sekhar, G.C.; Thomas, R. Understanding and using sensitivity, specificity and predictive values. Indian J. Ophthalmol. 2008, 56, 45. [Google Scholar] [CrossRef]
  32. McNamara, M.E.; Zisser, M.; Beevers, C.G.; Shumake, J. Not just “big” data: Importance of sample size, measurement error, and uninformative predictors for developing prognostic models for digital interventions. Beha. Res. Thera. 2022, 153, 104086. [Google Scholar] [CrossRef]
  33. Genç, S.; Mendeş, M. Evaluating performance and determining optimum sample size for regression tree and automatic linear modeling. Arquivo Brasileiro de Medicina Veterinária e Zootecnia 2021, 73, 1391–1402. [Google Scholar] [CrossRef]
  34. Fountas, G.; Anastasopoulos, P.C.; Abdel-Aty, M. Analysis of accident injury-severities using a correlated random parameters ordered probit approach with time variant covariates. Anal. Methods Accid. Res. 2018, 18, 57–68. [Google Scholar] [CrossRef]
  35. Jeong, H.; Jang, Y.; Bowman, P.J.; Masoud, N. Classification of motor vehicle crash injury severity: A hybrid approach for imbalanced data. Accid. Anal. Prev. 2018, 120, 250–261. [Google Scholar] [CrossRef] [PubMed]
  36. Mokhtarimousavi, S.; Anderson, J.C.; Azizinamini, A.; Hadi, M. Factors affecting injury severity in vehicle-pedestrian crashes: A day-of-week analysis using random parameter ordered response models and artificial neural networks. Inter. J. Transp. Sci. Tech. 2020, 9, 100–115. [Google Scholar] [CrossRef]
  37. Obaid, I.; Alnedawi, A.; Aboud, G.M.; Tamakloe, R.; Zuabidi, H.; Das, S. Factors associated with driver injury severity of motor vehicle crashes on sealed and unsealed pavements: Random parameter model with heterogeneity in means and variances. Inter. J. Transp. Sci. Tech. 2023, 12, 460–475. [Google Scholar] [CrossRef]
  38. Wang, Y.; Luo, Y.; Chen, F. Interpreting risk factors for truck crash severity on mountainous freeways in Jiangxi and Shaanxi, China. Euro. Transp. Res. Rev. 2019, 11, 26. [Google Scholar] [CrossRef]
  39. Peng, Y.; Boyle, L.N. Commercial Driver Factors in Run-off-Road Crashes. Transp. Res. Rec. 2012, 2281, 128–132. [Google Scholar] [CrossRef]
  40. Roque, C.; Moura, F.; Lourenço Cardoso, J. Detecting unforgiving roadside contributors through the severity analysis of ran-off-road crashes. Accid. Anal. Prev. 2015, 80, 262–273. [Google Scholar] [CrossRef]
  41. Bozpolat, E. Investigation of the Self-Regulated Learning Strategies of Students from the Faculty of Education Using Ordinal Logistic Regression Analysis. Educ. Sci. Theory Prac. 2016, 16, 301–318. [Google Scholar]
  42. Yan, X.; He, J.; Wu, G.; Zhang, C.; Liu, Z.; Wang, C. Weekly variations and temporal instability of determinants influencing alcohol-impaired driving crashes: A random thresholds random parameters hierarchical ordered probit model. Anal. Methods Accid. Res. 2021, 32, 100189. [Google Scholar] [CrossRef]
  43. Al-Bdairi, N.S.S.; Behnood, A.; Hernandez, S. Temporal stability of driver injury severities in animal-vehicle collisions: A random parameters with heterogeneity in means (and variances) approach. Anal. Methods Accid. Res. 2020, 26, 100120. [Google Scholar] [CrossRef]
  44. Alnawmasi, N.; Mannering, F. A statistical assessment of temporal instability in the factors determining motorcyclist injury severities. Anal. Methods Accid. Res. 2019, 22, 100090. [Google Scholar] [CrossRef]
  45. Al-Balbissi, A.H. Role of gender in road accidents. Traffic Inj. Prev. 2003, 4, 64–73. [Google Scholar] [CrossRef] [PubMed]
  46. Behnood, A.; Mannering, F.L. The temporal stability of factors affecting driver-injury severities in single-vehicle crashes: Some empirical evidence. Anal. Methods Accid. Res. 2015, 8, 7–32. [Google Scholar] [CrossRef]
  47. Chitturi, M.V.; Ooms, A.W.; Bill, A.R.; Noyce, D.A. Injury outcomes and costs for cross-median and median barrier crashes. J Safety Res. 2011, 42, 87–92. [Google Scholar] [CrossRef]
  48. Abegaz, T.; Berhane, Y.; Worku, A.; Assrat, A.; Assefa, A. Effects of excessive speeding and falling asleep while driving on crash injury severity in Ethiopia: A generalized ordered logit model analysis. Accid. Anal. Prev. 2014, 71, 15–21. [Google Scholar] [CrossRef]
  49. Levinson, H.S.; Potts, I.B.; Harwood, D.W.; Gluck, J.; Torbic, D.J. Safety of U-Turns at Unsignalized Median Openings: Some Research Findings. Transp. Res. Rec. 2005, 1912, 72–81. [Google Scholar] [CrossRef]
  50. Ma, Z.; Shao, C.; Yue, H.; Ma, S. Analysis of the Logistic Model for Accident Severity on Urban Road Environment. In Proceedings of the 2009 IEEE Intelligent Vehicles Symposium, Xi’an, China, 3–5 June 2009; pp. 983–987. [Google Scholar]
  51. Anarkooli, A.J.; Hosseinpour, M.; Kardar, A. Investigation of factors affecting the injury severity of single-vehicle rollover crashes: A random-effects generalized ordered probit model. Accid. Anal. Prev. 2017, 106, 399–410. [Google Scholar] [CrossRef]
  52. Becker, N.; Rust, H.W.; Ulbrich, U. Weather impacts on various types of road crashes: A quantitative analysis using generalized additive models. Euro. Transp. Res. Rev. 2022, 14, 37. [Google Scholar] [CrossRef]
  53. Asadollahi Pajouh, M.; Schmidt, J.D.; Meyer, C.L.; Lechtenberg, K.A.; Faller, R.K. Crash reconstruction technique for cable barrier systems. J. Transp. Saf. Secur. 2019, 11, 243–260. [Google Scholar] [CrossRef]
  54. Dong, B.; Ma, X.; Chen, F.; Chen, S. Investigating the Differences of Single-Vehicle and Multivehicle Accident Probability Using Mixed Logit Model. J. Adv. Transp. 2018, 2018, 9841498. [Google Scholar] [CrossRef]
Figure 1. Crash type percentage of 7 years (2011–2017) of crash records in Thailand.
Informatics 10 00066 g001
Figure 2. Crash fatality percentage classified by vehicle type.
Informatics 10 00066 g002
Figure 3. Model classification of car.
Informatics 10 00066 g003
Figure 4. Model classification of truck.
Informatics 10 00066 g004
Table 1. Summary statistic of single-vehicle crash data.
VariableDescriptionCar (n = 3448)Truck (n = 1375)
MeanSDMeanSD
YSEVERITY1 if severe or fatal injury; 0 PDO or minor injury0.2830.4500.2530.435
AGE_26_351 if aged 26 to 35; 0 otherwise0.3650.4810.3330.471
AGE_36_451 if aged 36 to 45; 0 otherwise0.2210.4150.3200.467
AGE_46_551 if aged 46 to 55; 0 otherwise0.1260.3320.1840.388
AGE_56_UP1 if the driver’s age is more than 55; 0 otherwise0.0840.2770.0580.234
MALE1 if male drivers; 0 otherwise0.7730.4190.9910.093
SAF_EQ1 if driver uses seatbelt; 0 otherwise0.4090.4920.3620.481
ALCOHOL1 if driver is under effect of alcohol; 0 otherwise0.0170.1310.0070.085
EXEED_SPEED1 if driver exceeds speed limit; 0 otherwise0.8080.3940.7030.457
FALL_ASLEEP1 if driver falls asleep while driving; 0 otherwise0.1190.3240.1400.347
CONSTRUCT1 if crash occurs at area of road maintenance (or construction); 0 otherwise0.0280.1660.0260.160
ASPHALT1 if pavement type is asphalt; 0 otherwise0.9120.2840.9330.25
VERTICAL1 if crash occurs on the graded road section; 0 otherwise0.0860.2800.1990.400
INTERSECTION1 if crash occurs within intersection; 0 otherwise0.0710.2560.0850.279
U_TURN1 if crash occurs within U-turn (opened median); 0 otherwise0.0990.2980.0560.230
COMMUNITY1 if crash occurs within community area; 0 otherwise0.0100.1000.0090.093
NO_MEDIAN1 if crash occurs on road without median; 0 otherwise0.2670.4430.3510.478
PAINTED1 if crash occurs on road with painted median; 0 otherwise0.0510.220.0310.172
RAISED1 if crash occurs on road with raised median; 0 otherwise0.2800.4490.1810.385
DEPRESSED1 if crash occurs on road with depressed median; 0 otherwise0.3450.4750.3630.481
BARRIER1 if crash occurs on road with barrier median; 0 otherwise0.0500.2170.0690.254
MOUNT_ISLAND1 if the vehicle mounted the traffic island; 0 otherwise0.2480.4320.1620.369
PASS_IN_FRONT1 if crash passes in front of car; 0 otherwise0.0200.1390.0330.178
DEFECT_CAR1 if crash occurs because of defective car equipment; 0 otherwise0.0120.1100.0660.247
WET_SURFACE1 if crash occurs on wet road; 0 otherwise0.1550.3620.1990.400
DIRTY_SURFACE1 if crash occurs on wavy or dirty road; 0 otherwise0.0040.0610.0040.066
WEATHER1 if crash occurs during rain, dust, or fog; 0 otherwise0.1700.3750.2130.410
NIGHT1 if crash occurs during nighttime; 0 otherwise0.5030.5000.4170.493
OFF_STR1 if cause of crash is being run off-road on a straight; 0 otherwise0.1400.3470.0930.291
OFF_STR_HIT1 if cause of crash is being run off-road on a straight and striking safety equipment; 0 otherwise0.3230.4680.3300.470
OFF_CUR1 if cause of crash is being run off-road on curve; 0 otherwise0.0570.2320.0790.270
OFF_CUR_HIT1 if cause of crash is being run off-road on curve and striking safety equipment; 0 otherwise0.1910.3930.2810.45
Note: SD = standard deviation; PDO = property-damaged only.
Table 2. Statistical values.
Predicted Positive (Fatal)Predicted Negative (Non-Fatal)
Actual positive (fatal)True Positive (TP)False Negative (FN)
Actual negative (non-fatal)False Positive (FP)True Negative (TN)
Table 3. Outcome prediction of decision tree and random parameters logit model.
Predicted
Fatal (Car)Non-Fatal (Car)Fatal (Truck)Non-Fatal (Truck)
ActualDecision treeFatal2427320348
Non-fatal190228401027
Mixed logitFatal446528153195
Non-fatal159231561021
Table 4. Comparison of models’ accuracy, sensitivity, and specificity.
MethodClassificationAccuracySensitivitySpecificity
Decision treeCar73.26%24.85%92.32%
Truck74.76%0%100%
Mixed logitCar80.08%45.8%93.6%
Truck85.38%43.97%99.42%
Table 5. Model results of RPBLHMV (car and truck).
VariablesCAR (n = 3448)TRUCK (n = 1375)
EstimatesS.E.t-StatMarginal EffectEstimatesS.E.t-StatMarginal Effect
Constant–0.4210.333–1.26 1.3120.8301.58
Non-random parameters;
AGE_26_35–0.040.082–0.49–0.009–0.1940.19–1.02–0.042
AGE_36_450.0290.090.320.0060.1470.1890.780.029
AGE_46_550.0270.1060.260.006–0.0890.211–0.42–0.02
AGE_56_UP0.1210.1191.020.0260.0630.2710.230.01
MALE0.136 *0.0731.870.029–0.1560.503–0.31–0.032
SAF_EQ–0.162 ***0.061–2.64–0.034–0.0850.114–0.74–0.018
ALCOHOL0.2630.2061.280.0560.6120.5871.040.126
EXEED_SPEED–0.0890.085–1.05–0.019–0.1470.141–1.04–0.03
CONSTRUCT0.240.1641.470.051–0.0770.352–0.22–0.018
ASPHALT–0.0210.106–0.2–0.005–0.2990.192–1.56–0.061
VERTICAL 0.0350.1710.210.006
INTERSECTION –0.387 *0.217–1.78–0.081
U_TURN0.0120.1150.110.003–0.2060.254–0.81–0.043
COMMUNITY0.4270.2691.590.091–0.6220.758–0.82–0.131
NO_MEDIAN0.0250.2780.090.005
PAINTED–0.190.306–0.62–0.04–0.8740.666–1.31–0.181
RAISED –1.160 *0.614–1.89–0.24
DEPRESSED0.1060.2770.380.023–0.9070.609–1.49–0.188
BARRIER–0.0430.301–0.14–0.009–1.090 *0.627–1.74–0.226
MOUNT_ISLAND–0.457 ***0.156–2.93–0.097–0.630 ***0.189–3.34–0.131
PASS_IN_FRONT–0.469 *0.257–1.82–0.1–0.1420.319–0.45–0.028
DEFECT_CAR–0.661 *0.369–1.79–0.141–0.3430.264–1.3–0.074
WET_SURFACE0.0990.2050.480.021–0.110.329–0.33–0.022
DIRTY_SURFACE0.4560.4630.980.097–0.9661.567–0.62–0.21
WEATHER–0.2430.198–1.23–0.052–0.2170.327–0.66–0.045
NIGHT0.0790.0621.270.017
OFF_STR0.562 ***0.1563.60.12
OFF_STR_HIT–0.458 ***0.151–3.03–0.097–0.698 ***0.156–4.48–0.144
OFF_CUR0.1250.1830.680.027–0.0230.242–0.09–0.006
OFF_CUR_HIT–0.538 ***0.162–3.33–0.115–0.440 **0.177–2.48–0.092
Random parameters;
VERTICAL–0.1940.133–1.46–0.041
Standard deviation0.864 ***0.1695.12
RAISED–0.3970.288–1.38–0.084
Standard deviation1.963 **0.14513.55
NO_MEDIAN –1.702 ***0.623–2.73–0.351
Standard deviation 4.161 ***0.4758.76
Heterogeneity in means;
VERTICAL: FALL_ASLEEP0.6590.4191.57
RAISED: FALL_ASLEEP–0.470 *0.268–1.75
NO_MEDIAN: FALL_ASLEEP 1.364 ***0.476−2.86
Heterogeneity in variance;
VERTICAL: INTERSECTION–0.3461.439–0.24
RAISED: INTERSECTION–3.326 ***0.206–16.13
NO_MEDIAN: NIGHT –0.244 *0.143−1.71
NO_MEDIAN: OFF_STR 3.998 ***1.2613.17
Model statistics: S.E. = standard error; Halton draw = 1000; AICcar = 3932.7; AICtruck = 1544.7; ***, **, * Significance at 1%, 5%, 10% level, respectively.
Disclaimer/Publisher’s Note: The statements, opinions and data contained in all publications are solely those of the individual author(s) and contributor(s) and not of MDPI and/or the editor(s). MDPI and/or the editor(s) disclaim responsibility for any injury to people or property resulting from any ideas, methods, instructions or products referred to in the content.

