
Unraveling Microblog Sentiment Dynamics: A Twitter Public Attitudes Analysis towards COVID-19 Cases and Deaths

School of Science and Technology, International Hellenic University, 57001 Thessaloniki, Greece
*
Author to whom correspondence should be addressed.
Informatics 2023, 10(4), 88; https://doi.org/10.3390/informatics10040088
Submission received: 5 October 2023
/
Revised: 25 November 2023
/
Accepted: 5 December 2023
/
Published: 7 December 2023
Abstract
:The identification and analysis of sentiment polarity in microblog data has drawn increased attention. Researchers and practitioners attempt to extract knowledge by evaluating public sentiment in response to global events. This study aimed to evaluate public attitudes towards the spread of COVID-19 by performing sentiment analysis on over 2.1 million tweets in English. The implications included the generation of insights for timely disease outbreak prediction and assertions regarding worldwide events, which can help policymakers take suitable actions. We investigated whether there was a correlation between public sentiment and the number of cases and deaths attributed to COVID-19. The research design integrated text preprocessing (regular expression operations, (de)tokenization, stopwords), sentiment polarization analysis via TextBlob, hypothesis formulation (null hypothesis testing), and statistical analysis (Pearson coefficient and p-value) to produce the results. The key findings highlight a correlation between sentiment polarity and deaths, starting at 41 days before and expanding up to 3 days after counting. Twitter users reacted to increased numbers of COVID-19-related deaths after four days by posting tweets with fading sentiment polarization. We also detected a strong correlation between COVID-19 Twitter conversation polarity and reported cases and a weak correlation between polarity and reported deaths.
1. Introduction
During the COVID-19 pandemic, traffic on almost all popular Social Media (SMs) has increased by over 10%, mainly due to regional lockdowns and the need for additional information regarding the virus. Posts on SMs have circulated expressing the positive attitudes of those who believe that we are indeed dealing with a dangerous virus outbreak, the negative attitudes of skeptics or even virus deniers, and neutral attitudes.
This study explored the fluctuation of sentiments on Twitter by examining the attitudes towards officially reported COVID-19 cases and deaths. The subsequent sections will guide the readers through an analysis of other similar studies, the methodology and findings of the research, possible obstacles, consequences, and future enhancements to facilitate a probable incorporation into a widely accepted solution.
SMs, such as Twitter, have allowed the global community to deal with COVID-19 by offering reliable information, online connectivity, and real-time event tracking. However, as later studies demonstrated, there have also been disadvantages in using SMs as a source of information, for example due to fake news [1]. Moreover, the online anti-vaccination movement shares many ties with COVID-19 deniers and conspiracy theorists [2].
The foundations for opinion mining and Sentiment Analysis (SA) were laid by Pang and Lee [3]. According to them, opinion mining, emotion analysis, and/or subjectivity analysis are defined as: “the areas that deal with the computational processing of opinion, emotion, and subjectivity in the text”. SA is utilized for extracting knowledge [4,5,6,7,8,9,10] from the Internet and SMs, which have been established as multi-functional networking tools [11], enabling various mining tasks in complex information networks [12].
Today, more than ever, we need ways and approaches to manage massive amounts of data and mitigate global disasters like COVID-19. Governments, corporations, and organizations require tools to evaluate such situations. The significance of this work is attributed to the fact that COVID-19 has caused economic and psychological problems to individuals and societies, on top of medical ones [13,14]. By addressing these points, we can improve the knowledge-extraction capabilities by utilizing SMs’ data and elaborating on trends or correlations between different data sources. For example integrating SMs’ data with other crucial data, such as travel patterns, demographic information, or socioeconomic characteristics, might yield a more-holistic comprehension of the circumstances underlying COVID-19. This enhances the predictive, descriptive, and diagnostic analytics of this study [15]. Moreover, SA can help indicate which topics are being discussed most on SMs about the COVID-19 pandemic and can be used to explore trends on vaccination decisions and, thus, aid policymakers to make targeted decisions [16].
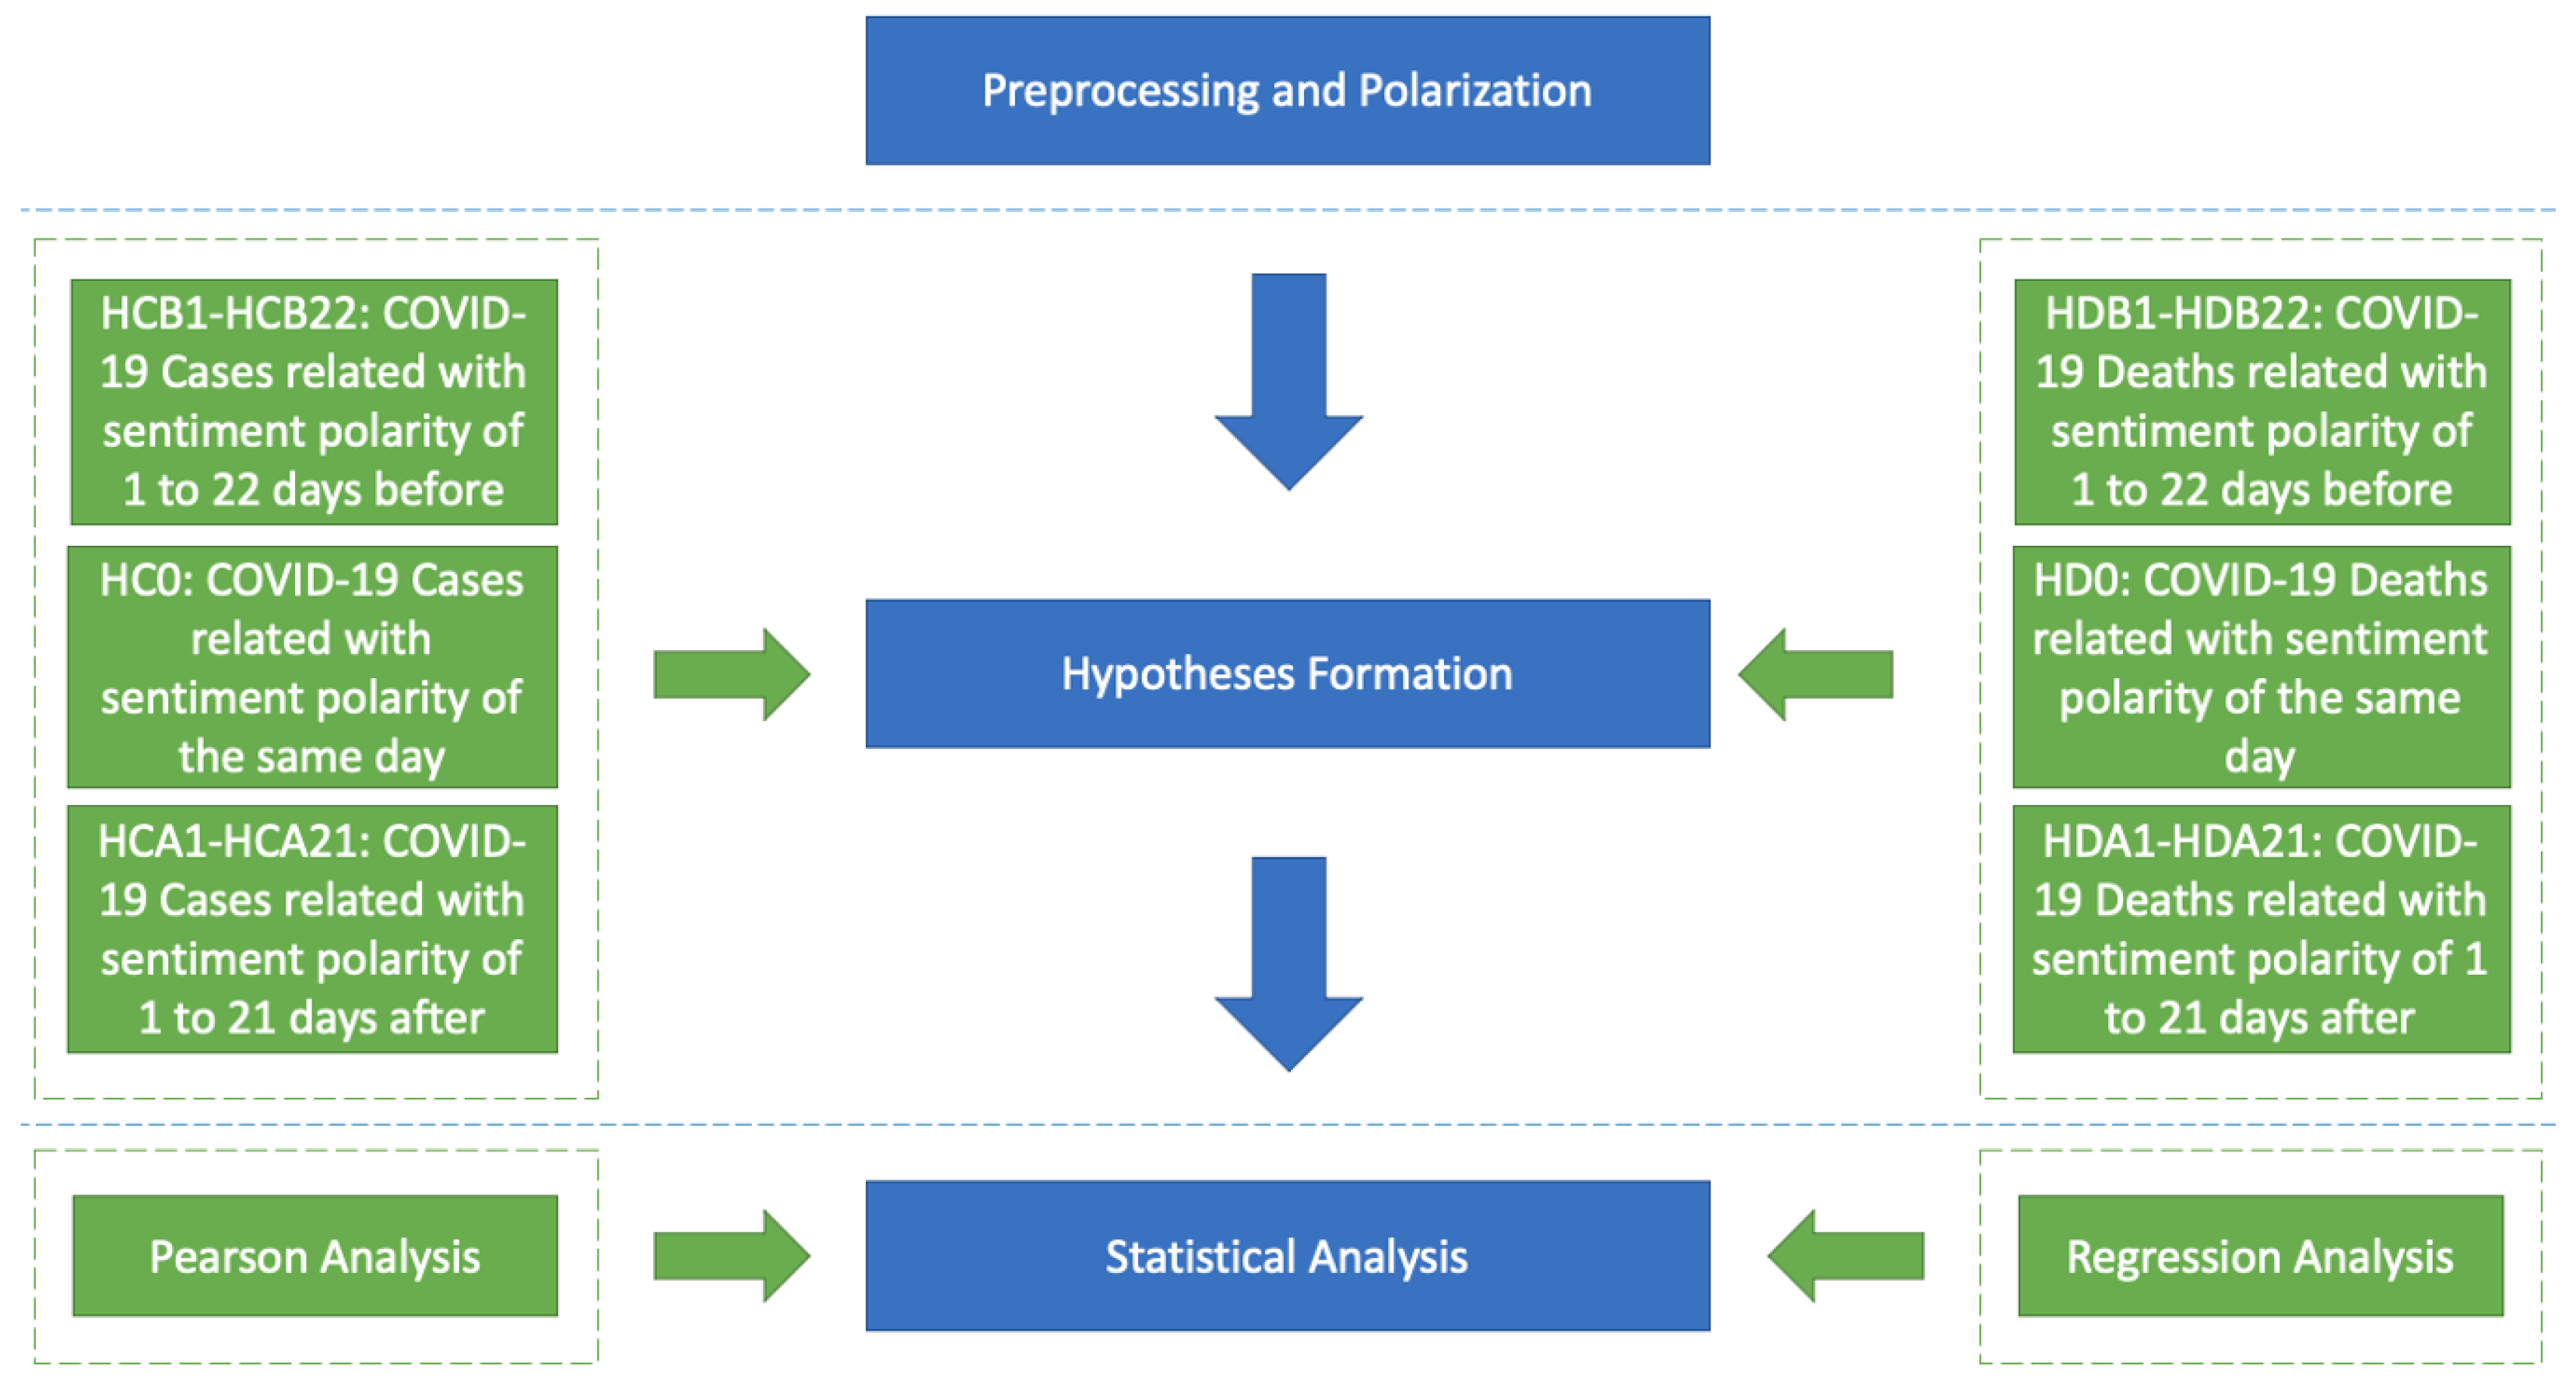
The conceived approach builds upon three contextual processes: preprocessing and polarization, hypothesis formation, and statistical analysis. The first process attempts to assess the sentiment of posts on Twitter. The second process aims to form hypotheses related to COVID-19 cases and deaths. The third process validates the existence of correlations between the time series of these three variables (tweet sentiment, cases, and deaths). This is achieved by addressing the following objectives:
- Improve the sentiment polarization output by utilizing text preprocessing for accurate and reliable results.
- Validate trends on Twitter sentiment in relation to the actual number of COVID-19 cases and deaths to retrieve useful insights.
- Develop an approach/methodology that creates opportunities for disease forecasting by discovering and monitoring multivariable correlations, such as cases vs. polarity or deaths vs. polarity.
Moreover, this study addressed the following research questions: Can tweets act as an indicator for predicting polarity related to COVID-19 cases and deaths? Is there a correlation between these three data labels (tweets, cases, deaths)? If yes, to what extent? Are there any trends in these data labels? This study attempted to answer these questions envisioning future improvements involving localization and multilingual aspects, association rule mining, forecasting (the generated correlations may be used as input features for improving forecasting accuracy), and comparative reporting of various similar approaches.
The next sections of this work are organized as follows. Section 2 presents a literature review on relevant SA research attempts. The approach employed in this study is outlined in Section 3, while the findings obtained are presented and analyzed along with possible implications in Section 4. Lastly, the concluding part (Section 5) provides a summary of the main findings and engages in a discussion on the limitations and potential future directions of this study.
2. Background
COVID-19 research is one of the hottest trends since 2020. Multiple studies related to SMs’ data and potential capabilities, such as forecasting outcomes, have been reported and categorized according to the application domain (e.g., healthcare, politics, etc.) [17]. Other studies combined SA, mainly using data from SMs and COVID-19. The most-representative ones that are related to this study are reported here. They deal with topic/theme extraction [18], political interventions [19], sentiment extraction/categorization [20], news-sharing behavior and communication trends [21], information diffusion and user interaction patterns [22], multi-lingual misinformation [23], the sentiment context during lockdowns [24], geo-tagged network analysis [25], and tools for improving SA [26] and tracking/predicting worldwide outbreaks [27].
However, to the best of our knowledge, there are no similar published efforts that have used SA on data from Twitter to find potential links between the polarity of sentiments and the number of reported COVID-19 cases or deaths. Furthermore, this study introduces a fresh approach by utilizing hypothesis formation and statistical analysis to uncover the dynamics of sentiment in microblogs, for which there is currently no similar established methodology.
More specifically, in [18], the authors retrieved the main topics related to COVID-19 posted on Twitter. From 2.8 million tweets, they identified around 167k related posts. According to their categorization, there were four main themes about COVID-19: (i) its origin (location), (ii) its source (causes that led to its transmission to humans), (iii) its impact on people and countries, and (iv) methods for controlling its spread.
Political leaders have been using SMs for information dissemination since 2008. In 2020, a 23% growth in Twitter users was observed. They also communicate COVID-19 emotions related to informing the public. A data source of 12,128 tweets regarding 29 Indian political leaders was utilized. The data analysis involved NRC-based (emotion lexicon) SA. The retrieved emotions included “anger”, “disgust”, “fear”, “joy”, “negative”, “positive”, and more. The findings showcased that “positive” and “trust” are the most common when authorities choose to intervene by posting guidelines [19].
SA was also conducted on tweets from India after the lockdown, using a dataset of 24k tweets for 4 days, from 25 March 2020 until 28 March 2020 [20]. The most-dominant stems were “consult”, “manag”, and “disast”. An analysis was conducted by categorizing the sentiments via 10 words (“anger”, “anticipation”, “disgust”, “fear”, “joy”, “negative”, “positive”, “sadness”, “surprise”, and “trust”). The most-popular tweet sentiments were “positive”, “trust”, and “negative” with a count of 24k, 16k, and 9.5k, respectively.
Park et al. investigated news-sharing behavior, along with information-transmission networks from data related to COVID-19, gathered from 44k Korean Twitter users [21]. They identified more than 78k relationships and found that communication regarding COVID-19 amongst users was more frequent and faster in terms of the spread of information.
Cinelli et al. investigated the diffusion of COVID-19 information by using data from five different SMs (Gab, Instagram, Reddit, Twitter, and YouTube) [22]. They gathered 1.3 m posts in total, with 7.4 m comments from 3.7 m users for 45 days from 1 January 2020 until 14 February 2020. Of these posts, 88.5% came from Twitter, and 94.5% of comments and 85.7% of users came from YouTube. After analyzing the spread of debatable information or even misinformation, they concluded that Gab was the SM most prone to misinformation spread. Finally, they concluded that the channels of information dissemination and their contents depend on two factors: (i) the SM itself and (ii) the interaction patterns of groups of users that discuss the topic.
In a similar study, Singh et al. attempted to investigate the sharing of COVID-19 information and misinformation on Twitter [23]. For a two-month period, from 16 January to 15 March 2020, they collected 2.8 million tweets, along with 457k quotes and 18.2 million retweets. The language of the tweets was predominately English (55.2%), followed by Spanish (12.5%) and French (7.4%). Overall, 32 languages were recognized. The countries that suffered the most demonstrated an increase in COVID-19-related tweets compared to the pre-COVID-19 period. They also provided a worldwide tweet geo-location distribution and compared it to the reported cases. Lastly, they summarized the identified themes using the most-frequent words in the tweets, finding that just 0.6% of the tweets discussed myths or conspiracy theories.
Sentiment within comments, hashtags, and posts from Twitter may be analyzed according to trends by keywords such as “covid” and “coronavirus”. Common tools/methods are Natural Language Processing (NLP) and sentiment classification with a Recurrent Neural Network (RNN). The authors in [24] offered a solution for identifying the emotional manifestations from Twitter data according to a specific topic and time interval. Another study dealt with COVID-19 Twitter data collection from India. A total of 410,643 English tweets were gathered from 22 March to 21 April 2020, to investigate the public sentiment context during a lockdown period. Retrieving sentiment and emotions over time may improve the understanding of public contexts and expressions during a crisis such as a pandemic [28].
Lopez et al. used text mining, NLP, and network analysis to investigate the perception of COVID-19 policies by mining a COVID-19-related multi-language Twitter dataset [25]. From 22 January to 13 March 2020 (a 52-day period), they collected around 6.5 million tweets. Of these, 63.4% were written in English, 12.7% in Spanish/Castilian, and the rest in 64 other languages. Extreme retweet bursts were observed in Europe in late February and early March. Finally, they provided a geo-located distribution of 1625 tweets.
Samuel et al. tried to identify public sentiment associated with the pandemic using COVID-19-related tweets in the U.S. and the R [29] statistical software 4.0.0 [26]. They downloaded tweets from February to March 2020, and by using geo-tagged analytics, the association with non-textual variables, SA, and classification methods, they found that Naive Bayes performed better (91%) for sentiment classification of short (in length) COVID-19 tweets compared to logistic regression (74%). Better performance was also identified for long tweets, but with worse accuracy (57% and 52%, respectively).
Finally, another study by Hamzah et al. introduced the CoronaTracker, a worldwide COVID-19 outbreak data analysis and prediction tool [27]. They utilized Susceptible–Exposed–Infectious–Recovered (SEIR) predictive modeling to forecast the COVID-19 outbreak based on daily observations. In their methodology, they included SA on articles from the news (561 positives and 2548 negatives) to further understand public reaction towards the pandemic.
3. Research Design
This paper aimed to calculate the polarization of around 2.1 million tweets that were retrieved throughout the period from 27 February 2020 until 28 August 2020, a period of 153 days. Then, it analyzed possible correlations between COVID-19 cases and deaths, as reported on a worldwide scale. Our approach comprised three contextual processes: data preprocessing and polarization, hypothesis formation, and statistical analysis processes, as depicted in Figure 1, along with the research flow.
3.1. Dataset
An important task for evaluating our approach was data accumulation. The investigated period expanded from 27 February 2020 to 28 August 2020 with 2,146,243 harvested Twitter posts (tweets) utilizing a custom-made Python script (crawler). The script harvested tweets in English through Twitter’s search functionality, https://twitter.com/search-home (accessed on 27 February 2020), bypassing Twitter developer’s Application Programming Interface (API)’s (https://developer.twitter.com (accessed on 15 February 2020)) limitations for data crawling, such as the maximum number of retrieved tweets.
The main drawback of this approach is that the retrieved tweets need further preprocessing compared with data retrieved from the official Twitter API. To collect tweets without utilizing the Twitter API, alternative approaches such as web scraping or other techniques might be employed. Insufficient or inaccurate data extraction results in the absence of certain tweets, incomplete information, or obsolete content. Such occurrence might result in biases, since specific tweets or user groups may be disproportionately represented or underrepresented. Moreover, preprocessing techniques are essential for eliminating noise and unnecessary data. Inadequate preprocessing may lead to an ineffective elimination of spam, retweets, or off-topic content, resulting in a dataset that contains more-irrelevant information.
The search keywords included COVID-19 common synonyms such as “coronavirus”, “covid”, “covid-19”, and “corona”. Tweets that mentioned any of these phrases were included in the dataset. The selected keywords encompassed a variety of frequently employed words to ensure a comprehensive compilation of tweets pertaining to the COVID-19 theme. This approach aimed to consider various ways people may refer to the pandemic on SMs. Yet, there were some limitations to this approach:
- Although keywords are popular, they may not cover all COVID-19 expressions and references. Misspellings, abbreviations, and other phrases may not be included.
- Keyword matching ignores tweet context. If keywords are utilized in a different context, this may include irrelevant or exclude relevant content.
- Language changes with time, introducing new terminology and variants. The tweets may lose significance as the epidemic spreads and the keywords become old or inadequate.
- Keyword efficacy may vary by geography and culture. Some words may be more popular in some places, biasing the dataset.
- Spam, disinformation, and irrelevant content fill SMs. The technique may not filter out such noise, affecting tweet quality and dependability.
All in all, to enhance the interpretation of such an analysis and assess the limitations and deficiencies in datasets, researchers should possess a comprehensive understanding of these restrictions.
The implemented crawler collected data for nine properties per tweet, as shown in Table 1. For this paper, only the attributes text and datetime were utilized. The rest of the attributes (e.g., username, tweet_id, or user_id) were discarded.
3.2. Preprocessing and Polarization Analysis
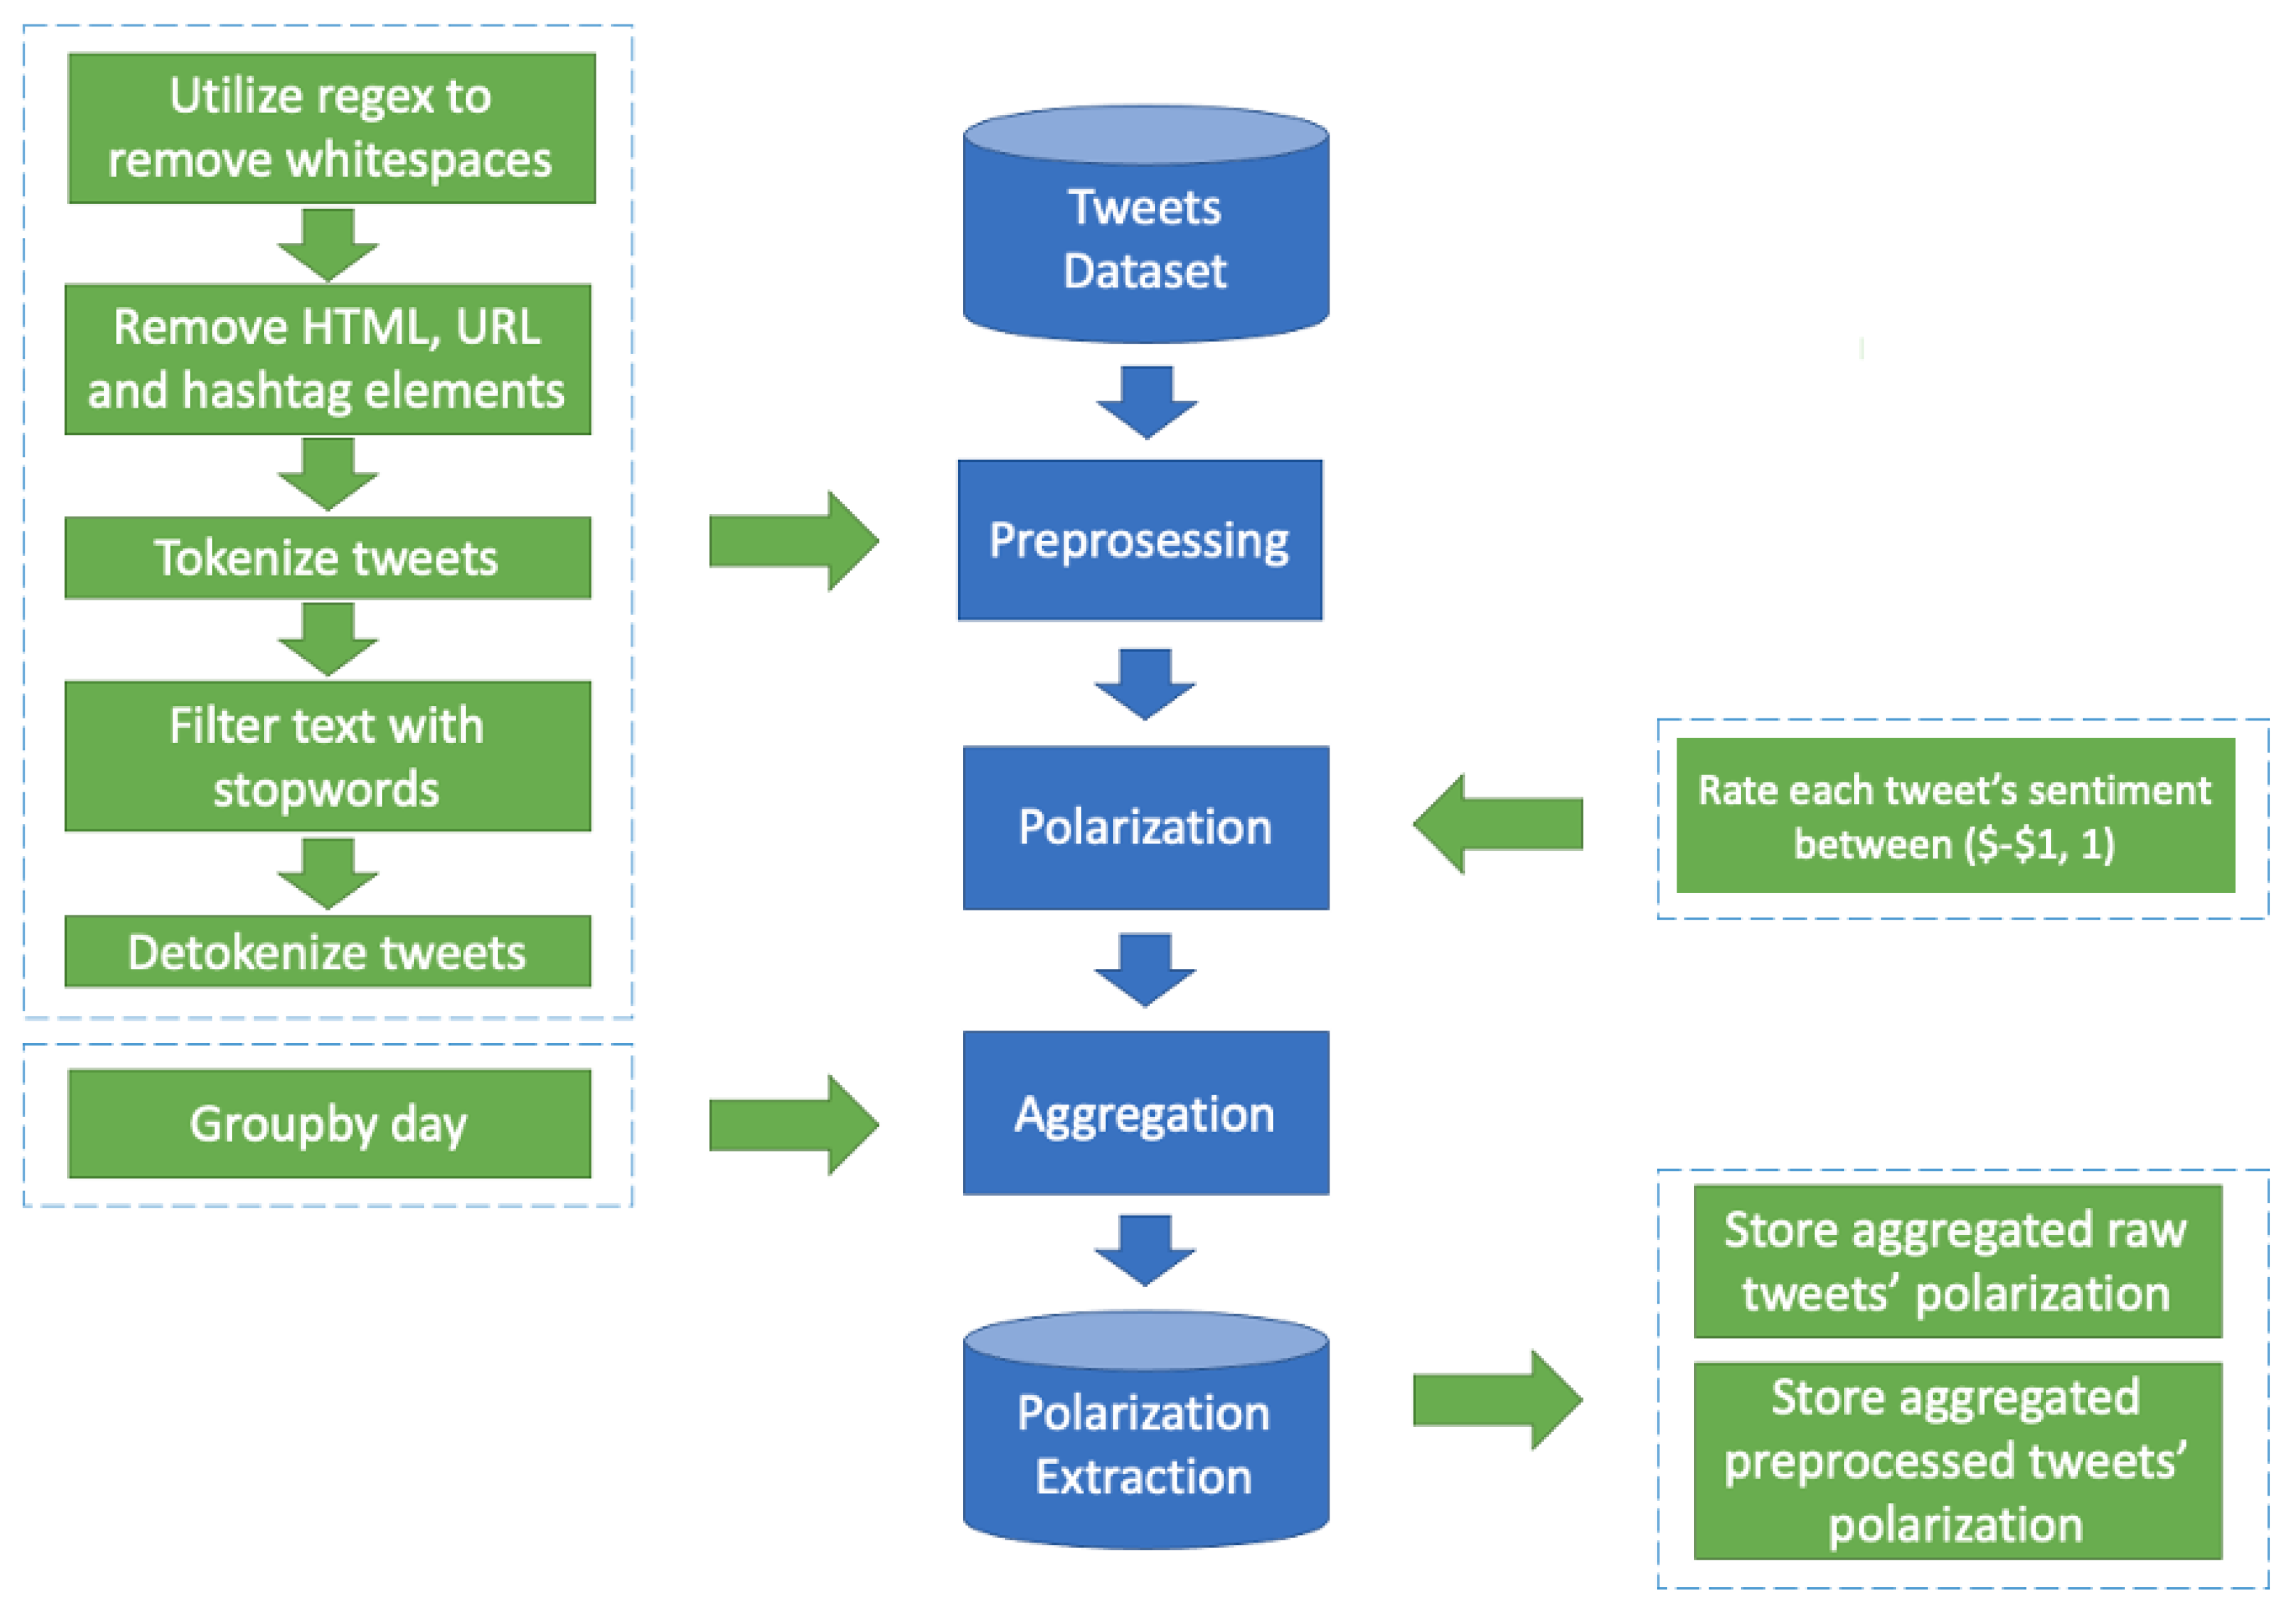
Preprocessing improves accuracy and reliability. When data are preprocessed, missing or noisy data values that are the product of human or machine errors are dealt with. This increases the data quality, consistency, and reliability. Therefore, certain types of text transformations were applied, such as regex applications to remove whitespace, HyperText Markup Language (HTML), Uniform Resource Locators (URLs), hashtag elements, tokenization, text filtering, removing common words, and finally, reverting the text by detokenization. Polarization is a metric regarding the negativity or positivity of a tweet. The general flow of the transformations of the preprocessing and polarization process is depicted in Figure 2.
Specifically, a custom-made regex was applied as a filter to remove invalid whitespace in tweet text resulting from crawling. The utilized library was re (regular expression operations) (https://docs.python.org/3/library/re.html (accessed on 28 September 2020)) in Python. The same was applied to the removal of HTML, URL, and hashtag elements. The next step of text transformation refers to tweet tokenization. This was achieved by utilizing the nltk.tokenize package (https://www.nltk.org/_modules/nltk/tokenize.html (accessed on 10 October 2020)). Then, three libraries/packages/modules were incorporated, for removing stopwords, utilizing their default lexicons. These were spacy (https://spacy.io/ (accessed on 28 October 2020)), genism (https://pypi.org/project/gensim/ (accessed on 11 November 2020)), and nltk.corpus.stopwords (https://www.nltk.org/_modules/nltk/corpus.html (accessed on 12 November 2020)). We used three libraries, attempting to enhance the stopword dictionary without manually adding words.
Next, the detokenization of tweets was executed. We incorporated an implementation of Penn Treebank detokenization offered by the module nltk.tokenize.treebank (https://www.nltk.org/_modules/nltk/tokenize/treebank.html (accessed on 17 November 2020)) in the nltk toolkit, to prepare the final text transformation for retrieving polarization values. For sentiment polarization, we incorporated the TextBlob (https://textblob.readthedocs.io/en/dev/ (accessed on 20 November 2020)) library, which retrieves values per tweet rated between −1 (most negative) and +1 (most positive). TextBlob provides a sentiment analysis based on lexicons. Such a technique involves assigning scores to collections (sentences) of words, using a predetermined lexicon of negative and positive words. Subsequently, an average will be computed to determine the overall sentiment score of a sentence. Table 2 illustrates examples of raw and processed tweets and their retrieved polarity.
Finally, the sentiment polarization values of all tweets were grouped by day, retrieving their average value. These text transformations were executed in a sequential manner, attempting to improve the accuracy of the sentiment polarity’s reporting.
3.3. Hypothesis Formation
To help with all hypothesis statements and formation, we introduced two terms. The term “before” or “lead” refers to tweets that prelude the actual COVID cases or deaths, whilst the term “after” or “lag” refers to tweets that follow the actual COVID cases or deaths. For instance, “three days before” means that we matched tweets published on 4 March 2020 with the number of new cases and deaths three days later on 7 March 2020. “Three days after” means that we matched tweets published on 4 March 2020 with the number of new cases and deaths three days earlier on 1 March 2020. We also noted that the aggregated number of cases and deaths always increased during the period under scrutiny (27 February 2020 to 28 August 2020). For that reason, the hypotheses were associated with the COVID-19 daily cases and deaths as retrieved from the WHO https://covid19.who.int/ database on a worldwide scale.
In total, we tested 44 null hypotheses (HCB1-HCB22, HC0, HCA1-HCA21) related to COVID-19 cases. Indicatively, three are presented in Table 3: (i) one with a polarization lead (tweets 22 days before cases) and labeled as HCB22, (ii) one with no lead or lag (tweets in the same day with cases) and labeled as HC0, and (iii) one with a polarization lag (tweets 21 days after cases) and labeled as HCA21.
Similarly, we tested 44 null hypotheses (HDB1-HDB22, HD0, HDA1-HDA21) related to COVID-19 deaths in total. Indicatively, three are presented in Table 4: (i) one with a polarization lead (tweets 22 days before deaths) and labeled as HDB22, (ii) one with no lead or lag (tweets on the same day with deaths) and labeled as HD0, and (iii) one with a polarization lag (tweets 21 days after deaths) and labeled as HDA21.
3.4. Statistical Analysis
Pearson correlation between sentiment polarity and COVID-19 cases or deaths was utilized, with different combinations of tweets before and tweets after. The experiments for a 44-day period attempted to determine if a relationship between these two variables existed.
The Pearson product–moment correlation coefficient is a statistical measurement of the correlation (linear association) between two sets of values. The Pearson product–moment correlation coefficient for two sets of values, x and y, is given by the formula (Equation (1)):
where x and y are the sample means of the two arrays of values.
If the value of r is close to +1, this indicates a strong positive linear correlation. For example (adjusted to this study’s context), this means that, when cases increase, polarity increases or, when cases decrease, polarity decreases. On the other hand, if r is close to −1, this indicates a strong linear negative correlation. For example, when cases increase, polarity decreases or vice versa (polarity increases, cases decrease).
The strength of correlation can be described by the absolute valuesfor r (Equation (2)) as follows: 0.00–0.19 very weak, 0.20–0.39 weak, 0.40–0.59 moderate, 0.60–0.79 strong, 0.80–1.00 very strong [30].
As an extra statistical measure, a p-value calculation was performed. The p-value is the probability of obtaining results that are at least as extreme as the results that are observed, considering the assumption that the null hypothesis is correct [31]. This methodological addition attempted to double-check hypotheses that connect sentiment polarization with the number of cases or deaths. Therefore, the p-values per case (polarization-cases and polarization-deaths) were extracted. As for the actual p-value, the alpha () value, also known as the level of significance, was set to 0.05. This means that, for a p-value < 0.05, it was considered that the null hypothesis was rejected, while for a p-value > 0.05, the null hypothesis was accepted due to a lack of enough proposition against it. Yet, in general, there is always a chance that a null hypothesis is true [32].
4. Results
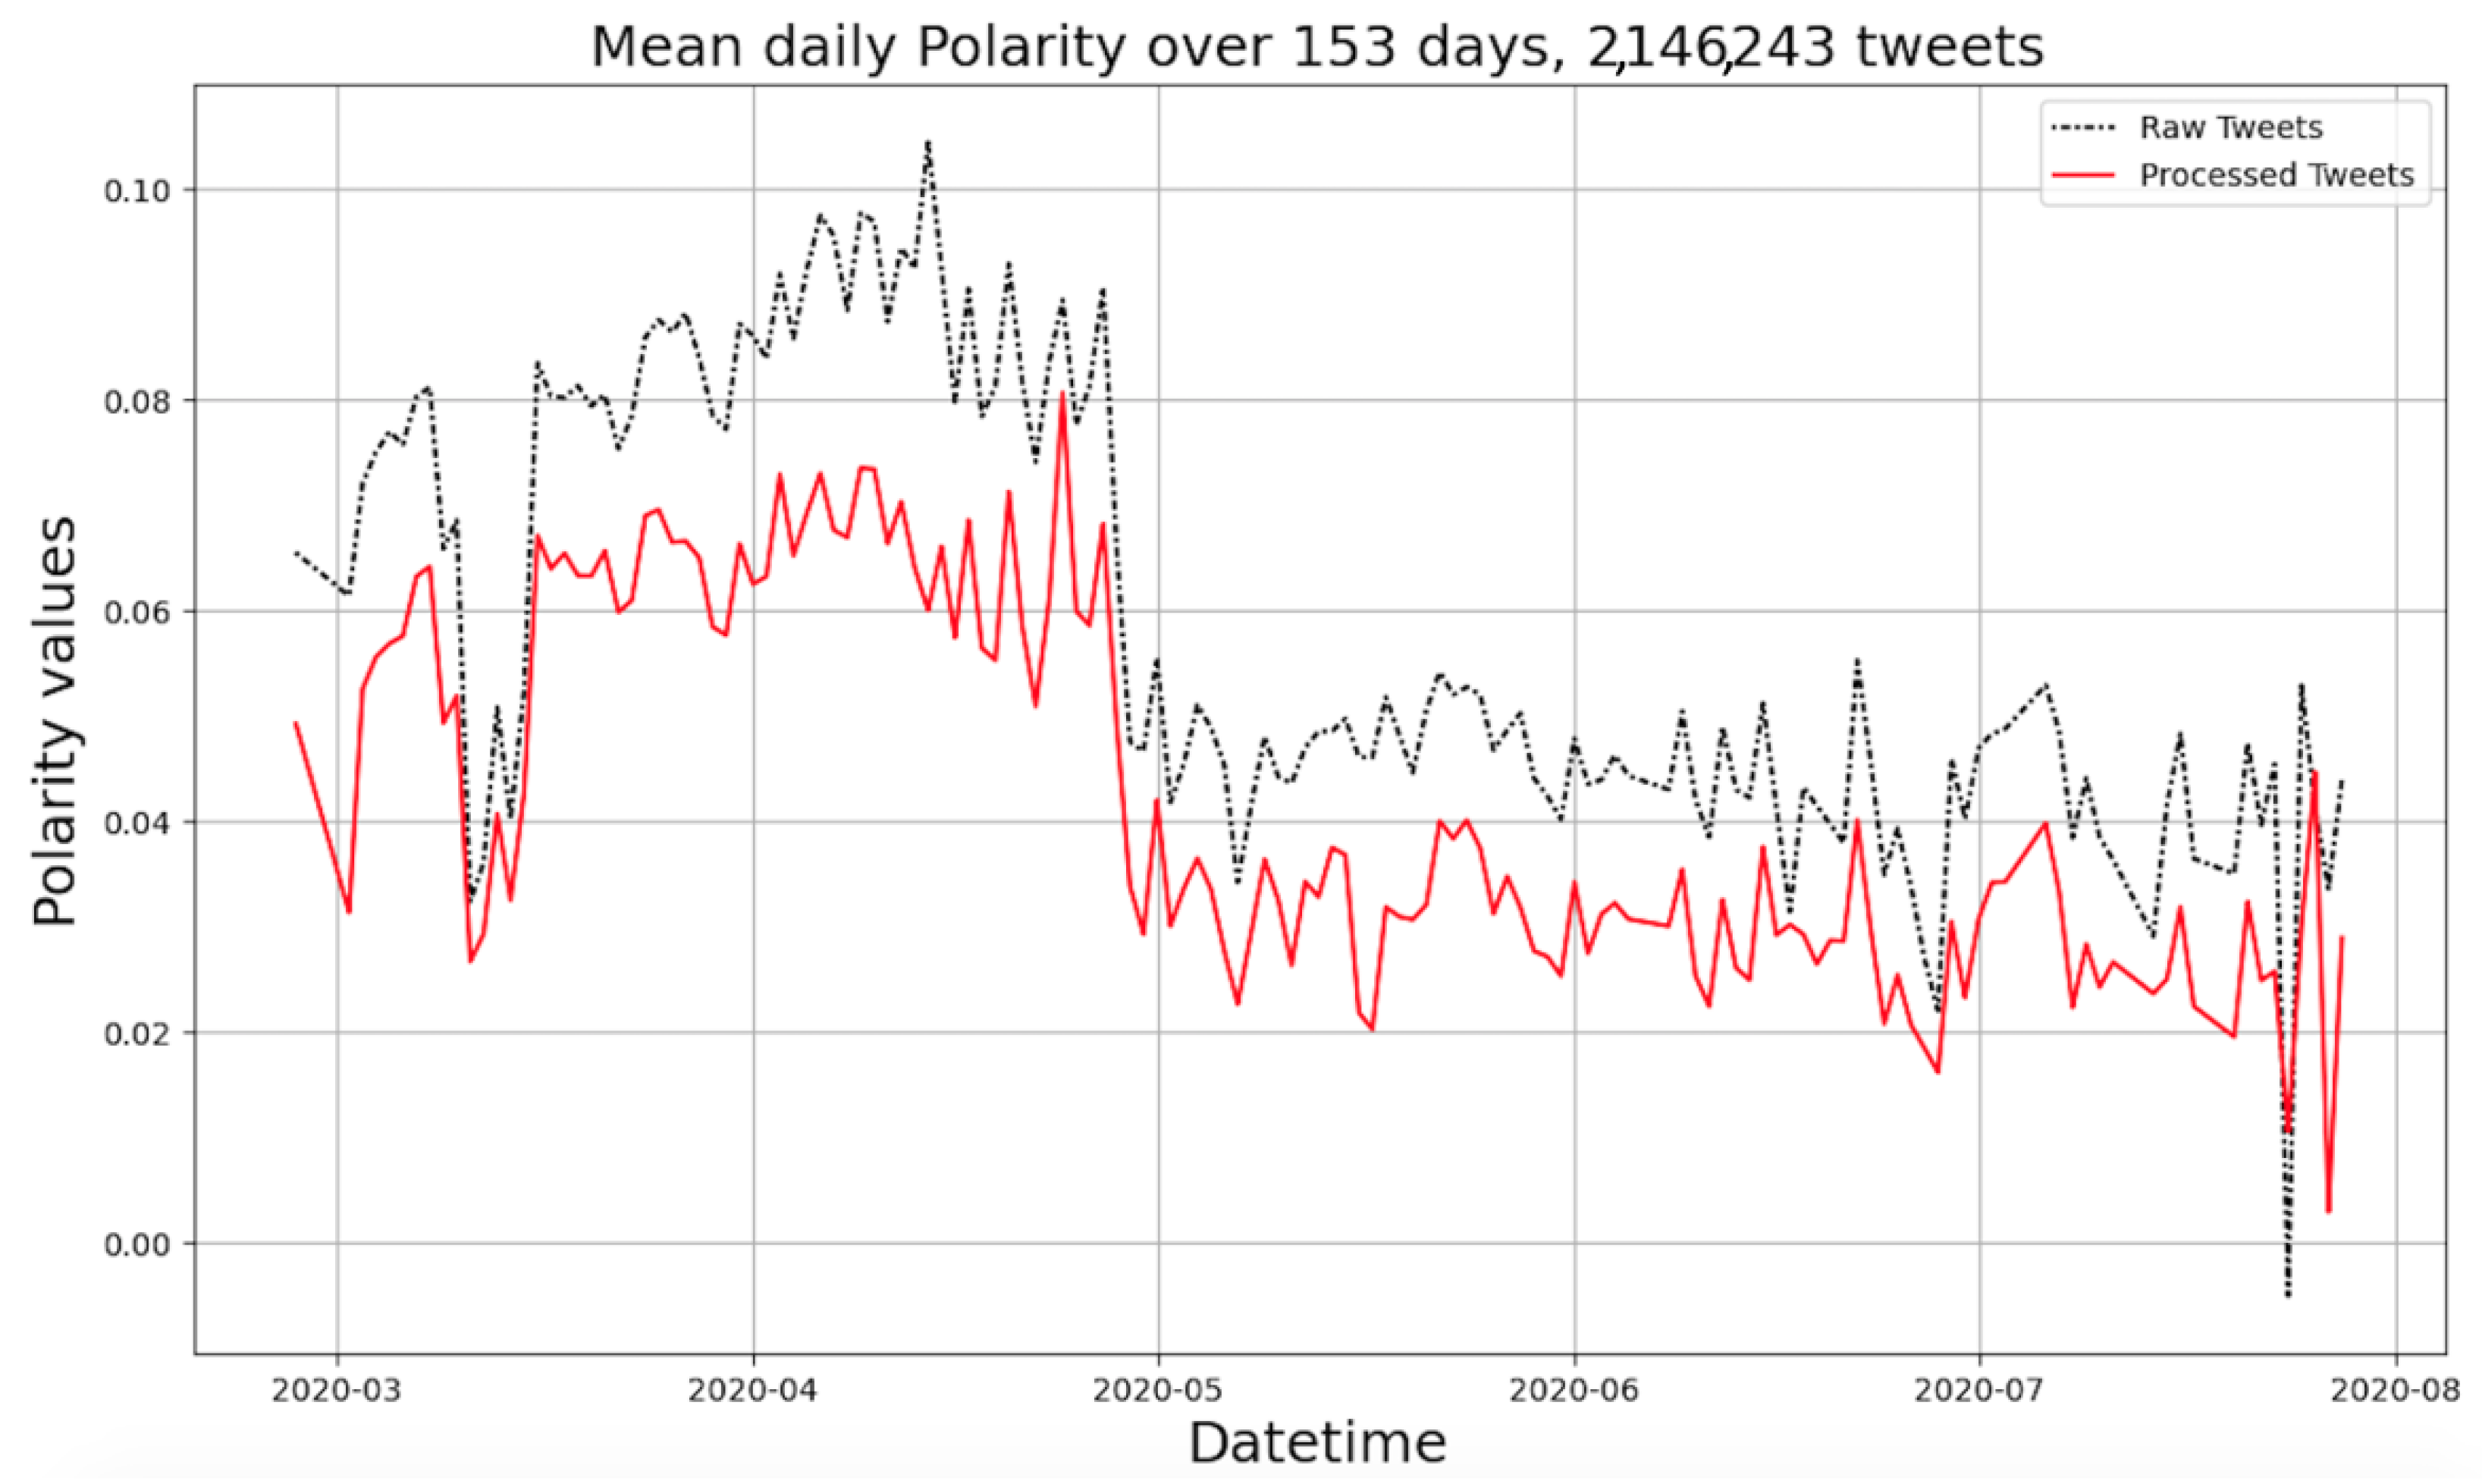
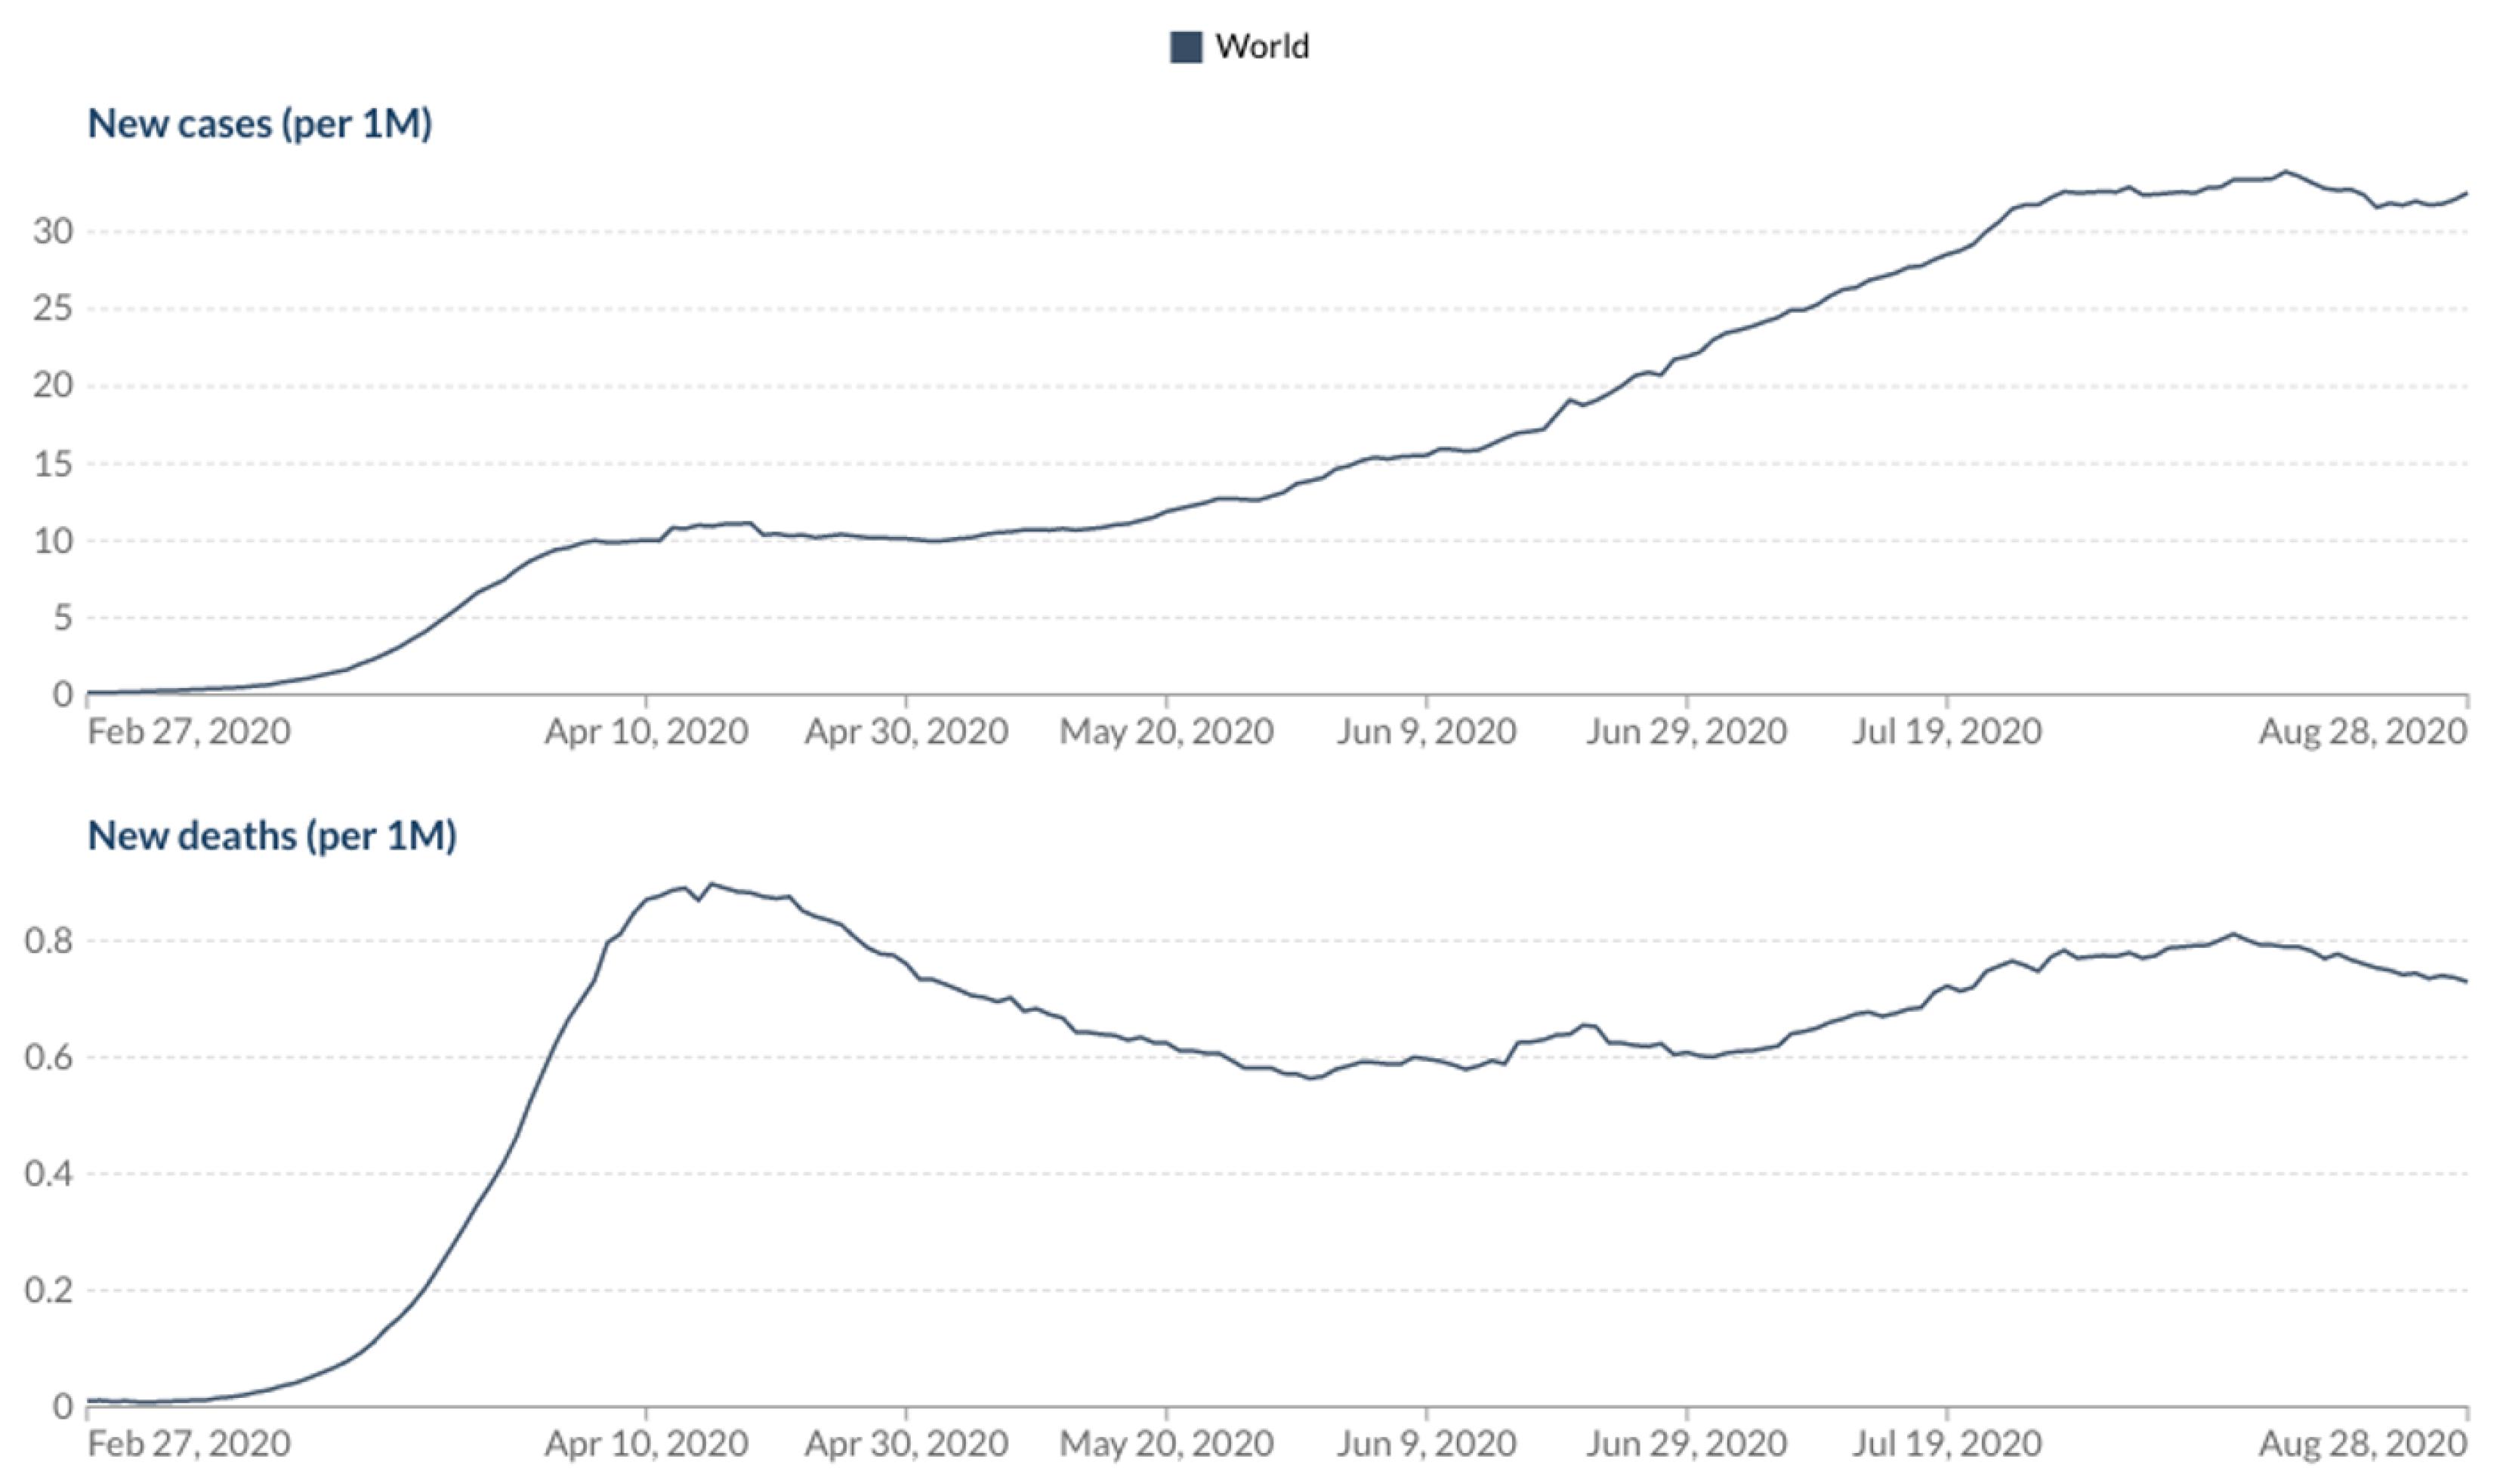
This section presents the outputs from preprocessing and polarization, as well as the statistical analysis for validating the hypothesis processes. Figure 3 reports on the output from the preprocessing and polarization process, highlighting the sentiment polarization analysis on raw tweets with no preprocessing (raw tweets) and preprocessing (processed tweets) in daily resolution. Figure 3 shows how the polarity values were adjusted after applying preprocessing (Section 3.2) to the gathered tweets. Moreover, according to Figure 3, it is evident that, after preprocessing the tweets, the polarity levels tended to follow the same value patterns, yet exposing reduced polarity values. It is noted that the statistical analysis process received as an input the processed tweets’ values. Figure 4 shows the world-wide daily new cases and deaths for the investigated period (27 February 2020 to 28 August 2020).
The Pearson correlation was calculated for the time series of the processed tweets. This process attempted to distinguish possible relationships between the variables cases vs. polarity and deaths vs. polarity for the 153 investigated days. The goal was to discover a qualitative measure of whether SMs’ data can be correlated with COVID-19, and, therefore, expose predictive opportunities regarding cases and deaths.
Based on the p-values from Table 6, Table 5 depicts the status of the conceived hypotheses. For each column in Table 6, the maximum and minimum Pearson correlation absolute values are in bold. For each row in Table 5, when observed along with Table 6, several findings can be extracted. For example, for the first row related to hypotheses HCB22 and HDB22 (22 days before), we can conclude that:
- New cases exhibited a strong negative correlation with polarity (cases increased, while polarity dropped).
- New deaths exhibited a very weak positive correlation with polarity (deaths increased and polarity increased, as well as deaths decreased and polarity decreased).
- New cases p-value < 0.05; therefore, the null hypothesis (HCB22) was rejected. HCB22: The number of cases in a day was not correlated with a higher-on-average positive sentiment polarity 22 days ahead.
- New deaths p-value > 0.05; therefore the null hypothesis (HDB22) was accepted. HDB22: The number of deaths in a day was not correlated with a higher-on-average positive sentiment polarity 22 days ahead.
For entries related to HC0 and HD0 (0 days):
- New cases exhibited a very strong negative correlation with polarity (cases increased, while polarity dropped).
- New deaths exhibited a very weak negative correlation with polarity (deaths increased and polarity decreased, as well as deaths decreased and polarity increased).
- New cases p-value < 0.05; therefore, the null hypothesis (HC0) was rejected. HC0: The number of cases in a day was not correlated with a higher-on-average positive sentiment polarity 0 days before/after.
- New deaths p-value > 0.05; therefore, the null hypothesis (HD0) was accepted. HD0: The number of deaths in a day was not correlated with a higher-on-average positive sentiment polarity 0 days before/after.
Despite their simplicity, Pearson correlation and p-value are well recognized and extensively used in scientific research because of their wide application and maturity [33]. As discussed in Section 3.4, the Pearson coefficient may be utilized to quantify a correlation. On the other hand, the p-value serves as a metric for determining the statistical significance of a correlation. In our case, this threshold was set to 0.05. This means that for a p-value < 0.05 it is considered that the null hypothesis is rejected, while for a p-value > 0.05 the null hypothesis is accepted due to insufficient evidence or arguments in opposition. For example, the statuses of “Hypotheses New Cases” in both Table 5 and Table 7 are all “Rejected”. This happens, since the p-values of “New Cases” in Table 6 are all nearly 0, satisfying the case that p-value < 0.05. Therefore, it is imperative to interpret the Pearson coefficient and p-value in conjunction rather than separately.
4.1. Discussion
This section discusses the knowledge extracted by the results’ interpretation. It informs about the insights regarding the COVID-19 crisis by utilizing data from Twitter. We focused on extracting and reporting on the polarity from tweets and examining the correlation strength of the polarity with the number of COVID-19 cases and deaths.
According to Figure 3, it is evident that the overall polarity of evaluated tweets from 27 February 2020 to 28 August 2020 with 2,146,243 harvested tweets showed a negative trend, as the polarity values dropped. More specifically, the polarity values started dropping after mid-April 2020. This can be attributed to the fact that, since the start of official data reporting of COVID-19 (February 2020), people had been reluctant to accept that there was indeed a pandemic [34]. Yet, on 17 April 2020, there was a greater number of reported daily deaths (12,430). So, this was the triggering point for an established long-term negative overall polarity trend.
According to Table 6, tweets before and after a day were strongly negatively correlated with COVID-19 cases on average. However, tweets’ “after” correlation with COVID-19 cases exhibited a slightly stronger negative correlation. The average correlation values for tweets “before” and tweets “after” with new cases were −0.624 and −0.640, respectively. For both cases, the findings are sound since new cases increased, while polarity dropped (negative trend). The strongest correlation between polarity and new cases was on the same day with a Pearson value of −1, while the weakest correlation was 1 day after, with a Pearson value of −0.589327552. Overall, there was a strong correlation between COVID-19 Twitter conversations’ polarity with reported cases.
Moreover, tweets before and after a day were very weakly to weakly correlated with COVID-19 deaths on average. Tweets’ “before” correlation with COVID-19 deaths exhibited a very weak positive correlation, while tweets “after” exhibited a weak negative correlation with COVID-19 deaths. The average correlation values for these periods were +0.056 and −0.341, respectively. These findings can be interpreted as tweets’ “before” polarity increased related to a day’s deaths, and then, there was a trend reversal for tweets’ “after” with a much greater negative correlation increase (after deaths were announced, the polarity decreased further). More precisely, this trend reversal happened 4 days “before” and negatively increased until 21 days “after”. It was also evident that the strongest correlation between polarity and new deaths was at 21 days after, while the weakest was at five days before. Overall, there was a weak correlation between COVID-19 Twitter conversations’ polarity with reported new deaths.
In case the utilization of p-values as expressed in Section 3.4 was not disputed, all hypotheses associating new cases with tweets’ polarization had a p-value < 0.05; therefore, they were rejected (Table 5). This was expected since new cases had an overall increasing trend, while sentiment polarity exhibited a negative trend. As for the hypotheses associating new deaths with tweets’ polarization, the values diversified. Yet, there was cohesion in the observed trends. From HDB1-HDB22, HD0, and HD1-HD3, there was a p-value > 0.05; therefore, these hypotheses were accepted. The remaining ones were rejected. This observation suggested that, as the number of deaths on a date increased, there was a higher-on-average positive sentiment polarity for 22 days before to 3 days after (a sum of 25 days).
As an expansion to Table 5, we checked the p-values for new cases and new deaths up to 50 days before to identify the threshold of the day when the hypotheses’ status change. According to Table 7, the hypotheses regarding new cases remained “rejected”, while the hypotheses regarding new deaths changed from “accepted” to “rejected” 42 days before the tweets. Therefore, the previously mentioned period of 25 days (according to Table 5) was expanded to a period of 6.5 weeks or 45 days, starting from 3 days “after” tweets and ending at tweets 41 days “before” the reported deaths. This suggests that people tended to start posting tweets four days after a day when deaths increased with diminished, yet positive polarization. Also, this means that the negativity in the tweets remained connected with the daily deaths, i.e., the hypotheses remained accepted for a very long period (45 days). When compared with the daily cases, the hypotheses remained rejected for the initial and the expanded period under scrutiny.
4.2. Implications
Based on our findings, a tool that offers text SA functionalities to validate proposed hypotheses related to a health crisis can be of great help to communities. For example, healthcare/medical professionals, researchers, or policymakers could extract indicators about existent psychological correlations resulting from SMs’ data. SMs offer numerous opportunities for extracting or communicating public health information. Therefore, such proactive opportunities should be exploited for improving public health officials’ online presence, in conjunction with predictive models [35].
Moreover, researchers may investigate the predictive capacity of SMs’ sentiment, considering the correlation between Twitter discussions linked to COVID-19 and the number of reported cases and deaths. This may entail:
- Generating correlation features for predictive algorithms to check if Twitter sentiment patterns can forecast fluctuations in COVID-19 cases and deaths. This might facilitate the development of real-time public health surveillance systems.
- Analyzing the emotion expressed on SMs in different places (hotspot detection) and comparing it to the number of reported events. This can aid in identifying COVID-19 hotspots or issues on SMs.
- Exploring the correlation between sentiment and public behavior in relation to COVID-19. The emotions expressed on Twitter can influence public behavior, such as the adoption of preventive measures or the level of engagement with health authorities. Gaining insight into these connections can enhance the effectiveness of public health communication.
- Performing temporal analysis, i.e., determining the duration between shifts in Twitter sentiment and documented occurrences. This might potentially uncover the lead time for preventative public health interventions.
- Integrating SMs’ sentiment data with mobility patterns and socioeconomic parameters to enhance the accuracy of prediction models and gain deeper insights into the spread of diseases.
Utilizing SMs as a dynamic and real-time data source allows researchers to definitively establish a correlation and obtain valuable insights for public health surveillance and action.
4.3. Limitations
This study was subject to possible biases and threats to validity, which we report here. There were no geo-location restrictions (localization) when crawling the data; therefore, we considered Twitter data spanning all over the world. We intended to deliver an approach that utilizes SMs’ data and investigates and exposes possible correlations between public sentiment regarding COVID-19 cases and deaths. Yet, this study could be reproduced also by applying localization filtering on the input data (tweets), increasing its practical implications. As already mentioned, the language for tweets retrieved was English. In addition, our findings were subject to limited generalization since we used data from only one SM, i.e., Twitter. Additionally, our approach could be extended to consider more SM platforms as data sources. This would increase the likelihood of a more-thorough real-world evaluation of the results.
Our data retrieval script (crawler) did not retrieve all the tweets related to COVID-19 available for the period of 27 February 2020 to 28 August 2020. This was due to minor technical issues encountered during that period. These issues related to the server that runs the script and its up-time. Nevertheless, we gathered around 14k English tweets per investigated day on a global scale.
SA methods have certain issues that may result in the poor validity of the polarization process. We did not attempt to enhance the polarization process, but we addressed the overall preprocessing. Therefore, the output of the sentiment polarization may be subject to disputes. Our improvements focused on text preprocessing techniques as reported in Section 3.2.
The hypotheses generated and their validation process (Pearson correlations and p-values) contain certain arbitrary concepts that cannot guarantee absolute result validity. For example, for the p-value, we set the alpha value to 0.05, adopting the empirical cut-off threshold typically used by the statistics community [36].
5. Conclusions
COVID-19 is a pandemic accompanied by increased traffic on SMs, offering great opportunities for knowledge extraction. The text contained in COVID-19 posts can act as a data source for reaching conclusions or finding correlations between the attitudes or reactions of the masses. SA is a process that measures the negativity or positivity of posts, enabling practitioners and researchers to take action by generating assertions regarding worldwide events. For example, authorities can assess government efficacy and modify communication techniques or policies by monitoring public attitudes. Positive attitudes may suggest public conformity, while negative sentiments may indicate areas of concern. Timely insights from this work enable prompt modifications, making public health more agile, thus improving legislation, resource allocation, and public health responses.
COVID-19 has become a global health concern. Online, people contribute large volumes of data about economic, social, political, and health concerns. They disseminate information and generate attitudes on specific problems. Therefore, we are in great need of effective tools that allow timely tracking and alerting of the public in case of worldwide healthcare events such as a pandemic. That way, we can mitigate or reduce losses in terms of human lives and the impact on societies and the economy. This paper attempted to offer such functionalities by validating trends on Twitter and correlating them with COVID-19. It also produced new insights for timely disease outbreak prediction by monitoring and evaluating multivariable correlations, such as sentiment polarity text from SMs with the actual numbers of COVID-19 cases and deaths. Possible implications were discussed more thoroughly in Section 4.2.
The key finding of this paper was that SMs’ users react to increased numbers of COVID-19-related deaths after four days by posting tweets with fading polarization. The negative trend in tweet sentiment polarity associated with COVID-19 deaths expanded to 45 days, unlike that associated with COVID-19 cases, while the negative correlation became even stronger (polarity dropped) after death numbers were published. The overall polarity of 2,146,243 tweets for the period under scrutiny (27 February 2020 to 28 August 2020) had a negative trend. People have been posting less-positive/more-negative tweets as the COVID-19 pandemic continues to spread.
Further findings included that tweets one day before or after were strongly negatively correlated with COVID-19 cases on average, while tweets’ “after” correlation with COVID-19 cases exhibited a slightly stronger negative correlation. New cases increased, while polarity dropped, forming a negative trend. The strongest correlation between polarity and new cases was for the same day, and the weakest correlation was 1 day after. Overall, there was a strong correlation between COVID-19 tweet polarity with reported cases. Also, tweets a day before or after were on average very weakly/weakly correlated with COVID-19 deaths. Tweets’ “before” correlation with COVID-19 deaths exhibited a very weak positive correlation, while tweets “after” showcased a weak negative correlation with COVID-19 deaths. Overall, there was a weak correlation between COVID-19 tweet polarity with reported new deaths.
The trends in the correlation between tweet polarity and COVID-19 cases/deaths may be affected by public sentiment’s reflection of awareness and adherence to preventive measures and health guidelines. A positive attitude may suggest compliance, lowering cases/deaths. On the other hand, a negative attitude may indicate public concern and increase reported cases/deaths. SMs’ disinformation may also affect public opinion and behavior, affecting reported cases/deaths. These explanations require further investigation and possibly socio-psychological factors for a more-thorough comprehension [37].
Future Work
This work envisioned the generation of a decision support system that takes into consideration SMs’ data to decide about healthcare-/medical-related problems [38], such as epidemics. It combined more than 30 different parameters like population characteristics (gender, life expectancy, age distribution, and more), indexes (economic, medical, and more), and healthcare dynamics like Intensive Care Units (ICUs), medical staff per capita, and vaccination programs. In addition, it considered various government policies applied (social distancing, lockdown, and more), interactions like tourism and air-travel connections, isolation from other countries, and SA on COVID-19 data retrieved from Twitter, but also from other SMs.
More specifically, the next steps of this work include:
- Performing Association Rule Mining (ARM) on tweets to discover the most-referenced topics/discussions and visualize the results.
- Reproducing the flow of our methodology, applying localization and language filtering on the input data (tweets), elevating the practical implications. Varying locations and nations have different regulations regarding the COVID-19 pandemic. Consequently, analyzing tweets from different regions, countries, and languages may provide more-valuable findings.
- Conducting forecasting analysis using an ensemble or a multivariate approach utilizing our SM dataset for predicting the course of the virus’s spread in relation to tweets’ polarization.
Author Contributions
Conceptualization, P.K.; methodology, P.K. and D.R.; software, P.K. and D.R.; validation, P.K. and C.T.; formal analysis, P.K.; investigation, P.K., D.R. and C.T.; resources, C.T.; data curation, P.K.; writing—original draft preparation, P.K.; writing—review and editing, P.K., D.R. and C.T.; visualization, P.K.; supervision, C.T.; project administration, C.T.; funding acquisition, C.T. All authors have read and agreed to the published version of the manuscript.
Funding
This research is co-financed by Greece and the European Union (European Social Fund-SF) through the Operational Programme “Human Resources Development, Education and Lifelong Learning 2014-2020” in the context of the project “Support for International Actions of the International Hellenic University”, (MIS 5154651).
Institutional Review Board Statement
Not applicable.
Informed Consent Statement
Not applicable.
Data Availability Statement
The data presented in this study are available upon request from the authors. The data are not publicly available due to more research analyses being performed.
Conflicts of Interest
Researchers at the School of Science and Technology, International Hellenic University.
Abbreviations
The following abbreviations are used in this manuscript:
| API | Application Programming Interface |
| ARM | Association Rule Mining |
| HTML | HyperText Markup Language |
| ICU | Intensive Care Unit |
| NLP | Natural Language Processing |
| RNN | Recurrent Neural Network |
| SA | Sentiment Analysis |
| SEIR | Susceptible–Exposed–Infectious–Recovered |
| SMs | Social Media |
| URL | Uniform Resource Locator |
References
- Apuke, O.D.; Omar, B. Fake news and COVID-19: Modelling the predictors of fake news sharing among social media users. Telemat. Inform. 2021, 56, 101475. [Google Scholar] [CrossRef] [PubMed]
- Twitter, Inc. Coronavirus: Staying Safe and Informed on Twitter. 2021. Available online: https://blog.twitter.com/en_us/topics/company/2020/covid-19.html (accessed on 3 September 2023).
- Pang, B.; Lee, L. Opinion Mining and Sentiment Analysis. Found. Trends® Inf. Retr. 2008, 2, 1–135. [Google Scholar] [CrossRef]
- Thelwall, M.; Buckley, K.; Paltoglou, G.; Cai, D.; Kappas, A. Sentiment in short strength detection informal text. J. Am. Soc. Inf. Sci. Technol. 2010, 61, 2544–2558. [Google Scholar] [CrossRef]
- Paltoglou, G.; Thelwall, M. A Study of Information Retrieval Weighting Schemes for Sentiment Analysis. In Proceedings of the 48th Annual Meeting of the Association for Computational Linguistics, Uppsala Sweden, 11–16 July 2010; Association for Computational Linguistics: Uppsala, Sweden, 2010; pp. 1386–1395. [Google Scholar]
- Thelwall, M. Sentiment analysis and time series with Twitter. Twitter Soc. 2014, 89, 83–95. [Google Scholar]
- Kapoteli, E.; Koukaras, P.; Tjortjis, C. Social Media Sentiment Analysis Related to COVID-19 Vaccines: Case Studies in English and Greek Language. In Proceedings of the Artificial Intelligence Applications and Innovations, Crete, Greece, 17–20 June 2022; Maglogiannis, I., Iliadis, L., Macintyre, J., Cortez, P., Eds.; Springer International Publishing: Cham, Switzerland, 2022; pp. 360–372. [Google Scholar] [CrossRef]
- Karagkiozidou, M.; Koukaras, P.; Tjortjis, C. Sentiment Analysis on COVID-19 Twitter Data: A Sentiment Timeline. In Proceedings of the Artificial Intelligence Applications and Innovations, Crete, Greece, 17–20 June 2022; Maglogiannis, I., Iliadis, L., Macintyre, J., Cortez, P., Eds.; Springer International Publishing: Cham, Switzerland, 2022; pp. 350–359. [Google Scholar] [CrossRef]
- Ramírez-Tinoco, F.J.; Alor-Hernández, G.; Sánchez-Cervantes, J.L.; Salas-Zárate, M.d.P.; Valencia-García, R. Use of Sentiment Analysis Techniques in Healthcare Domain. In Current Trends in Semantic Web Technologies: Theory and Practice; Springer International Publishing: Cham, Switzerland, 2019; pp. 189–212. [Google Scholar] [CrossRef]
- Georgiou, D.; MacFarlane, A.; Russell-Rose, T. Extracting sentiment from healthcare survey data: An evaluation of sentiment analysis tools. In Proceedings of the 2015 Science and Information Conference (SAI), London, UK, 28–30 July 2015; p. 352. [Google Scholar] [CrossRef]
- Batrinca, B.; Treleaven, P.C. Social media analytics: A survey of techniques, tools and platforms. AI Soc. 2015, 30, 89–116. [Google Scholar] [CrossRef]
- Koukaras, P.; Berberidis, C.; Tjortjis, C. A Semi-supervised Learning Approach for Complex Information Networks. In Proceedings of the Intelligent Data Communication Technologies and Internet of Things, Tamil Nadu, India, 27–28 August 2021; Hemanth, J., Bestak, R., Chen, J.I.Z., Eds.; Springer: Singapore, 2021; pp. 1–13. [Google Scholar] [CrossRef]
- McBride, O.; Murphy, J.; Shevlin, M.; Gibson-Miller, J.; Hartman, T.K.; Hyland, P.; Levita, L.; Mason, L.; Martinez, A.P.; McKay, R.; et al. Monitoring the psychological, social, and economic impact of the COVID-19 pandemic in the population: Context, design and conduct of the longitudinal COVID-19 psychological research consortium (C19PRC) study. Int. J. Methods Psychiatr. Res. 2021, 30, e1861. [Google Scholar] [CrossRef]
- Keshky, E.; Sayed, M.E.; Basyouni, S.S.; Sabban, A.M.A. Getting through COVID-19: The pandemic’s impact on the psychology of sustainability, quality of life, and the global economy–A systematic review. Front. Psychol. 2020, 11, 585897. [Google Scholar] [CrossRef] [PubMed]
- Balali, F.; Nouri, J.; Nasiri, A.; Zhao, T. Data Analytics. In Data Intensive Industrial Asset Management; Springer International Publishing: Cham, Switzerland, 2020; pp. 105–113. [Google Scholar] [CrossRef]
- Alamoodi, A.; Zaidan, B.; Al-Masawa, M.; Taresh, S.M.; Noman, S.; Ahmaro, I.Y.; Garfan, S.; Chen, J.; Ahmed, M.; Zaidan, A.; et al. Multi-perspectives systematic review on the applications of sentiment analysis for vaccine hesitancy. Comput. Biol. Med. 2021, 139, 104957. [Google Scholar] [CrossRef]
- Schoen, H.; Gayo-Avello, D.; Metaxas, P.T.; Mustafaraj, E.; Strohmaier, M.; Gloor, P. The power of prediction with social media. Internet Res. 2013, 23, 528–543. [Google Scholar] [CrossRef]
- Abd-Alrazaq, A.; Alhuwail, D.; Househ, M.; Hai, M.; Shah, Z. Top concerns of tweeters during the COVID-19 pandemic: A surveillance study. J. Med. Internet Res. 2020, 22, e19016. [Google Scholar] [CrossRef]
- Kaur, M.; Verma, R.; Otoo, F.N.K. Emotions in leader’s crisis communication: Twitter sentiment analysis during COVID-19 outbreak. J. Hum. Behav. Soc. Environ. 2021, 31, 362–372. [Google Scholar] [CrossRef]
- Barkur, G.; Vibha, G.B.K. Sentiment analysis of nationwide lockdown due to COVID 19 outbreak: Evidence from India. Asian J. Psychiatry 2020, 51, 102089. [Google Scholar] [CrossRef] [PubMed]
- Park, H.W.; Park, S.; Chong, M. Conversations and medical news frames on twitter: Infodemiological study on COVID-19 in South Korea. J. Med. Internet Res. 2020, 22, e18897. [Google Scholar] [CrossRef] [PubMed]
- Cinelli, M.; Quattrociocchi, W.; Galeazzi, A.; Valensise, C.M.; Brugnoli, E.; Schmidt, A.L.; Zola, P.; Zollo, F.; Scala, A. The COVID-19 social media infodemic. Sci. Rep. 2020, 10, 16598. [Google Scholar] [CrossRef] [PubMed]
- Singh, L.; Bansal, S.; Bode, L.; Budak, C.; Chi, G.; Kawintiranon, K.; Padden, C.; Vanarsdall, R.; Vraga, E.; Wang, Y. A first look at COVID-19 information and misinformation sharing on Twitter. arXiv 2020, arXiv:2003.13907. [Google Scholar]
- Nemes, L.; Kiss, A. Social media sentiment analysis based on COVID-19. J. Inf. Telecommun. 2021, 5, 1–15. [Google Scholar] [CrossRef]
- Lopez, C.E.; Vasu, M.; Gallemore, C. Understanding the perception of COVID-19 policies by mining a multilanguage Twitter dataset. arXiv 2020, arXiv:2003.10359. [Google Scholar]
- Samuel, J.; Ali, G.G.; Rahman, M.; Esawi, E.; Samuel, Y. COVID-19 public sentiment insights and machine learning for tweets classification. Information 2020, 11, 314. [Google Scholar] [CrossRef]
- Hamzah, F.B.; Lau, C.; Nazri, H.; Ligot, D.V.; Lee, G.; Tan, C.L.; Shaib, M.; Zaidon, U.H.B.; Abdullah, A.B.; Chung, M.H. CoronaTracker: Worldwide COVID-19 outbreak data analysis and prediction. Bull. World Health Organ. 2020, 1. [Google Scholar]
- Das, S.; Dutta, A. Characterizing public emotions and sentiments in COVID-19 environment: A case study of India. J. Hum. Behav. Soc. Environ. 2021, 31, 154–167. [Google Scholar] [CrossRef]
- R Core Team. R: A Language and Environment for Statistical Computing; R Foundation for Statistical Computing: Vienna, Austria, 2020; Available online: https://www.R-project.org/ (accessed on 4 October 2023).
- Evans, J.D. Straightforward Statistics for the Behavioral Sciences; Thomson Brooks/Cole Publishing Co.: Pacific Grove, CA, USA, 1996. [Google Scholar]
- Ioannidis, J.P.A. The proposal to lower p value thresholds to 0.005. JAMA 2018, 319, 1429–1430. [Google Scholar] [CrossRef] [PubMed]
- Nickerson, R.S. Null hypothesis significance testing: A review of an old and continuing controversy. Psychol. Methods 2000, 5, 241. [Google Scholar] [CrossRef] [PubMed]
- Komaroff, E. Relationships between p-values and Pearson correlation coefficients, type 1 errors and effect size errors, under a true null hypothesis. J. Stat. Theory Pract. 2020, 14, 49. [Google Scholar] [CrossRef]
- Islam, M.S.; Sarkar, T.; Khan, S.H.; Kamal, A.H.M.; Hasan, S.M.M.; Kabir, A.; Yeasmin, D.; Islam, M.A.; Chowdhury, K.I.A.; Anwar, K.S. COVID-19–related infodemic and its impact on public health: A global social media analysis. Am. J. Trop. Med. Hyg. 2020, 103, 1621. [Google Scholar] [CrossRef] [PubMed]
- Guo, Q.; He, Z. Prediction of the confirmed cases and deaths of global COVID-19 using artificial intelligence. Environ. Sci. Pollut. Res. 2021, 28, 11672–11682. [Google Scholar] [CrossRef] [PubMed]
- Kennedy-Shaffer, L. Before p < 0.05 to beyond p < 0.05: Using history to contextualize p-values and significance testing. Am. Stat. 2019, 73, 82–90. [Google Scholar] [CrossRef] [PubMed]
- Oyanedel, J.C.; Espinosa, A.; Çakal, H.; Paez, D. Socio-psychological perspectives on collective behavior and social movements. Front. Psychol. 2023, 14, 1266567. [Google Scholar] [CrossRef]
- Koukaras, P.; Rousidis, D.; Tjortjis, C. Forecasting and Prevention Mechanisms Using Social Media in Health Care; Springer: Berlin/Heidelberg, Germany, 2020; Volume 891, pp. 121–137. [Google Scholar] [CrossRef]
- Yan, X.; Jian, F.; Sun, B. SAKG-BERT: Enabling Language Representation with Knowledge Graphs for Chinese Sentiment Analysis. IEEE Access 2021, 9, 101695–101701. [Google Scholar] [CrossRef]
Figure 1.
Contextual processes and flow of research approach.

Figure 2.
Overview of tweet preprocessing and polarization.

Figure 3.
Changes in sentiment polarity after preprocessing.

Figure 4.
Changes in daily cases and deaths on a worldwide scale.


Table 1.
Tweet description.
| No | Attribute | Description |
|---|---|---|
| 1 | username | The name of the user. |
| 2 | tweet_id | The id of the tweet. |
| 3 | text | The text posted with the tweet. |
| 4 | url | The URL of the tweet. |
| 5 | n_retweet | The number of times the tweet was retweeted. |
| 6 | n_favorite | The number of times the tweet was marked as favorite (liked). |
| 7 | n_reply | The number of replies to the tweet. |
| 8 | datetime | The date and time of the tweet post. |
| 9 | user_id | The user’s id. |
Table 2.
Examples of polarity values of raw and processed tweets.
| Date | Raw Tweet Text | Raw Tweet Polarity | Processed Tweet Text | Processed Tweet Polarity |
|---|---|---|---|---|
| 14 March 2020 | …It’s very difficult to get ANY news on the #coronavirus in #China—and what is happening there now? | −0.65 | difficult news happening | −0.5 |
| 23 March 2020 | So what’s going to be your newspaper of choice for when the time comes? Stay safe, stay isolated & save lives #Coronavirus #Healthcare #QBAIN https://lnkd.in/dzViDaX | +0.5 | whats going newspaper choice time comes stay safe stay isolated save lives | +0.5 |
| 26 March 2020 | Looking for peace of mind in these uncertain times because of the #Coronavirus ?! We’re offering #mobile #patrols to businesses in #Cardiff, #Newport, #Bristol and around- such a cost effective #security #solution which could save you £££ from theft and vandalism. pic.twitter.com/idA1Xe4wZl | +0.3 | looking peace mind uncertain times offering businesses cost effective save theft vandalism | +0.6 |
| 1 April 2020 | Stranded at sea: Coast Guard says cruise ships must stay offshore with sick onboard. https://krld.radio.com/articles/ap-news/coast-guard-cruise-ships-must-stay-at-sea-with-sick-onboard … via KRLD #CruiseShips #COVID19 #coronavirus #Florida | −0.7142 | stranded sea coast guard says cruise ships stay offshore sick onboard | −0.7142 |
Table 3.
Indicative null hypotheses for COVID-19 cases.
| Hypothesis | Explanation |
|---|---|
| HCB22 | The number of cases in a day is not correlated with a higher-on-average positive sentiment polarity 22 days before. |
| HC0 | The number of cases in a day is not correlated with a higher-on-average positive sentiment polarity during the same day. |
| HCA21 | The number of cases in a day is not correlated with a higher-on-average positive sentiment polarity 21 days after. |
Table 4.
Indicative null hypotheses for COVID-19 deaths.
| Hypothesis | Explanation |
|---|---|
| HDB22 | The number of deaths in a day is not correlated with a higher-on-average positive sentiment polarity 22 days before. |
| HD0 | The number of deaths in a day is not correlated with a higher-on-average positive sentiment polarity during the same day. |
| HDA21 | The number of deaths in a day is not correlated with a higher-on-average positive sentiment polarity 21 days after. |
Table 5.
HCB1 -HCB22, HC0, HCA1-HCA21 and HDB1-HDB22, HD0, HDA1-HDA21 status.
| Before or After (Tweets) | Hypotheses’ New Cases | Status | Hypotheses’ New Deaths | Status |
|---|---|---|---|---|
| 22 days before | HCB22 | Rejected | HDB22 | Accepted |
| 21 days before | HCB21 | Rejected | HDB21 | Accepted |
| 20 days before | HCB20 | Rejected | HDB20 | Accepted |
| 19 days before | HCB19 | Rejected | HDB19 | Accepted |
| 18 days before | HCB18 | Rejected | HDB18 | Accepted |
| 17 days before | HCB17 | Rejected | HDB17 | Accepted |
| 16 days before | HCB16 | Rejected | HDB16 | Accepted |
| 15 days before | HCB15 | Rejected | HDB15 | Accepted |
| 14 days before | HCB14 | Rejected | HDB14 | Accepted |
| 13 days before | HCB13 | Rejected | HDB13 | Accepted |
| 12 days before | HCB12 | Rejected | HDB12 | Accepted |
| 11 days before | HCB11 | Rejected | HDB11 | Accepted |
| 10 days before | HCB10 | Rejected | HDB10 | Accepted |
| 9 days before | HCB9 | Rejected | HDB9 | Accepted |
| 8 days before | HCB8 | Rejected | HDB8 | Accepted |
| 7 days before | HCB7 | Rejected | HDB7 | Accepted |
| 6 days before | HCB6 | Rejected | HDB6 | Accepted |
| 5 days before | HCB5 | Rejected | HDB5 | Accepted |
| 4 days before | HCB4 | Rejected | HDB4 | Accepted |
| 3 days before | HCB3 | Rejected | HDB3 | Accepted |
| 2 days before | HCB2 | Rejected | HDB2 | Accepted |
| 1 day before | HCB1 | Rejected | HDB1 | Accepted |
| 0 days | HC0 | Rejected | HD0 | Accepted |
| 1 day after | HCA1 | Rejected | HDA1 | Accepted |
| 2 days after | HCA2 | Rejected | HDA2 | Accepted |
| 3 days after | HCA3 | Rejected | HDA3 | Accepted |
| 4 days after | HCA4 | Rejected | HDA4 | Rejected |
| 5 days after | HCA5 | Rejected | HDA5 | Rejected |
| 6 days after | HCA6 | Rejected | HDA6 | Rejected |
| 7 days after | HCA7 | Rejected | HDA7 | Rejected |
| 8 days after | HCA8 | Rejected | HDA8 | Rejected |
| 9 days after | HCA9 | Rejected | HDA9 | Rejected |
| 10 days after | HCA10 | Rejected | HDA10 | Rejected |
| 11 days after | HCA11 | Rejected | HDA11 | Rejected |
| 12 days after | HCA12 | Rejected | HDA12 | Rejected |
| 13 days after | HCA13 | Rejected | HDA13 | Rejected |
| 14 days after | HCA14 | Rejected | HDA14 | Rejected |
| 15 days after | HCA15 | Rejected | HDA15 | Rejected |
| 16 days after | HCA16 | Rejected | HDA16 | Rejected |
| 17 days after | HCA17 | Rejected | HDA17 | Rejected |
| 18 days after | HCA18 | Rejected | HDA18 | Rejected |
| 19 days after | HCA19 | Rejected | HDA19 | Rejected |
| 20 days after | HCA20 | Rejected | HDA20 | Rejected |
| 21 days after | HCA21 | Rejected | HDA21 | Rejected |
Table 6.
Pearson analysis and p-values for hypotheses.
| Pearson | p-Value | |||
|---|---|---|---|---|
| Before or After (Tweets) | New Cases | New Deaths | New Cases | New Deaths |
| 22 days before | −0.682397393 | 0.064007689 | 2.656751 × | 0.4318411072 |
| 21 days before | −0.668832958 | 0.094788235 | 3.457032 × | 0.2438260698 |
| 20 days before | −0.659785755 | 0.114805283 | 1.778129 × | 0.1576280727 |
| 19 days before | −0.654462348 | 0.077009274 | 4.540812 × | 0.3440739433 |
| 18 days before | −0.647419723 | 0.098690523 | 1.525454 × | 0.2248666403 |
| 17 days before | −0.648581248 | 0.111132148 | 1.251861 × | 0.1714386103 |
| 16 days before | −0.642864119 | 0.110891371 | 3.284914 × | 0.1723742716 |
| 15 days before | −0.637800131 | 0.100506525 | 7.590937 × | 0.2164085749 |
| 14 days before | −0.631030263 | 0.104354511 | 2.270785 × | 0.1992412055 |
| 13 days before | −0.623964697 | 0.114745846 | 6.926604 × | 0.1578446973 |
| 12 days before | −0.615586662 | 0.099098688 | 2.506834 × | 0.2229455290 |
| 11 days before | −0.608527263 | 0.072126649 | 7.195522 × | 0.3756198922 |
| 10 days before | −0.612990331 | 0.064721794 | 3.705770 × | 0.4267106953 |
| 9 days before | −0.609080218 | 0.060639591 | 6.631372 × | 0.4565107126 |
| 8 days before | −0.602979915 | 0.052506207 | 1.618103 × | 0.5191964112 |
| 7 days before | −0.602403416 | 0.032609932 | 1.758695 × | 0.6890378327 |
| 6 days before | −0.593575808 | 0.032416871 | 6.169950 × | 0.6907843868 |
| 5 days before | −0.596424444 | 0.022436303 | 4.132437 × | 0.7831007437 |
| 4 days before | −0.597113974 | −0.02443483 | 3.748100 × | 0.7643233905 |
| 3 days before | −0.594898888 | −0.03989054 | 5.124412 × | 0.6244401717 |
| 2 days before | −0.601584888 | −0.035023577 | 1.978978 × | 0.6673433965 |
| 1 day before | −0.598194551 | −0.08960527 | 3.214907 × | 0.2706860939 |
| 0 days | −1 | −0.102988581 | 5.370485 × | 0.2052186403 |
| 1 day after | −0.589327552 | −0.103525311 | 1.113581 × | 0.2028546523 |
| 2 days after | −0.590766552 | −0.105324435 | 9.125971 × | 0.1950738874 |
| 3 days after | −0.598896707 | −0.147560598 | 2.908906 × | 0.0687235141 |
| 4 days after | −0.602324548 | −0.179448648 | 1.778832 × | 0.0264525313 |
| 5 days after | −0.60894604 | −0.187501582 | 6.764163 × | 0.0202938748 |
| 6 days after | −0.616741202 | −0.210136379 | 2.104434 × | 0.0091311637 |
| 7 days after | −0.613129478 | −0.216184442 | 3.629279 × | 0.0072760296 |
| 8 days after | −0.61366015 | −0.250020096 | 3.351459 × | 0.0018278124 |
| 9 days after | −0.62382306 | −0.279359638 | 7.081152 × | 0.0004704534 |
| 10 days after | −0.627804213 | −0.297903763 | 3.791896 × | 0.0001840738 |
| 11 days after | −0.635435763 | −0.334763794 | 1.116439 × | 0.0000234179 |
| 12 days after | −0.647962474 | −0.368159086 | 1.391019 × | 2.840249 × |
| 13 days after | −0.64904319 | −0.41192768 | 1.156945 × | 1.221343 × |
| 14 days after | −0.649966799 | −0.432694794 | 9.877983 × | 2.326802 × |
| 15 days after | −0.657188862 | −0.452799342 | 2.815904 × | 4.188228 × |
| 16 days after | −0.657710312 | −0.456969479 | 2.568535 × | 2.893469 × |
| 17 days after | −0.671844689 | −0.490331816 | 1.978649 × | 1.246703 × |
| 18 days after | −0.682830135 | −0.525601893 | 2.442358 × | 3.037625 × |
| 19 days after | −0.695486107 | −0.546111834 | 1.952164 × | 2.853218 × |
| 20 days after | −0.705188049 | −0.577610178 | 2.570777 × | 5.431783 × |
| 21 days after | −0.712609124 | −0.596110089 | 5.153229 × | 4.320166 × |
Table 7.
Hypotheses status for new cases and new deaths up to 50 days before.
| Before (Tweets) | Hypotheses New Cases p-Values | Status | Hypotheses New Deaths p-Values | Status |
|---|---|---|---|---|
| 50 days before | 1.29 × | Rejected | 5.67727 × | Rejected |
| 45 days before | 2.19 × | Rejected | 0.018876142 | Rejected |
| 43 days before | 2.19 × | Rejected | 0.015088417 | Rejected |
| 42 days before | 3.27 × | Rejected | 0.032555018 | Rejected |
| 41 days before | 5.48 × | Rejected | 0.078846068 | Accepted |
| 40 days before | 2.48 × | Rejected | 0.125211833 | Accepted |
| 30 days before | 1.22 × | Rejected | 0.921742577 | Accepted |
| 27 days before | 1.18 × | Rejected | 0.706649347 | Accepted |
| 23 days before | 1.31 × | Rejected | 0.362643608 | Accepted |
Disclaimer/Publisher’s Note: The statements, opinions and data contained in all publications are solely those of the individual author(s) and contributor(s) and not of MDPI and/or the editor(s). MDPI and/or the editor(s) disclaim responsibility for any injury to people or property resulting from any ideas, methods, instructions or products referred to in the content. |
© 2023 by the authors. Licensee MDPI, Basel, Switzerland. This article is an open access article distributed under the terms and conditions of the Creative Commons Attribution (CC BY) license (https://creativecommons.org/licenses/by/4.0/).
Share and Cite
MDPI and ACS Style
Koukaras, P.; Rousidis, D.; Tjortjis, C. Unraveling Microblog Sentiment Dynamics: A Twitter Public Attitudes Analysis towards COVID-19 Cases and Deaths. Informatics 2023, 10, 88. https://doi.org/10.3390/informatics10040088
AMA Style
Koukaras P, Rousidis D, Tjortjis C. Unraveling Microblog Sentiment Dynamics: A Twitter Public Attitudes Analysis towards COVID-19 Cases and Deaths. Informatics. 2023; 10(4):88. https://doi.org/10.3390/informatics10040088
Chicago/Turabian StyleKoukaras, Paraskevas, Dimitrios Rousidis, and Christos Tjortjis. 2023. "Unraveling Microblog Sentiment Dynamics: A Twitter Public Attitudes Analysis towards COVID-19 Cases and Deaths" Informatics 10, no. 4: 88. https://doi.org/10.3390/informatics10040088
Note that from the first issue of 2016, this journal uses article numbers instead of page numbers. See further details here.