

Genealogical Data-Driven Visits of Historical Cemeteries


Institute of Informatics and Telematics, National Research Council, 56124 Pisa, Italy
*
Author to whom correspondence should be addressed.
Informatics 2024, 11(1), 9; https://doi.org/10.3390/informatics11010009
Submission received: 31 October 2023
/
Revised: 9 February 2024
/
Accepted: 19 February 2024
/
Published: 22 February 2024
(This article belongs to the Section Social Informatics and Digital Humanities)
Abstract
:This paper describes the Integration of Archives and Cultural Places (IaCuP) project, which aims to integrate information about a historical cemetery, including its map and grave inventory, with genealogical and documentary knowledge extracted from relevant historical archives. The integrated data are accessible to cemetery visitors through an interactive mobile application, enabling them to navigate a graphical representation of the cemetery while exploring comprehensive visualizations of genealogical data. The basic idea stems from the desire to provide people with access to the rich context of cultural sites, which have often lost their original references over the centuries, making it challenging for individuals today to interpret the meanings embedded within them. The proposed approach leverages large language models (LLMs) to extract information from relevant documents and Web technologies to represent such information as interactive visualizations. As a practical case study, this paper focuses on the Jewish Cemetery in Pisa and the Historical Archives of the Jewish Community in Pisa, working on the genealogical tree of one of the most representative families resting in the cemetery.
1. Introduction
Cultural sites are invaluable repositories of historical significance, offering information on the heritage and history of societies. However, the passage of time often obscures these sites’ original context and meaning, making it challenging for contemporary visitors to fully comprehend their cultural and historical importance. Over the past twenty years, a great effort has been made to provide cemeteries the status of cultural and touristic sites. The original hesitancy for tourists to visit cemeteries is fading, and a new tourism category, also known as dark tourism or tombstone tourism, is emerging [1] due to people with a passion for genealogy and the history of famous deaths, as well as for art. Many initiatives have been proposed following this line, such as the Association of Significant Cemeteries in Europe (ASCE), which groups noteworthy cemeteries in Europe and promotes them as cultural sites [2].
From a tourist perspective, it is often difficult to access additional information about people buried in the cemeteries, such as family ties, the reconstruction of damaged epigraphs, translations, etc. Nevertheless, this information can be retrieved from historical archives, such as registers of births, marriages, deaths, and burials. The reconstruction of family ties makes it possible to offer visitors of the cemetery a new kind of experience: while they are visiting the cultural site, an interactive visual representation of the genealogical information is provided alongside a map of the cemetery in a web/mobile application. The app is intended as a way to enrich an on-site visit by providing another axis of information to the user. This additional information helps users find tombs of a specific person or other members of their family while visiting the place, even if epigraphs are not easily readable and members of a single family are buried in multiple areas. Such an approach also enables a novel type of “data-driven” visit for tourists, in which they could be driven by curiosity to explore interactive genealogical data visualizations while they are visiting the physical place. This type of visit can be added as a complement to the more traditional human guides, audio guides, pamphlet, or sign-based guides. Augmenting a cultural place with information extracted from historical archives could transform heritage exploration into a dynamic and multidimensional experience, especially for tourists.
The main objective of this paper is to illustrate the Integration of Archives and Cultural Places (IaCuP) project, which aims to define and implement a methodology to enrich cultural places with information extracted from documents contained in archives. This integrated approach could serve as a bridge between the tangible and intangible aspects of cultural heritage.
As a case study, IaCuP focuses on the Jewish Cemetery in Pisa. It implements a 2D interactive map for its navigation, fully integrated with a knowledge base containing information about people buried in the cemetery and their family ties. The map and the knowledge base link cultural places and documents stored in associated archives, thanks to the use of technologies to analyze texts and their representation on the Web. The IaCuP project has three main objectives:
- Cultural tourism. First, the project aims to promote the Jewish Cemetery in Pisa, a cultural site presently excluded from the traditional Pisa tour, despite being located adjacent to the famous Leaning Tower;
- Innovation. The second goal involves devising a “data-driven” tour of the Jewish Cemetery, enhancing the visitor experience by providing valuable information during their physical exploration of the cemetery. IaCuP aims to complement the traditional approach of using plaques or human guides by providing a 2D interactive map with additional information layers (in this case, genealogy);
- Technology. Finally, the project aims to test different technologies to combine entity extraction, genealogical representation, and 2D map navigation. The chosen technologies could also be used in other contexts since they are free, open-source, and scalable.
The IaCuP project focuses on the specific area of funerary cultural heritage and genealogy, but the implemented strategy could also be generalized to other sites such as historical buildings, museums, or gardens or even other data contexts such as heraldry, provenance, artistic currents, or taxonomies.
This paper improves on the previous work [3], which digitized, transcribed, analyzed, and published some documents from the Historical Archive of the Jewish Community in Pisa over the Web. As an output of the previous work, a preliminary knowledge base was built, containing the entities (person, date, and place) extracted from the Registry of Births and Deaths provided by the Jewish Community. Compared to the previous work, this paper describes the use of large language models (LLMs) to extract further information from the Registry of Births and Deaths. In addition, it discusses the building of a genealogical tree of the most relevant families extracted from the Registry. The described approach relies on a graph database (A graph database is a type of database that uses graph structures for data storage, where nodes represent entities and edges represent the relationships between these entities. Unlike traditional relational databases, which are based on tables, rows, and columns, graph databases are optimized for querying and navigating complex networks of interconnected data—(https://en.wikipedia.org/wiki/Graph_database (accessed on 18 February 2024) (Graph DB), which has proven very efficient in managing genealogical data. Finally, this paper presents an interactive map based on the cemetery map, which enhances the on-site navigation of the cemetery by showing the integrated genealogical information. The map application is based on and improves upon the technologies (The Anymapper library—https://github.com/webvis/anymapper (accessed on 18 February 2024) developed within the context of the Smart Area CNR Pisa project, which is also currently powering the map of IIT’s personnel provided by the Institute’s official website - Map of CNR-IIT—https://map.iit.cnr.it (accessed on 18 February 2024).
This paper is organized as follows: Section 2 describes related literature, and Section 3 encompasses an overview of the Jewish Cemetery in Pisa. Section 4 describes the proposed approach. Section 5, Section 6 and Section 7 illustrate the entity extraction process from the archive, the process of building a genealogical tree, and the interactive map, respectively. Finally, Section 8 gives the conclusions and future work.
2. Related Work
The section first provides a literature review of some representative projects related to the funerary domain. Then, it describes the existing literature about the technologies used in this paper to extract the information from the registry, build the genealogical tree, and implement interactive visualizations.
2.1. Projects Related to the Funerary Domain
Regarding the funerary domain, existing projects over the Web provide static and interactive maps [4,5], cemetery tours, and pages describing entities within the cemetery, such as points of interest, services, and essential deceased people resting in the cemetery [6,7,8,9].
Other important works present in this field are the Epigraphy section of the PEACE portal [10] and the FIJI database [11]. PEACE is an open-access, major digital hub of Jewish funerary inscriptions through the ages. The Epigraphy section includes over 48,000 funerary inscriptions, ranging in date from the 5th century BCE to the 20th century CE and covering broad geographic areas: parts of Israel and ancient Palestine, Italy, and Germany, as well as some cemeteries in the Czech Republic, Latvia, the Netherlands, Poland, and Spain. The FIJI (Funerary Inscriptions of Jews from Italy) database contains Jewish funerary texts from Late Antiquity and the early medieval period, discovered primarily in Rome, Venosa, and several other locations in Italy.
The main limitation of all these initiatives is that it is difficult to reconstruct the history of ordinary deceased people, mainly because of the lack of information. Furthermore, constructing the genealogical paths of the great families resting in the cemeteries is often possible. Still, it is only possible to reconstruct the parental relationships of ordinary people if they rest in the same chapel. This research paper describes a strategy integrating information about specific cultural sites with documentary knowledge from associated archives. As a result, an interactive mobile application enabled visitors to explore the genealogical relationships among the people buried in the cemetery while navigating a map of the cultural place.
2.2. Entity Extraction
Named entity recognition (NER) is a well-known task in natural language processing (NLP), aiming to identify and classify named entities in texts, such as persons, locations, organizations, dates, etc. Traditional NER techniques include rule-based, learning-based, and hybrid approaches [12,13]. Given the growing interest in large language models (LLMs), a thriving literature around using LLMs to perform NER tasks is also developing.
One way to use LLMs for NER is to transform the sequence labeling task of NER to a generation task that LLMs can quickly adapt. Wang et al. propose a method to encode the input sentence and the entity type as a single prompt and decode the entity span as the output [14]. It also introduces a self-verification strategy to address the hallucination issue of LLMs [15], where they may generate spurious entities that do not exist in the input sentence.
Another way to use LLMs for NER is to leverage their ability to access external knowledge sources, such as Wikipedia or other knowledge bases. Malmasi et al. present a large multilingual dataset for NER that covers three domains (Wiki sentences, questions, and search queries) across 11 languages and multilingual and code-mixing subsets [16]. Some works have also performed NER without labeled data or pretrained models. For example, Luo et al. propose a fully unsupervised NER model that only relies on pretrained word embeddings [17]. Another approach uses natural language prompts to guide LLMs to perform NER without fine-tuning or labeling data [18]. Another approach proposes a simple method that applies an LLM to encode queries and documents into dense vectors and then computes their cosine similarity [19].
2.3. Genealogical Tree
Genealogical data describe kinship relationships between people (father, mother, child, husband, wife, …), people’s vital events (births, marriages, deaths, …), and other biographical information (census, military service, school yearbooks, …). Genealogical data are heterogeneous because they come from various sources, including government records, church records, family Bibles, and DNA tests. They are incomplete due to factors such as lost records, inaccurate records, and privacy concerns [20].
Bezerianos et al. have compiled an exciting list of genealogical tasks, querying ordinary users, historians, and anthropologists. This task list was used to test several systems for storing and querying genealogy data. This comparison has not been described in this work.
One of the biggest challenges for managing genealogy data is matching the same individual in records from different sources. Price et al. describe a new approach to linking historical records using machine learning [21]. Their approach relies on millions of record links created by individual contributors to a large, public, wiki-style family tree. They argue that these data can be used to train machine learning algorithms to link historical records more accurately than traditional methods. They test their approach on the task of linking individuals across 1900, 1910, and 1920 US decennial censuses. They obtain an overall match rate of about 70 percent, with a false positive rate of about 12 percent. This combination of high match rate and accuracy is significantly improved compared to traditional record linkage methods.
The graph databases are particularly well-suited for storing and querying connected data. Connected data are data that are highly interconnected, such as social networks, product catalogs, and knowledge graphs. Graph databases can efficiently store and query connected data because they can directly represent the relationships between entities [22].
2.4. Map and Genealogical Visualizations
Interactive map-based systems have emerged as a powerful tool for enhancing the visitor experience at cultural sites and heritage locations. Incorporating location-aware mobile devices, Van Aart et al. leverage GPS positioning to provide users with multi-faceted access to extensive general and cultural heritage repositories, demonstrating the synergistic potential of Linked Open Data sources in enriching location-based services [23]. Matuszka et al. have focused on utilizing interactive maps and augmented reality (AR) technologies to provide immersive experiences within cultural places [8]. Web portals such as the Hollywood Cemetery’s interactive map (https://www.hollywoodcemetery.org/visit/virtual-tours (accessed on 18 February 2024)) and mobile applications like aldilapp.it have exemplified the provision of interactive cemetery maps, contributing to the evolving landscape of location-based cultural exploration. Previous work [2] introduces a Web application designed for intelligent navigation within cemeteries, leveraging a knowledge graph to facilitate detailed information retrieval, interactive mapping, and customized tour creation, thereby advancing the promotion of cemeteries as cultural sites for tourists. These map-based systems effectively embody the principles of the visual information-seeking mantra ‘overview first, zoom and filter, then details on demand’ [24], providing users with a structured and intuitive approach to exploring cultural sites. Within the design space stemming from these principles, ample opportunity exists to enhance the map-based overview with auxiliary data visualizations like genealogical trees, providing a deeper contextual layer for visitors to explore.
The remainder of this section delves into the state of the art regarding genealogical tree visualization techniques, offering insights into the evolution of methods for representing and navigating familial relationships. Herman et al. discuss classical genealogical tree structures as part of a broader examination of graph visualization and navigation techniques in information visualization [25], while McGuffin et al. provide a survey with a distinct focus on how classical genealogical tree structures are defined within information visualization, addressing the unique requirements of this domain [26]. Tuttle et al. focus on space-efficient layout algorithms, introducing the so-called pedigree charts [27], while Kim et al. [28] and Mukaliyev [29] attempt to encode more information in the visualization, such as the temporal extents of people’s lives. Bezerianos et al. provide a task-oriented framework to address the visualization of large families, the quilts layout, and a matrix representation of family links [30]. Zappala introduces fan charts, which have proven to be a perfect layout to spot holes in the hierarchy or to input genealogy data [31]. The works mentioned above collectively underscore an approach that tailors visualization techniques to the specific requirements of the task at hand.
3. The Jewish Cemetery in Pisa
There are numerous Jewish cemeteries in Italy, but few are in use or can be visited while most are in precarious conditions. The cemetery of Pisa is in use and can be visited; for example, the Jewish cemetery of Asti (https://www.visitjewishitaly.it (accessed on 18 February 2024)) is in use, but it has been a burial place since 1810, which is more recent than that of Pisa or the Jewish Cemetery of Finale Emilia (https://bbcc.regione.emilia-romagna.it (accessed on 18 February 2024)) in which the oldest headstone dates back to 1585; however, in this place there are only 57 intact headstones, a much smaller number of legible gravestones than the Pisa cemetery.
The tombs in the cemetery represent four centuries of history of the Jewish community of Pisa. From the 17th to the 18th centuries, the people buried were mainly Jews from Spain and Portugal as descendants of the Jews expelled from these nations since 1492. Since the 18th century, the cemetery has been characterized as Italian, as many were Jews who had come to Pisa from Rome, Ancona, and Florence. In the most recent part of the cemetery, the burials are of Jews who came to Pisa from Central Eastern Europe, in the 19th and 20th centuries, for study or tourism reasons. In the cemetery, there is a section relating to the burials of the Jewish soldiers who fell during the First World War and, above all, of the Jews who were victims of fascist violence, German massacres, and Nazi–fascist persecution.
From the artistic point of view, the Jewish cemetery of Pisa presents an extraordinary range of testimonies, from the trapezoidal parallelepiped-shaped mounds of the Jewish tradition and the rounded steles of the 17th and 18th centuries (Iberian tradition) to the Empire-style monuments of the early 19th century, and from the Gothic tabernacles of the mid-nineteenth century to the Art Nouveau and Umbertino styles of the late nineteenth and early twentieth centuries; most of the tombs have a simple structure, a stone lab with an engraved name, surname, date of birth, and death. The different geographical origins of the buried people demonstrate how varied the Jewish presence in Pisa has been over the centuries.
Visiting the Jewish cemetery of Pisa allows people to journey through history from the 17th century to nowadays, from a historical–artistic point of view, thanks to the tombstones and epigraphs, which are windows to the past.
A tour of the cemetery makes it possible to be aware of the social, cultural, and historical dynamics of the society to which they belong. Still, nowadays, it is not easy without a guide who can lead tourists to discover the place.
4. The Proposed Approach
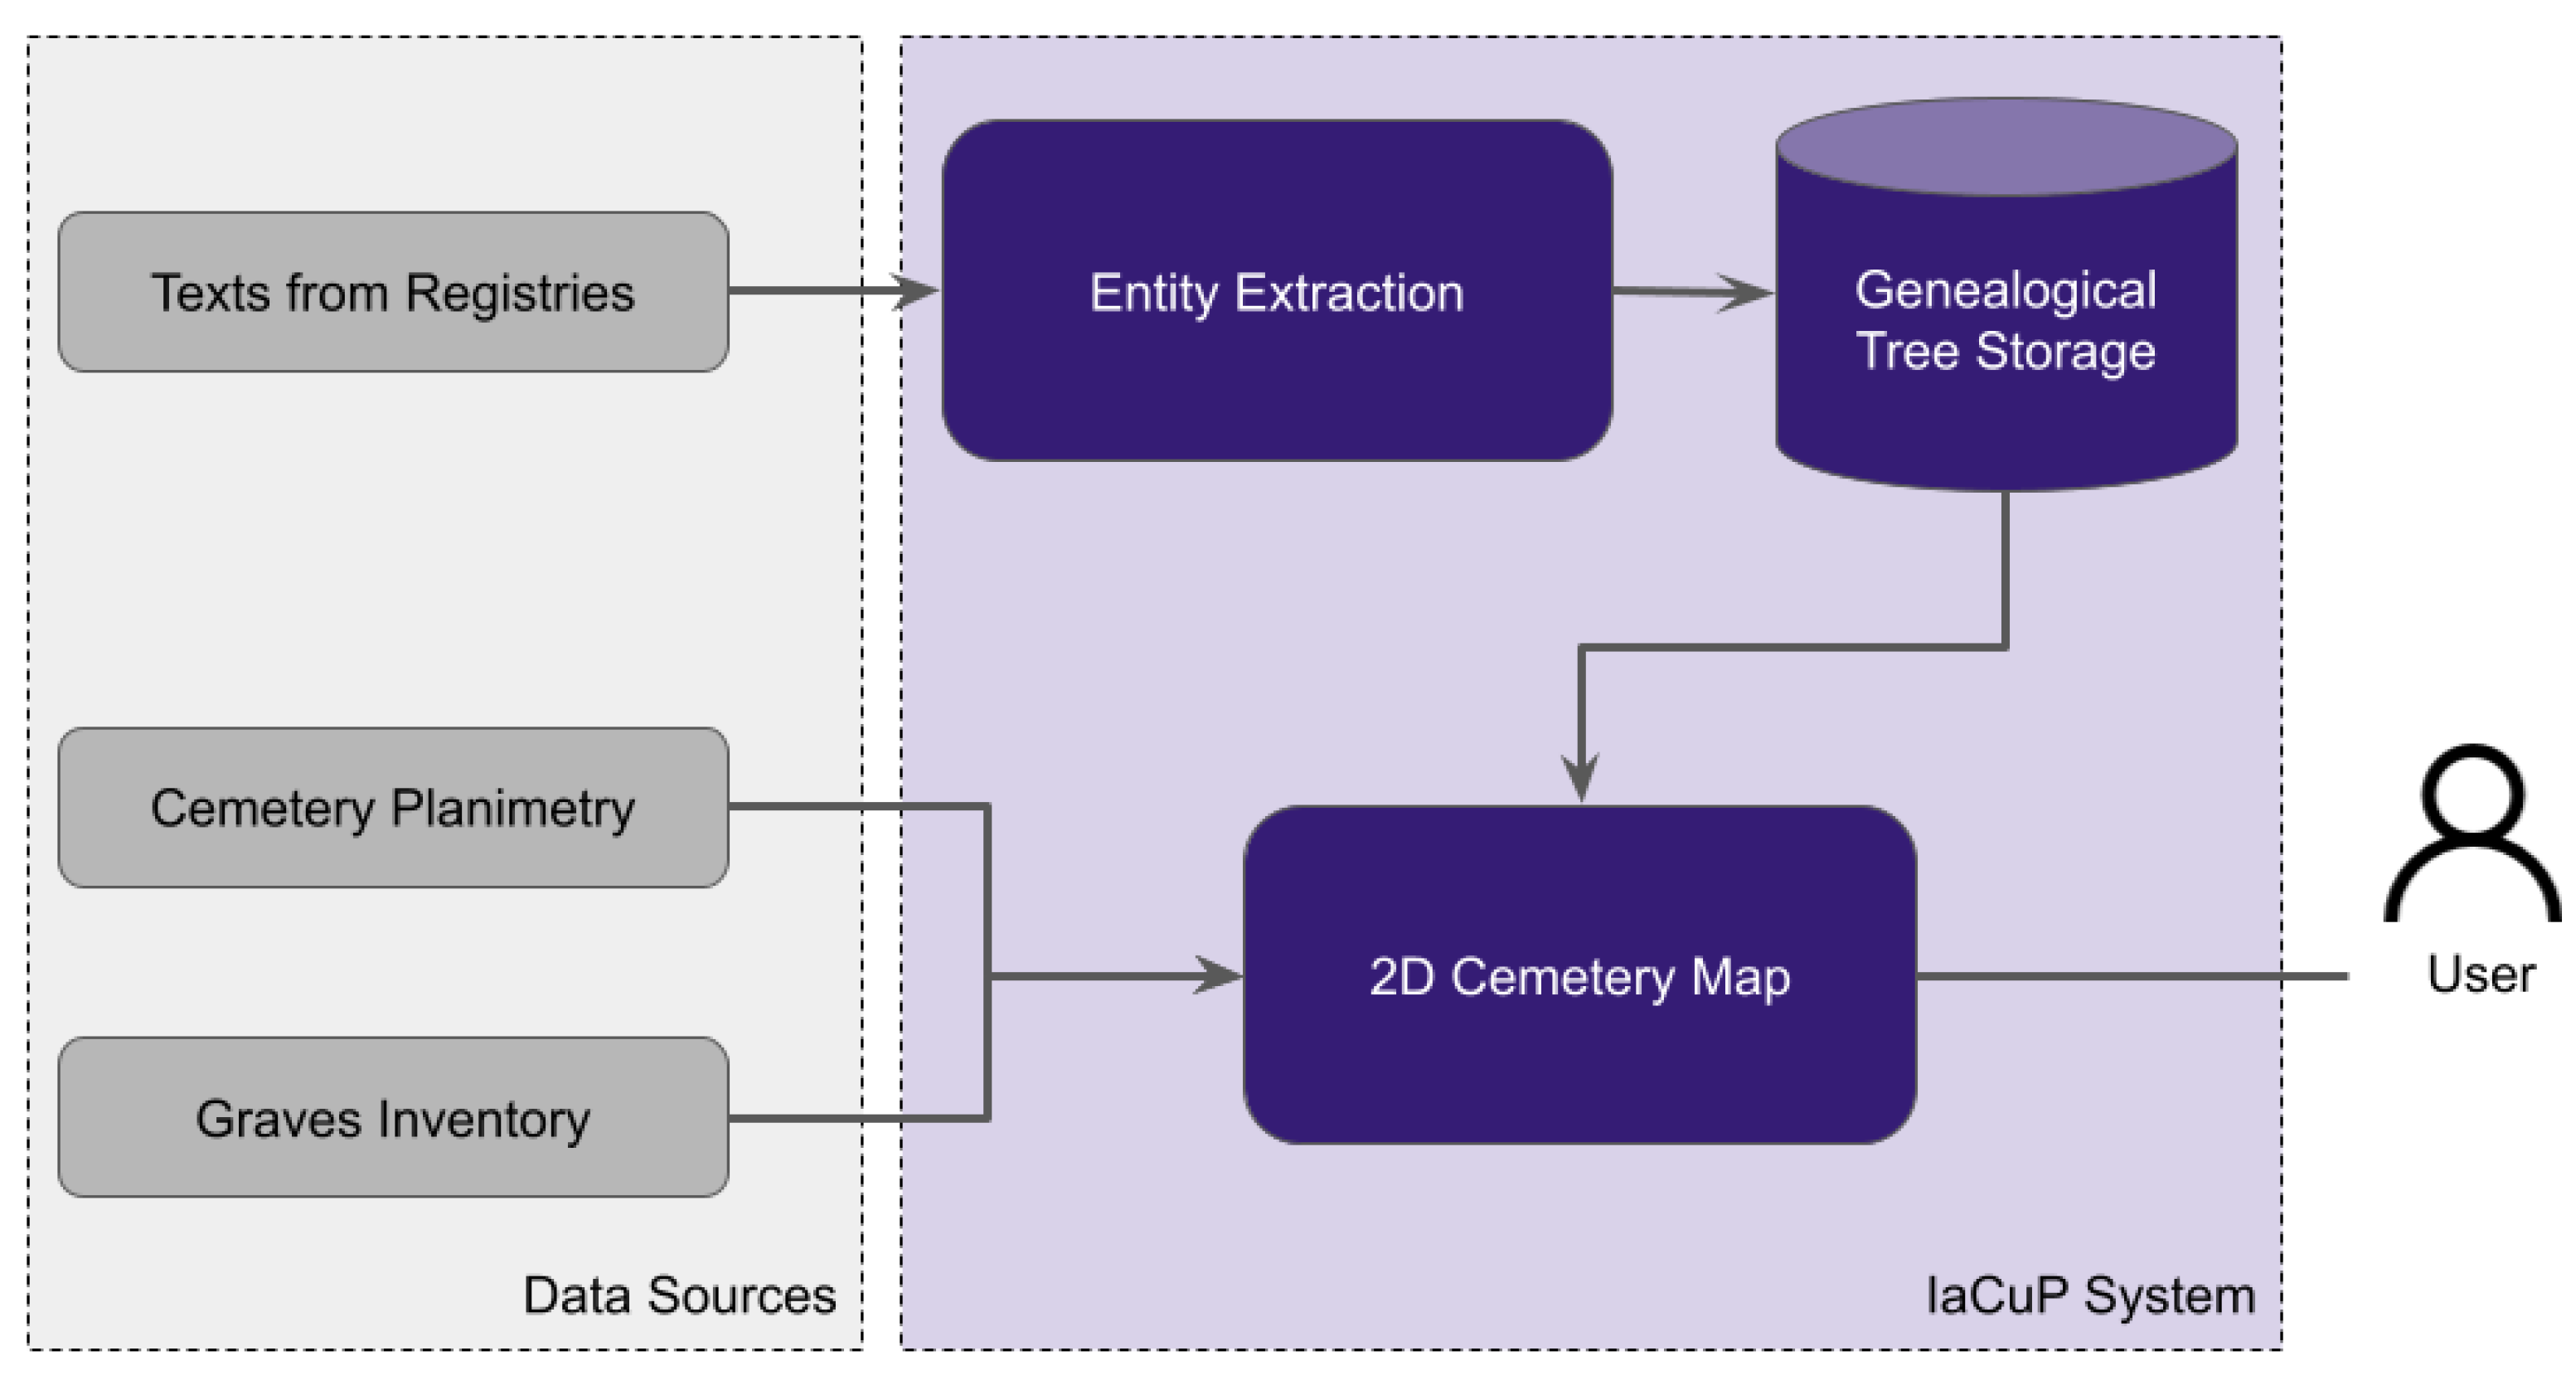
The implemented system comprises three main components: the Entity Extraction module, Data Storage, and the 2D Cemetery Map. Figure 1 shows the architecture of the implemented system, named the IaCuP System.
The IaCup System receives three data sources as input:
- Texts from registries include the transcription of the relevant documents contained in the archive. In the specific use case described in this paper, texts contain the transcription of the Registry of Births and Deaths of the Historical Archive of the Jewish Community in Pisa;
- The cemetery planimetry includes the graphical representation of the map used as a background for the cemetery. It contains all the graves;
- The graves inventory contains the mapping between each grave and the person buried.
4.1. The Registry of Births and Deaths
The Historical Archive of the Jewish Community of Pisa contains various documents, including the Registry of Births and Deaths, which collected approximately 350 records related to the members of the Pisan Jewish community, their date of birth, date of death, the city of birth, and their burial place (Pisa, Livorno, Lucca, or other places). The birth register started on 12 October 1749, and the register of the dead started on 21 October 1749.
Each record contains the date of birth or death, indicated according to the Jewish and Gregorian systems (for a baby born on March 10th, the Registry also shows day of Rosh Chodesh Cheshvan 5510). The father’s name is indicated in the Registry of Births for each person born. Some of the more frequent surnames are Levi, Cardoso, Supino, and Procaccia, but there are also many other surnames in the registers.
4.2. The Cemetery Planimetry and the Graves Inventory
The Jewish Cemetery of Pisa has a surface area of approximately 5000 square meters (about 53,819.55 sq feet). There are approximately 990 recorded burials, and it is located close to the medieval walls of Pisa, near the monumental Christian cemetery near the famous Tower of Pisa and Piazza dei Miracoli; in fact, the perimeter wall to the right of the entrance borders the baptistery of the Pisa Cathedral, and the east side borders the Camposanto Monumentale of Pisa’s center, in a park with other important monuments. The plan is no longer regular due to the creation of an important road and related square to the left of the cemetery entrance; because of this square, many ancient tombstones are moved inside the new perimeter wall.
The section with the older tombs is located to the left of the entrance and occupies approximately about a quarter of the entire area. In contrast, the area with the most recent tombs is located in front of the entrance, towards the Monumental Cemetery.
The application presented in this paper is applied to the section of the tombs located on the left side of the entrance, dating back to the 17th, 18th, and 19th centuries.
A graves inventory has been recovered from an old project on the Jewish Cemetery of Pisa. The graves inventory contains about 500 records with names, surnames, birth and death dates, and epigraphs written in Hebrew or Hebrew and Italian. This inventory contains the mapping between the records and the graves on the planimetry. In addition, it is used to establish the connection between the graves and the historical registry of births and deaths.
5. Entity Extraction
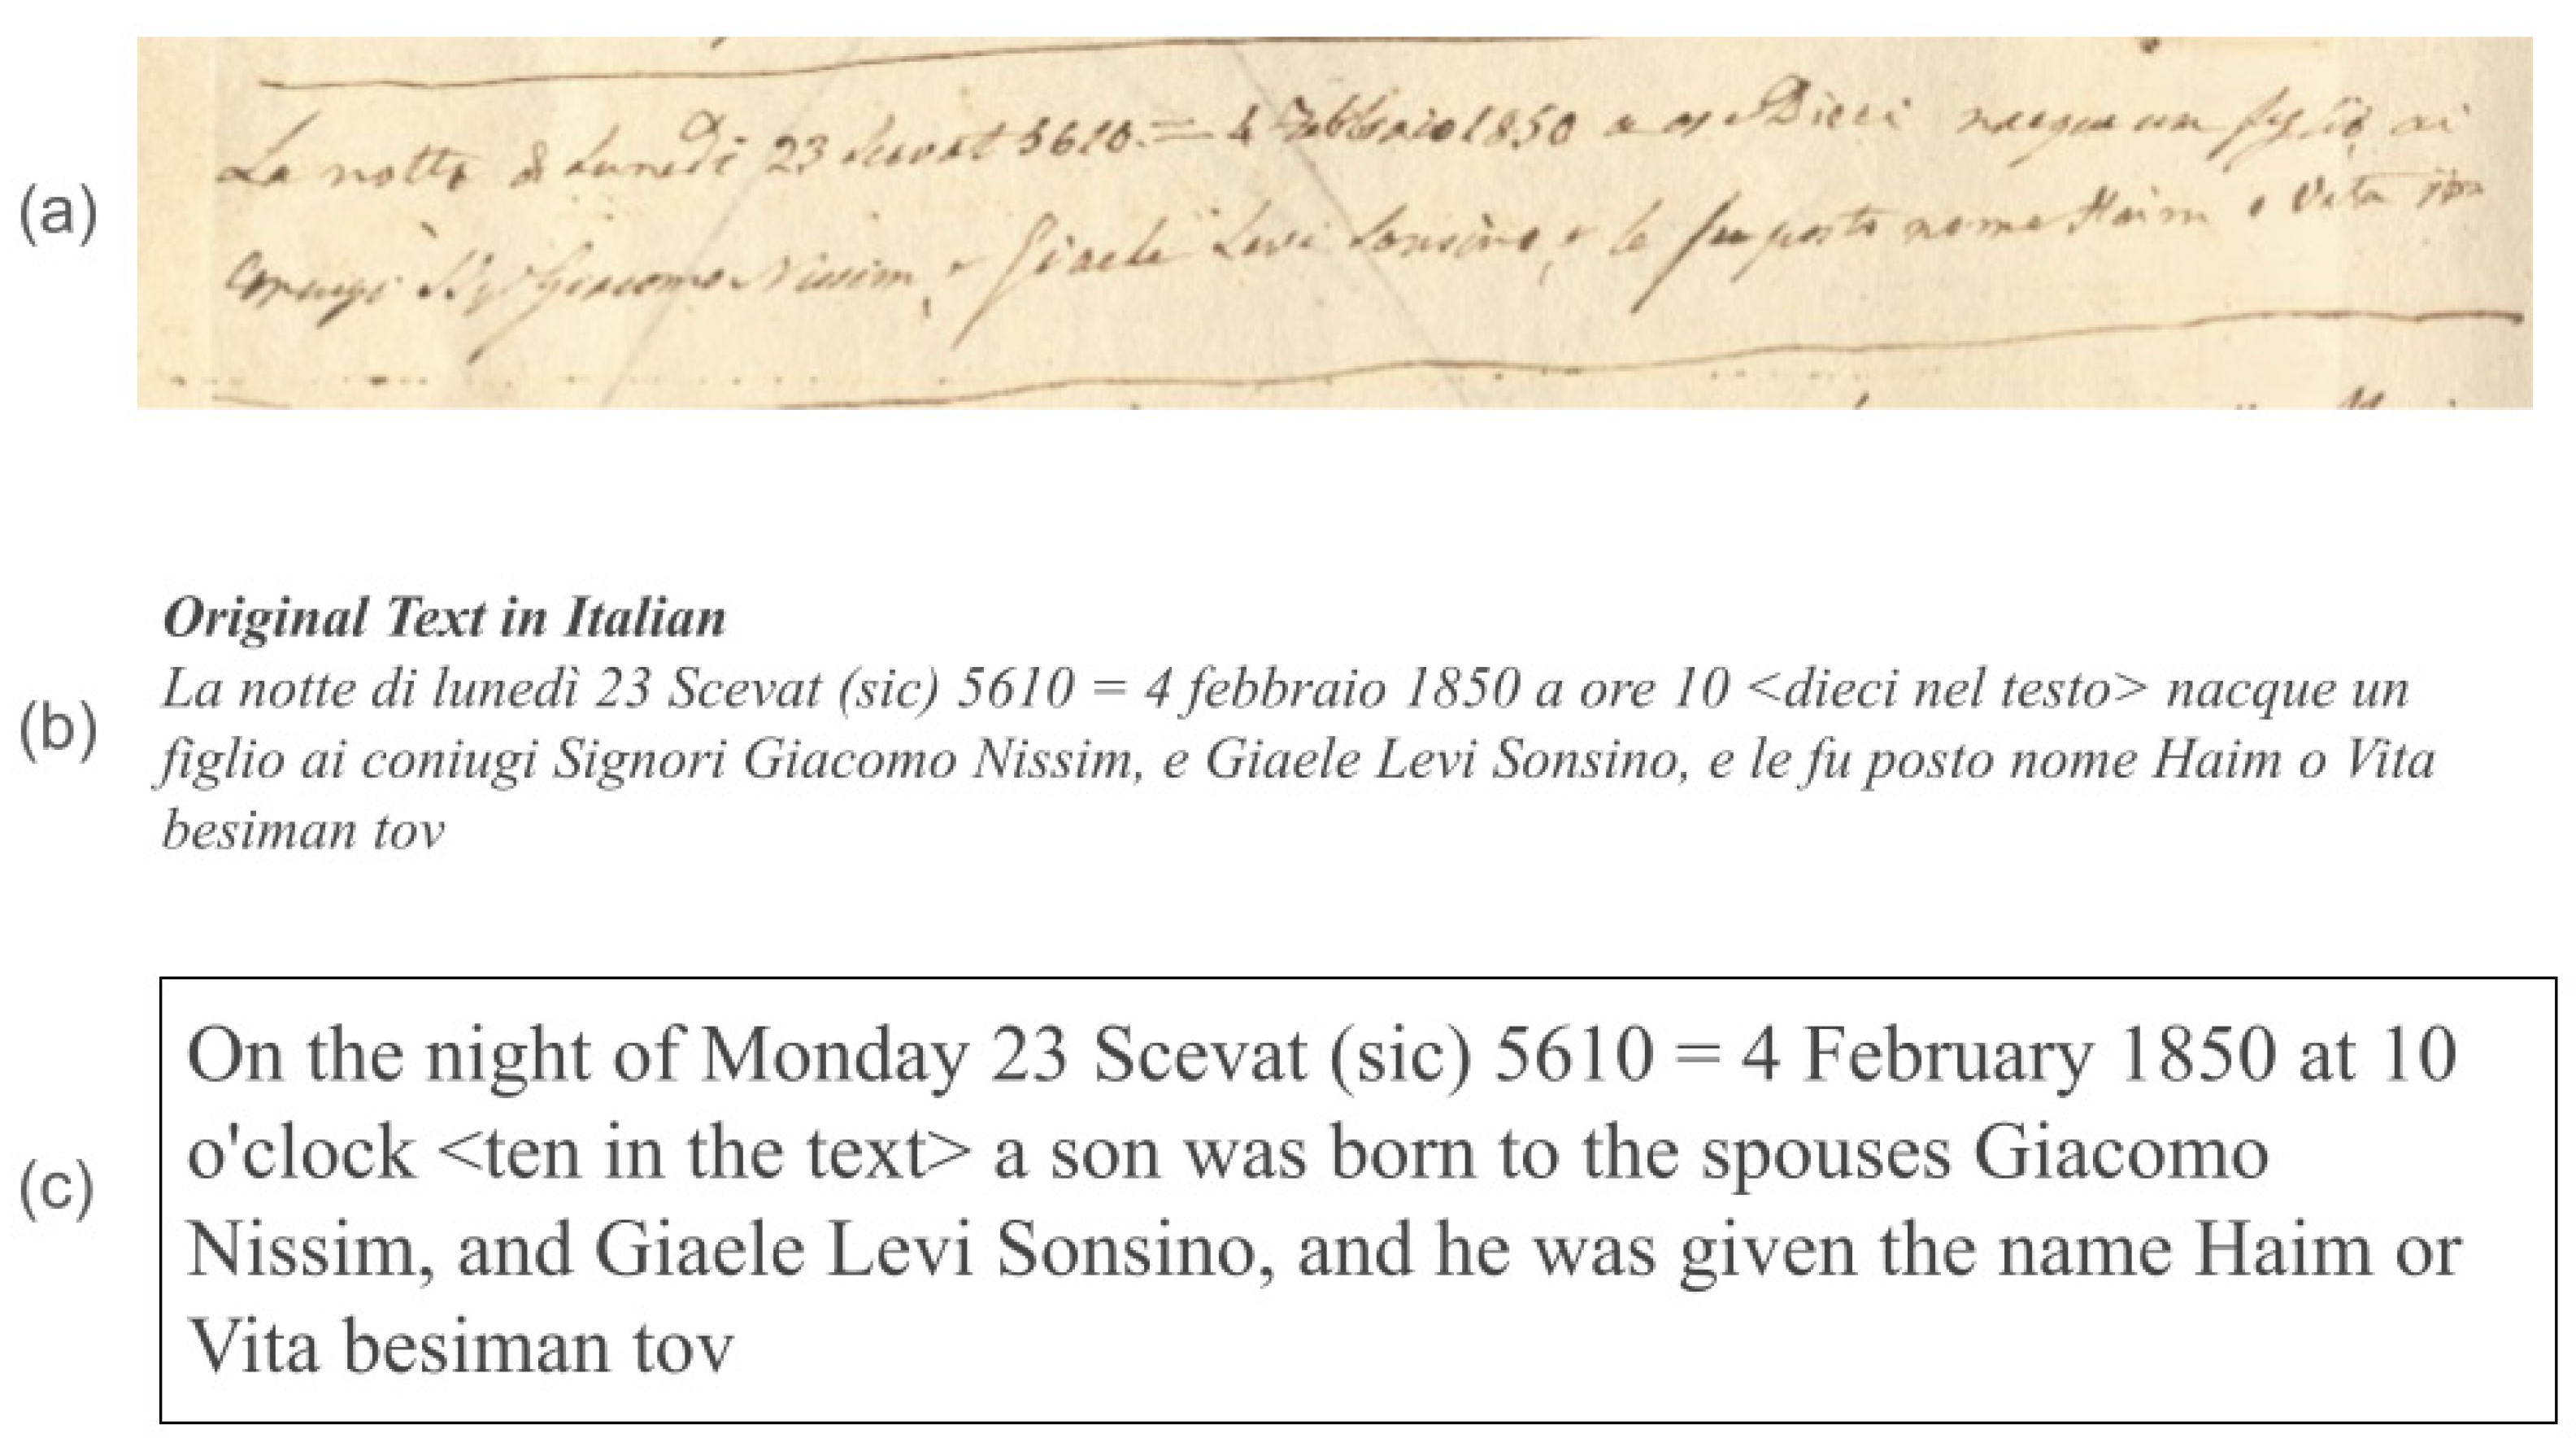
Entities from the Registry of Births and Deaths were extracted. The original document is written in Italian, and all the records have more or less the same structure. Figure 2 shows a sample record in its original version (the manuscript at the top of the figure), the Italian transcription (in the middle), and the English translation (at the bottom). The transcription process from handwritten text to its digital textual representation was described in previous work [3]. In practice, transcription was conducted by domain experts without the usage of any specific tool for transcription. Instead, the domain experts used a traditional textual editor. This paper assumes that the text is already available in its digitized version. The figure shows the text translated into English for convenience, although NER was applied to the original Italian language.
Previous work used an approach that combined rule-based and manual correction by a domain expert to extract named entities from a registry of births [3]. This combination of rule-based and manual correction reached an accuracy of about 0.99. The main drawback of this approach was the presence of a human to signal and modify rules in case of detected errors. This human presence made the algorithm particularly slow, making it time- and resource-consuming. This paper applies an LLM-based approach to perform the same task without human intervention. Compared to the rule-based approach, the LLM-based approach is generated via machines and does not rely on human correction. The objective is to see whether LLMs can still generate acceptable results while reducing time and resources.
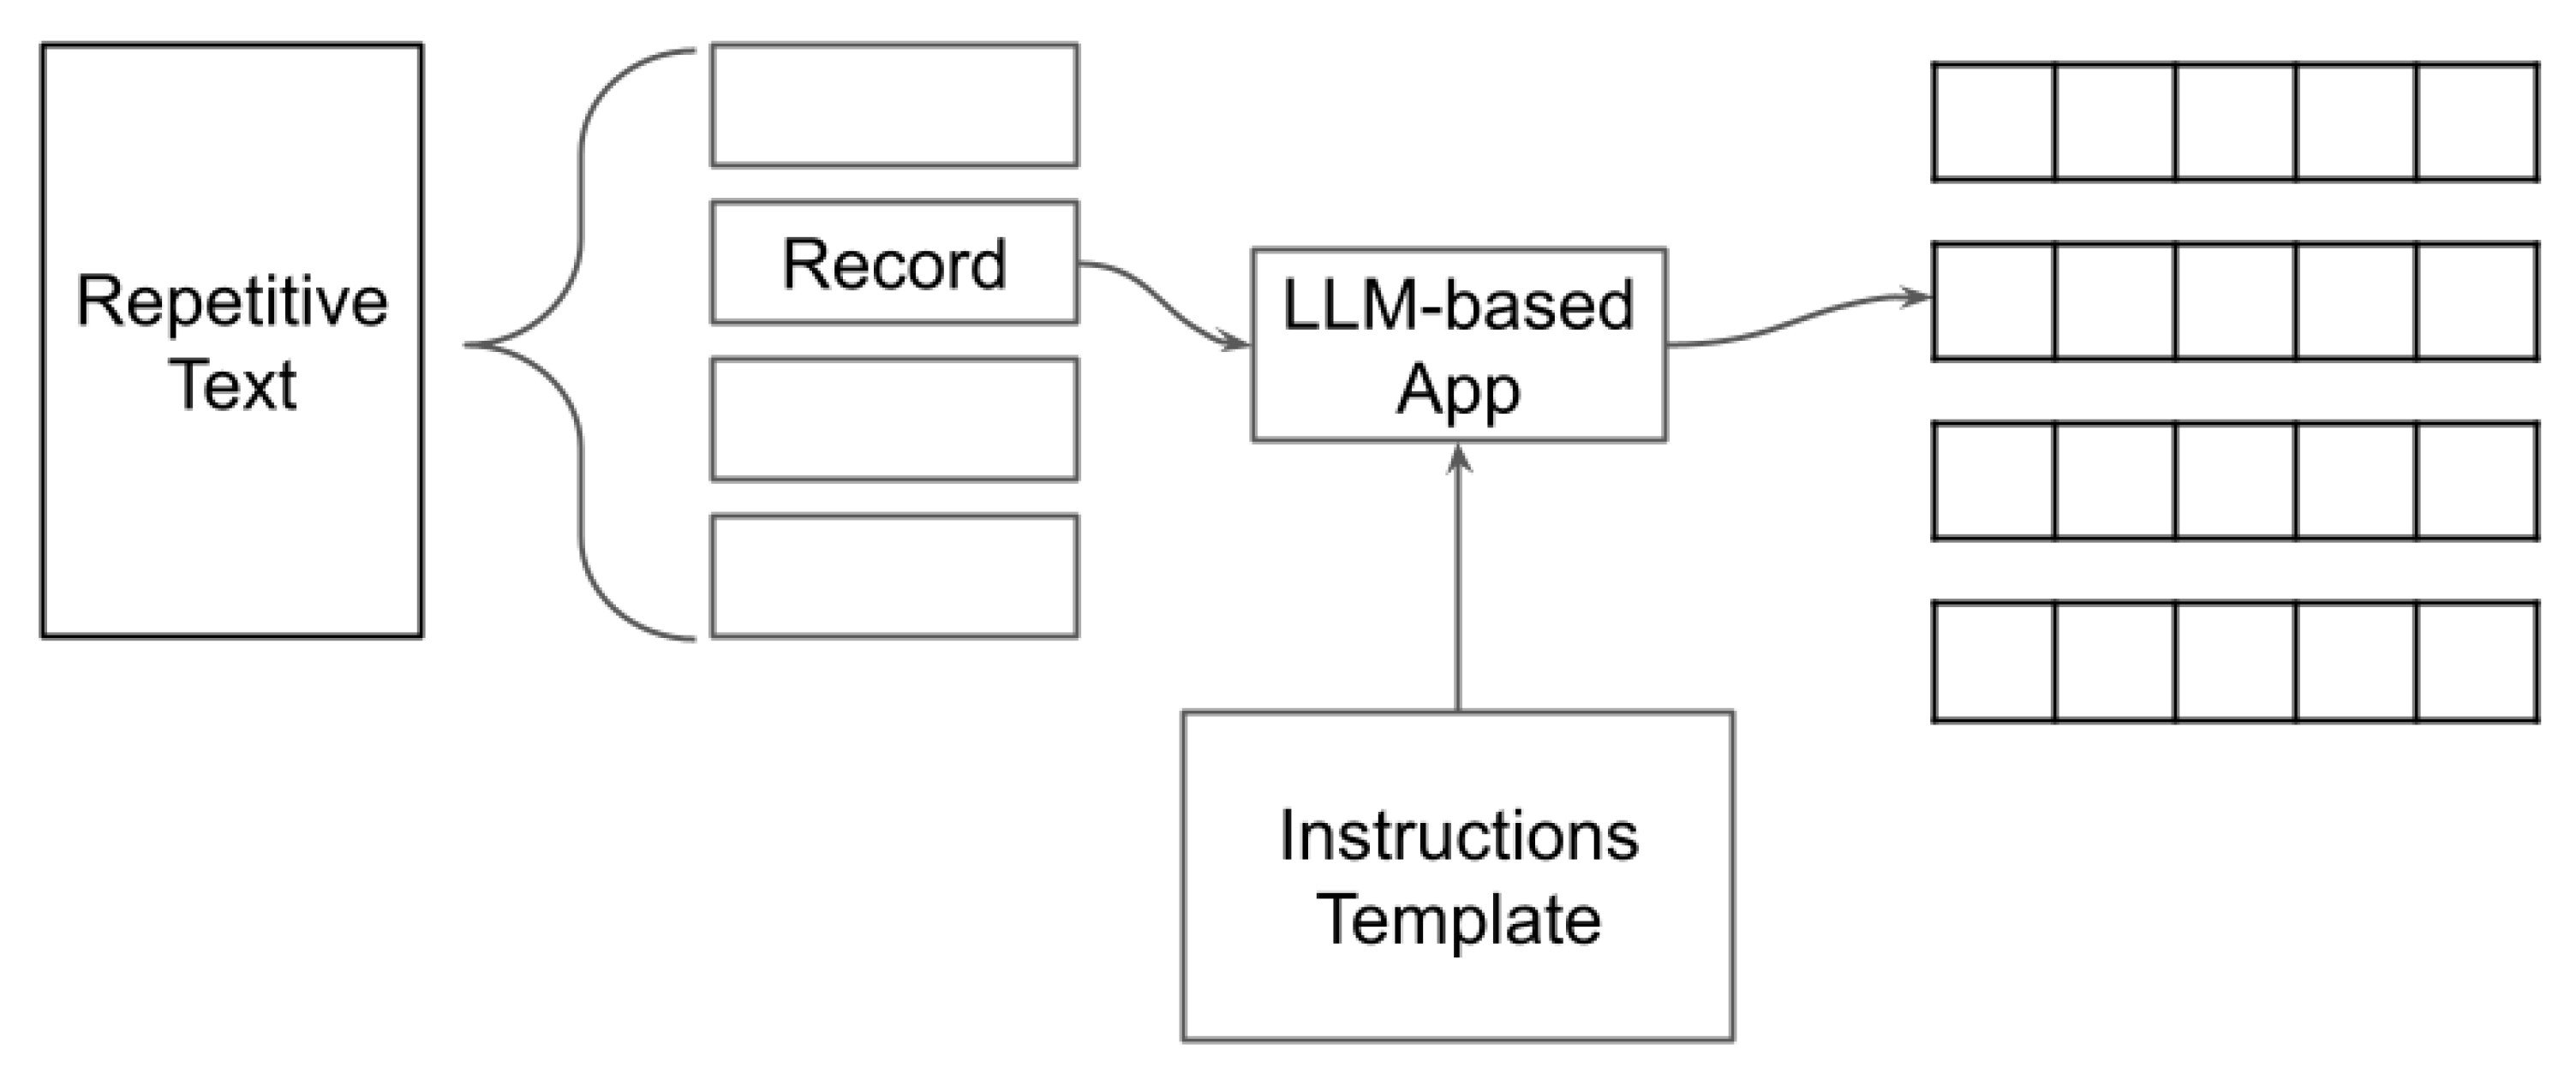
Figure 3 illustrates the implemented system architecture for the task. The system starts with a repetitive text, i.e., a text with a repetitive form. A repetitive text contains records with the same structure. Each record contains information about a single birth, as shown in Figure 2. First, the system splits the repetitive text into single records. Next, each record is provided as input to an LLM-based app and an instructions template containing text describing the task to perform. As an output, the LLM-based app generates data in a tabular format.
To implement the LLM-based app, the system uses LangChain (https://www.langchain.com/ (accessed on 18 February 2024)) and OpenAI GPT-3.5-turbo as an LLM. The LLM is instructed to extract the following information from each record: father’s name, mother’s name, child’s name, date of birth, and child’s sex. In addition, the LLM is asked to format the output using the Comma Separated Value (CSV) structure. Table 1 illustrates an example of the desired output.
The LLM is provided with the following instruction template:
- For each line extract:
- - extract child name, father name, mother name, gender, date of birth and format as CSV
- Instructions:
- - If you find a son, set sex to M
- - If you find a daughter, sex is F
- - Do not include besiman tov in the child’s name
- - at the end add a new line
- Follow this example:
- Input:
- <Nel giorno di lunedì 3 Ijar (sic) 5570 relativo alli 10 maggio 1810 nacque un bambino figlio dei coniugi Signore Isac Vita Soria, e Grazia Prato nominato Raffaello besiman tov>
- Output:
- Raffaello, Isac Vita Soria, Grazia Prato, M,10/05/1810
- Answer by formatting the output in CSV format.
To test the system’s performance, it has been prompted with a preliminary corpus of 20 records from the Registry of Births and Deaths. While the birth date, sex, and the son/daughter name always appear with the same structure, the father and the mother structure changes, as shown in Table 2. The father and the mother’s full name can be followed by their father’s full name (e.g., Aron di Nissim Soria and Ester del fu Josef Montefiore) or without it (e.g., Angelo Merisi and Anna Usigli). Table 2 also shows the distribution of the number of records tested across the various cases. The total number of records is 40 (20 + 20) because each contains one father and one mother. The dataset was balanced with respect to the father’s possible cases.
A symbolic number of 20 records was used to understand when the model performs well and when it fails. Therefore, an upstream mechanism could subsequently be implemented to select only the cases in which the model performs well and pass them on to the model itself. Another procedure should be adopted for other cases, or the model could be extended, for example, with another set of input instructions.
To evaluate the model’s performance, the following metrics have been defined: column error rate and format error rate. Column error rate (CER) is the ratio between the number of records with at least one error across the different CSV columns and the total number of records. For example, if the model extracts all the information correctly, except for the father’s name, for a given record, this record contributes to an increase in the CER rate. In the described scenario, the CER is 15%. The model identified all the dates and genders correctly. Still, it fails in some cases to recognize del fu, an Italian expression indicating the dead father’s name (the grandfather’s child).
Format error rate (FER) is the ratio between the number of records with at least a formatting error and the total number of records. For example, if the model extracts all the records correctly but does not respect the CSV formatting style, this record contributes to an increase in the FER rate. In the described scenario, the FER is 10%.
6. Genealogical Tree
Table 3 shows a set of named entities extracted from the Registry of Births containing members of the Supino family. The first step to take is transform this list of NE in-person records with explicit relationships such as “husband”, “wife”, and “child” to build Genealogical Tree.
To accomplish that, two tables are created: the Table 4 with the following fields: Id Person, Last, First, Sex, Father, Mother, Id Family of Origin, Birth Date, and Birth Place, and the Table 5 with the following fields: Id Family, Wedding Date, Wedding Place, Id Husband, Husband, Id Wife, and Wife (see Table 4 and Table 5).
The union table is incomplete. For the Supino family, the wife’s information is completely missing, this is because the mothers’ names were not always reported in the birth register. Of course, this information could be retrieved if one considers the marriage registry.
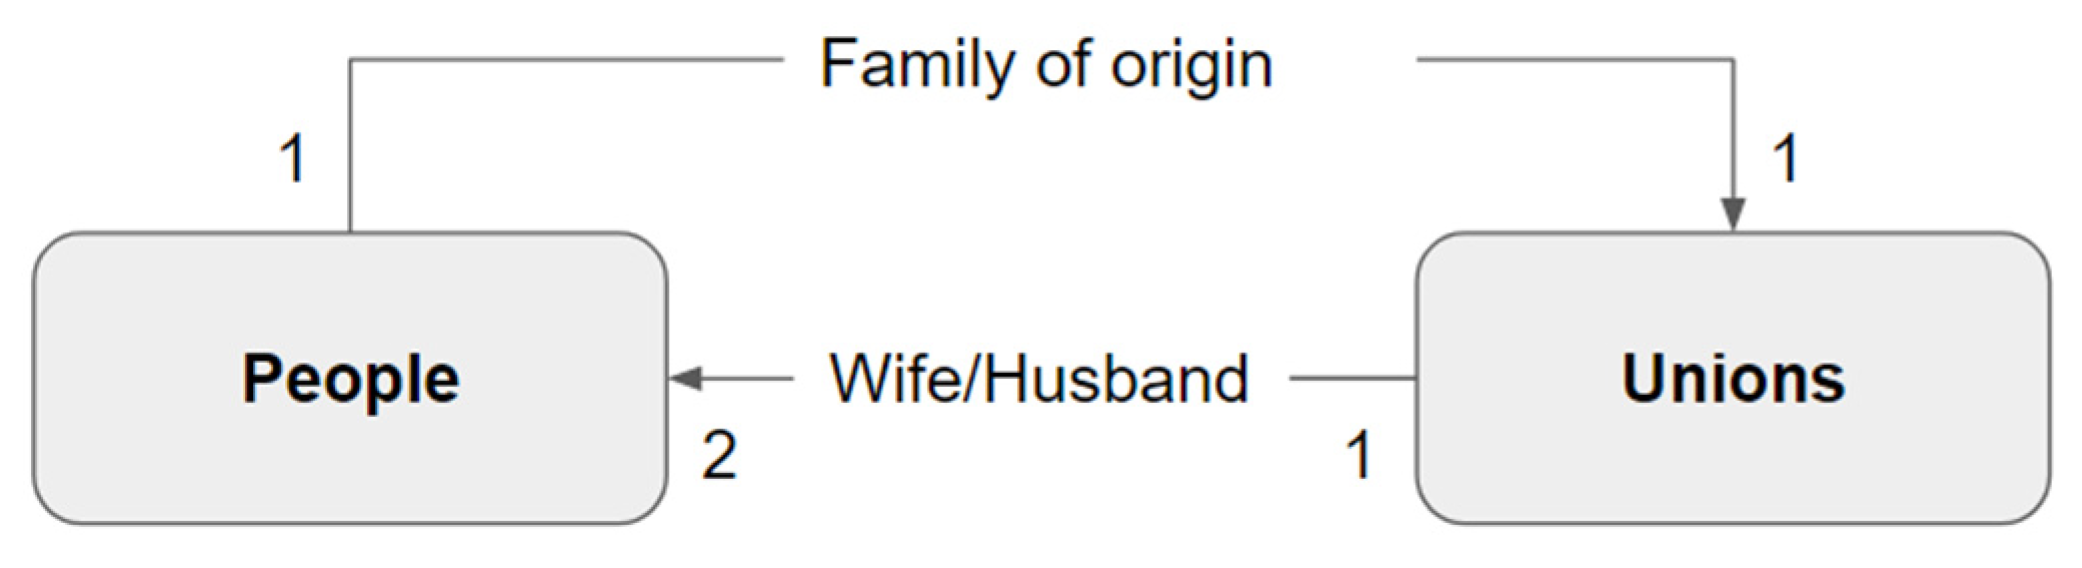
The two tables are connected through the use of foreign keys: “Id Family of Origin” for the People table and “Id Husband/Wife” for the Unions table. Figure 4 shows the connections between the two tables. Every person will have a Family of Origin and every union will be compounded by two persons: the wife and the husband.
The two tables can be seen as two SQL Tables and as such can be used to populate an SQL DB, but what is actually important is that now, thanks to these two tables, all the information inside a graph database can be imported.
Graph databases store data as nodes and relationships between nodes. This makes it easy to model the complex relationships between people, places, and events in a genealogy. Graph databases do not require a predefined schema, which makes them ideal for modeling complex and evolving data like genealogical records. Graph databases allow you to query relationships directly, which makes it easy to find complex patterns in the data.
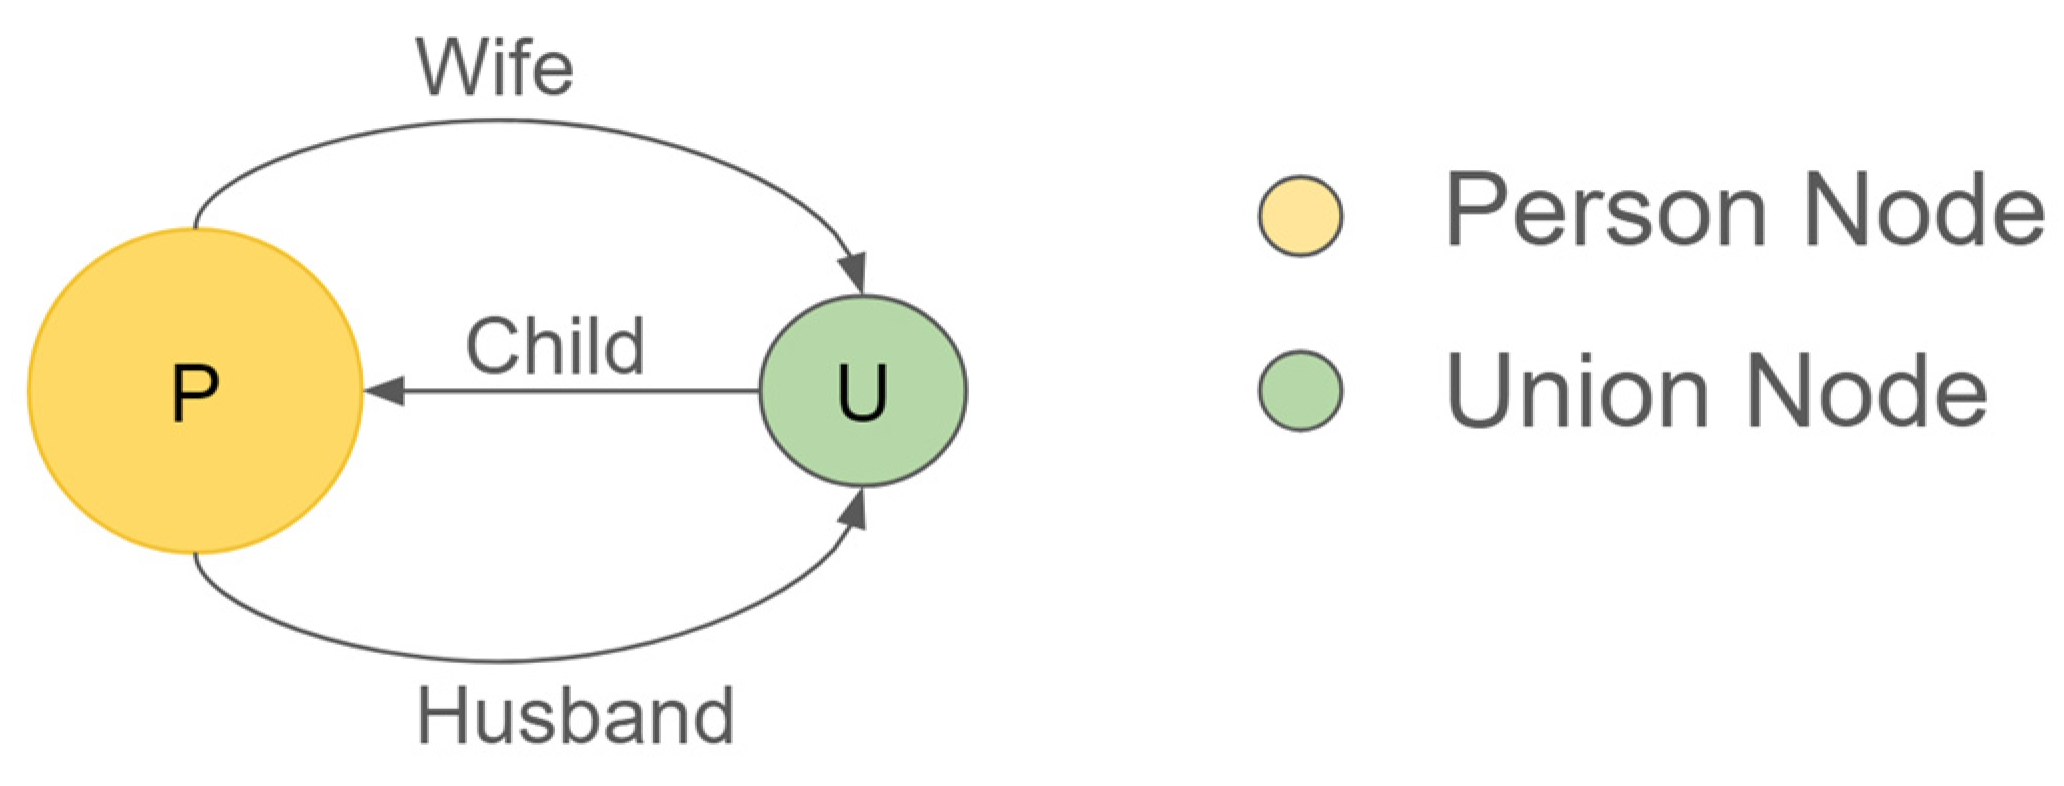
To populate the Graph DB, a simple data model will be used that can later evolve to meet new needs. In this model, there are two kinds of nodes, Person and Union, connected with three relationships (Figure 5). Two people can be connected to a union node thanks to two relationships, “Wife” and “Husband”. From a union node, there are many “child” with Person node relationships.
The text below shows some code fragments written in Cypher Language (Cypher language is a declarative language to interact with the Graph database Neo4J https://neo4j.com/developer/cypher/intro-cypher/ (accessed on 18 February 2024), which is very reminiscent of the SQL language, used to import the data present in the People and Unions tables, which for this purpose have been saved in two CSV files.
- // LOAD ALL PERSON NODEs
- LOAD CSV WITH HEADERS FROM “file:///people.csv” AS r
- CREATE (p:Person {id:r.id, last:r.last, firts:r.first, sex:r.sex, father:r.father, mother:r.mother, birthDate:date(r.birthDate), birthPlace:r.birthPlace, idFamOrigin: r.idFamOrigin})
- // LOAD ALL UNION NODEs
- LOAD CSV WITH HEADERS FROM “file:///unions.csv” AS r
- CREATE (u:Union {id: r.id, wDate: r.wDate, wPlace:r.wPlace,
- idHusband:r.idHusband, husband: r.husband,
- idWife: r.idWife, wife: r.wife })
- // CREATE CHILD EDGEs
- MATCH (p:Person), (u:Union)
- WHERE p.idFamOrigine = u.id
- CREATE (p)<-[:CHILD]-(u)
- // CREATE HUSBAND EDGEs
- MATCH (u:Union), (p:Person)
- WHERE u.idHusband = p.id
- CREATE (u)<-[:HUSBAND]-(p)
- // CREATE WIFE EDGEs
- MATCH (u:Union), (p:Person)
- WHERE u.idWife = p.id
- CREATE (u)<-[:WIFE]-(p)
For the Graph DB, the Neo4j (https://neo4j.com/ (accessed on 18 February 2024)) tool was used. Once all the nodes and relationships have been created, to extract, for example, a person’s family tree, simply provide the following query in Cypher:
- // QUERY ALL PATHS STARTING FROM A PERSON NODE IDENTIFIED FROM LAST & FIRST NAME
- MATCH (root:Person {last:$last})
- WHERE root.first CONTAINS $first
- MATCH paths=(root)-[*]-(n)
- WHERE (n:Person OR n:Union)
- RETURN paths
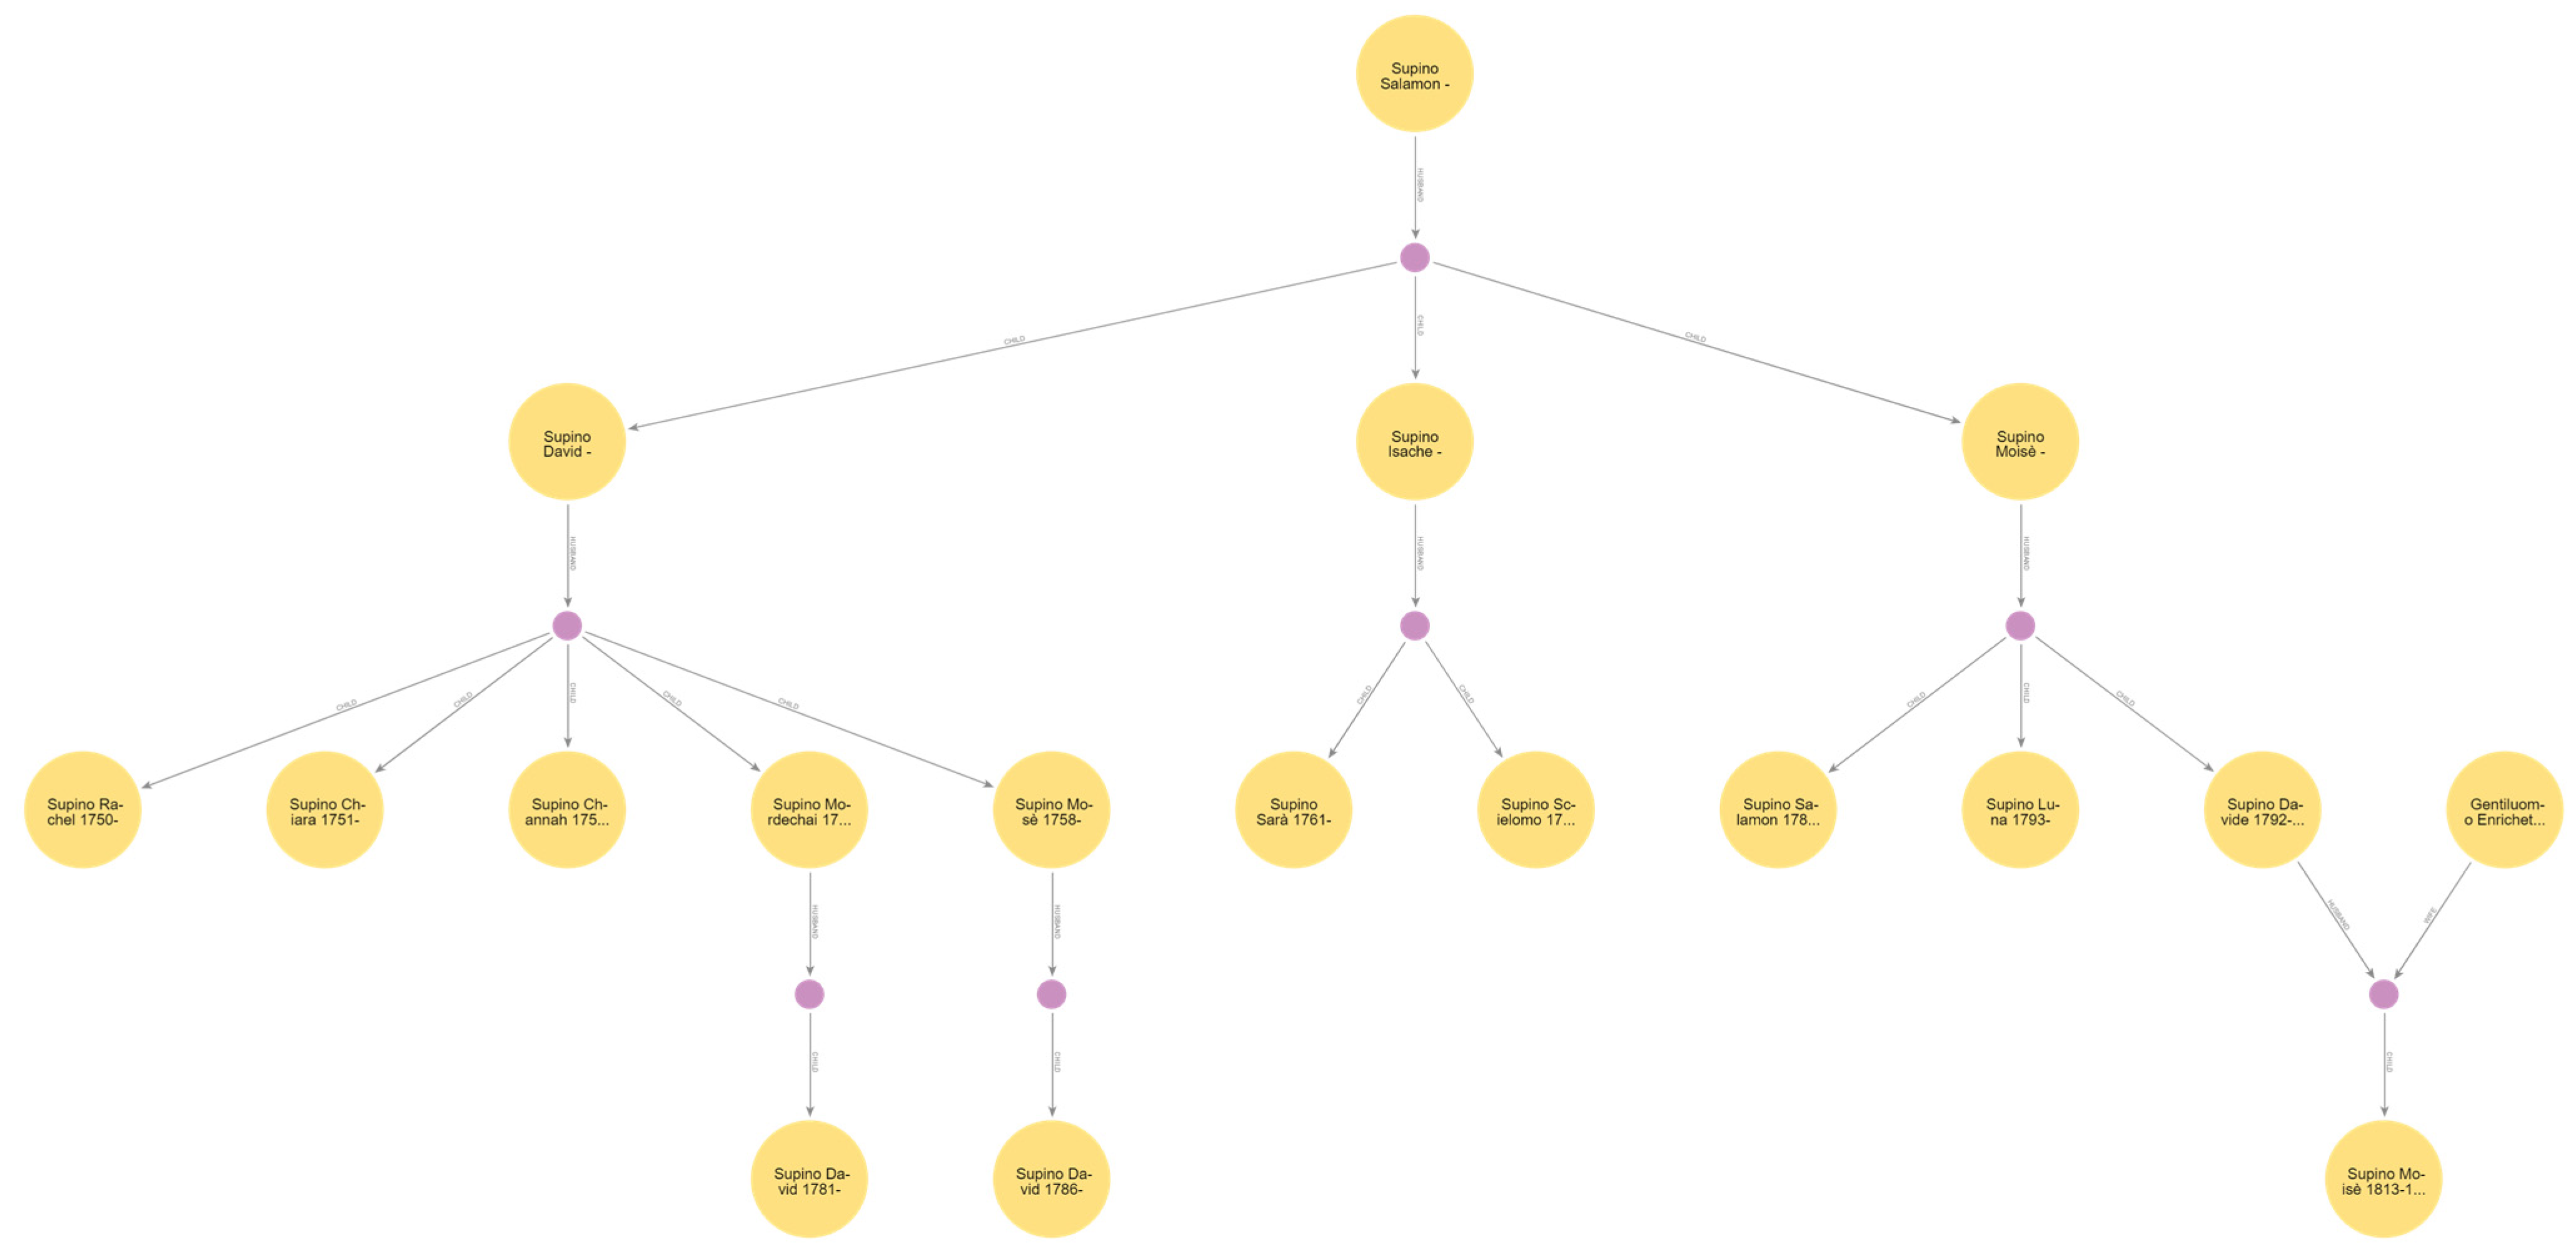
To have a first rendering of the results of the previous query, there are two options. The first is to use the Neo4j Bloom tool (https://neo4j.com/product/bloom/ (accessed on 18 February 2024)) that comes with the Neo4j package. Figure 6 shows how the Supino family tree can be rendered with Neo4j Bloom.
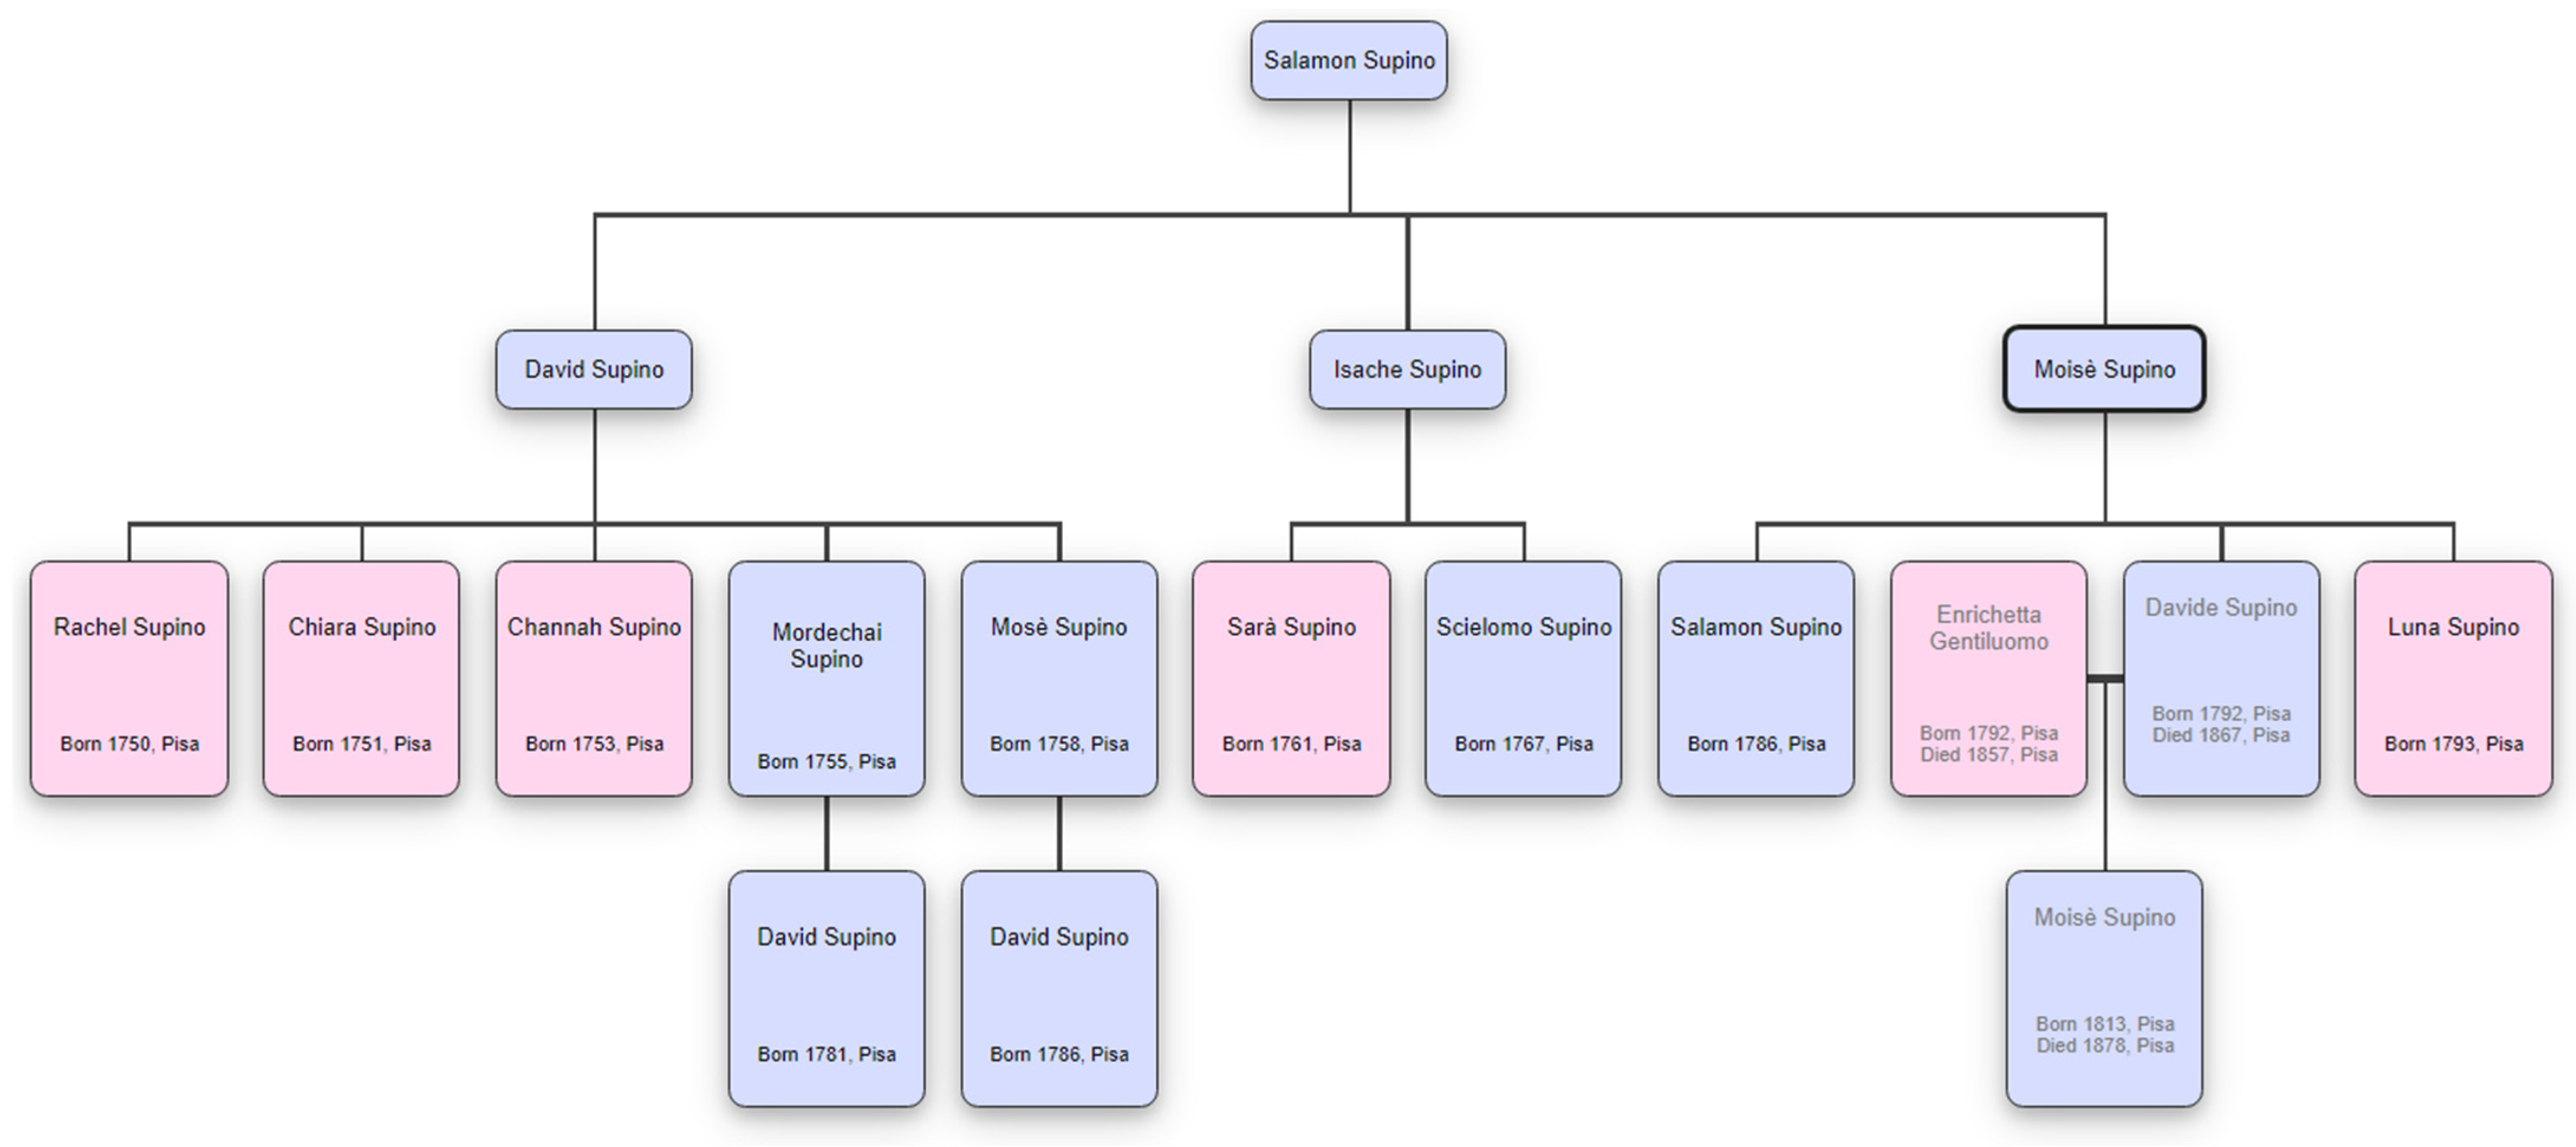
Otherwise, to have more refined results by using dedicated tools, it is possible to convert the query result into Gedcom (https://www.gedcom.org/ (accessed on 18 February 2024)) format. Gedcom is the de facto standard for genealogy data. The following Gedcom code can be provided to a service like Family Echo (https://www.familyecho.com/ (accessed on 18 February 2024)) to obtain renderings of the Supino family tree as shown in Figure 7:
- 0 @ISPNRCH17500626FG702IT@ INDI
- 1 NAME Rachel /Supino/
- 2 GIVN Rachel
- 2 SURN Supino
- 1 SEX F
- 1 BIRT
- 2 DATE 1750-06-26
- 2 PLAC Pisa
- 1 FAMC @FSPN?2XXXXXXXXXG702IT@
- …
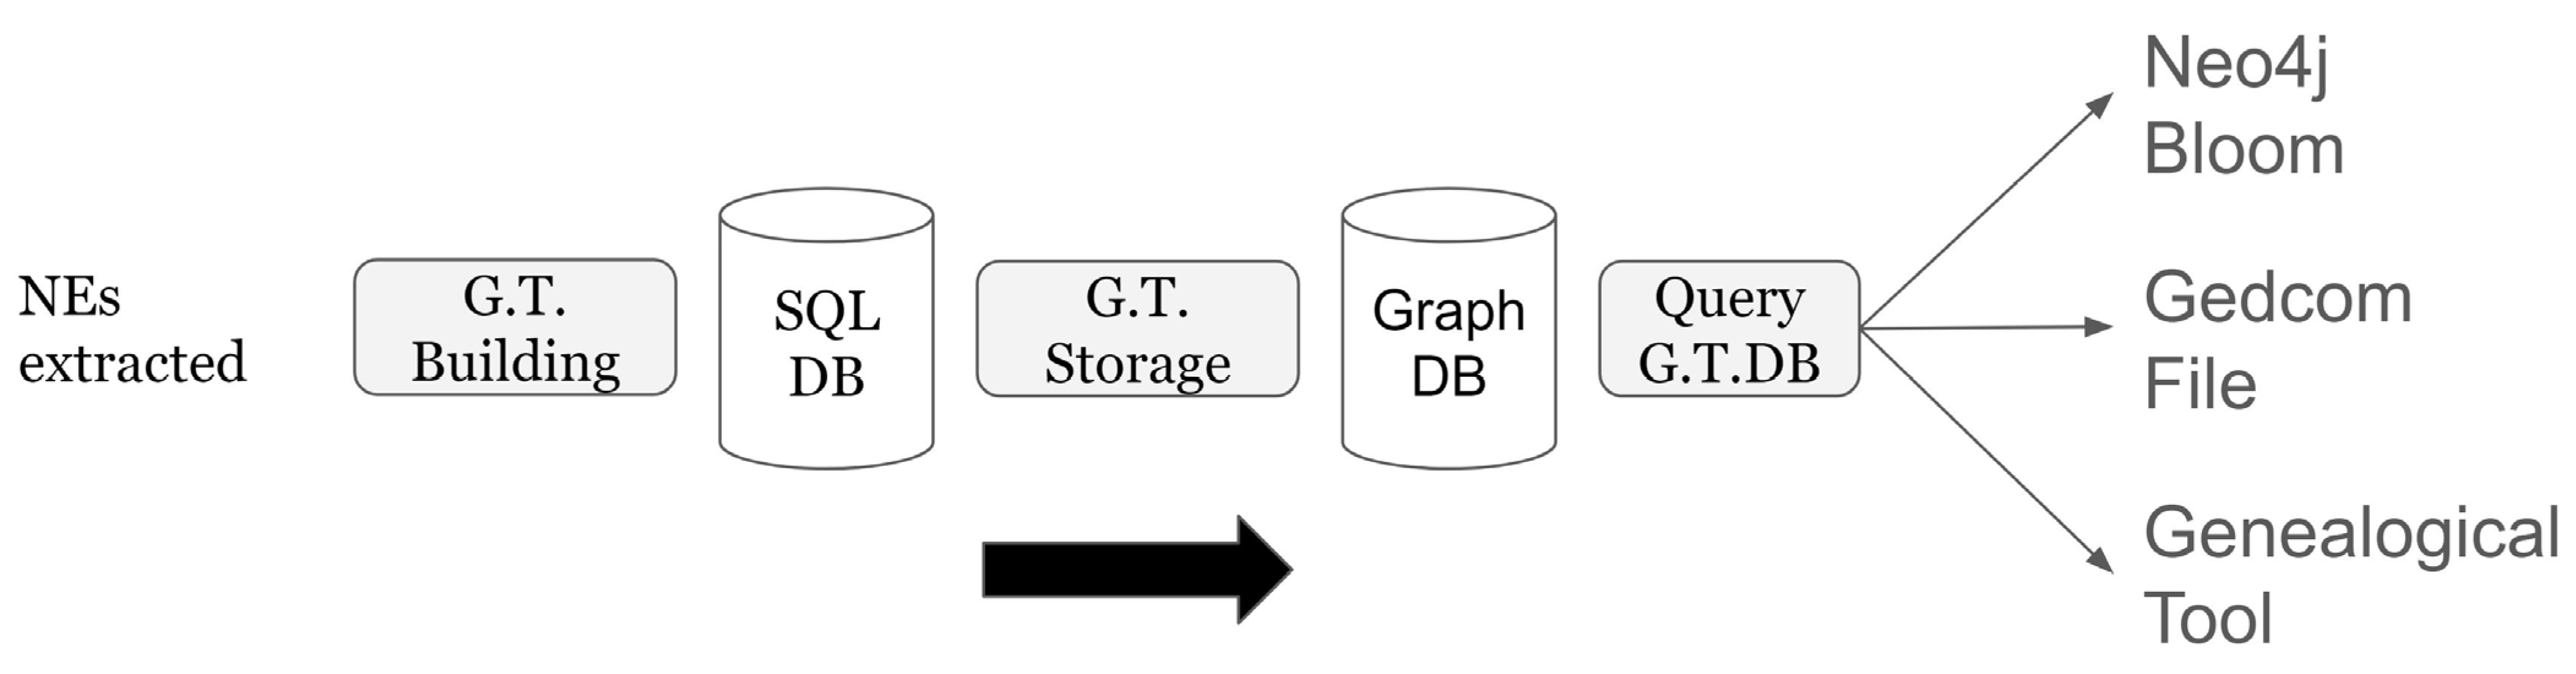
Figure 8 shows, in summary, all the steps necessary for loading the data extracted from the NER onto a Graph DB. The NEs extracted are moved to the Sql Database and then uploaded, using two CSV files (People and Unions), into a graph database. Graph DB enables users to render genealogical trees with Neo4j Bloom, Gedcom File, and genealogical tools such as Family Echo Service.
7. Interactive Map and Contextual Genealogy Visualization
The Jewish cemetery of Pisa is one of the oldest Jewish burial places in the world, with graves dating back to the 17th Century. The walled cemetery comprises two main zones: a more recent one near the Leaning Tower of Pisa and an older one on the opposite side, which is the focus of this article’s work. The Jewish Community of Pisa provided a CAD planimetry of the site, with numbered regions representing graves. The CAD drawing was transformed into an SVG document, allowing it to be rendered inside a web browser. Each region representing a tomb in the SVG document has been manually mapped to the corresponding burial record in the inventory using the aforementioned number.
For the selected Supino family, a mapping process was undertaken to establish a connection between the genealogical data extracted from the Historical Archive and the cemetery inventory. This process involved a targeted approach, centering on key individuals whose burial records had been already compiled. The process was performed manually with the aid of the aforementioned semiautomatic tools (Section 5, Entity Extraction). In this context, relying on a manual method carried out by an expert was deemed a necessity because of the challenges in reading damaged epigraphs and the knowledge needed for the correct interpretation of records from the archive. Following such a supervised approach was deemed feasible because of the limited number of tombs on the site.
Finally, a prototype has been developed for the interactive map application for both the web and mobile platforms (Figure 9).
The prototype leverages the scalability of SVG vector graphics, allowing for smooth zooming and navigation. An omnibar on the top left enables users to search for a specific person or grave as they type a textual input that is matched with given names, family names, or the transcription of the epigraph.
If a person or a grave is selected, either by clicking on a search result or on a grave’s depiction on the map, an infobox is displayed on the left. The infobox shows detailed information about a person, along with a contextual genealogical visualization. The visualization combines elements of a quilt [31] and an indented tree layout [26]. It specifically focuses on the selected person and their relatives, providing a comprehensive view of their family connections.
The interplay between the interactive map and the genealogical visualization enhances the user experience. As users explore the genealogical data, the tombs of relatives are dynamically highlighted on the map, providing a visual and spatial connection between the ancestral information and their physical resting places in the cemetery. This integration allows users to navigate between the map and the genealogical visualization, gaining a deeper understanding of the family’s history of interest within the context of the cemetery.
The main tasks that the interactive map will support are the following: (a) help visitors orient themselves in the cemetery; (b) help users find the location of a specific tomb by issuing a search; (c) provide users with a representation of the family related to a selected tomb; and (d) find the position of tombs of relatives. The application is intended to be used mainly on-site, with the genealogical visualization acting as an enhancement of a classic visit. The supplementary information about genealogy will help the user appreciate an additional aspect of the cultural context of the visited place.
User evaluation will be performed as the IACuP project reaches its final phases. It is planned to perform on-site tests with tourists, focusing on the user experience through observation of user behavior and qualitative assessments rather than measuring quantitative metrics such as the time needed for completing a task.
8. Conclusions and Future Work
This paper has presented the IaCuP project, which aimed to integrate information about cemeteries as cultural sites with archival knowledge and deliver this information to visitors through an interactive map with a contextual genealogy visualization. The described approach was motivated by the need to make the rich historical and cultural context of cemeteries more accessible to modern-day audiences, given that many of the original significance of these sites has been lost over the centuries. To address this challenge, LLMs were used to extract relevant information from associated documents and employed web technologies to create an engaging visual and interactive map, enabling users to explore and understand the cultural context of these sites.
As a practical case study, the described strategy was applied to the Jewish Cemetery in Pisa and the Historical Archives of the Jewish Community in Pisa. Moreover, a genealogical tree of the Supino family was constructed, which is interred in the cemetery, providing further insights into this community’s historical and social connections.
This work highlights the potential of leveraging cutting-edge technologies, such as LLMs and interactive mapping, to bridge the gap between historical archives and cultural sites. By doing so, this paper helps to contribute to the preservation and dissemination of cultural heritage, making it more accessible and engaging for both scholars and the general public.
This work is a preliminary step towards integrating cemetery information and archival knowledge. However, there are several avenues for future research and development:
- Extending the proposed strategy to incorporate marriage records and other historical documentation, such as census, religious and military records, newspapers archives, legal documents, etc., could further enrich users’ cultural context and genealogical information;
- Enhancing the proposed system’s ability to extract and interpret epigraphs (inscriptions on tombstones) could provide deeper insights into the cultural and historical significance of individual graves within a cemetery;
- Incorporating photographs of tombstones and their associated epigraphs could offer a more immersive experience for users, allowing them to explore the visual and textual aspects of cultural sites in greater detail;
- Envisioning a scaled-up, more automated version of the proposed system for bigger sites with better raw data availability and quality (e.g., readable epigraphs, complete registries, etc.).
This work paves the way for new forms of tourism to the Jewish Cemetery in Pisa and towards other historical cemeteries. In addition, this work could reinforce genealogy tourism, i.e., a form of tourism where people visit places where they have ancestral connections [32,33].
Incorporating these aspects into the proposed strategy would expand the scope of the research described in this paper and improve the comprehensiveness of the cultural information accessible through the interactive mapping system. This, in turn, would contribute to a more comprehensive understanding of historical and cultural sites, making them even more engaging and informative for visitors.
Author Contributions
Introduction: A.L.D. with the contribution of A.M. and M.A.; related work: all; the proposed approach: all; the Jewish Cemetery in Pisa: M.M.; entity extraction: A.L.D.; genealogical tree: A.M.; 2D map: M.A. and M.M.; and conclusions: All. All authors have read and agreed to the published version of the manuscript.
Funding
This research is conducted within the IaCuP project, funded by the IIT Innovation Grant 2022, provided by the Institute of Informatics and Telematics of the National Research Council, Italy.
Institutional Review Board Statement
Not applicable.
Informed Consent Statement
Not applicable.
Data Availability Statement
The datasets presented in this article are not readily available because they contain personal information provided by a third party. Requests to access the datasets should be directed to the Jewish Community of Pisa.
Acknowledgments
The authors would like to thank the Jewish Community in Pisa for kindly providing access to all the material of the Historical Archive and the Cemetery. The authors would also like to thank Rosanna Supino for sharing her knowledge about the Supino family.
Conflicts of Interest
The authors declare no conflicts of interest.
References
- Lennon, J.J.; Foley, M. Dark Tourism; Cengage Learning EMEA: Andover, UK, 2000. [Google Scholar]
- Lo Duca, A.; Bacciu, C.; Marchetti, A. Chapter Fourteen—Towards a smart navigation of cemeteries as cultural sites. In Ancient Greek Art and European Funerary Art, 321; Cambridge Scholars Publishing: Newcastle upon Tyne, UK, 2019; ISBN 13-978-1-5275-3930-3. [Google Scholar]
- Lo Duca, A.; Marchetti, A.; Moretti, M.; Diana, F.; Toniazzi, M.; D’Errico, A. Genealogical Data Mining from Historical Archives: The Case of the Jewish Community in Pisa. Informatics 2023, 10, 42. [Google Scholar] [CrossRef]
- Cimitero Monumentale di Milano. Percorso Generale. 2019. Available online: https://monumentale.comune.milano.it/itinerari/percorso-generale (accessed on 18 February 2024).
- Cimiteri di Roma. Cimiteri di Roma. 2020. Available online: http://www.cimiteridiroma.it/ (accessed on 18 February 2024).
- Ciolfi, L.; Petrelli, D.; Goldberg, R.; Dulake, N.; Willox, M.; Marshall, M.; Caparrelli, F. Exploring historical, social and natural heritage: Challenges for tangible interaction design at Sheffield General Cemetery. In Proceedings of the NODEM 2013: Beyond Control—The Collaborative Museum and Its Challenges, Stockholm, Sweden, 1–3 December 2013. [Google Scholar]
- Evensen, K.H.; Nordh, H.; Skaar, M. Everyday use of urban cemeteries: A Norwegian case study. Landsc. Urban Plan. 2017, 159, 76–84. [Google Scholar] [CrossRef]
- Matuszka, T.; Kiss, A. Alive cemeteries with augmented reality and Semantic Web technologies. Int. J. Comput. Inf. Sci. Eng. 2014, 8, 32–36. [Google Scholar]
- Wolgemuth, R. Cemetery Tours and Programming: A Guide; Rowman & Littlefield: Lanham, MD, USA, 2016. [Google Scholar]
- The PEACE Project. Available online: https://peace.sites.uu.nl/ (accessed on 18 February 2024).
- The FIJI Project. Available online: https://fiji.sites.uu.nl/FIJI (accessed on 18 February 2024).
- Goyal, A.; Gupta, V.; Kumar, M. Recent named entity recognition and classification techniques: A systematic review. Comput. Sci. Rev. 2018, 29, 21–43. [Google Scholar] [CrossRef]
- Humbel, M.; Nyhan, J.; Vlachidis, A.; Sloan, K.; Ortolja-Baird, A. Named-entity recognition for early modern textual documents: A review of capabilities and challenges with strategies for the future. J. Doc. 2021, 77, 1223–1247. [Google Scholar] [CrossRef]
- Wang, S.; Sun, X.; Li, X.; Ouyang, R.; Wu, F.; Zhang, T.; Li, J.; Wang, G. Gpt-ner: Named entity recognition via large language models. arXiv 2023, arXiv:2304.10428. [Google Scholar]
- Braverman, M.; Chen, X.; Kakade, S.; Narasimhan, K.; Zhang, C.; Zhang, Y. Calibration, entropy rates, and memory in language models. In Proceedings of the International Conference on Machine Learning, Vienna, Austria, 12–18 July 2020; pp. 1089–1099. [Google Scholar]
- Malmasi, S.; Fang, A.; Fetahu, B.; Kar, S.; Rokhlenko, O. Multiconer: A large-scale multilingual dataset for complex named entity recognition. arXiv 2022, arXiv:2208.14536. [Google Scholar]
- Luo, Y.; Zhao, H.; Zhan, J. Named entity recognition only from word embeddings. arXiv 2019, arXiv:1909.00164. [Google Scholar]
- Ashok, D.; Lipton, Z.C. PromptNER: Prompting For Named Entity Recognition. arXiv 2023, arXiv:2305.15444. [Google Scholar]
- Shen, T.; Long, G.; Geng, X.; Tao, C.; Zhou, T.; Jiang, D. Large Language Models are Strong Zero-Shot Retriever. arXiv 2023, arXiv:2304.14233. [Google Scholar]
- Genealogy. Wikipedia, The Free Encyclopedia. 2023. Available online: https://en.wikipedia.org/wiki/Genealogy (accessed on 1 October 2023).
- Price, J.; Buckles, K.; Van Leeuwen, J.; Riley, I. Combining Family History and Machine Learning to Link Historical Records (No. w26227); National Bureau of Economic Research: Cambridge, MA, USA, 2019. [Google Scholar]
- Pokorný, J. Graph databases: Their power and limitations. In Proceedings of the Computer Information Systems and Industrial Management: 14th IFIP TC 8 International Conference, CISIM 2015, Warsaw, Poland, 24–26 September 2015; Proceedings 14. Springer International Publishing: Cham, Switzerland, 2015; pp. 58–69. [Google Scholar]
- Van Aart, C.; Wielinga, B.; Van Hage, W.R. Mobile cultural heritage guide: Location-aware semantic search. In Proceedings of the Knowledge Engineering and Management by the Masses: 17th International Conference, EKAW 2010, Lisbon, Portugal, 11–15 October 2010; Proceedings 17. Springer: Berlin/Heidelberg, Germany, 2010; pp. 257–271. [Google Scholar]
- Shneiderman, B. The eyes have it: A task by data type taxonomy for information visualizations. In Proceedings of the Proceedings 1996 IEEE Symposium on Visual Languages, Boulder, Colorado, 3–6 September 1996; IEEE: Piscataway, NJ, USA, 1996; pp. 336–343. [Google Scholar]
- Herman, I.; Melançon, G.; Marshall, M.S. Graph visualization and navigation in information visualization: A survey. IEEE Trans. Vis. Comput. Graph. 2000, 6, 24–43. [Google Scholar] [CrossRef]
- McGuffin, M.J.; Balakrishnan, R. Interactive visualization of genealogical graphs. In Proceedings of the IEEE Symposium on Information Visualization, Minneapolis, MN, USA, 23–25 October 2005; INFOVIS 2005. IEEE: Piscataway, NJ, USA, 2005; pp. 16–23. [Google Scholar]
- Tuttle, C.; Nonato, L.G.; Silva, C. PedVis: A structured, space-efficient technique for pedigree visualization. IEEE Trans. Vis. Comput. Graph. 2010, 16, 1063–1072. [Google Scholar] [CrossRef] [PubMed]
- Kim, N.W.; Card, S.K.; Heer, J. Tracing genealogical data with timenets. In Proceedings of the International Conference on Advanced Visual Interfaces, Roma, Italy, 26–28 May 2010; pp. 241–248. [Google Scholar]
- Mukaliyev, D. Visualizing Large Genealogies with Timelines. Master’s Thesis, Itä-Suomen Yliopisto, Kuopio, Finland, 2015. [Google Scholar]
- Bezerianos, A.; Dragicevic, P.J.; Fekete, D.; Bae, J.; Watson, B. GeneaQuilts: A System for Exploring Large Genealogies. IEEE Trans. Vis. Comput. Graph. 2010, 16, 1073–1081. [Google Scholar] [CrossRef] [PubMed]
- Zappala, D. Using visualization and search to locate genealogy holes. In Proceedings of the 13th Annual Family History Technology Workshop, Salt Lake City, UT, USA, 21–23 March 2013. [Google Scholar]
- Mansueli, V.A.P.; Okano, M.T. Representations of Genealogies in Graph Theory: K-Graphs. In Proceedings of the IAMOT 2018 Conference—International Association for Management of Technology, Birmingham, UK, 22–26 April 2018. [Google Scholar]
- Santos, C.A.; Yan, G. Genealogical tourism: A phenomenological examination. J. Travel Res. 2010, 49, 56–67. [Google Scholar] [CrossRef]
Figure 1.
The architecture of the implemented system.

Figure 2.
A sample record in the Registry of Births. The manuscript (a), the Italian transcription (b), and the English translation (c).
Figure 2.
A sample record in the Registry of Births. The manuscript (a), the Italian transcription (b), and the English translation (c).

Figure 3.
The implemented system for NER extraction.

Figure 4.
The connections between the two tables, People and Unions.

Figure 5.
The initial data model schema.

Figure 6.
Genealogical tree fragment of the Supino family rendered with Neo4j Bloom.

Figure 7.
Genealogical tree fragment of the Supino family by using Family Echo Service providing the information as a Gedcom file. A pink box is for female and a light blue box for male.
Figure 7.
Genealogical tree fragment of the Supino family by using Family Echo Service providing the information as a Gedcom file. A pink box is for female and a light blue box for male.

Figure 8.
Summary of all the steps necessary to display a family tree starting from the named entities extracted from the birth and death register.
Figure 8.
Summary of all the steps necessary to display a family tree starting from the named entities extracted from the birth and death register.
Figure 9.
A screenshot of the current prototype of the interactive map, displaying an excerpt of the genealogical tree of the Supino family, centered on Moisè Supino (1813–1878). The diagram on the left illustrates Moisè’s parents, his spouses Rachele and Ottavia, and the two family branches originating from them. Families with different parents are depicted with links of different colors. The map indicates the burial locations of the corresponding family members, if available.


Table 1.
An example of the desired output.
| Child Name | Father Name | Mother Name | Sex | Date of Birth |
|---|---|---|---|---|
| Haim o Vita | Giacomo Nissim | Giaele Levi Sonsino | M | 4 February 1850 |
Table 2.
Distribution of the dataset used in the experiments.
| Entity Type | Structure | Example | N. of Records |
|---|---|---|---|
| Father | (Multiple) Name Surname | Angelo Merisi | 9 |
| Father | (Multiple) Name Surname di/del fu Name Surname | Aron di Nissim Soria | 11 |
| Mother | (Multiple) Name Surname | Anna Usigli | 14 |
| Mother | (Multiple) Name Surname di/del fu Name | Ester del fu Josef Montefiore | 4 |
| Mother | Name | Devora | 2 |
Table 3.
Extracted people belonging to the Supino family.
| Grand Father | Father | Child | Child Birth of Date | Child Sex |
|---|---|---|---|---|
| Salamon | David | Rachel | 26 June 1750 | F |
Table 4.
People table with the persons Salamon, David, and Rachel.
| Id Person | Last | First | Sex | Father | Mother | Id Family of Origin | Birth Date | Birth Place |
|---|---|---|---|---|---|---|---|---|
| SPNSLMXXXXXXXXMG702IT | Supino | Salamon | M | Pisa | ||||
| SPNDVDXXXXXXXXMG702IT | Supino | David | M | Supino Salamon | ?F1 | SPN?F1XXXXXXXXG702IT | Pisa | |
| SPNRCH17500626FG702IT | Supino | Rachel | F | Supino David | ?F2 | SPN?F2XXXXXXXXG702IT | 26 June 1750 | Pisa |
Table 5.
Unions table with two unions involving Salamon and David Supino.
| Id Family | Wedding Date | Wedding Place | Id Husband | Husband | Id Wife | Wife |
|---|---|---|---|---|---|---|
| SPN?F1XXXXXXXXG702IT | Pisa | SPNSLMXXXXXXXXMG702IT | Supino Salamon | ?F1 | ||
| SPN?F2XXXXXXXXG702IT | Pisa | SPNDVDXXXXXXXXMG702IT | Supino David | ?F2 |
Disclaimer/Publisher’s Note: The statements, opinions and data contained in all publications are solely those of the individual author(s) and contributor(s) and not of MDPI and/or the editor(s). MDPI and/or the editor(s) disclaim responsibility for any injury to people or property resulting from any ideas, methods, instructions or products referred to in the content. |
© 2024 by the authors. Licensee MDPI, Basel, Switzerland. This article is an open access article distributed under the terms and conditions of the Creative Commons Attribution (CC BY) license (https://creativecommons.org/licenses/by/4.0/).
Share and Cite
MDPI and ACS Style
Lo Duca, A.; Abrate, M.; Marchetti, A.; Moretti, M. Genealogical Data-Driven Visits of Historical Cemeteries. Informatics 2024, 11, 9. https://doi.org/10.3390/informatics11010009
AMA Style
Lo Duca A, Abrate M, Marchetti A, Moretti M. Genealogical Data-Driven Visits of Historical Cemeteries. Informatics. 2024; 11(1):9. https://doi.org/10.3390/informatics11010009
Chicago/Turabian StyleLo Duca, Angelica, Matteo Abrate, Andrea Marchetti, and Manuela Moretti. 2024. "Genealogical Data-Driven Visits of Historical Cemeteries" Informatics 11, no. 1: 9. https://doi.org/10.3390/informatics11010009
Note that from the first issue of 2016, this journal uses article numbers instead of page numbers. See further details here.