Article

Developing a Model of Distributed Sensemaking: A Case Study of Military Analysis

Interaction Design Centre, Middlesex University, The Burroughs, London NW4 4BT, UK
*
Author to whom correspondence should be addressed.
Informatics 2016, 3(1), 1; https://doi.org/10.3390/informatics3010001
Submission received: 15 December 2015 / Revised: 13 February 2016 / Accepted: 16 February 2016 / Published: 26 February 2016
(This article belongs to the Special Issue Human–Information Interaction)

Abstract

:
In this paper, we examine the role of representational artefacts in sensemaking. Embodied within representational media, such as maps, charts and lists, are a number of affordances, which can furnish sensemakers with the ability to perform tasks that may be difficult to do inside the head. Presented here is a study of sensemaking in action. We conducted a study of military intelligence analysts carrying out a training exercise, the analysis of which focuses on the use of external task-specific representations. We present a discussion of the findings of our study in the form of a model of distributed sensemaking. Our model concentrates on the interaction of information and various representational artefacts, leading to the generation of insights and a situation picture. We also introduce a number of levels of description for examining the properties and affordances offered by representational artefacts and their role in the sensemaking process.

1. Introduction

The process of sensemaking has been described as one of finding meaning and gaining insight from information [1]. During sensemaking, we engage in a process of comprehension [2] in which we gather, restructure and reorganise information to help build a plausible understanding about an aspect of the world. There are a number of theoretical accounts offered on sensemaking. For example, Klein et al. [2] propose the data-frame model of sensemaking; Weick [1] describes an analysis of sensemaking in organisations; Russell et al. offer the learning loop complex [3]; Dervin offers a sense-making methodology [4]; and Pirolli and Card describe an analysis of sensemaking by intelligence analysts [5].
Representation is a key part of sensemaking: Klein et al. [2] describe our understanding of events or situations as frames. A frame is a representation that serves as an account of a given situation in the mind of the sensemaker and can be expressed in a number of forms, such as stories, maps, diagrams or scripts [6]. Pirolli and Card [5] describe the representation and re-representation of information as key to the generation of insight during sensemaking in intelligence analysis. Their model shows analysts re-organising information, gathered through information foraging, into structured forms (i.e., schematisation) to support reasoning. As Pirolli and Card point out, sensemaking often involves the creation and use of external representations, embodied in external artefacts, such as maps or lists. These presumably help in tasks that might otherwise be difficult to perform in our minds alone.
In his work on distributed cognition, Hutchins argues that the study of human cognition must look beyond the head of the individual to include an entire “cognitive system”, where this embraces cognitive processes as distributed across the social interaction of individuals, the artefacts they use, the environment they work in and previous events and experiences [7,8,9]. For current purposes, our interest is in cognition as distributed across representations embodied within physical artefacts. Extending the unit of analysis beyond what happens in the head makes good sense here given the role that external artefacts can play in sensemaking. External artefacts come with built-in affordances that people can exploit to support external representation or computation where they judge that these might improve sensemaking some way. The use of representations “in the world” changes sensemaking, ideally for the better. Commitment to this is clearly demonstrated in the amount of work in academia and industry aimed at developing software for supporting this aspect of sensemaking (e.g., tools for interactive visualisation, argument mapping, spatial hypertext to name a few).
However, though current theories of sensemaking recognise the role of external representations, they do not seem to address the role of external representations or external artefacts in very much depth [10]. For example, Pirolli and Card [5] touch on the use of external data sources and external resources in sensemaking, particularly during schematization, where information is represented schematically, perhaps as written diagrams or as visualisations, such as timelines, in order to identify patterns and to build inferences. Although this highlights the importance of external representation to the sensemaking process, there currently exists no framework for describing and evaluating the features and semantic meaning imbued by such artefacts that play a role in sensemaking in current theories. The development of tools and technologies for the support of sensemaking activities requires a deep understanding of sensemaking and associated analytical processes [11], which includes the role of external representations and the interaction of different elements of cognitive systems, in a range of task settings. This requires the study of working environments and practices to draw out constructs and analytical approaches, which might provide a theoretical “lens” for analysing sensemaking situations, carving out space to consider design alternatives. In our work on distributed sensemaking, we aim to address this.
In distributed sensemaking, we consider sensemaking through the lens of distributed cognition, with a particular interest in how different external representations are used to support human reasoning. In this paper, we develop these concepts through the study of military signals intelligence (SIGINT) analysts taking part in a training exercise. We present an analysis that develops a model of “distributed sensemaking”. Our model consists of two elements: inference trajectories and a number of levels of description. Inference trajectories allow us to model the interaction of information embodied within different representational states in sensemaking. We also consider artefacts at a number of levels of description by which we can analyse the properties and affordances of them that play a role in sensemaking.
We present our model as an extension to existing sensemaking theory, addressing a gap in the analysis of the features of external artefacts and representations that play a role in it. Our aim is to provide a construct that sensitises analysts into thinking about this.
Our paper is structured as follows: in the next section, we give some background on sensemaking and distributed cognition. In Section 3, we describe a case-study of military intelligence analysis before we deliver a summary of the findings of the aforementioned study. In Section 4, we present a model of distributed sensemaking consisting of inference trajectories and a number of levels of description. Finally, we conclude our paper in Section 5.

2. Background

2.1. Sensemaking

Sensemaking is concerned with the way in which we use information to build a picture of the world around us. It is said that we reorganise and restructure information to help build an understanding of the world [12]. There are a number of different theories that consider sensemaking in a number of different settings. The work of Weick [1] is concerned with sensemaking within organisations, where it is said to be the process resulting in a collaborative understanding, which comes from the perspectives of individuals interacting in social contexts and how they make sense of the world and their role within it. In Weick’s account of sensemaking, individual and social sensemaking are inextricably linked, as the sensemaker is an actor within the social environment of which they are trying to make sense. Russell et al. [3] describe the “learning loop complex”. They model sensemaking in four stages: the generation of representations (schemas), the instantiation of schemas, the changing of schemas according to ill-fitting data and, finally, information processing using the instantiated schemas. Dervin’s “sense-making methodology” (SMM) [4] addresses how people establish information needs and use information in sensemaking. The notion of a “gap” is central to SMM: these act as barriers to progress, bringing about sensemaking strategies that people use to bridge them. Pirolli and Card [5] present an account of sensemaking as a process model based on a study of intelligence analysts. Their model consists of two major loops of activity: the foraging loop and the sensemaking loop. Within each loop are a number of sub-activities. In the foraging loop, analysts seek, search and filter information, extracting it into some form of schema. In the sensemaking loop, a mental model is iteratively created from this schema according to the evidence available.
Klein et al.’s data-frame model [2] offers an account of sensemaking focusing on the cognitive processes involved. The data-frame model consists of two elements that interact with each other: data and frames. Data are information about the world as experienced by the sensemaker through interaction with it. Frames are representations accounting for the current understanding of an aspect of the world. For example, a frame might be a pilot’s understanding of the current heading and direction of his or her aircraft, or it might be a detective’s beliefs about a suspect of a crime. In this light, a frame serves as both an interpretation and explanation of the data available at a particular moment in time [10]. Sensemaking then becomes a process involving framing and re-framing when new data become available. As the sensemaker experiences a new situation, a frame acts an interpretation of it. Then, as more data become available, the current frame may be elaborated upon or challenged. This results in the frame evolving over time, as it becomes a more plausible account of the situation and as previous frames are rejected or modified.

2.2. Distributed Cognition

Distributed cognition gives an account of human cognition as taking place not only in the head of an individual person, but as distributed among people, the artefacts they use and the environment in which they are situated, as well as as being embedded within a history of previous events, experiences and cultural practices and beliefs [7]. Consequently, Hutchins argues that the scope of traditional cognitive science should be broadened and for the unit of analysis to be the entire “cognitive system” of which the individual is a part [7,8]. In an agenda aimed at the HCI (Human Computer Interaction) community, Hollan et al. describe distributed cognition according to three “tenets” [9]. These are: socially-distributed cognition, describing the distribution of cognitive tasks among individuals acting as part of a social group; embodied cognition, describing the distribution of cognitive activity across internal and external representations and resources; and culture and cognition, describing how cognitive processes are impacted by cultural ecologies and communities of practice.
The distributed cognition approach has been applied in a number of settings, describing the nature of cognitive systems found in ship navigation [7], aircraft cockpits [13,14], air traffic control [15] and emergency medical dispatch [16]. In HCI, distributed cognition has been applied to frame the analysis of existing practice, informing redesigns of existing systems and the design of new solutions by examining how media and information are currently used and what the consequence of any transformations may be [8]. There has however been some criticism of the distributed cognition approach in HCI [8]. Concerns raised by Nardi [17,18] highlight the extensive fieldwork involved before any conclusions about reasoning or design decisions are reached when doing distributed cognition analyses. Moreover, Nardi also points out that there is no set of concepts that can be readily applied to distributed cognition research. When citing Nardi’s point of view, Rogers [8] concurs, adding that there is “no explicit set of features to be looking for, nor is there a check list or recipe that can easily be followed” in the distributed cognition approach, which makes it difficult to apply, requiring a high level of skill to move between detailed and abstract elements within an analysis.

2.3. Visualisation Tools for Supporting Sensemaking

There is a rising use of visualisation tools in many areas of human activity, including areas, such as financial services, public health, emergency management, journalism, business, science, law and others [19]. Visualisation tools are defined as computer-based tools that visually represent data/information in ways that allow interaction with them, allowing users to interpret and analyse data [19]. Work in visual analytics [20], information visualisation and scientific visualisation, among others, has led to a number of developments in computer-based visualisation tools, including a number of tools that support sensemaking [21]. Two such examples include INVISQUE and JIGSAW. INVISQUE (Intuitive Information Exploration through Interactive Visualization) is an interactive computer-based environment that allows users to interact with data/information on a two-dimensional “spatial canvas” using “index cards”, which allow intuitive interactions to perform actions, such as searching, browsing and categorising data [22]. JIGSAW is a visual analytic tool that provides a number of coordinated views allowing users to examine documents and their entities by illustrating connections between entities across different documents [23].
Research has shown that visualisation has a positive effect in supporting sensemaking and other high-level cognitive activities [24]. However, though researchers suggest that visualisations enhance and support cognition, there is little research that has looked at the cognitive utility of visualisations in a systematic manner. Liu, Nersessian and Stasko [25] highlight the need for a theoretical grounding to be established in the development and evaluation of visualisation tools. They discuss how the perspective of distributed cognition can provide “descriptive and explanatory power” for understanding the role of artefacts and, more specifically, visualisation tools in cognitive processes. They argue that a reductionist approach in studying abstract properties of the human mind may not be useful in informing the design of visualisation tools, proposing that distributed cognition may provide a useful framework for incorporating a human component and identifying theoretical concepts in information visualisation. Though the distributed cognition approach does go some way in framing the study of the role of visualisation tools and artefacts in cognitive activities, including sensemaking, it does have shortcomings. As we have discussed above, distributed cognition does not provide a distinct set of concepts or method that can be easily applied in research settings, making it a costly endeavour in terms of the time and effort involved in generating understanding of the role of representations, artefacts and visualisation tools in cognition.
In this paper, we extend the theoretical insights developed from an analysis of an observational study of ex-military personnel taking part in an intelligence analysis training exercise. This study is initially described in [10], where the focus was on the use of lookup tables and the role that these and other representational resources played during part of the exercise. There, we attend in particular to ways in which the analysts used the affordances of the paper tables (e.g., the ability to cross things out) to support systematic narrowing down of alternative interpretations of data through elimination (which was analysed as deductive in character). In this paper, we use insights from this study to propose an approach, grounded in distributed cognition and sensemaking theory, to analysing the use of multiple representations used in concert as this unfolds over time. We also develop a perspective by which we can examine individual representations and their features, as well as the role they play in shaping reasoning and sensemaking.

3. Case Study of Military Analysis

3.1. Scenario and Study Design

We carried out two runs of a study in which we saw experienced SIGINT analysts taking part in an exercise developed for the training of real-world analysts within an intelligence cell. Our study was designed to be consistent and authentic with respect to real-world analysis. Two analysts took part, each with 24 and 34 years of operational military intelligence analysis, respectively. Our study also involved two SIGINT trainers who played supporting roles (direction finder and supervisor) in the exercise and were responsible for developing the training scenario, with 24 and 25 years of experience, respectively.
The training exercise focused on a scenario in which the south coast of England was under threat from an opposing force. Our attention was on the role of the analyst within a signals intelligence cell whose task it is to build a situation picture from intercepted communications.
A typical structure of a signals intelligence cell is illustrated in Figure 1. Interceptors (far left) are radio operators in the field who intercept radio broadcasts and communications and feed information to the Direction Finder (middle left). This information includes radio frequencies and modes used to make communications, excerpts of communications that may contain military unit callsigns (aliases used when making radio communications, e.g., AB01), codewords (cover terms used to conceal sensitive information or commands), as well as the geographic location (longitude and latitude) of units. The Direction Finder’s (DF) job is to triangulate the positions of units in the field included in feeds from multiple interceptors and to compile a tactical tip off (TTO) report to be sent forward to the analyst.
A TTO is typed into a pre-formatted form using a word processor and contains locations of units and corresponding callsigns, radio frequencies and modes (e.g., FM, AM) that they are using, plus important (or deemed to be) extracts from communications, including codewords. The analyst relies primarily on such reports to build a picture of the situation on the ground.
The analyst uses various pieces of software to receive TTOs, record aspects of the situation picture (e.g., locations of units on a map and within a command structure) and write Intelligence Summary (INTSUM) reports, which are periodically sent forward to the supervisor.
The study was set up to observe the role of the analyst, since this seemed to be the primary sensemaking role in the cell. The roles of interceptors/direction finder and supervisor were simulated by the two military trainers who designed the training scenario. Two runs of the study were conducted with experienced analysts, who were unfamiliar with the exercise scenario. The duration of the studies were two hours and one and a half hours, respectively.
Analysts used four computer displays arranged in a two-by-two formation (see Figure 2). The software used by the analysts included the EW Training and Mission Support Tool (EWMST) (EWMST is proprietary software developed by MASS Consultants Ltd. (Lincoln, UK)), which allows the visual mapping of units according to latitude and longitude and allows the addition of other properties, such as callsigns and radio frequency, as metadata for each unit. IBM’s i2 Analyst Notebook was used to create network graphs illustrating the opposing force’s command structure as inferred by the analyst. Microsoft Word was used to read TTO reports and to create INTSUM reports to be sent to the supervisor. Instant messaging software was used to communicate and send files between the analyst, DF and supervisor.
A set of “working aids” in the form of printed materials were given to the analyst. These contained a number of tables of data and relating information known about the opposing force, such as radio equipment and callsigns at different echelons in the military command structure (i.e., a P-404 radio is used at a frequency range of 1.25 to 4.5 MHz to send communications from the regiment to battalion level; see Figure 3), radio encryption information (known information about encryption systems used to encode messages at certain echelons within the command structure), codewords used and the enemy order of battle (ORBAT). An ORBAT is a representation drawn from prior intelligence that describes the known structure of a military force, including equipment used, the structure of military units and command hierarchies.

3.2. Data Collection and Analysis

Data were collected using a video camera capturing the analyst’s workspace and another capturing a wider view of the room. Screen-capture software was used to make recordings of the four screens. A log of instant message communications was made along with audio recordings of conversations, which were combined with video footage after the study. Roughly every 15 min, the analyst was asked to give an account of his or her current activities and current understanding of the situation. These were also recorded along with some think-aloud protocol responses throughout the exercise (thinking aloud was difficult to sustain). Debrief interviews were conducted with the analysts after the exercise. Another interview was also conducted with the supervisor outlining a normative process of analysis.
In order to analyse the study data, video and audio recordings from each study were combined and synced together before being transcribed using video transcription software. This allowed the written transcription of each person talking (analyst, DF, supervisor and researcher), activity, such as incoming TTO reports, and actions made by the analyst to be linked with the corresponding point in the combined video/audio recording. The data were then translated into a spreadsheet before being coded to show events, such as a TTO being received, a report being sent to the supervisor, the use of working aids or possible insight reached. Using a combination of the video/audio transcription and the coded transcription, narratives of each study were created. Written narratives provided a way of preserving the continuity and preventing fragmentation of the data, allowing us to interpret the flow of information over time where it is used in concert with different resources and representations. Each written narrative included screen captures taken from video data showing actions taken by the analysts, as well as images of TTO reports and the use of working aids where they are used by the analyst. A narrative of the supervisor’s normative account of the task was also written. By treating the data in this way, we were able to familiarise and engage ourselves in the data and perform a detailed analysis of the use of representational artefacts, whilst maintaining an account of their context in the wider picture.
The study presented in this paper is qualitative and intended to be descriptive in nature. It has been designed to allow us to record, examine and understand, in depth, the work of skilled and experienced intelligence analysts and the role of representation in their sensemaking processes.

3.3. Findings

Using information from TTO reports, the analyst’s job was to use combined information sent from the field together with background intelligence held in the working aids to build a “situation picture”. The situation picture was the analyst’s current understanding of what was happening in the scenario, which included the identities and locations of units in the field of battle, command structure and information about the opposing force’s next moves or planned actions. The situation picture was written up as a brief summary in the form of an INTSUM, which was sent periodically to the supervisor.
When a TTO was received by the analyst, it was usually plotted on a map (by latitude and longitude) using the EWMST software, identifying groups of units by the callsigns used, and grouping units together by colour. Once this was done, the analyst would begin drawing inferences from information held in the TTOs. Firstly, it was important for the echelon (level of command) of each unit to be known in order to establish where each unit is within the hierarchy. Analysts did this by using information within the working aids.
An example of this is the analyst’s use of the “radio equipment” table (Figure 3). This lists information about radio equipment used, the radio frequency and mode (e.g., AM/FM) it is used on and the level of command by which this is used. The analyst would cross-check the radio frequency identified in the TTO with frequency ranges within the table, scanning row-by-row to establish if the frequency falls within that range. As the table was printed on paper, the analyst would strikeout each row where the frequency fell out of the range. As the analyst strikes out each row where this is the case, he/she is left with a smaller number of possible levels of command on which a particular radio communication is made. For example, if a radio frequency is given as 3.55 MHz FM, the analyst would scan the table, eliminating (by striking through) each row where the given frequency does not fit within the range. In this case, it leaves two remaining possibilities, the radio designations P-404 and P-434 (in the interest of confidentiality, radio designations, codewords, cover terms and other sensitive material seen in our study have been altered from the originals). This would imply two possible levels of communication: regiment-to-battalion (Regt→Bn) or division-to-regiment (Div→Regt).
By looking up information, such as the format of the callsigns used in the “Radio Procedures-Callsigns” table or the type of encryption used in the “Encryption Systems” table, the analyst is able to determine the level of command of the intercepted communication by way of a Boolean conjunction. In other words, if the radio frequency 3.55 MHz FM means communications are either at Regt→Bn or Div→Regt level and the communication is enciphered using an encryption only used by Div→Regt or Army→Div, the conjunction of both of these statements means that the communication must be at the Div→Regt level (a further example of this is in [10]).
Once a level of command is established, the analyst is able to use this information to help focus in on the units in the field and to determine what their next actions might be by using other information contained within the TTOs, such as excerpts of speech where commands are given or known cover terms are used. In the scenario, a communication is made at Army→Div level (inferred as above) referring to codeword “TYPHOON”. The analyst looks this codeword up in the “Codewords and Cover Terms” table and is able to find out that it translates to a command to begin preparing for a mission. Using knowledge of the level of command, the analyst is able to infer that a command is being given by the army level to a subordinate unit in the divisional level to get ready for a mission. A further piece of intelligence in the form of a “HUMINT” report (human-intelligence; in this case, a tip-off from an ex-military civilian reporting a sighting of military vehicles) refers to a number of anti-tank guns seen moving across a field in a northwesterly direction. Using the enemy ORBAT, looking at units at the divisional level and below, the analyst can see that only one battalion within one division of the opposing military has these particular anti-tank guns. Knowing this, the analyst is able to determine the identity of the units in the field (the name of their battalion and which division they are part of) and their last known location and direction of travel as reported in the HUMINT report.

4. Distributed Sensemaking in SIGINT Analysis

In this section, we explore the case study above using an analysis that attends to the idea of sensemaking and distributed sensemaking. Of particular interest to us for this study (and for others like it) is to explore the ways in which sensemaking distributes across time and across material artefacts.
In terms of time, we see sensemaking as having a trajectory. Earlier conclusions and background knowledge or beliefs may affect which data are subsequently accessed and attended to and how those data are interpreted. Previous conclusions may act as premises for new inferences. To understand this better, we describe the flow of the sensemaking as inference trajectories, intended to track how prior knowledge and beliefs combine in inferences to form new conclusions. These events link together to describe the trajectory of an evolving situation picture.
In terms of distribution across material artefacts, we are interested in how information is represented through physical media and how the properties and, particularly, the affordances of these media influence the strategies that people adopt in using them. To do this, we consider the semantic (or informational) content of such artefacts from their physical properties, adopting an approach that describes them at a number of levels of description.

4.1. Inference Trajectories

We use the term inference trajectory to describe the flow of information during the sensemaking process. It is a high-level look at the sensemaking process showing the interaction of information embodied within different representational states, leading to the generation of insight and new knowledge. In our case study, we saw analysts use a number of “working aids” in conjunction with information from the field of combat, represented within TTOs, leading to insights, such as lists of possible levels of command or understanding about commands given by enemy units. When insights such as these are regarded together, we see the development of a clearer, better defined and differentiated situation picture.
Figure 4 illustrates part of an inference trajectory from our case study. Material representations are shown in grey (such as tables printed on paper), and abstract information (such as radio frequencies) are seen in white. By illustrating the inference trajectory in this way, we show the flow of information in sensemaking (from left to right), the use of representational artefacts (such as the “Radio Equipment” table) in concert with abstract information (such as a radio frequency) leading to insights (such as level of command) and the narrowing down of the situation picture.

4.1.1. Information

As we have previously highlighted, information is key to the sensemaking process. Sensemaking is the process by which we use information to build an understanding of the world around us. That is, we perceive some information about the world, which can take a number of forms, and reason about it in order to reach a plausible picture of the world.
Inference trajectories are concerned with the relationship between pieces of information. This information can be embodied within representational artefacts or in the head of the sensemaker. Information in this sense are the facts conveyed about events taking place in or aspects of part of the world.
For example, in our study, we saw analysts receive a number of TTO reports. These TTOs were physical representations embodying information about the world as observed by interceptors in the field of combat, such as radio frequencies and codenames intercepted from enemy radio communications. Analysts also had at their disposal a number of “working aids”. These represented different aspects of the world, such as known codenames and cover terms used by the opposing force in the form of tables and charts. In both cases, the TTO and the working aids (tables and charts) are physical manifestations of represented information.
In our illustration of an inference trajectory (Figure 4) taken from our study, we distinguish between information, such as a radio frequency, and the representational artefacts information is extracted from, such as TTOs, by colouring nodes white (information) or grey (material artefacts).

4.1.2. Inference Generation

In our study, we have seen analysts use information extracted from representational artefacts used in concert with information embodied in other representations in order to reach insights. For example, in the inference trajectory shown in Figure 3, we can see that the analyst extracts a piece of information from a TTO showing that an enemy communication has been made on a radio frequency of 3.55 MHz. We can see that when this is considered in conjunction with the “Radio Equipment” table, the resulting inference is a number of possible levels of command. This inference is reached by the analyst taking the information about the radio frequency and considering it in conjunction with the information embodied within the “Radio Equipment” table, comparing it with each row in the table and eliminating those where the given frequency does not fit within the range, leading to a number of possible levels of command.
Conclusions drawn from one inference, such as a list of possible levels of command, also serve as a premise for further, often more well-defined inferences. For example, we saw an analyst draw inferences leading to two lists of possible levels of command. When these two inferences were combined, by means of a Boolean conjunction, as discussed above, the analyst was left with one possible level of command. Furthermore, when this knowledge of the level of command (Div→Regt) is used in conjunction with and inference about the meaning of a codeword, the analyst is able to reach a further, more well-defined inference, in this case a command to prepare for a mission sent from the Div→Regt level to prepare for a mission.
Similarly, work by Wong and Kodagoda [26] investigating the reasoning and inference making process of criminal intelligence analysts identifies a similar reasoning process. Their analysis shows a process that involves a relationship between claims and premises, where the premises justify the claim [27]. They show that a claim, such as “all current vehicle break-ins follow the same modus operandi”, is preceded by a number of premises, such as “a pattern is emerging where car windows are smashed to rip out the console” and “the crimes do not comply with usual smash and grab car crime”. They also show how the conclusions of previous inferences serve as premises for further, better defined inferences. We have shown above how this has been seen in our own work, where inferences, drawn from the use of external resources, are used in conjunction, serving as premises for new inferences. For example, a claim about a command given from Div→Regt to form up for missions is preceded by premises that a communication has been made on a Div→Regt level of command, and a codeword has been used that translates to a command to form up for missions.

4.1.3. Situation Picture

We use the term situation picture to refer to a sensemaker’s current understanding of a given situation. At the beginning of the sensemaking process, a situation picture may be vague and undefined: the sensemaker may only have a very general understanding of a situation, such as an attack taking place on the south coast of England, which could be being carried out by a known military organisation. As sensemaking develops, the situation picture becomes more well defined and differentiated, representing a clearer, more detailed version of events. Moreover, a situation picture comes as the result of a number of inferences considered together at any point in the sensemaking process.
In light of this, we build on the terminology of Klein et al. [2,6], considering the situation picture to serve as a meta-frame consisting of a number of sub-frames. We regard sub-frames as being inferences drawn from the use of information extracted from representations in conjunction with information embodied with other representations. The situation picture is the product of these inferences regarded together as a meta-frame.
Furthermore, a situation picture can also serve as a springboard into action. When the sensemaker considers his or her current situation picture, gaps in knowledge may become apparent in light of the desired level of understanding about a situation, motivating him or her to gather further information in order to generate further insights to gain a clearer understanding. Wong and Kodagoda [26] saw this in their study of criminal intelligence analysis, where stories drawn together from a number of inferences explain an understanding of a situation. These stories (the analyst’s situation picture) encourage action by analysts, who search for more information to strengthen or disprove claims.
A situation picture can be represented in the head or as a representation outside the head. For example, in our study, we saw one analyst feed information to his supervisor verbally stating “it could be ‘17th Tank Battalion’, subordinate to ‘17th Motorised Division”’, indicating a current situation picture that was not written down, but instead, it was in the analyst’s head. Later in the same run of our study, we saw the analyst add details to an INTSUM form about what he thought was happening on the field of battle. Here, the INTSUM served as a summary, externalised version of the analyst’s situation picture once he had a clearer, more definitive understanding of what was happening, rather than an impression of what a situation “could” be. In another run, we saw the analyst open a blank INTSUM form at the very beginning of his analysis, and each time he gained an insight, he added it to his summary, amending it where appropriate or adding new insights when discovered, revealing a clearer situation picture as sensemaking developed. Similar findings were made by Andrews, Endert and North [28] in a study of spatial environments embodied within high-resolution displays support sensemaking. They found that analysts kept physical notes (electronically and written on paper) to record theories that they were forming — an informal, but similar representation to the INTSUM form we saw in our observations.

4.2. Levels of Description

In distributed sensemaking, our interest is in the use of external representations in support of cognition. In the previous section, we have shown the flow of information and the use of external representations as inference trajectories. Now, we look at the properties and affordances of representational artefacts, which are central to their appropriation within the cognitive system. In our study, it was particularly revealing how various affordances offered by representational artefacts, such as tables and charts in the analysts’ working aids, were used. The interaction and manipulation of representations as embodied within physical artefacts led to the generation of a number of insights and eventually to a clear situation picture. We propose that an understanding of the use of such representational artefacts can be developed by considering their properties and affordances at three different levels of description: physical, semantic and pragmatic. The physical level of description is concerned with an artefact as a physical object. The semantic level is concerned with the meanings encoded within a representational artefact outside of a specific activity context. The pragmatic level refers to the meanings that a representation can be imbued with in the context of an ongoing cognitive activity.
In our study, we saw analysts use the “Radio Equipment” table (see Figure 3) to draw inferences about the level of command in which communications were made from the radio frequency used. In Table 1, we show the properties of this table at the three levels of description discussed here. We will now give explanation for each of these levels of description using this example.

4.2.1. Physical Properties

An artefact’s physical properties can be described in terms of its material and shape: how an artefact is physically constituted. Moreover, we also view the physical properties of an artefact in terms of the affordances offered by virtue of its composition. When referring to affordance, our thinking is in line with what Hartson [29] refers to as “physical affordance”, or the “perceived affordance” of Norman [30,31]. That is, the physical affordances of an object are its physical features that help, support, facilitate or enable physical action [29] .
Hence, the physical properties of the “Radio Equipment” table can be described as: a piece of A4 paper containing typed information in a tabular format. The affordances offered by virtue of this as exploited by the analysts in our study (we only describe affordances exploited by the analyst in our observations; although it is by no means an exhaustive list of the affordances offered by the artefact, it is only necessary to describe affordances that play a role in the cognitive system) are: information represented in tabular form (in rows) can be easily visually scanned row-by-row. As the table is printed on paper, it affords rows of information being crossed out using pen or pencil.

4.2.2. Semantic Properties

A physical artefact may have representational properties designed to convey meaning. The semantic properties are the properties by virtue of which the artefact is “about” some aspect of the world, i.e., what it is taken to represent or stand for. It is through the semantic properties that an artefact becomes a representational artefact, modelling some aspect of the world by making propositional claims about it. For example, encoded within the “Radio Equipment” table is information about a number of pieces of radio equipment used by the opposing force, including associations between radio designations (or labels), radio frequency ranges and the corresponding levels of command, which can be true or false.
Significantly, we associate the semantic level of description as corresponding to meanings that are “designed into” a representational artefact and given to it in a way that is independent of and persistent across multiple task or activity contexts. Such meanings are generic, making generalised propositional claims. Consequently, they do not record anything of the current situation picture, although their generalised propositions may be instrumental in warranting (in the inferential sense) some aspect of a situation picture.

4.2.3. Pragmatic Properties

Similar to semantic properties, pragmatic properties are concerned with meaning. However, whereas semantic properties are general and independent of task context, the pragmatic level of description is concerned with the specifics of a given task context. They may, for example, record some aspect of task history or planning; or they may convey part of a situation picture. These meanings are temporary as a result, since they arise by virtue of a task context; without that context, this meaning is lost.
For example, the pragmatic properties of an artefact may be given by virtue of where it is physically placed in relation to other artefacts, like being placed in a particular pile or to the right of another artefact, as seen in [28], where analysts arranged documents across screen space into a number of piles given categories such as “potentially interesting” or documents identifying an individual.
Pragmatic properties arise by virtue of both the physical and semantic properties and the way that these enable a representational artefact to be imbued with meaning within a given task context. As described in our findings, we saw analysts use the “Radio Equipment” table in conjunction with information regarding the radio frequency to establish an inference about the level of command. Analysts would scan the table row-by-row making an assessment as to whether the given frequency fits within the range on that row. If it did not, the analyst would strike-through or cross-out that row, eliminating it from the list of possible levels of command. We have already described how the physical properties of this artefact afford the scanning of information row-by-row and that semantically, it represents a set of associations between radios and levels of command. At the pragmatic level, the artefact takes on further meaning by virtue of these things and of its current use. Each time the analyst crosses out a row on the table, it signals some aspect of the current situation picture (what something is now). He/she is then left with a smaller number of possibilities. Furthermore, the analyst also has a record of radio types, which have been considered, but have been dismissed. Therefore, it can be said, at a pragmatic level of description, the role of the “Radio Equipment” table is a representation of a working set of currently-plausible possibilities for levels of command according to a given radio frequency.
This is echoed by Vygotsky’s distinction between meaning and sense in language. Meaning is stable and is what a sign points at or denotes, such as a definition found in a dictionary, whereas sense is the fluctuating contents of a sign determined by its use in practice. In different contexts, a sign’s sense is changed. Likewise, the semantic properties of an artefact are fixed (e.g., an inventory in a shop represents a series of associations between items of stock and stock levels), but when used in the context of current cognitive activity, the artefact gains new pragmatic meaning. For example, an inventory with highlighted and marked entries may represent stock that is low and stock that has not been ordered yet.

5. Conclusions

In this paper, we have presented a study of sensemaking in action, with an analytical focus on the role of representational artefacts in the sensemaking process. We described the study of two experienced ex-military signals intelligence analysts taking part in a training exercise, which was designed to train real-world military personnel. In our analysis of this study, we focused on the role of representational artefacts in the sensemaking process, considering the properties of different material representations and how these properties affect reasoning and sensemaking. In our findings, we saw how representations, namely a series of “working aids”, played a crucial role in the analysts’ sensemaking. We saw how abstract information was used in concert with external artefacts leading to the generation of inferences and a situation picture.
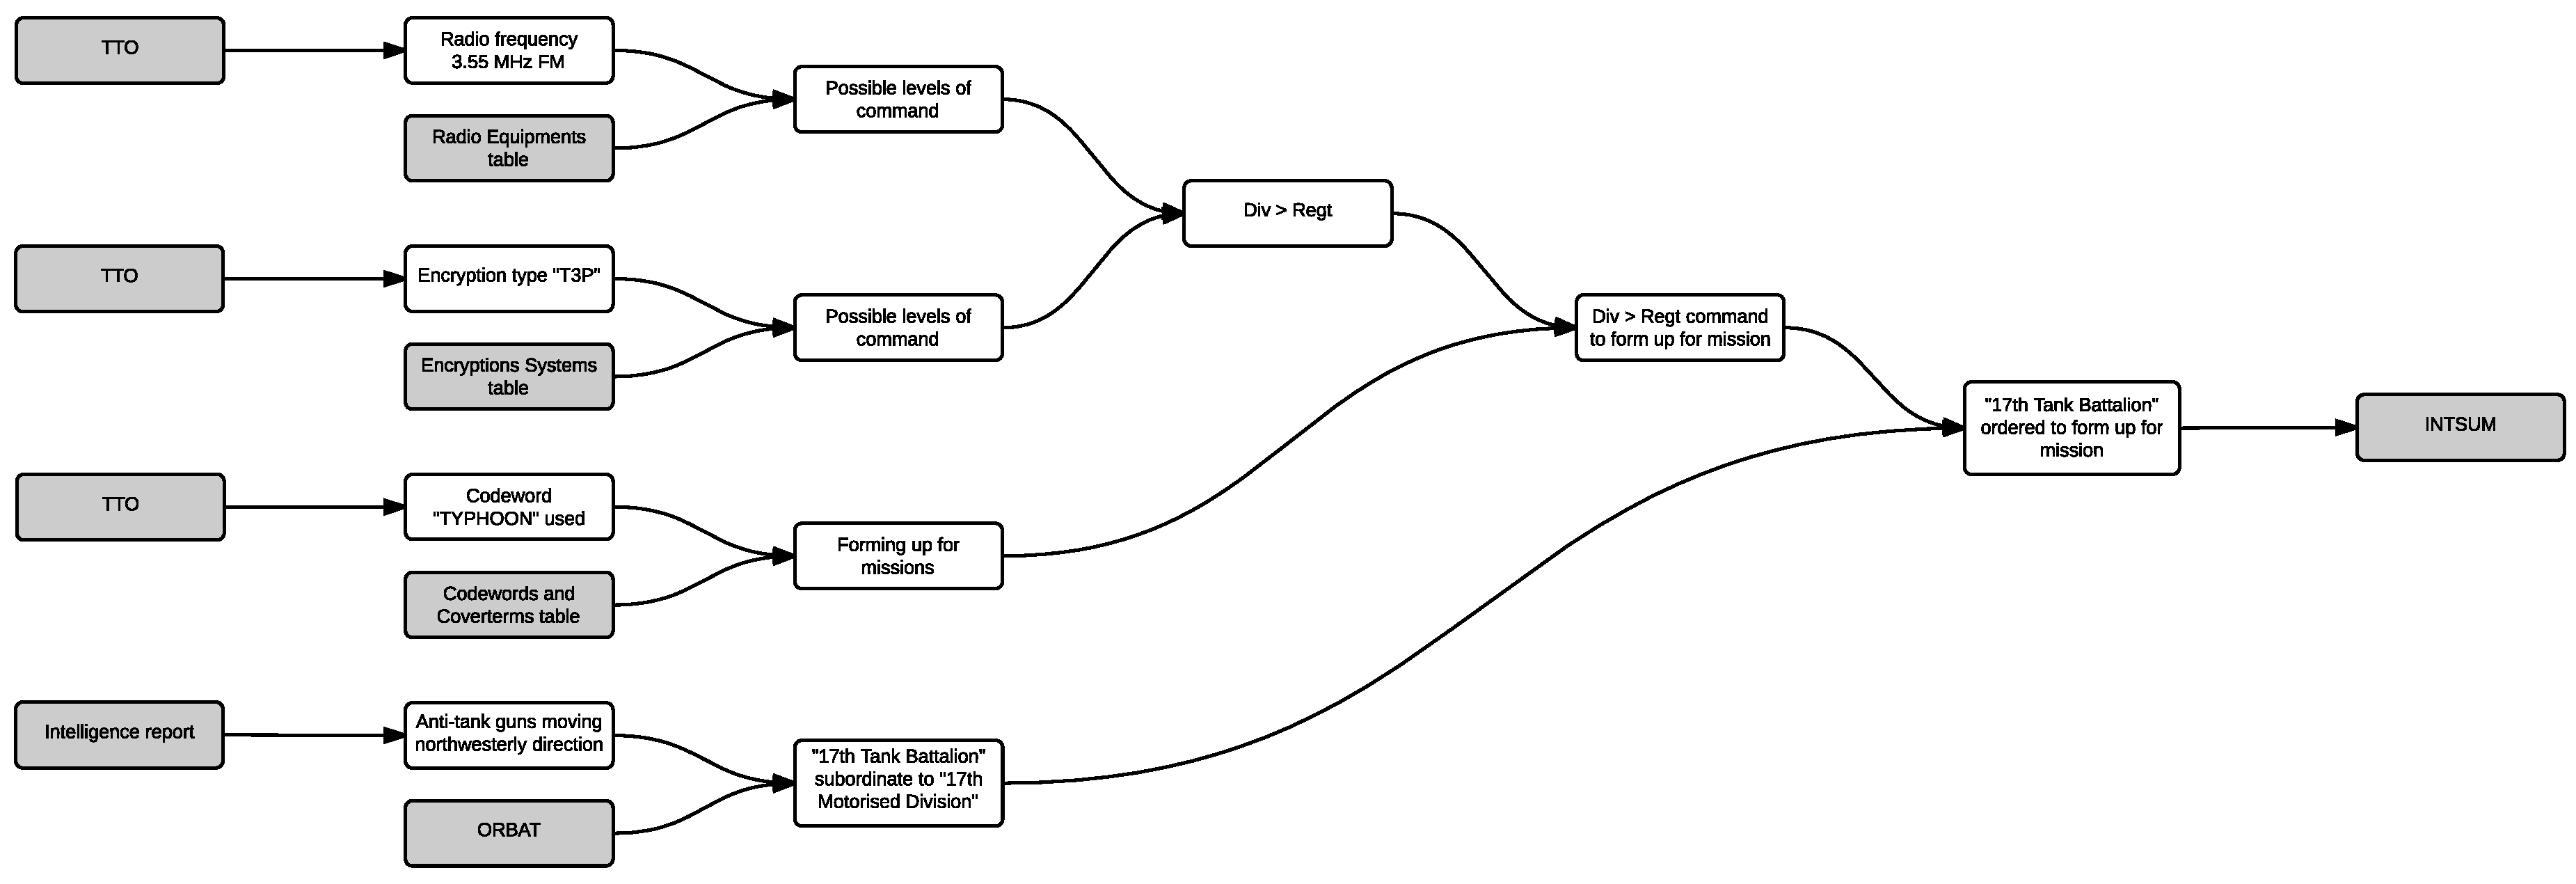
We presented findings from our study in the form of a conceptual model consisting of inference trajectories and a number of levels of description. Inference trajectories offer a way of decomposing sensemaking into a series of steps, each of which contributes to the generation of an increasingly more specific and more differentiated situation picture. Mapping out a trajectory in this way allows us to analyse the way in which information is extracted from representations, often embodied within physical artefacts, and combined through inference making to contribute to understanding. In the current example of SIGINT analysis, inference trajectories illustrate (see Figure 4) how the conclusion drawn from one inference acts as a premise in subsequent inferences. They also draw attention to visual lookup and cognitive reasoning operations at each stage, inviting us to consider how the physical manifestation of represented information affects sensemaking.
Findings made by Wong and Kodagoda [26] map out similar reasoning processes in criminal intelligence analysts, showing the relationship between claims and premises throughout an analysis. It is apparent that there are comparisons that can be made between their analysis of criminal intelligence analysis and our analysis of SIGINT analysis. Though their study looks at the abstract reasoning of analysts and not the features of the artefacts they use, we argue that the comparisons between both studies support the applicability of inference trajectories for mapping out distributed sensemaking in both structured tasks, such as SIGINT analysis, and unstructured tasks, such as criminal intelligence analysis.
We also introduce the concept of a situation picture, referring to a sensemaker’s current understanding of a given situation, which becomes better defined as sensemaking develops. A situation picture also serves as a springboard into action, motivating the sensemaker to seek out further information and insights in order to gain a clearer understanding of a situation. Similar findings were also made by Wong and Kodagoda [26]. We saw situation pictures represented externally, in the form of an INTSUM report created by the analyst, which evolved throughout our study as the situation picture developed. This was also seen in a study by Andrews, Endert and North [28], who saw analysts record a form of situation picture in electronic and written notes.
We present three levels of description for examining such representational artefacts, taking into account their physical, semantic and pragmatic properties. An artefact’s physical constitution can play a role in the way it can be used in the sensemaking process. For example, we described how a table of radio frequencies and corresponding information printed on paper afforded being manually crossed out by analysts, allowing them to narrow down possible levels of command. When describing the semantic properties of an artefact, we examine the representational meaning artefacts are imbued with, that is what aspect of the world they are taken to represent. At a pragmatic level, we describe how an artefact gains meaning in light of current cognitive activity, revealing how it is used by virtue of its physical and semantic properties.
By analysing the role of different representations and representational artefacts in the ways we have demonstrated here, we can isolate specific interactions with such artefacts that contribute to the sensemaking process in a systematic way, which current theories in sensemaking and distributed cognition cannot. For example, in a distributed cognition study of air traffic control, Fields and colleagues [32] describe the co-ordination of multiple forms of representational media, such as “flight strips”, “strip boards” and radar read-outs in forming an understanding of the current state of airspace. They describe a number of properties of these cognitive artefacts, including the flexibility and accessibility of representations and the operations and actions that can be performed on them. In concluding their paper, however, the authors concede that their approach lacked a method that took them from analysis to design. Moreover, their analysis focuses on making isolated descriptions of the use of a number of representational artefacts, but does not describe their role in the whole picture in terms of the co-ordination of information and representations to reach an understanding of the current state of airspace. We believe our model can go some way in filling this gap.
For example, by creating inference trajectories, we can map out air traffic controller’s reasoning processes through time, decomposing the interaction and co-ordination of information and resources, such as aircraft metadata written on flight strips and airspeed indications from a radar screen, which lead to the generation of a situation picture. Furthermore, by describing the physical, semantic and pragmatic properties of such artefacts, we can reveal which features of them play a role in the sensemaking processes of the air traffic controllers. For instance, a physical flight strip affords the air traffic controller the ability to write aircraft metadata on it and place it in a strip board alongside other strips. The strip represents a single aircraft, and the strip board is a collection of strips representing all aircraft in a given section of airspace. By moving the position of strips on the strip board, the air traffic controller can represent the positions of the aircraft in relation to each other at a particular moment in time.
By mapping out inference trajectories and describing the physical, semantic and pragmatic properties of representations in this way, we provide a systematic mechanism by which we can generate a deep understanding of distributed sensemaking in such scenarios. Inference trajectories reveal the coordination and interaction of information embodied within different artefacts, which lead to inference generation and the development of a situation picture. By analysing the physical, semantic and pragmatic properties of artefacts, we can examine the features of artefacts that play a role in sensemaking. This allows us to consider properties of interactions, such as user-costs, effectiveness, propensity for error or other properties that may be important to the particular sensemaking activity, carving out a problem space to consider design interventions that might change these properties in more or less desirable ways.
As highlighted by Chin, Kuchar and Wolf [11], the development of new technologies aimed at supporting sensemaking requires deeper understanding of the analytical processes intelligence analysts carry out, including the way they use information tools. Liu, Nersessian and Stasko [25] also argue that the developments of visualisation tools requires an understanding of the role of external artefacts and representations, citing distributed cognition as providing a useful perspective in framing this. We believe our work extends these notions. Though here we mainly focus on the findings of one study, we believe that our model can be applied in a number of different settings. We have drawn on the findings of studies in more unstructured and explorative settings, such as criminal intelligence analysis, to demonstrate this, showing concurrence with our findings.
Looking ahead, our intention is to develop our model further by carrying out studies in a variety of work settings to develop and validate its concepts further, leading to a robust and generalised framework that can be used to carry out analyses of sensemaking scenarios.

Acknowledgments

The authors would like to thank Jim Nixon at Cranfield University, James Cambell at BMT Defense Services Ltd. and Kai Xu at Middlesex University for their contribution in the form of study design and data collection in this work. Part of this work was funded by the UK Defence Science and Technology Laboratory (Dstl) via the UK Defence Human Capability Science and Technology Centre. The training exercise was devised and run by MASS Consultants Ltd.

Author Contributions

Simon Attfield conceived of and designed the study. Ashley Wheat and Simon Attfield conducted the study with others (not listed in authorship). Ashley Wheat analysed the data with support from Simon Attfield and Bob Fields. Ashley Wheat wrote this paper with contributions from Simon Attfield and Bob Fields.

Conflicts of Interest

The authors declare no conflict of interest.

References

  1. Weick, K.E. Sensemaking in Organizations; Sage: London, UK, 1995; Volume 3. [Google Scholar]
  2. Klein, G.; Phillips, J.K.; Rall, E.L.; Peluso, D.A. A data-frame theory of sensemaking. In Expertise Out of Context: Proceedings of the Sixth International Conference on Naturalistic Decision Making; Psychology Press: New York, NY, USA, 2007; pp. 113–155. [Google Scholar]
  3. Russell, D.M.; Stefik, M.J.; Pirolli, P.; Card, S.K. The cost structure of sensemaking. In Proceedings of the SIGCHI Conference on Human Factors in Computing Systems (CHI ’93), Amsterdam, The Netherlands, 24–29 April 1993; pp. 269–276.
  4. Dervin, B. An Overview of Sense-Making Research: Concepts, Methods and Results to Date. In Proceedings of International Communication Association Annual Meeting, Dallas, TX, USA, May 1983; Available online: http://communication.sbs.ohio-state.edu/sense-making/art/artdervin83.html (accessed on 30 November 2015).
  5. Pirolli, P.; Card, S. The sensemaking process and leverage points for analyst technology as identified through cognitive task analysis. In Proceedings of the International Conference on Intelligence Analysis, McLean, VA, USA, 2–6 May 2005; pp. 2–4.
  6. Klein, G.; Moon, B.; Hoffman, R.; Associates, K. A Macrocognitive Model Human-Centered Computing A Macrocognitive Model. IEEE Intell. Syst. 2006, 21, 88–92. [Google Scholar] [CrossRef]
  7. Hutchins, E. Cognition in the Wild; MIT Press: Cambridge, MA, USA, 1995. [Google Scholar]
  8. Rogers, Y. HCI theory: Classical, modern, and contemporary. Synth. Lect. Hum. Cent. Inform. 2012, 5, 1–129. [Google Scholar] [CrossRef]
  9. Hollan, J.; Hutchins, E.; Kirsh, D. Distributed cognition: Toward a new foundation for human-computer interaction research. ACM Trans. Comput. Hum. Interact. 2000, 7, 174–196. [Google Scholar] [CrossRef]
  10. Attfield, S.; Fields, B.; Wheat, A.; Hutton, R.J.B.; Nixon, J.; Leggatt, A.; Blackford, H. Distributed sensemaking: A case study of military analysis. In Proceedings of the 12th International Conference on Naturalistic Decision Making, McLean, VA, USA, 9–12 June 2015.
  11. Chin, G., Jr.; Kuchar, O.A.; Wolf, K.E. Exploring the analytical processes of intelligence analysts. In Proceedings of the SIGCHI Conference on Human Factors in Computing Systems (CHI ’09), Boston, MA, USA, 4–9 April 2009; pp. 11–20.
  12. Weick, K.E.; Sutcliffe, K.M.; Obstfeld, D. Organizing and the Process of Sensemaking. Organ. Sci. 2005, 16, 409–421. [Google Scholar] [CrossRef]
  13. Hutchins, E. How a cockpit remembers its speeds. Cogn. Sci. 1995, 19, 265–288. [Google Scholar] [CrossRef]
  14. Hutchins, E.; Klausen, T. Distributed cognition in an airline cockpit. In Cognition and Communication at Work; Cambridge University Press: Cambridge, UK, 1996; pp. 15–34. [Google Scholar]
  15. Halverson, C.A. Inside the Cognitive Workplace: New Technology and Air Traffic Control. Ph.D. Thesis, University of California, San Diego, CA, USA, 1995. [Google Scholar]
  16. Furniss, D.; Blandford, A. Understanding Emergency Medical Dispatch in terms of Distributed Cognition: A case study. Ergonomics 2006, 49, 1174–1203. [Google Scholar] [CrossRef] [PubMed]
  17. Nardi, B.A. Context and Consciousness: Activity Theory and Human-Computer Interaction; MIT Press: Cambridge, MA, USA, 1996. [Google Scholar]
  18. Nardi, B.A. Coda and response to Christine Halverson. Comput. Support. Cooper. Work (CSCW) 2002, 11, 269–275. [Google Scholar] [CrossRef]
  19. Parsons, P.; Sedig, K. Distribution of information processing while performing complex cognitive activities with visualization tools. In Handbook of Human Centric Visualization; Springer: Berlin, Germany, 2014; pp. 693–715. [Google Scholar]
  20. Thomas, J.J.; Cook, K.A. Illuminating the Path: The Research and Development Agenda for Visual Analytics; IEEE Computer Society: Los Alamitos, CA, USA, 2005. [Google Scholar]
  21. Kodagoda, N.; Attfield, S.; Wong, B.L.W.; Rooney, C.; Choudhury, S. Using interactive visual reasoning to support sense-making: Implications for design. IEEE Trans. Vis. Comput. Graph. 2013, 19, 2217–2226. [Google Scholar] [CrossRef] [PubMed]
  22. Wong, W.; Chen, R.; Kodagoda, N.; Rooney, C.; Xu, K. INVISQUE: Intuitive information exploration through interactive visualization. In Proceedings of International Conference on Human Factors in Computing Systems, CHI 2011, Vancouver, BC, Canada, 7–12 May 2011; pp. 311–316.
  23. Stasko, J.; Görg, C.; Spence, R. Jigsaw: Supporting investigative analysis through interactive visualization. Inf. Vis. 2008, 7, 118–132. [Google Scholar] [CrossRef]
  24. Parsons, P.; Sedig, K. Common visualizations: Their cognitive utility. In Handbook of Human Centric Visualization; Springer: Berlin, Germany, 2014; pp. 671–691. [Google Scholar]
  25. Liu, Z.L.Z.; Nersessian, N.; Stasko, J. Distributed Cognition as a Theoretical Framework for Information Visualization. IEEE Trans. Vis. Comput. Graph. 2008, 14, 1173–1180. [Google Scholar] [PubMed]
  26. Wong, B.L.W.; Kodagoda, N. How Analysts Think : Inference Making Strategies. In Proceedings of the 59th Annual Meeting of the Human Factors and Ergonomics Society, Los Angeles, CA, USA, 26–30 October 2015; pp. 269–273.
  27. Copi, I.M.; Cohen, C.; McMahon, K. Introduction to Logic: Pearson New International Edition; Pearson Higher Education: London, UK, 2013. [Google Scholar]
  28. Andrews, C.; Endert, A.; North, C. Space to think: Large high-resolution displays for sensemaking. In Proceedings of the SIGCHI Conference on Human Factors in Computing Systems (CHI ’10), Atlanta, GA, USA, 10–15 April 2010; pp. 55–64.
  29. Hartson, R. Cognitive, physical, sensory, and functional affordances in interaction design. Behav. Inf. Technol. 2003, 22, 315–338. [Google Scholar] [CrossRef]
  30. Norman, D.A. Affordance, conventions, and design. Interactions 1999, 6, 38–43. [Google Scholar] [CrossRef]
  31. Norman, D.A. The Design of Everyday Things: Revised and Expanded Edition; Basic Books: New York, NY, USA, 2013. [Google Scholar]
  32. Fields, B.; Wright, P.; Marti, P.; Palmonari, M. Air traffic control as a distributed cognitive system: A study of external representations. In Proceedings of the Ninth European Conference on Cognitive Ergonomics; Green, T., Bannon, L., Warren, C., Buckley, J., Eds.; European Association of Cognitive Ergonomics (EACE): Le Chesnay, France, 1998; pp. 85–90. [Google Scholar]
Figure 1. The typical structure of a study of military signals intelligence (SIGINT) cell as in this scenario. The focus of our observations was on the analyst role. Figure reproduced from [10].
Informatics 03 00001 g001
Figure 2. Analyst’s workspace showing the four-screen setup used by analysts in the SIGINT exercise.
Informatics 03 00001 g002
Figure 3. Radio equipment table showing information about the radio equipment used by the opposing force. Radio designations, mode, frequency ranges and levels of command, as well as other information are shown.
Informatics 03 00001 g003
Figure 4. An inference trajectory showing the flow of information throughout the sensemaking process in a run of our study of SIGINT analysis. It shows the use of material representations (in grey) and abstract information leading to insight generation and situation picture (represented as an intelligence summary (INTSUM)).
Informatics 03 00001 g004
Table 1. The physical, semantic and pragmatic properties of the “Radio Equipment” table.
PhysicalSemanticPragmatic
Typed information in tabular format printed on A4 paperRepresents a series of associations between radio equipment/radio frequencies and levels of commandA list of radio equipment and possible levels of command

