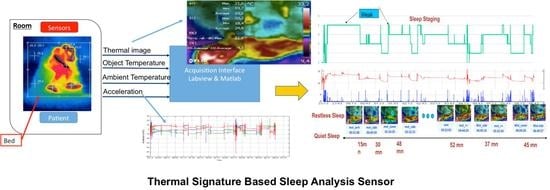
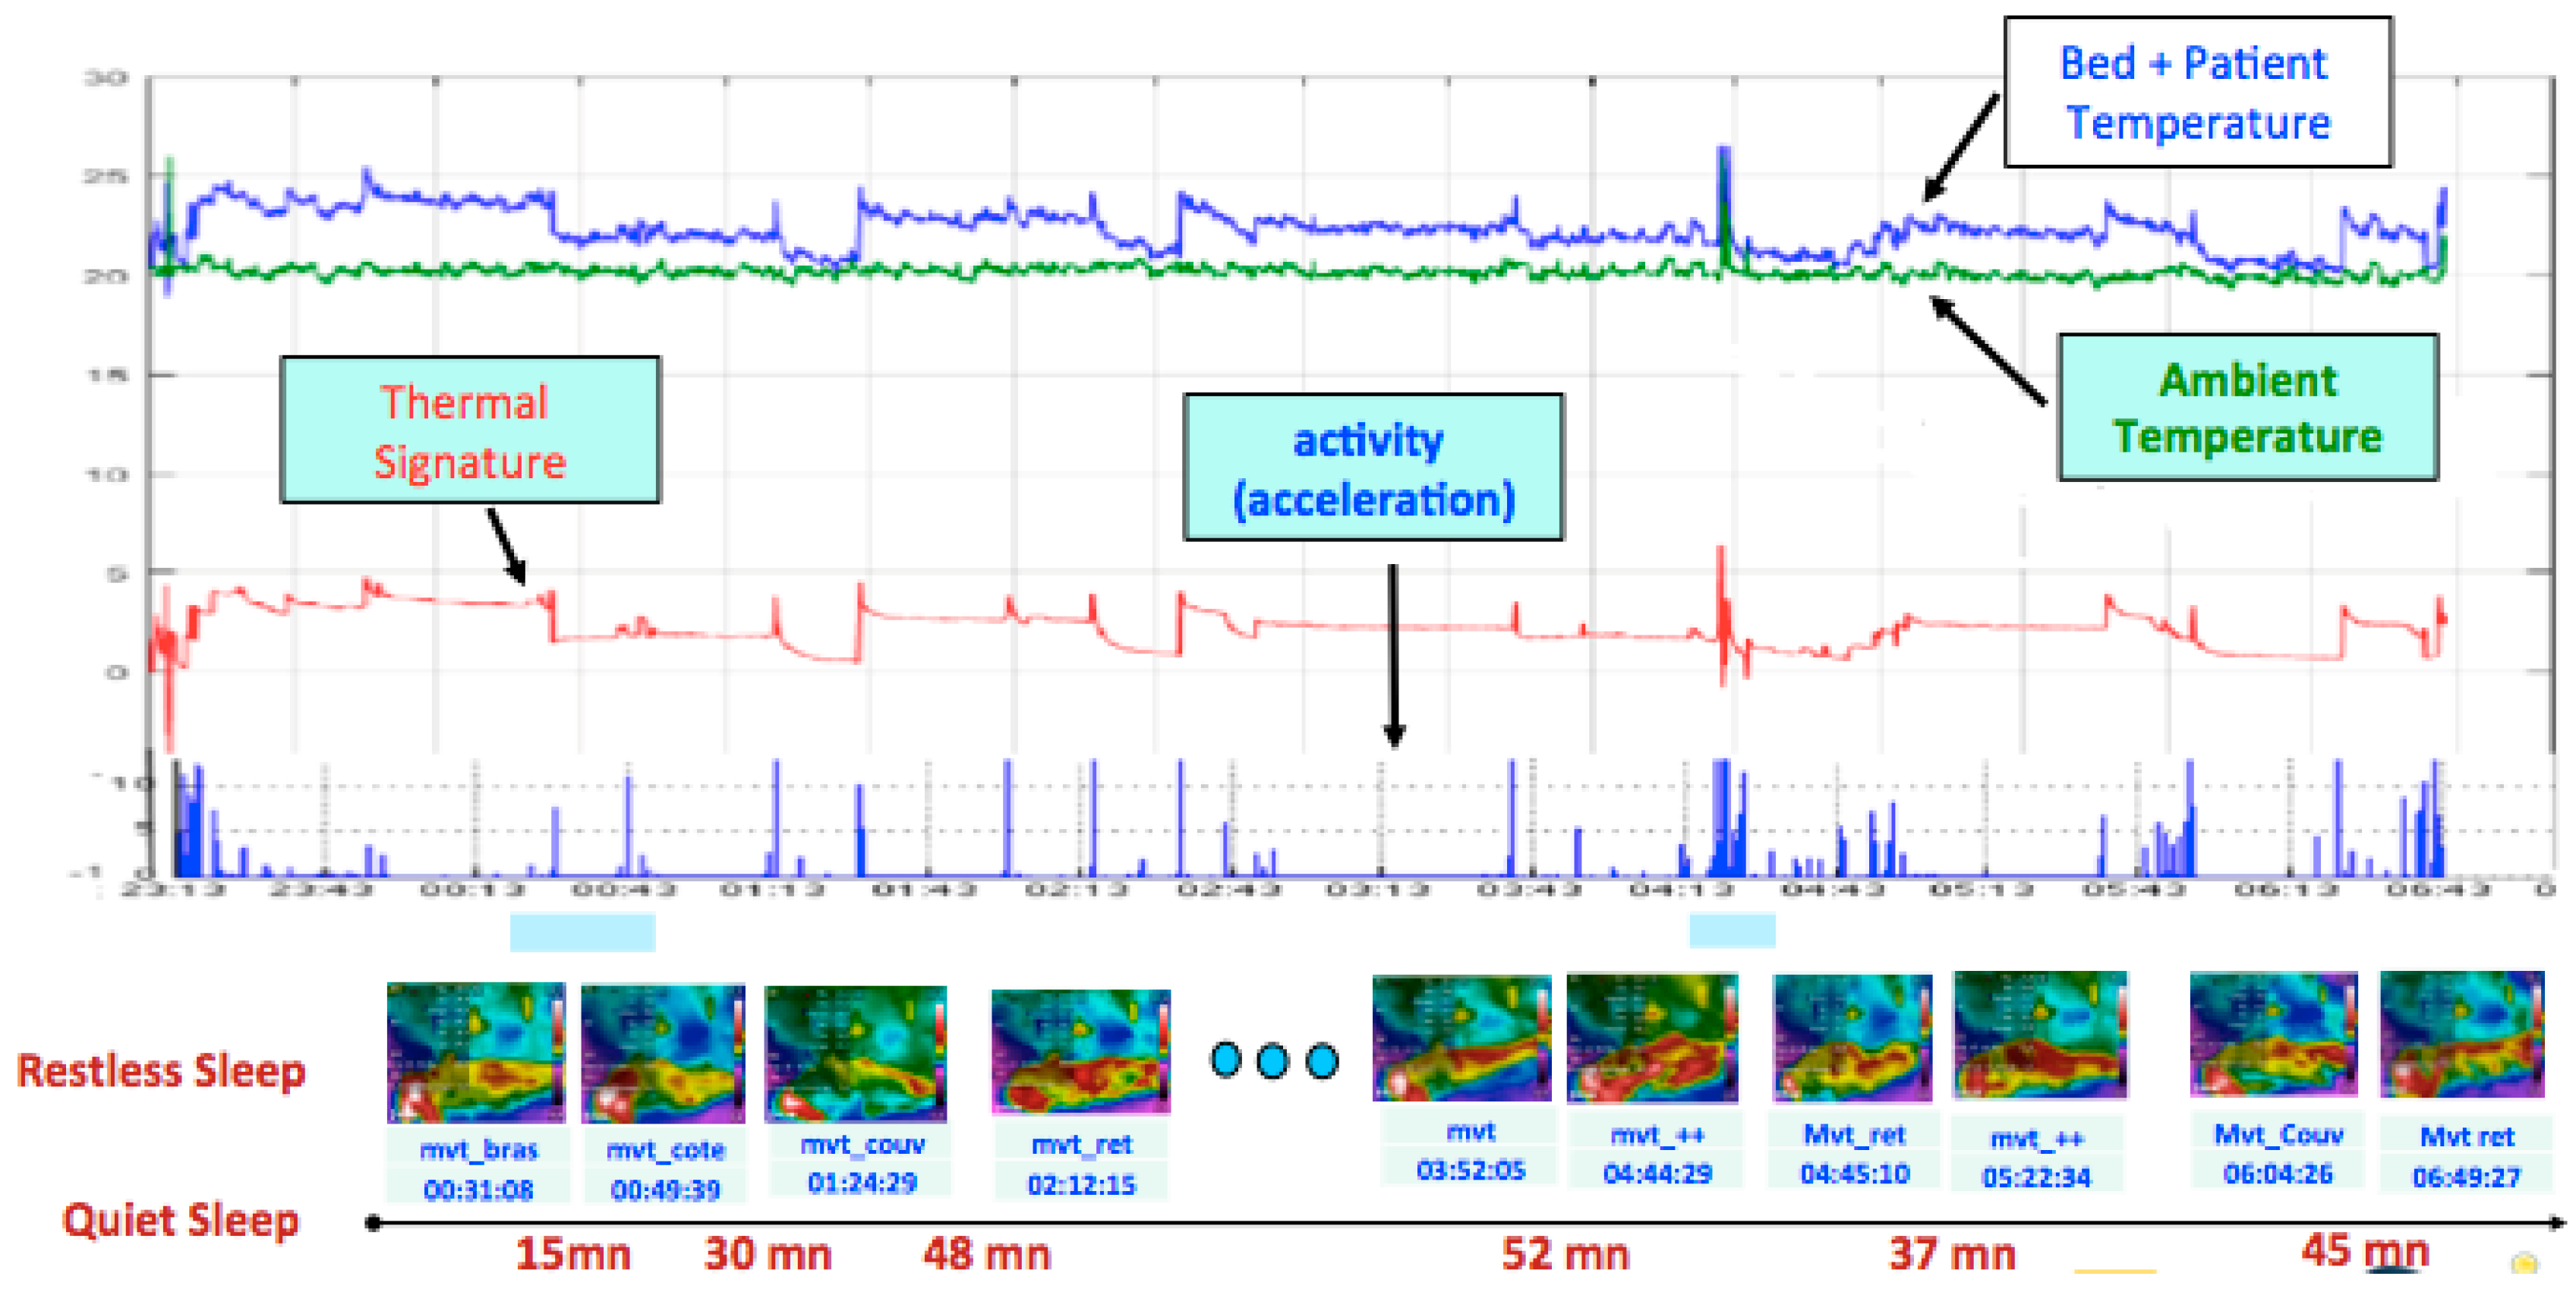
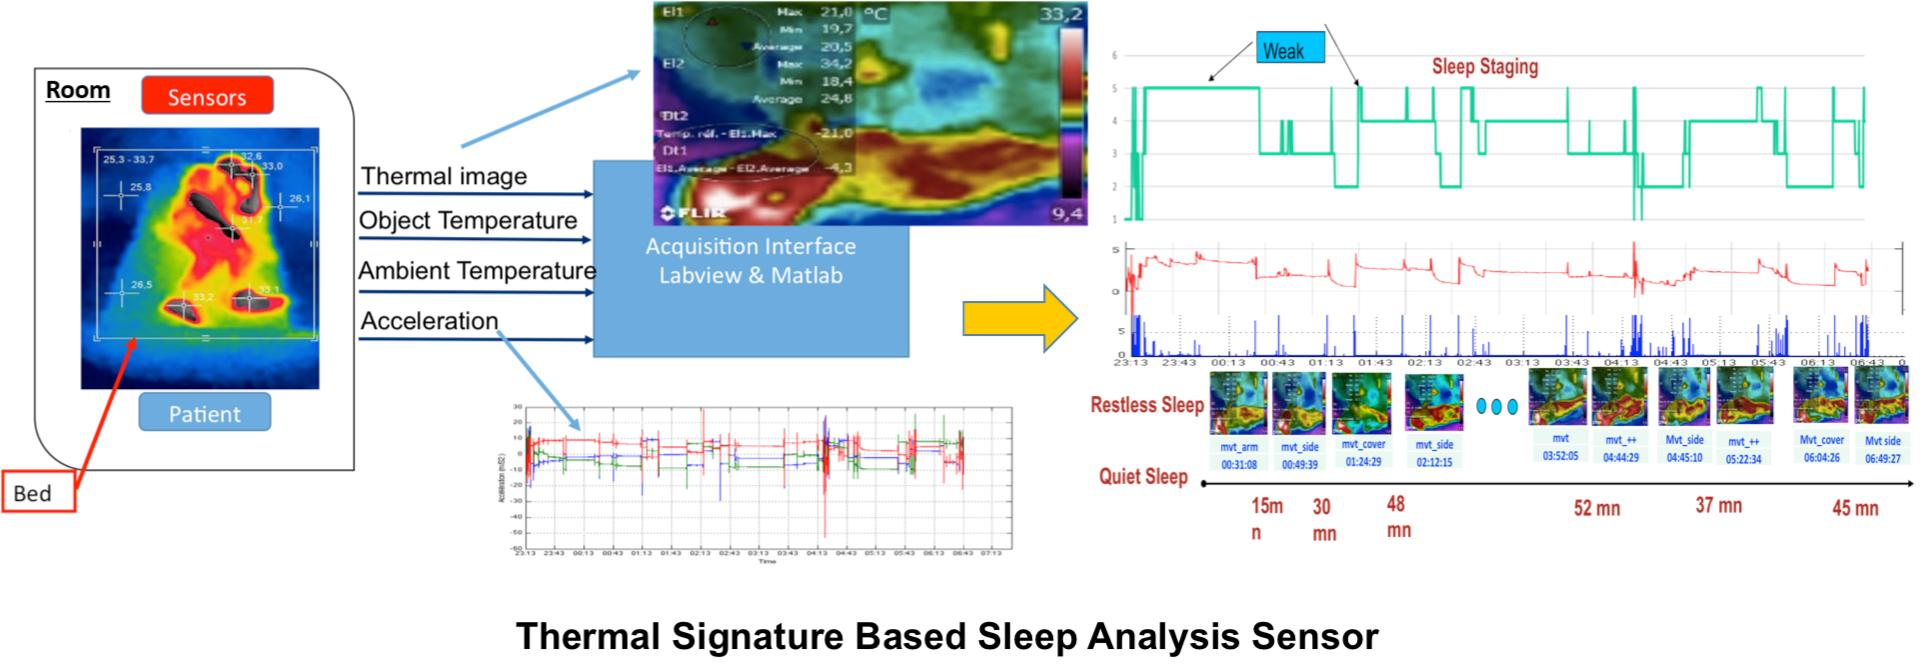
Thermal-Signature-Based Sleep Analysis Sensor


 ,
,
Abstract
:
1. Introduction
2. Materials and Methods
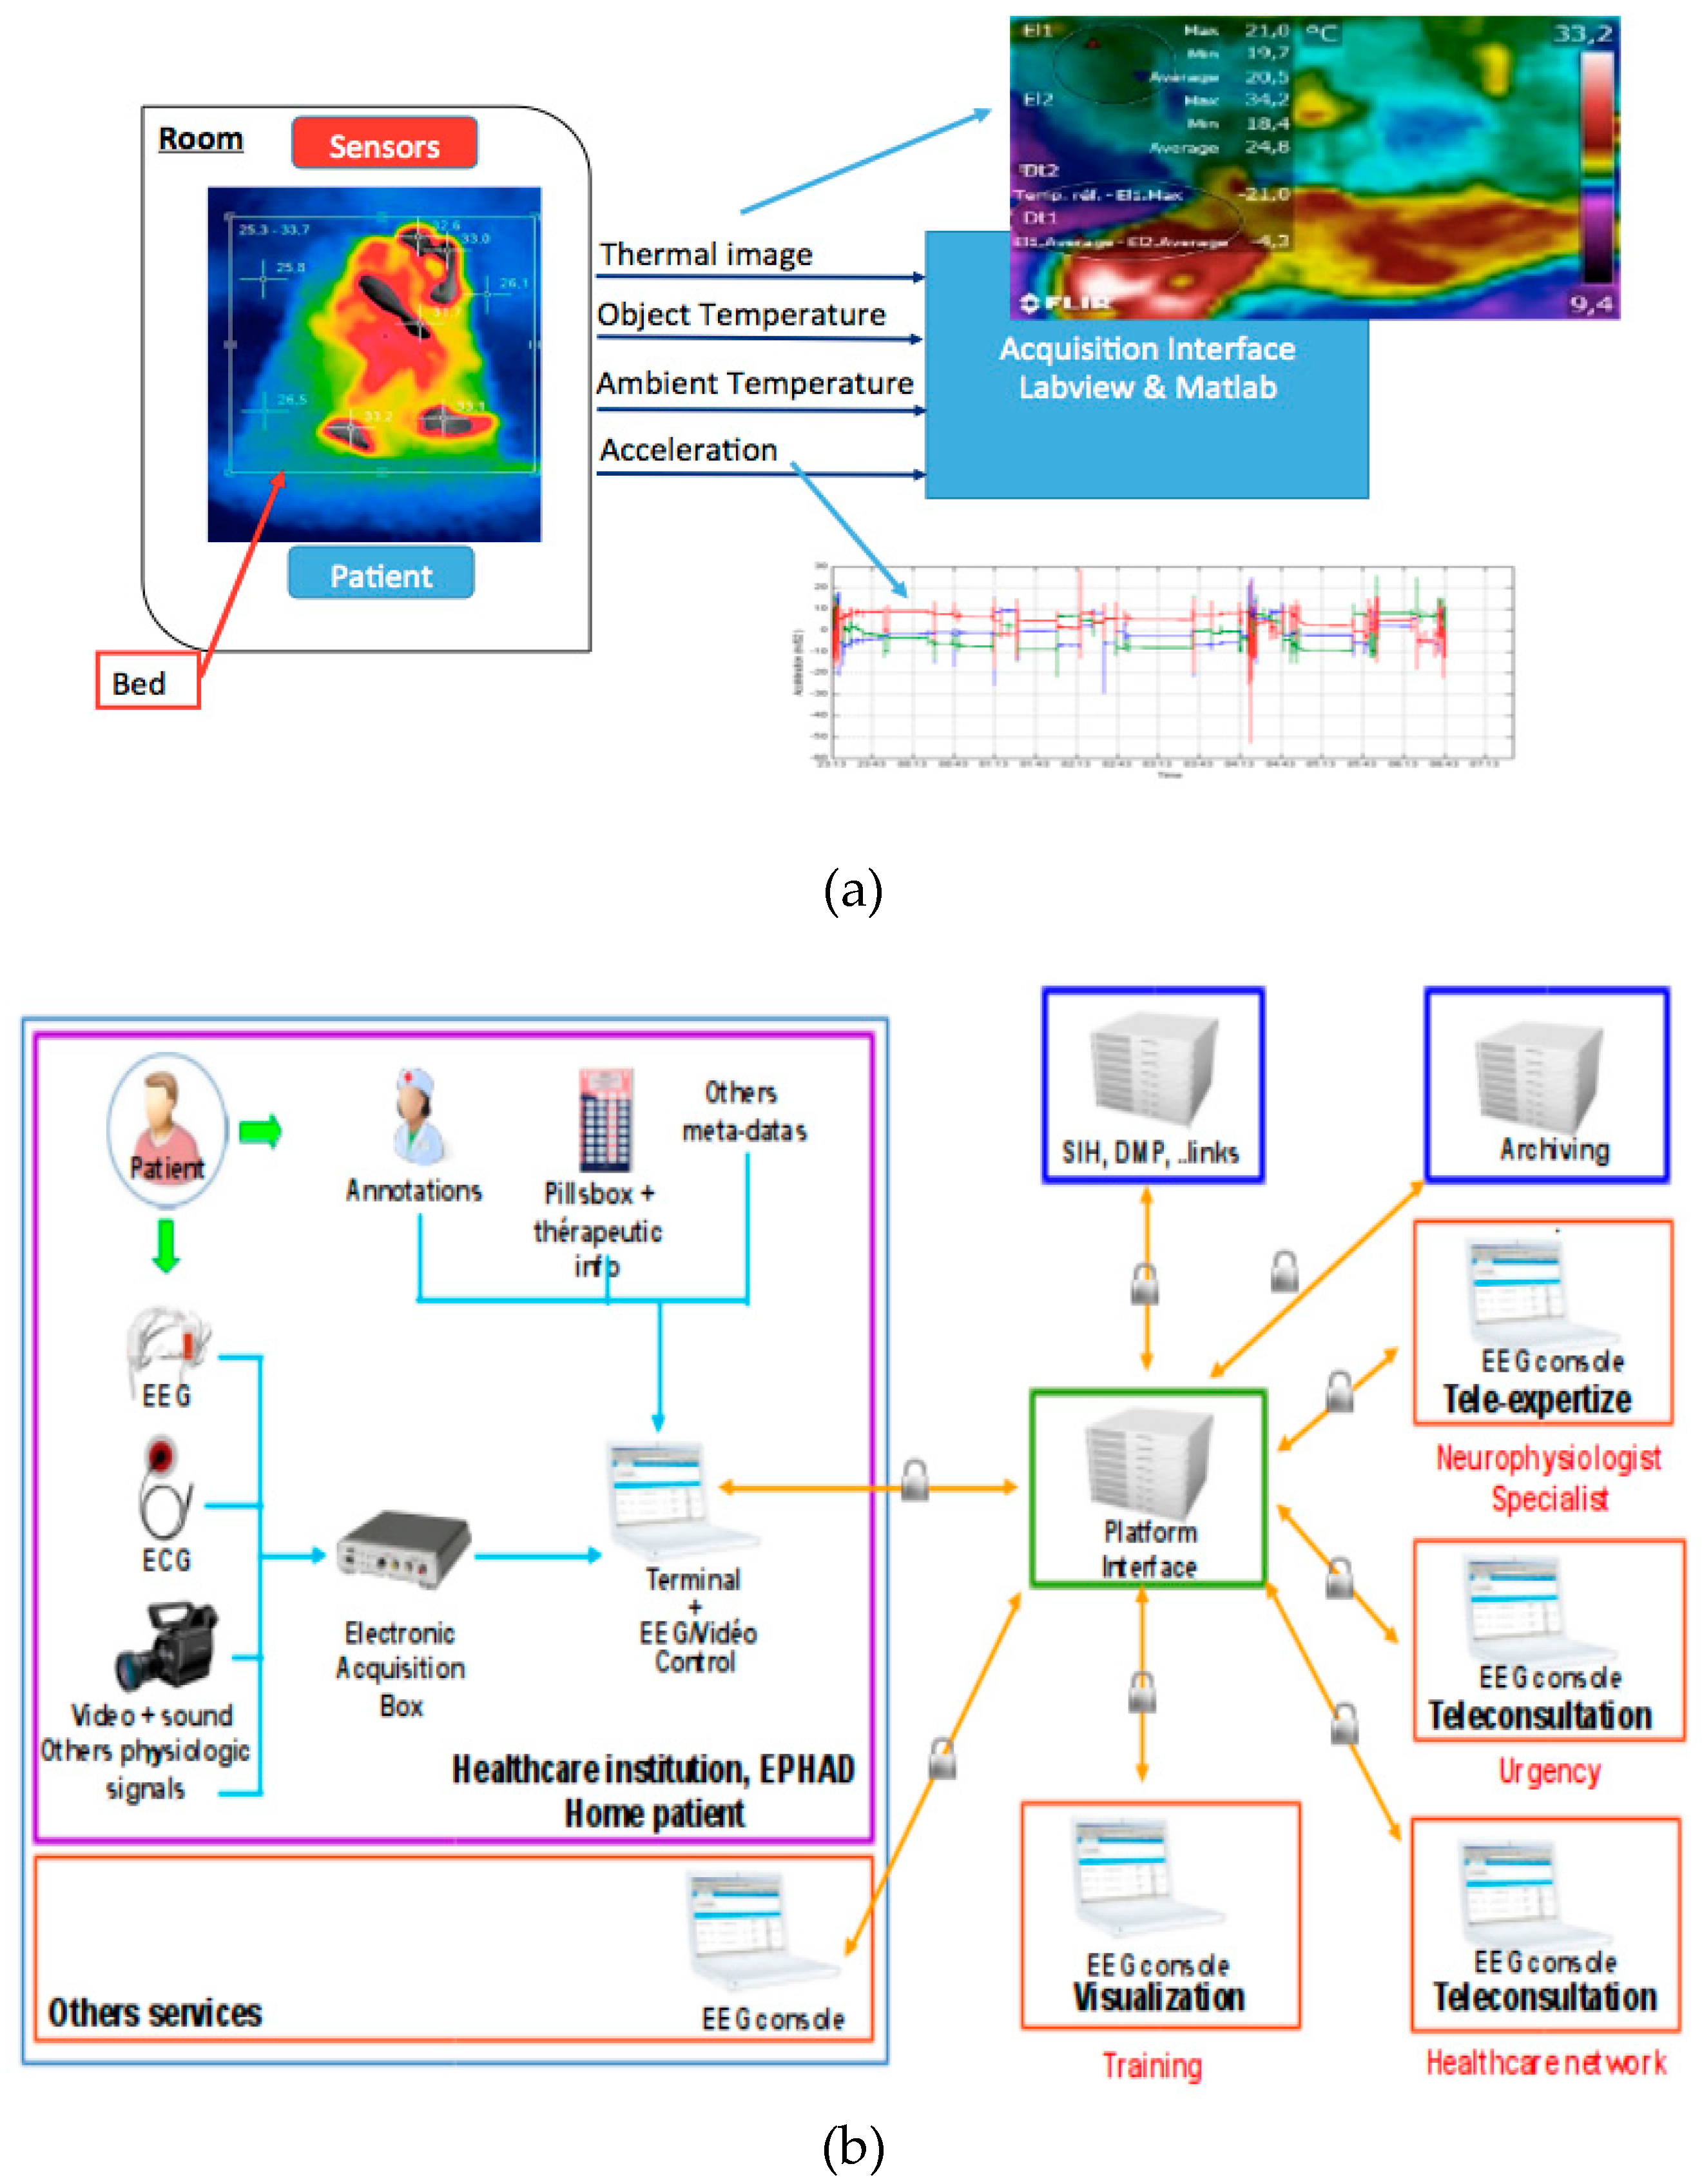
2.1. Materials
2.1.1. Sensors and Measured Quantities
2.1.2. Data Collection Protocol
Thermal Image Acquisition
Upper “Bed + Patient” Temperature
Wrist Acceleration Measurement
Wrist, Distal, and Proximal Skin Temperature Measurement
2.2. Data Processing and Interpretation
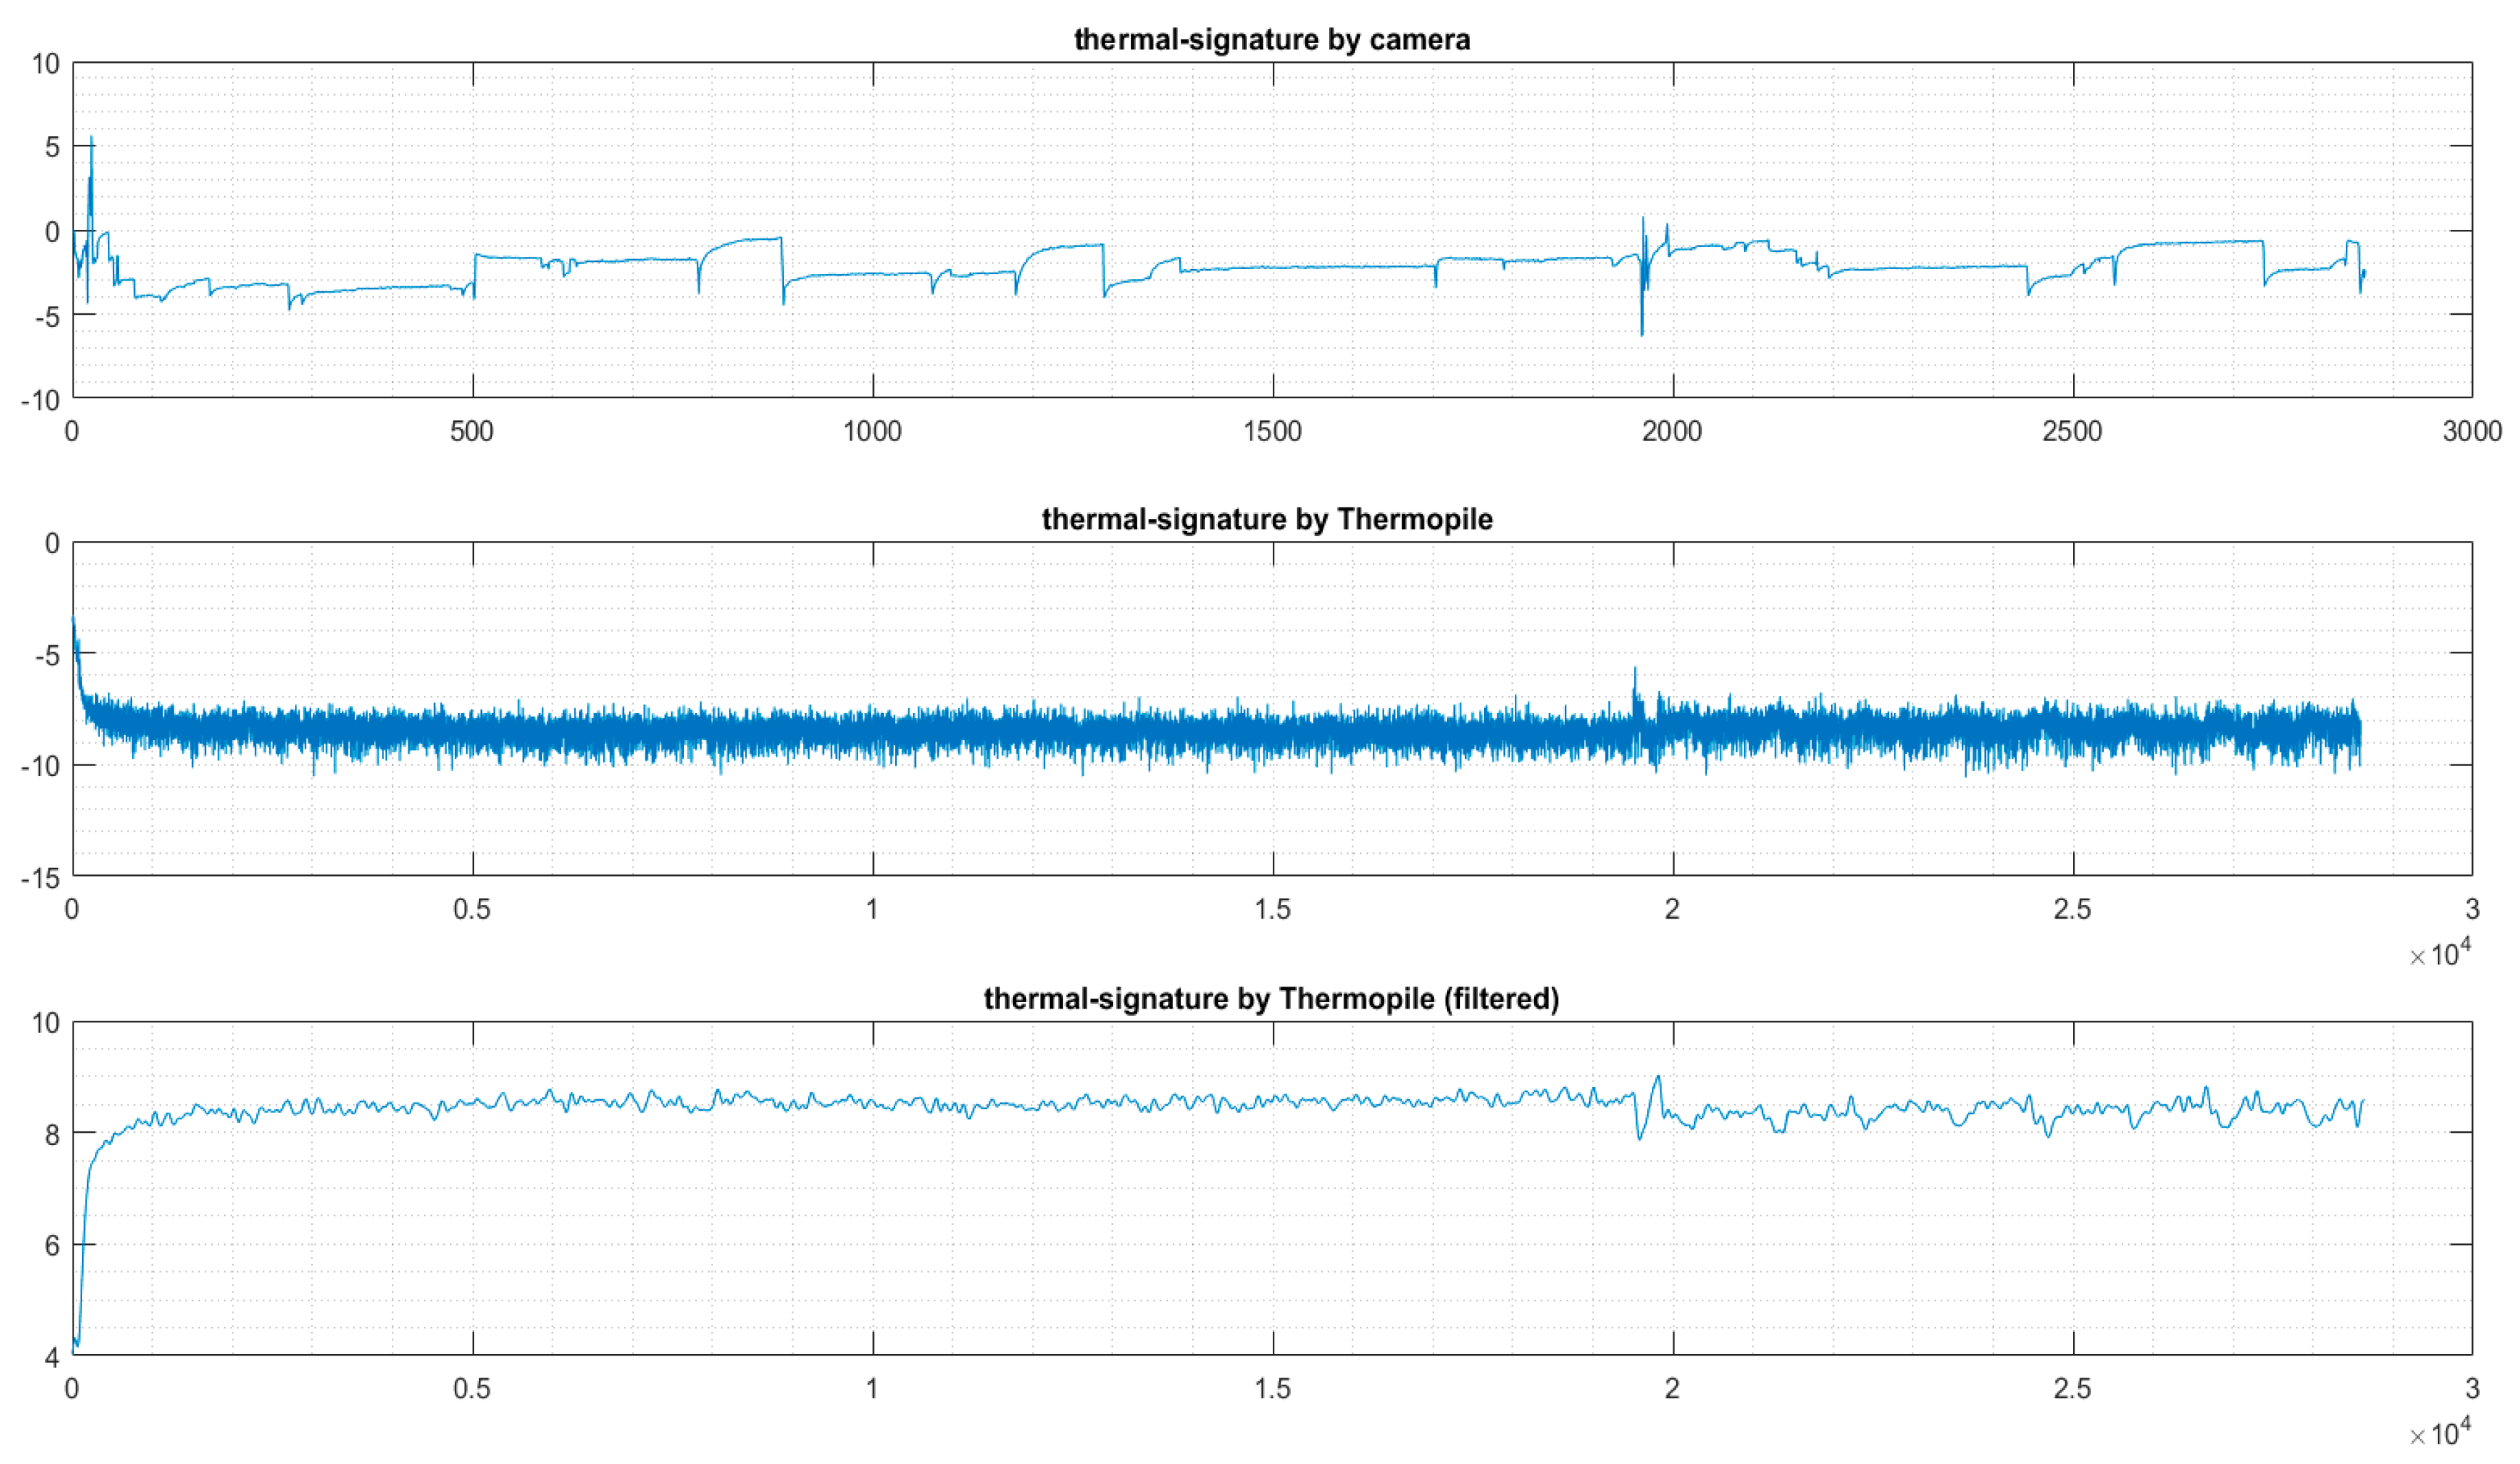
2.2.1. Features Extraction and Filtering
- 1 Hz, to operate at the same frequency as the thermopile sensor;
- 0.1 Hz, to operate at the same frequency as the thermal camera.
2.2.2. Data Clustering and Classification
3. Results
3.1. The Collected Data
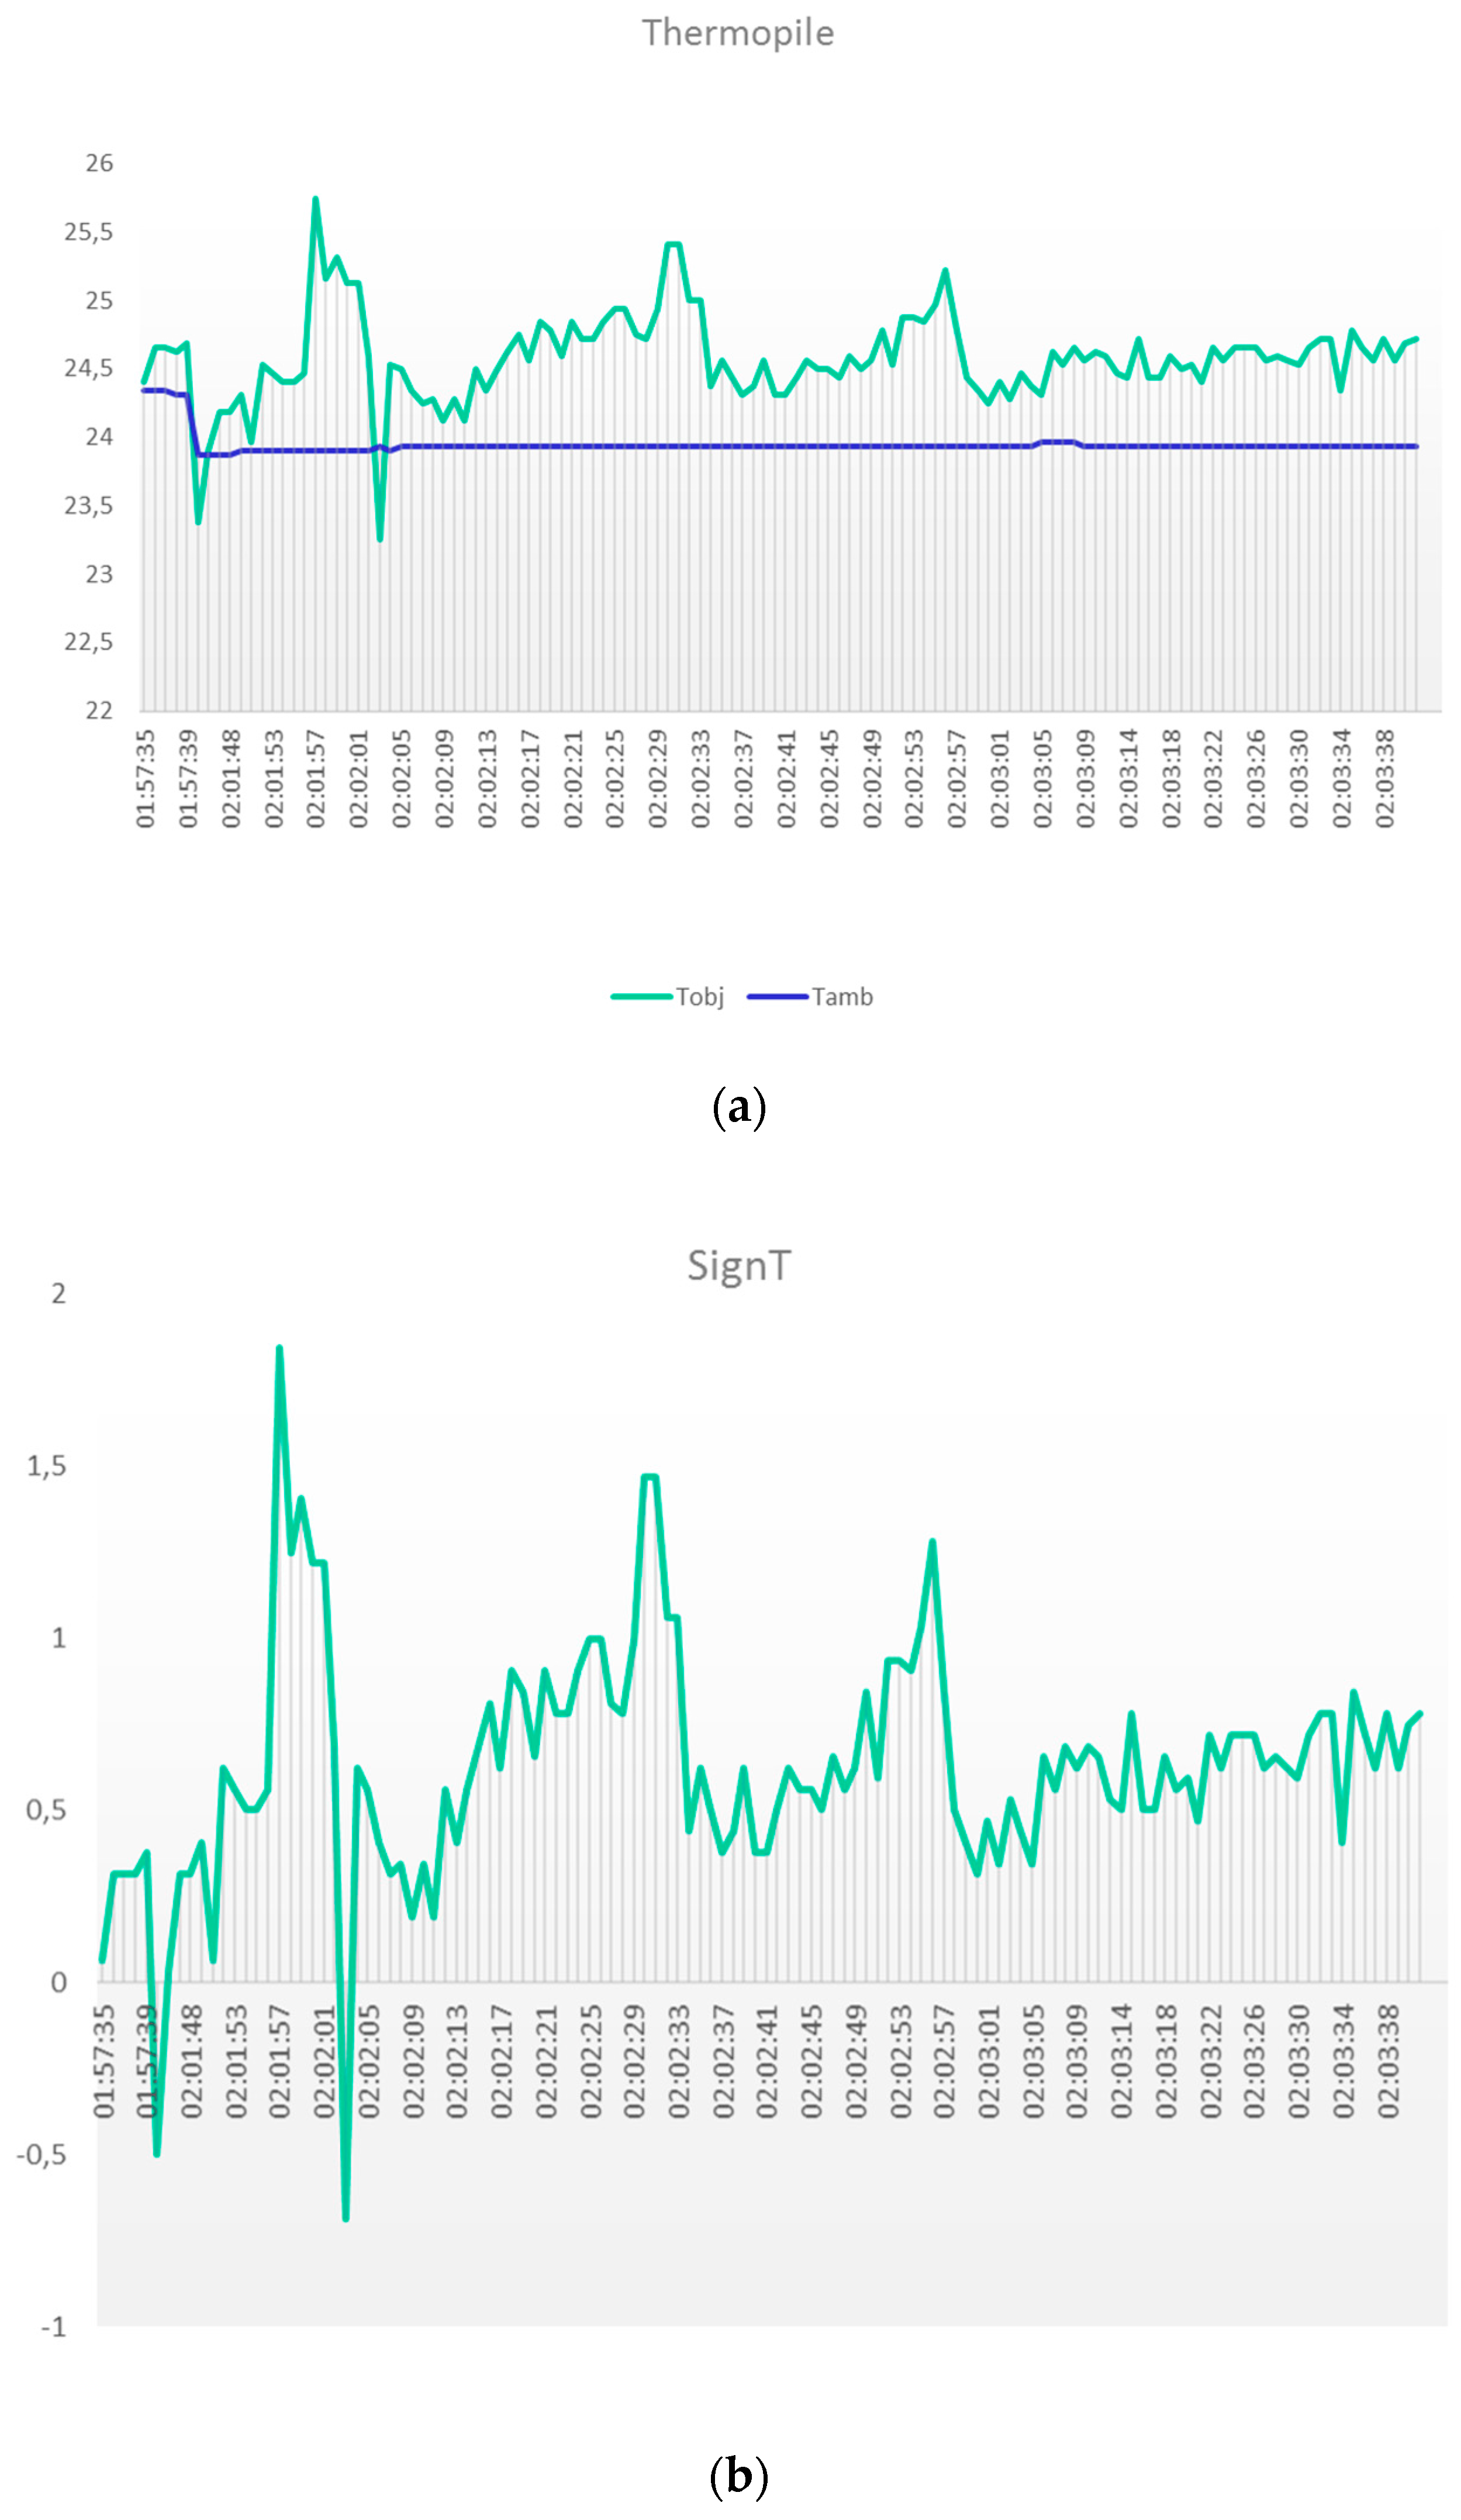
3.1.1 Thermal Temperature
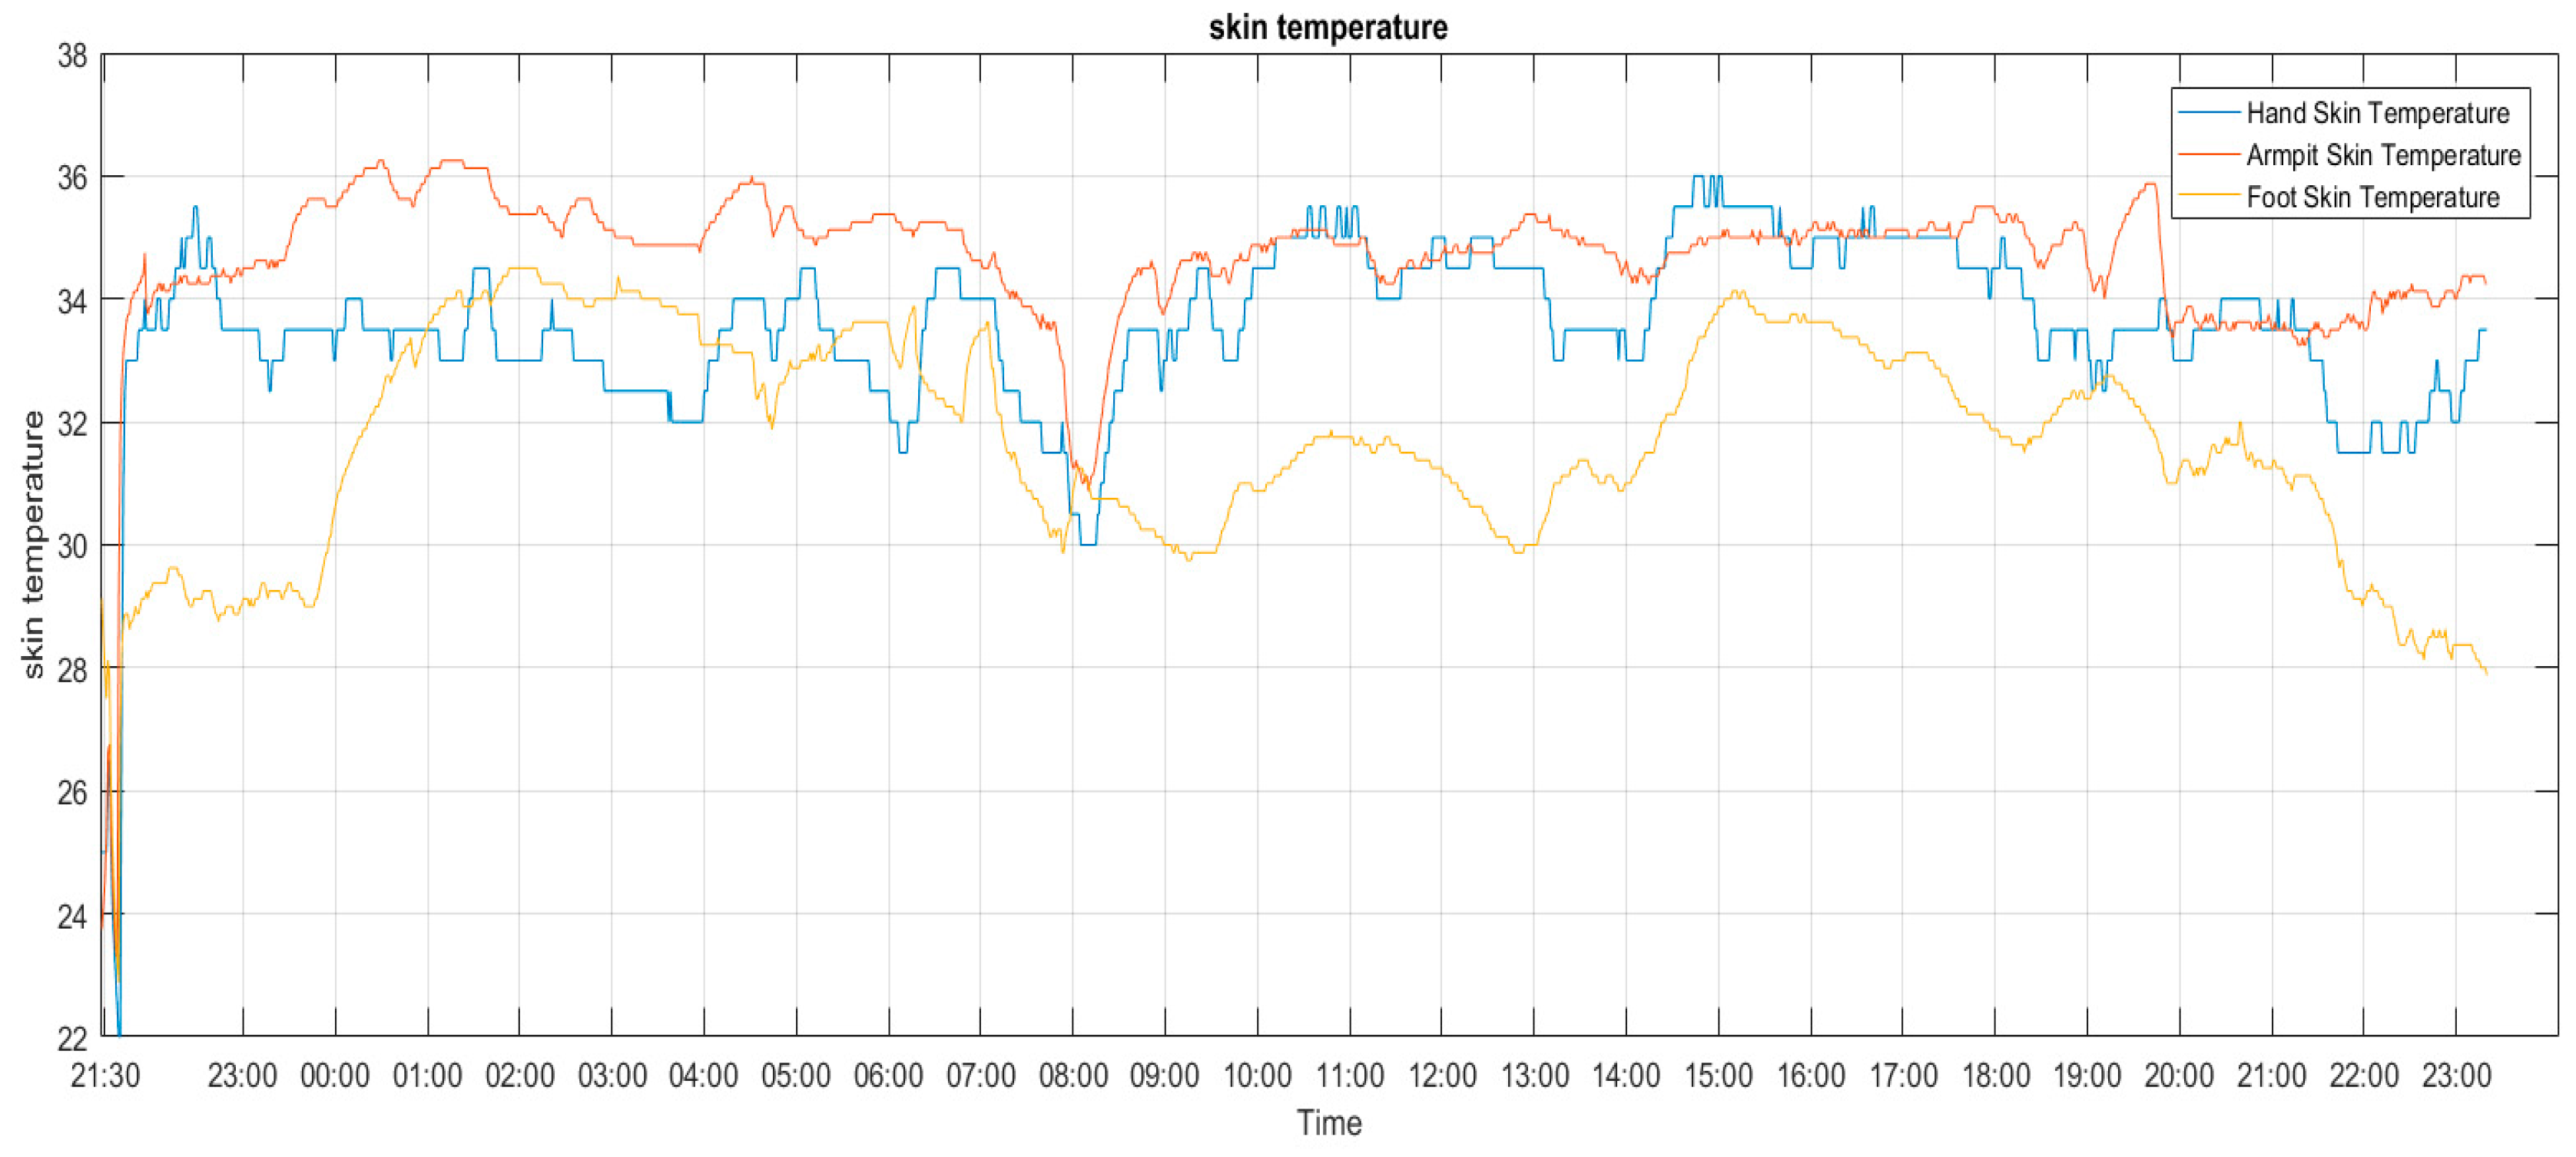
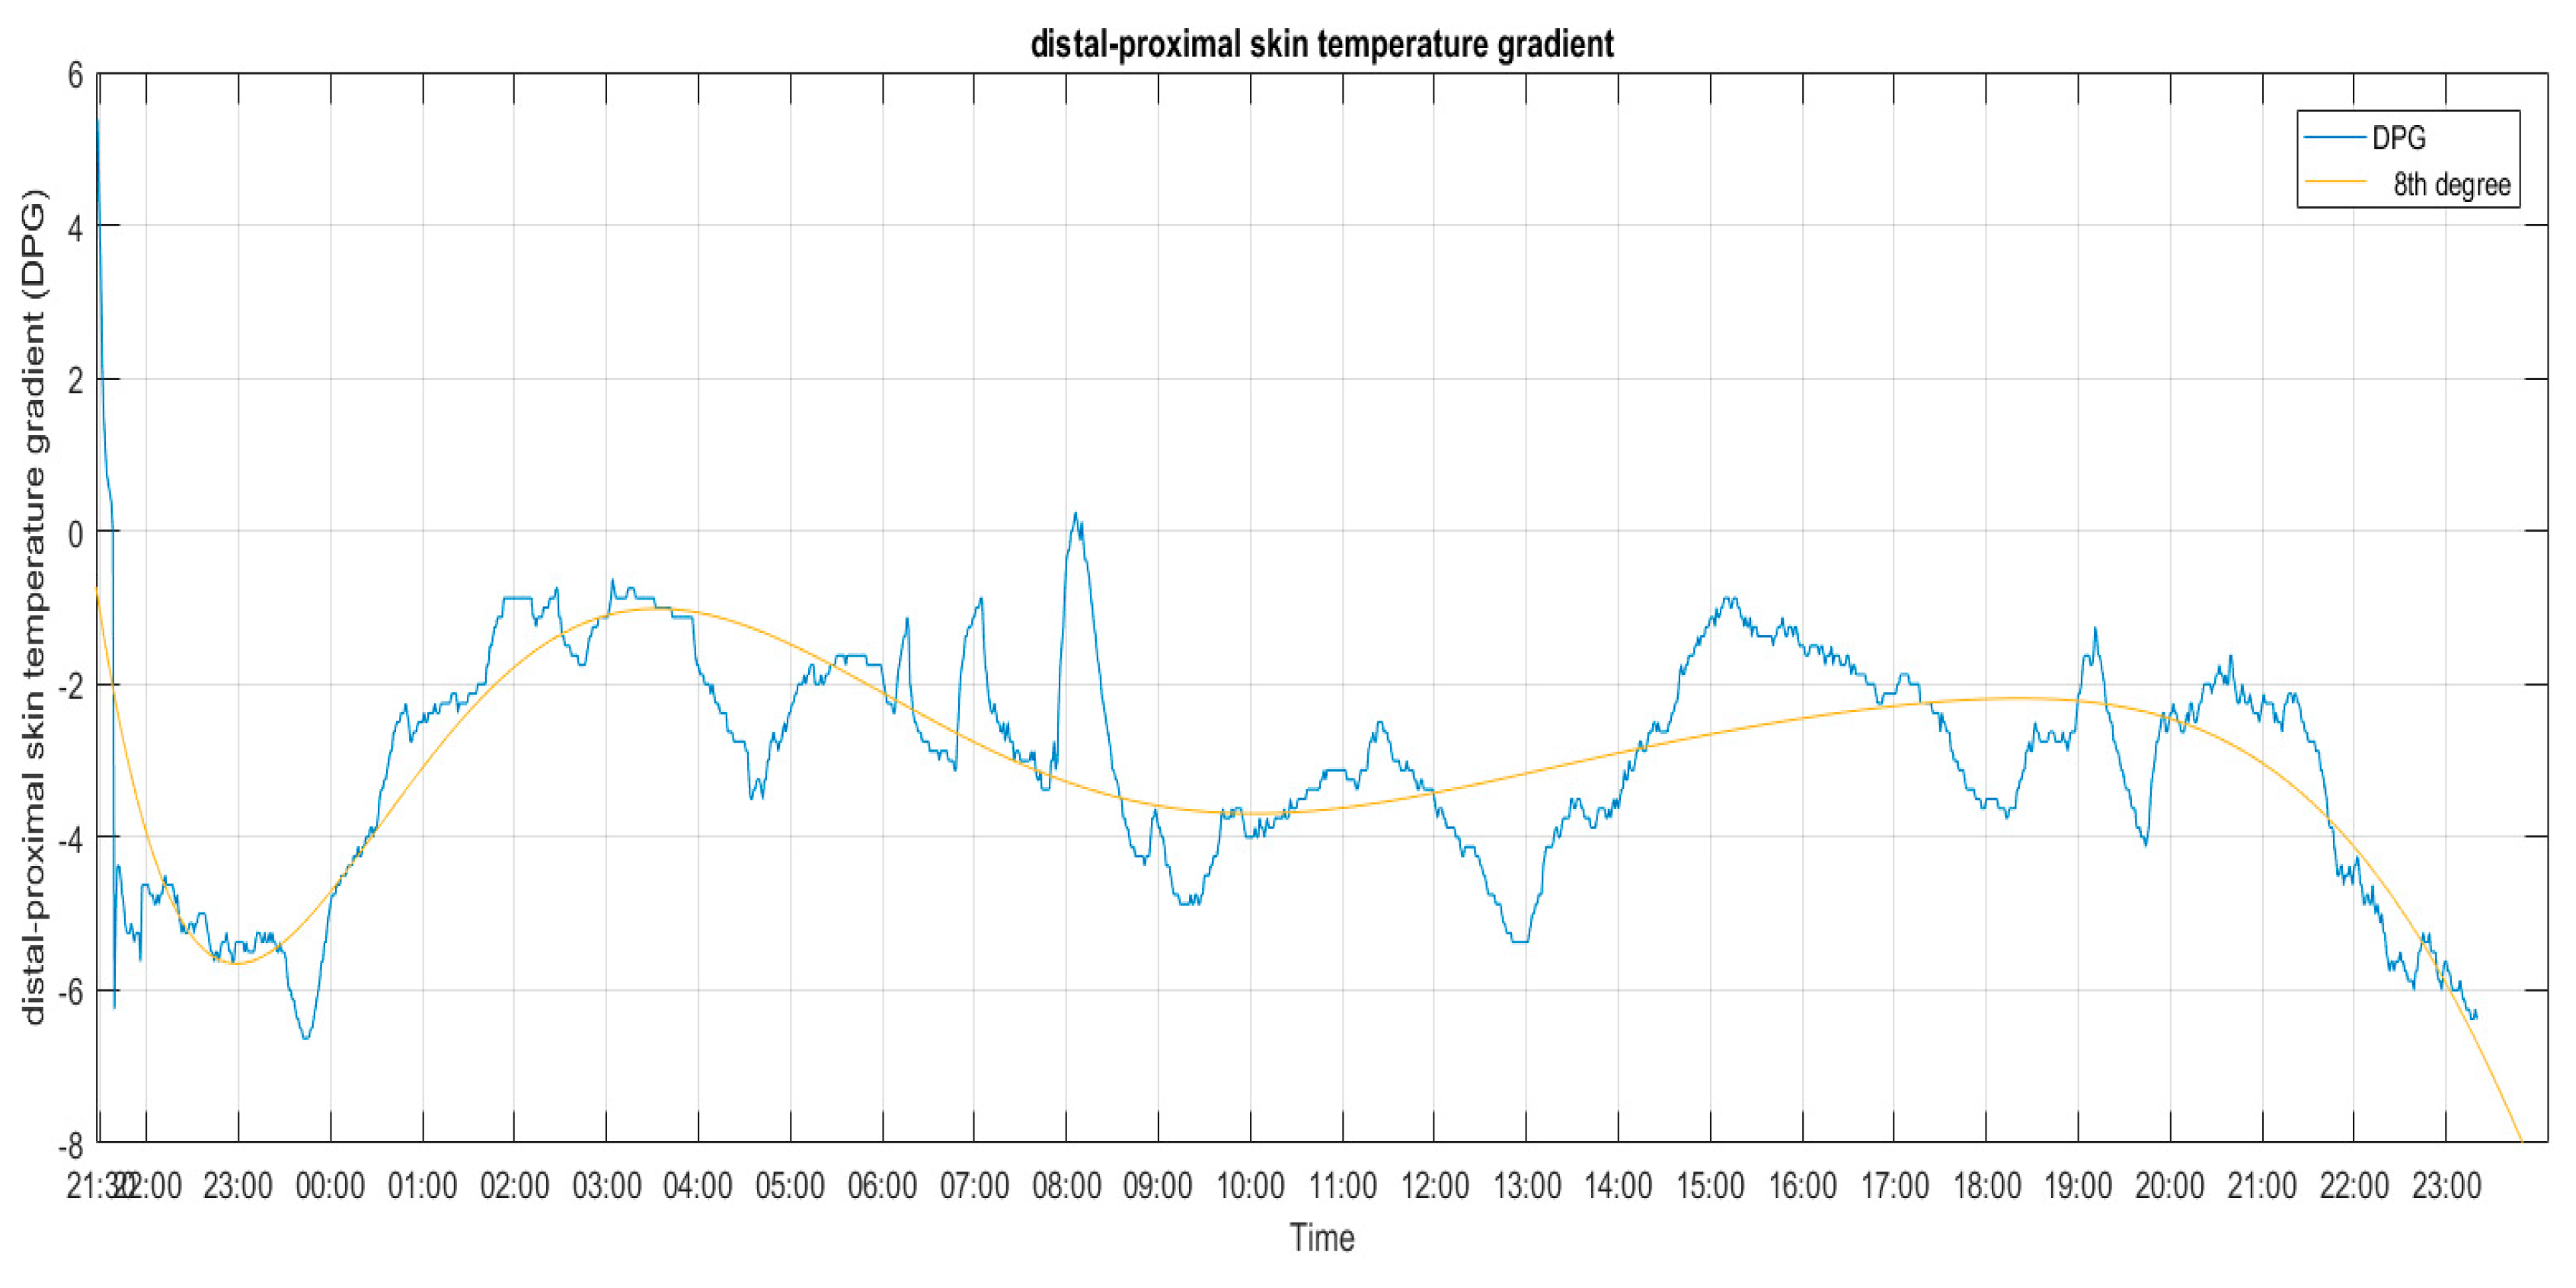
3.1.2. Skin Temperature
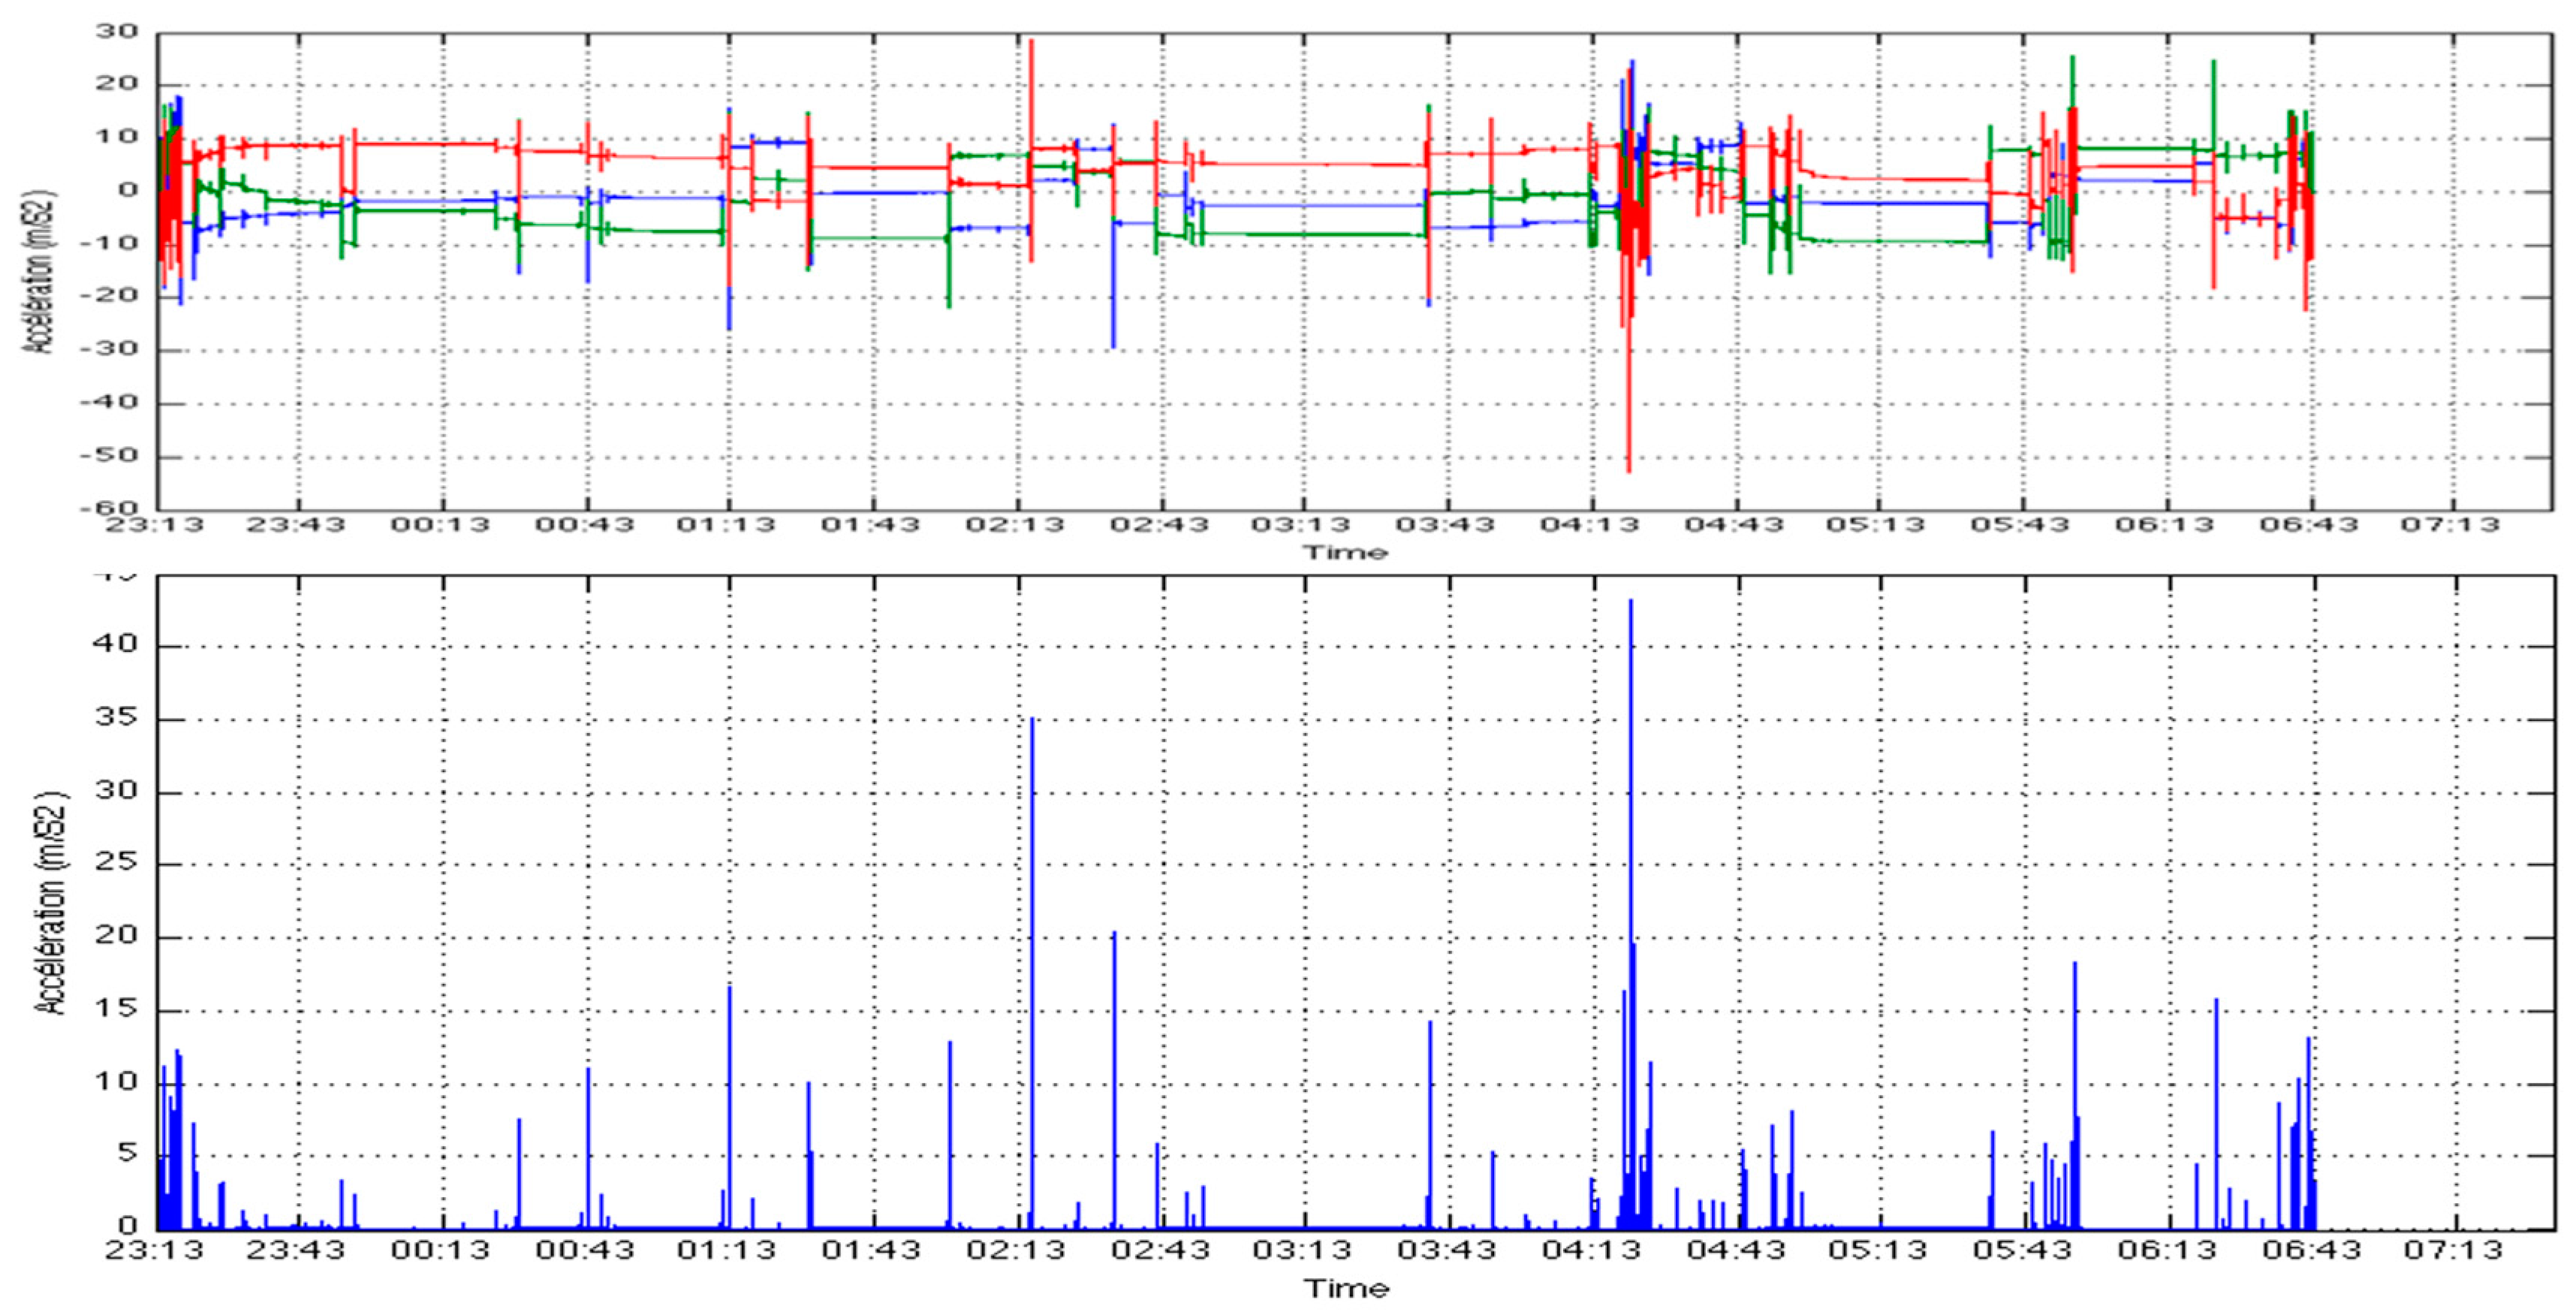
3.1.3. Acceleration Module
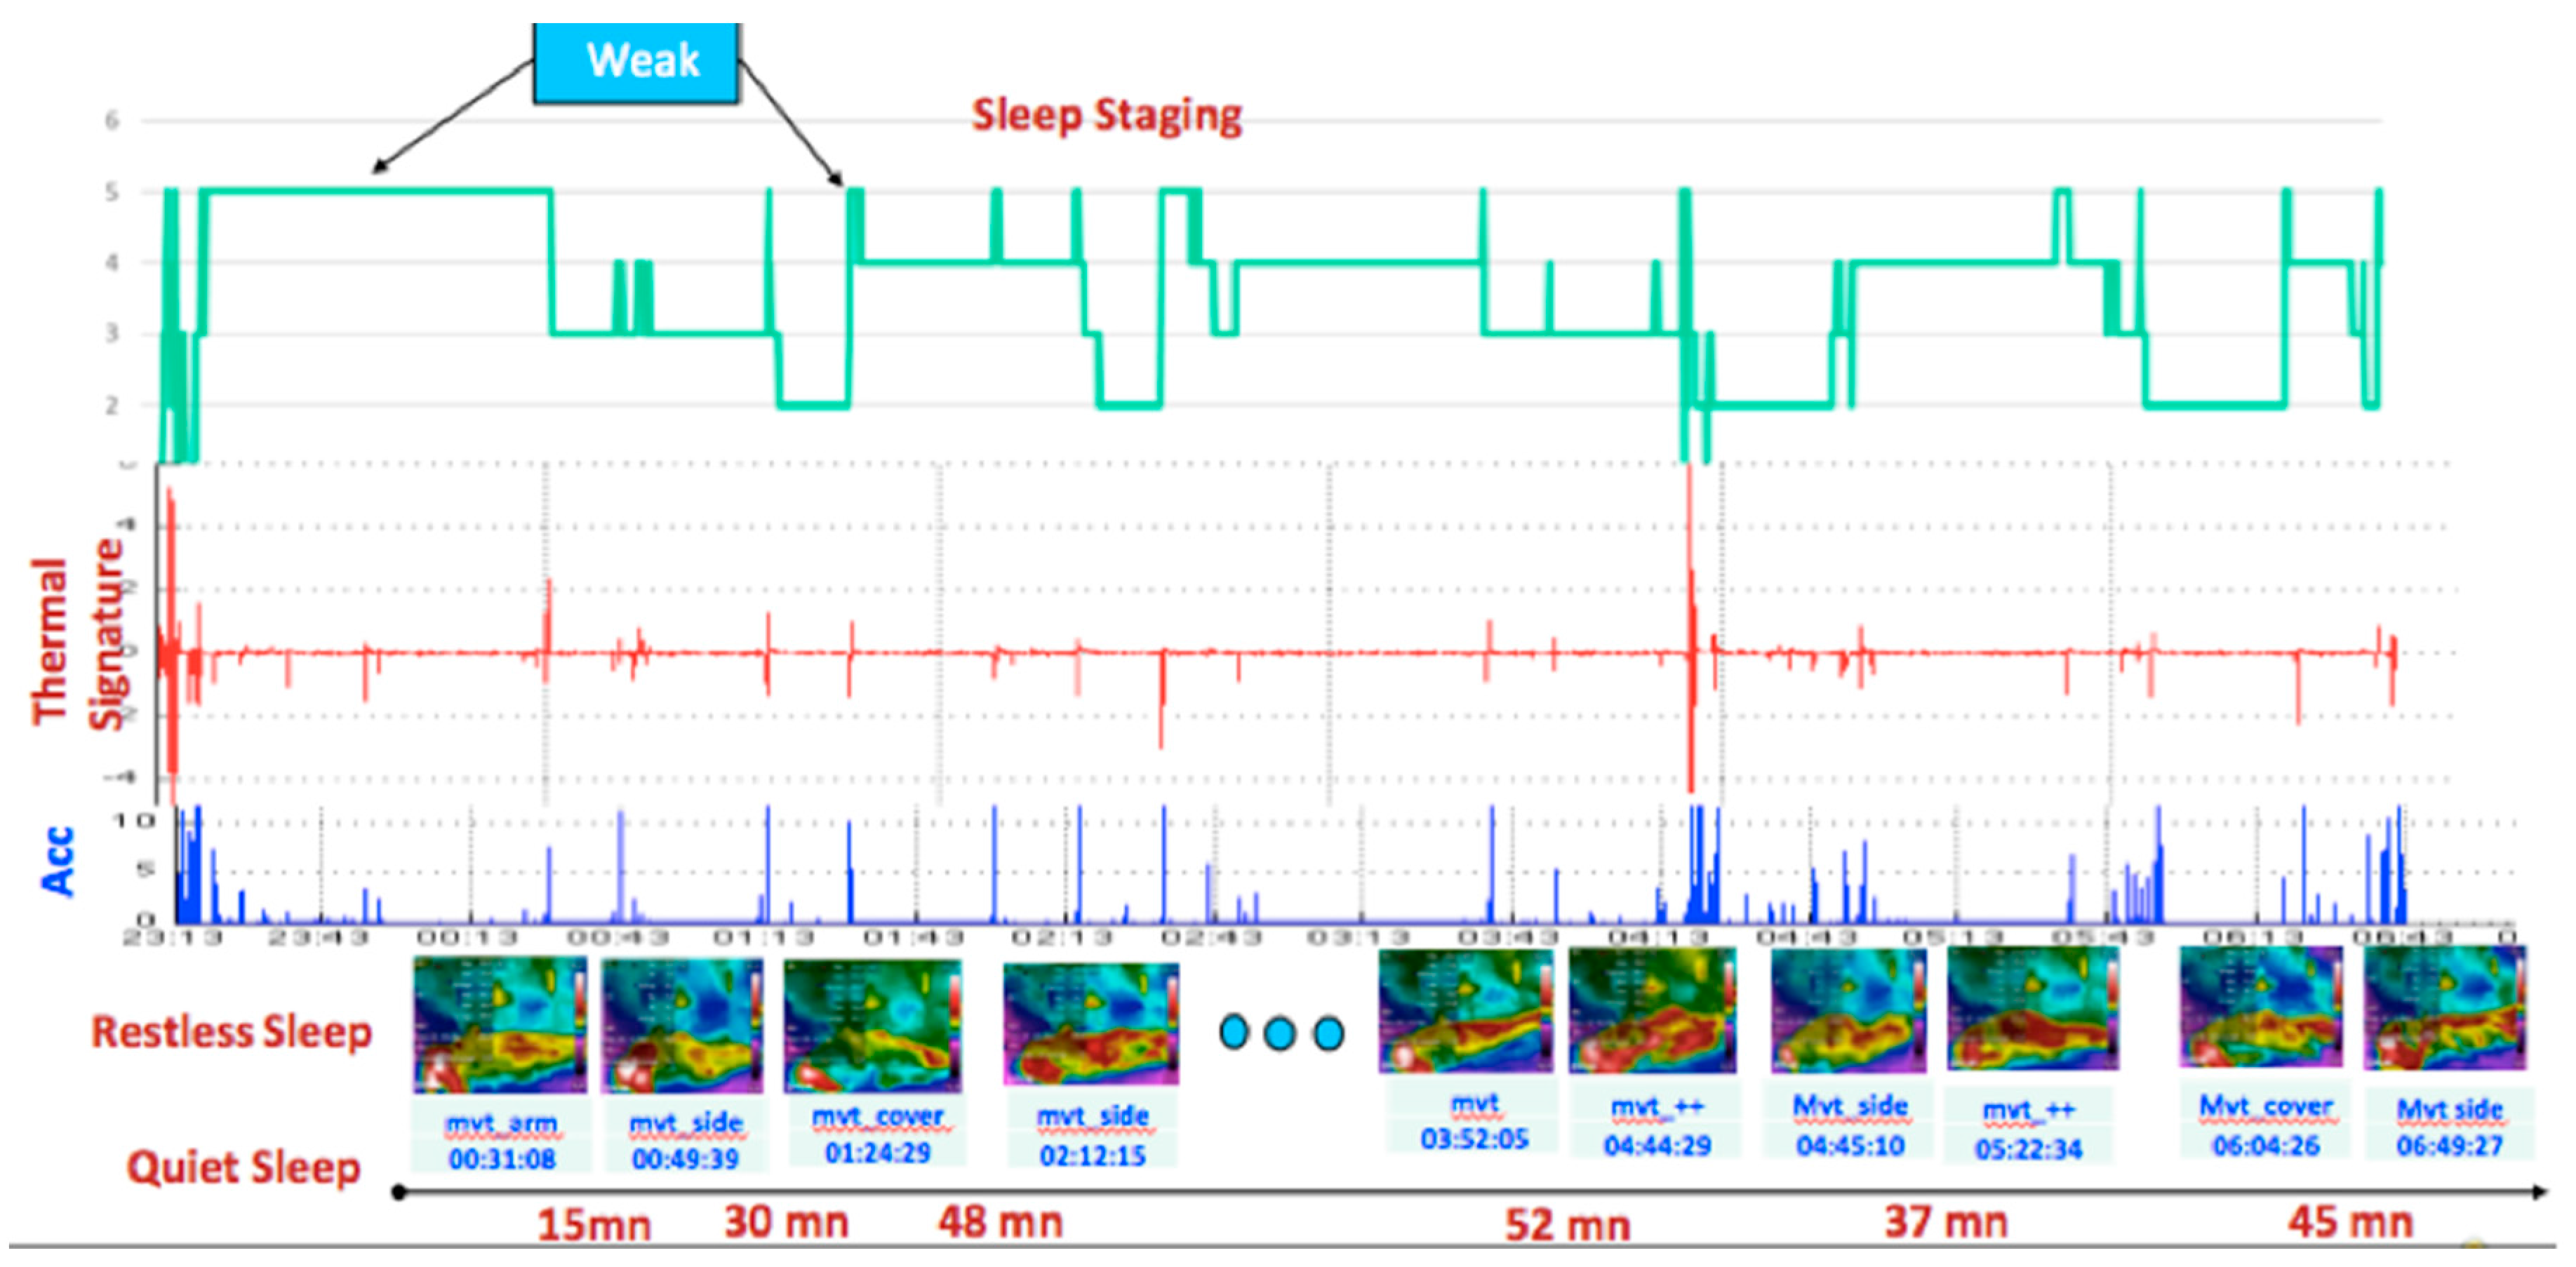
3.2. Comparison of Thermal Radiation and Actigraphy
3.3. K-Means Classification of Data Collected Overnight
4. Discussion and Conclusions
Supplementary Materials
Acknowledgments
Author Contributions
Conflicts of Interest
References
- Moore, P.J.; Adler, N.E.; Williams, D.R.; Jackson, J.S. Socioeconomic status and health: The role of sleep. Psychosom. Med. 2002, 64, 337–344. [Google Scholar] [CrossRef] [PubMed]
- Cardinali, D.; Esquifino, A. Sleep and the immune system. Curr. Immunol. Rev. 2012, 8, 50–62. [Google Scholar] [CrossRef]
- Kamdar, B.; Needham, D.; Collop, N. Sleep deprivation in critical illness: Its role in physical and psychological recovery. J. Intensive Care Med. 2012, 27, 97–111. [Google Scholar] [CrossRef] [PubMed]
- Diekelmann, S.; Born, J. The memory function of sleep. Nat. Rev. Neurosci. 2010, 11, 114–126. [Google Scholar] [CrossRef] [PubMed]
- Giuditta, A.; Ambrosini, M.V.; Montagnese, P.; Mandile, P.; Cotugno, M.; Zucconi, G.G.; Vescia, S. The sequential hypothesis of the function of sleep. Behav. Brain Res. 1995, 69, 157–166. [Google Scholar] [CrossRef]
- Kishi, A.; Yasuda, H.; Matsumoto, T.; Inami, Y.; Horiguchi, J.; Tamaki, M.; Struzik, ZR.; Yamamoto, Y. NREM sleep stage transitions control ultradian REM sleep rhythm. Sleep 2011, 34, 1423–1432. [Google Scholar] [CrossRef] [PubMed]
- Carskadon, M.A.; Dement, W.C. Normal human sleep: An overview. Princ. Pract. Sleep Med. 2005, 4, 13–23. [Google Scholar]
- Saper, C.B.; Scammell, T.E.; Lu, J. Hypothalamic regulation of sleep and circadian rhythms. Nature 2005, 437, 1257–1263. [Google Scholar] [CrossRef] [PubMed]
- Roebuck, A.; Monasterio, V.; Gederi, E.; Osipov, M.; Behar, J.; Malhotra, A.; Penzel, T.; Clifford, G.D. A review of signals used in sleep analysis. Physiol. Meas. 2013, 35, R1–R57. [Google Scholar] [CrossRef] [PubMed]
- Schulz, H. Rethinking sleep analysis. J. Clin. Sleep Med. 2008, 4, 99–103. [Google Scholar] [PubMed]
- Rechtschaffen, A.; Kales, A. A manual of standardized terminology, techniques and scoring system for sleep stages of human subjects. Clin. Neurophysiol. 1969, 26, 644. [Google Scholar] [CrossRef]
- Berry, R.B.; Brooks, R.; Gamaldo, C.E.; Harding, S.M.; Marcus, C.L.; Vaughn, B.V. The AASM Manual for the Scoring of Sleep and Associated Events: Rules, Terminology and Technical Specifications; American Academy of Sleep Medicine: Darien, IL, USA, 2012. [Google Scholar]
- Iber, C.; Ancoli-Israel, S.; Chesson, A.; Quan, S.F. The AASM Manual for the Scoring of Sleep and Associated Events: Rules, Terminology and Technical Specifications (Vol. 1); American Academy of Sleep Medicine: Westchester, IL, USA, 2007. [Google Scholar]
- Rosenberg, R.S.; Van Hout, S. The American Academy of Sleep Medicine inter-scorer reliability program: Sleep stage scoring. J. Clin. Sleep Med. 2013, 9, 81–87. [Google Scholar] [CrossRef] [PubMed]
- Agarwal, R.; Gotman, J. Computer-assisted sleep staging. IEEE Trans. Biomed. Eng. 2001, 48, 1412–1423. [Google Scholar] [CrossRef] [PubMed]
- Chen, C.; Ugon, A.; Zhang, X.; Amara, A.; Garda, P.; Ganascia, J.G.; Philippe, C.; Pinna, A. Personalized sleep-staging system using evolutionary algorithm and symbolic fusion. In Proceedings of the 2016 38th Annual International Conference of the IEEE Engineering in Medicine and Biology Society (EMBC), Orlando, FL, USA, 16–20 August 2016; pp. 2266–2269. [Google Scholar]
- Silber, M.H.; Ancoli-Israel, S.; Bonnet, M.H.; Chokroverty, S.; Grigg-Damberger, M.M.; Hirshkowitz, M.; Kapen, S.; Keenan, S.A.; Kryger, M.H.; Penzel, T.; et al. The visual scoring of sleep in adults. J. Clin. Sleep Med. 2007, 3, 121–131. [Google Scholar] [PubMed]
- Cole, R.; Kripke, D.F.; Gruen, W.; Mullaney, D.J.; Gillin, J.C. Automatic sleep/wake identification from wrist activity. Sleep 1992, 15, 461–469. [Google Scholar] [PubMed]
- Choi, B.H.; Seo, J.W.; Choi, J.M.; Shin, H.B.; Lee, J.Y.; Jeong, D.U.; Park, K.S. Non-constraining sleep/wake monitoring system using bed actigraphy. Med. Biol. Eng. Comput. 2007, 45, 107–114. [Google Scholar]
- Sano, A.; Picard, R.W.; Stickgold, R. Quantitative Analysis of Wrist electrodermal activity during sleep. Int. J. Psychophysiol. 2014, 94, 382–389. [Google Scholar] [CrossRef] [PubMed]
- Ancoli-Israel, S.; Cole, R.; Alessi, C.; Chambers, M.; Moorcroft, W.; Pollak, C.P. The role of actigraphy in the study of sleep and circadian rhythms. Sleep 2003, 26, 342–392. [Google Scholar] [CrossRef] [PubMed]
- Heinrich, A.; Aubert, X.; De Haan, G. Body movement analysis during sleep based on video motion estimation. In Proceedings of the 2013 IEEE 15th International Conference on e-Health Networking, Applications and Services (Healthcom 2013), Lisbon, Portugal, 9–12 October 2013. [Google Scholar]
- Ortiz-Tudela, E.; Martinez-Nicolas, A.; Campos, M.; Rol, M.Á.; Madrid, J.A. A new integrated variable based on thermometry, actimetry and body position (TAP) to evaluate circadian system status in humans. PLoS Comput. Biol. 2010, 6, e1000996. [Google Scholar] [CrossRef] [PubMed]
- Ortiz-Tudela, E.; Martinez-Nicolas, A.; Albares, J.; Segarra, F.; Campos, M.; Estivill, E.; Madrid, J.A. Ambulatory circadian monitoring (ACM) based on thermometry, motor activity and body position (TAP): A comparison with polysomnography. Physiol. Behav. 2014, 126, 30–38. [Google Scholar] [CrossRef] [PubMed]
- Guettari, T.; Istrate, D.; Boudy, J.; Benkelfet, B.E.; Fumel, B.; Daviet, J.C. Design and first evaluation of a sleep characterization monitoring system using remote contactless sensor. IEEE J. Biomed. Health Inform. 2016, PP. [Google Scholar] [CrossRef] [PubMed]
- Lambert, L.; Dhif, I.; Ibraheem, M.S.; Granado, B.; Hachicha, K.; Pinna, A.; Garda, P.; Kubis, N.; Kaddouh, F.; Heudes, D.; et al. Smart-EEG: A Tele-Medicine System for EEG Exams; JETSAN: Compiègne, France, 2015. [Google Scholar]
- Infrared Thermopile Contactless Temperature Sensor with Integrated Math Engine in WCSP Package. Available online: https://www.ti.com/product/TMP007 (accessed on 25 April 2016).
- Roetenberg, D.; Luinge, H.; Slycke, P. Xsens MVN: Full 6DOF Human Motion Tracking Using Miniature Inertial Sensors; Xsens Motion Technologies BV, Techque Report; Xsens: Enschede, The Netherlands, 2009. [Google Scholar]
- Kräuchi, K.; Deboer, T. Body temperatures, sleep, and hibernation. In Principles and Practice of Sleep Medicine; Elsevier Science Health Science Division: Amsterdam, The Netherlands, 2011; pp. 323–334. [Google Scholar]
- Van Marken Lichtenbelt, W.D.; Daanen, H.A.; Wouters, L.; Fronczek, R.; Raymann, R.J.; Severens, N.M.; Van Someren, E.J. Evaluation of wireless determination of skin temperature using iButtons. Physiol. Behav. 2006, 88, 489–497. [Google Scholar] [CrossRef] [PubMed]
- Van Someren, E.J. Mechanisms and functions of coupling between sleep and temperature rhythms. Prog. Brain Res. 2006, 153, 309–324. [Google Scholar] [PubMed]
- Applied Data Mining and Statistical Learning! Available online: https://onlinecourses.science.psu.edu/stat857/ (accessed on 15 October 2016).
- FLIR C2: Powerful, Compact Thermal Imaging System. Available online: https://www.flirmedia.com/MMC/THG/Brochures/BLD_008/BLD_008_US.pdf (accessed on 17 July 2016).
- Hasselberg, M.J.; McMahon, J.; Parker, K. The validity, reliability, and utility of the iButton® for measurement of body temperature circadian rhythms in sleep/wake research. Sleep Med. 2013, 14, 5–11. [Google Scholar] [CrossRef] [PubMed]


| Thermopile | Thermal Camera | Accelerometer | iButton | |
|---|---|---|---|---|
| Frequency sampling (Hz) | 1 | 0.1 | 100 | ≤0.016 |
| Reference | TMP007 | FLIRC2 | XSENS | DS1921H/Z |
| The measured data | Room temperature and patient and bed set | Thermal images and temperatures of the targeted area | Acceleration according to 3 axes | Skin temperature |
| Sensors |  |  |  | 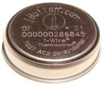 |
| Data | Thermopile | Thermal Camera | Accelerometer |
|---|---|---|---|
| Frequency sampling (Hz) | 1 | 0.1 | 100 |
| Quality of FS (%) | 100 | 97.65 | 94.96 |
| Number of Observations | 28,591 | 2865 | 2,703,130 |
| Collection time | 23:12:59 to 07:09:29 | 23:10:26 to 07:08:42 | 23:12:59 to 07:09:29 |
© 2017 by the authors. Licensee MDPI, Basel, Switzerland. This article is an open access article distributed under the terms and conditions of the Creative Commons Attribution (CC BY) license (http://creativecommons.org/licenses/by/4.0/).
Share and Cite
Seba, A.; Istrate, D.; Guettari, T.; Ugon, A.; Pinna, A.; Garda, P. Thermal-Signature-Based Sleep Analysis Sensor. Informatics 2017, 4, 37. https://doi.org/10.3390/informatics4040037
Seba A, Istrate D, Guettari T, Ugon A, Pinna A, Garda P. Thermal-Signature-Based Sleep Analysis Sensor. Informatics. 2017; 4(4):37. https://doi.org/10.3390/informatics4040037
Chicago/Turabian StyleSeba, Ali, Dan Istrate, Toufik Guettari, Adrien Ugon, Andrea Pinna, and Patrick Garda. 2017. "Thermal-Signature-Based Sleep Analysis Sensor" Informatics 4, no. 4: 37. https://doi.org/10.3390/informatics4040037
APA StyleSeba, A., Istrate, D., Guettari, T., Ugon, A., Pinna, A., & Garda, P. (2017). Thermal-Signature-Based Sleep Analysis Sensor. Informatics, 4(4), 37. https://doi.org/10.3390/informatics4040037