Abstract
Despite the fact that Wikipedia is often criticized for its poor quality, it continues to be one of the most popular knowledge bases in the world. Articles in this free encyclopedia on various topics can be created and edited in about 300 different language versions independently. Our research has showed that in language sensitive topics, the quality of information can be relatively better in the relevant language versions. However, in most cases, it is difficult for the Wikipedia readers to determine the language affiliation of the described subject. Additionally, each language edition of Wikipedia can have own rules in the manual assessing of the content’s quality. There are also differences in grading schemes between language versions: some use a 6–8 grade system to assess articles, and some are limited to 2–3. This makes automatic quality comparison of articles between various languages a challenging task, particularly if we take into account a large number of unassessed articles; some of the Wikipedia language editions have over 99% of articles without a quality grade. The paper presents the results of a relative quality and popularity assessment of over 28 million articles in 44 selected language versions. Comparative analysis of the quality and the popularity of articles in popular topics was also conducted. Additionally, the correlation between quality and popularity of Wikipedia articles of selected topics in various languages was investigated. The proposed method allows us to find articles with information of better quality that can be used to automatically enrich other language editions of Wikipedia.
1. Introduction
Sustaining accurate, complete, reliable, and up-to-date information on the Web is very important, particularly during the development of collaborative platforms and the growth of their popularity. These platforms allow Internet users to create content without special technical skills. Despite the fact that even anonymous users can participate in content addition, information in these knowledge bases can be not only abundant but also trustworthy [1].
Wikipedia is one of the best examples of such collaborative platforms. This encyclopedia became a popular source of information on different topics. Nowadays, it is the fifth most visited page in the world (https://www.alexa.com/siteinfo/wikipedia.org). The pages of this online knowledge base often appear among the first in search results using Google, Bing, Yandex, and other search engines. There are about 300 language editions on Wikipedia with over 46 million articles, which cover all subjects of human activity (https://meta.wikimedia.org/wiki/List_of_Wikipedias). The English edition is the largest and consists of over 5.4 million articles.
Despite the popularity and large volume of information in free access, Wikipedia is often criticized for unreliable content (more information about criticism of Wikipedia can be found on the page https://en.wikipedia.org/wiki/Criticism_of_Wikipedia). This is due primarily to the fact that everyone can participate in the creation and editing of the articles without proving competence or education. Changes made by users (even anonymous users) are immediately available for a wide range of Wikipedia readers. There is no professional editorial control. Articles about the same subject can be edited independently in each language version. Therefore, we can observe a difference in quality between languages depending on the described topic.
In order to help readers quickly determine the quality of the content, the Wikipedia community has defined a grading system for assessing the quality of the articles. Each language version of Wikipedia can have its own rules and standards for writing. In many language versions, there are special awards for articles of the highest quality. In English Wikipedia, these articles are labeled as “featured articles” (FAs)—they must be well-written with appropriate structure, comprehensive, well-researched with reliable sources, and present views fairly and without bias (https://en.wikipedia.org/wiki/Wikipedia:Featured_article_criteria). Another distinction—“good article” (GA)—can be awarded to an article that has not met the criteria for a FA but was close enough. These awards used in English Wikipedia often have equivalents in other language editions of Wikipedia. For example, for FA and GA awards in German Wikipedia are “exzellente artikel” and “lesenswerte artikel”, respectively. However, the share of the best articles in each Wikipedia language is relatively small—on average, around 0.3% in each language.
In some language editions of Wikipedia, there are also other quality grades, which can reflect the maturity of an article. In English Wikipedia, in addition to the highest FA and GA grades, there are also A-class, B-class, C-class, start, and stub. In Russian Wikipedia, there are additionally “solid article”, “I level”, “II level”, “III level”, and “IV level” grades. Polish Wikipedia has three additional grades: “four”, “start”, and “stub”. Equivalent classes between language versions can have differences in assessing standards. For example, in some language versions, for high grades, there is a limitation on the article’s length. Therefore, each language version can have its own quality model, even if those languages have the same number of grades.
The observation is then that there are differences between Wikipedia languages in grading schemes, and not all language versions have a developed system of quality grades for articles. For example, one of the largest versions of Wikipedia is the German edition, and it has only two highest grades—equivalent to FA and GA. Differences in quality grades do not allow us to directly compare the quality of the articles between the various language versions. An additional challenge is a large number of articles without grades. For example, in German and Polish Wikipedia, over 99% of articles are unassessed (i.e., over 2 million and 1.2 million articles, respectively).
The goal of this paper is to research the relation between the quality of Wikipedia articles and their popularity. Our hypothesis is that relative popularity is positively correlated with the relative quality of an article. We introduce a method of quality assessment of Wikipedia articles as a synthetic measure, on a scale between 0 and 100. This approach is used to evaluate more than 28 million articles in 44 language versions of Wikipedia. In addition, a comparison of quality between the articles in different languages on selected topics is conducted. The paper also presents results of the estimation of relative popularity of these articles. This makes it possible to study the association between quality and popularity in each language–topic pair.
The paper is structured as follows. Section 2 describes related work concerning both the quality and popularity of Wikipedia articles. Section 3 introduces a synthetic measure used by us to assess the quality of articles, and we present various statistics. Section 4 explains how popularity is measured. In Section 5, we study the association between quality and popularity. Section 6 presents the results of the quality and popularity assessment of Wikipedia articles in 44 languages on different topics. Section 7 concludes the paper.
2. Related Work
2.1. Quality Assessment
Automatic quality assessment of Wikipedia articles is a relatively developed topic in scientific works. Using different methods, it is possible to estimate the quality of articles on the basis of content, edit history, the article’s discussion page, the article’s links, users’ reputations, and other sources. Related studies have proposed different sets of metrics, which can be divided into two groups: content-based and user-based methods.
First works concerning content-based methods have concluded that longer articles in Wikipedia often had a higher quality [2]. Other papers have showed that high-quality articles tend to have more images, sections, and references [3,4,5]. Some scientific works have analyzed language features, which can characterize the writing style of articles. High-quality articles cover more concepts, objects and facts than lower-quality articles [6,7]. According to these studies, the number of facts in a document can indicate its informativeness. The writing style of Wikipedia articles can be also estimated by analyzing character trigram metrics [8]. Basic lexical metrics based on word usages in Wikipedia articles are used in another study as the factors that can reflect the articles’ quality—high-quality articles often used more nouns and verbs and less adjectives [9]. Finally, a quality evaluation of Wikipedia articles can also be based on special quality flaw templates [10].
The second group of studies—user-based—is related to editors’ behavior. These aim to analyze how the user skills, experience, and coordination of their activities affect the quality of Wikipedia articles. These methods use different metrics related to the user’s reputation and changes that they have made in pages [11,12]. If an article has a relatively large number of editors and edits, then often this article will be of high quality [13]. Cooperation among authors and edited articles can be visualized as a network. Using graph theory, it is possible to determine structural features associated with an article’s quality [14]. Artificial intelligence methods can be applied to score the article quality by discovering damaging edits [15]. However, described user-based approaches often require complex calculations, and they cannot indicate what needs to be corrected in the article to improve its quality.
Among other suggested methods, it is also necessary to note the Objective Revision Evaluation Service (ORES) [15], which can classify an article to one of the quality grades and also can automate the vandalism detection. In this case, the article quality can be evaluated on an interval scale (between 0 and 1). However, currently, automatic quality assessment of an article by the ORES is only possible in three Wikipedia language versions (https://www.mediawiki.org/wiki/ORES): English, French, and Russian. This may be due to the fact that the approach works well on large language editions of Wikipedia (with over 1 million articles), for which it is possible to obtain a sufficient amount of data for a training set. Another limitation is the specifics of grading schemes—a relatively well-developed grading scheme is necessary, with six or more quality grades. Our previous works have showed that each Wikipedia language version can have its own grading scheme [4,5], and some of these versions use only 2–3 grades. For example, German Wikipedia with over 2 million articles has only two highest-quality grades for articles’ assessment. A less developed quality grading scheme is one of the main reasons for the large number of unevaluated articles—more than 99% of articles in German, Polish, and other Wikipedia language versions do not have any quality grade.
Although existing works propose various sets of metrics for assessing the quality of Wikipedia articles, there is no universal feature set for this task [16]. An additional challenge is to consider different language versions, which can have different quality models [4,5]. Extraction rules of some metrics (e.g., lexical) can also be language-sensitive [6,7,9]. There are also a few works that aim to combine metrics from articles’ content and edition history [16,17].
Concluding, by using different metrics and models, it is possible to estimate the quality of an article. The majority of the approaches are focused only on one (usually the largest—English) or several language versions. Additionally, these methods essentially allow for the evaluation of articles and the comparing of their quality only within one selected language version of Wikipedia. This is due to the differences that can arise in the quality models between various Wikipedia languages [4,5].
In this paper, for the particular task of comparing the quality using synthetic measures, we decided to take into the account only important content-based metrics. Most of the existing studies evaluate the quality of Wikipedia articles as a binary classification problem, which is limited when comparing articles with similar quality classes. Some of the researchers have aimed to build models by taking into account all (or major) quality grades in developed language versions (such as English), but in this case, the precision decreases significantly. Additionally, previous studies have examined the quality of an article within one selected Wikipedia language instead of comparing different language versions of this article.
2.2. Popularity Measures
The second measure that we analyze in this paper is the popularity of articles. Earlier studies have showed that for some developed language versions of Wikipedia (such as English, German, and Spanish), the popularity of the articles was correlated with its number of edits [18]. Our prior work has showed that popularity can play an important role in the estimation of quality in specific language versions of Wikipedia [5]. Other studies have showed that measuring a topic’s popularity in English Wikipedia can help in determining its number of articles of good quality—if the topic is popular, then it has a larger number of high-quality articles [19]. Warncke-Wang et al. showed misalignment between the popularity and quality of the articles in Wikipedia; however, the study was limited to four language versions of Wikipedia [20]. Additionally, none of the studies provided a comparative analysis of the popularity of the same article between language versions and its impact on the quality. Popularity can also show to a certain degree the importance of the article for groups of Wikipedia users that read it in a selected language version. This can also provide motivation to assign a higher-quality grade for an article in a given language version compared to other languages—a greater number of users can check the completeness, timeliness, and reliability of facts described in the article. Therefore, our hypothesis is that popularity can affect the quality dimension of an article.
This study is the continuation of work on building a synthetic measure for the quality assessment of Wikipedia articles in different languages [21]. Preliminary results have shown the high efficiency of this method in assessing articles on language-sensitive topics. Compared with our previous work [21], we decided to increase the number of analyzed languages (from 7 to 44), expand the rules for quality assessment, and analyze the popularity of the articles.
3. Quality Measure
Many of the existing studies solve the problem of automatic quality assessment of articles as a classification task: articles can be marked as complete or incomplete [3,4,5,6,7,9]. This is a large limitation for comparing articles in different languages, as it is not possible to show to what degree one article is better than the other if both are tagged with the same class (e.g., incomplete). Additionally, it is necessary to take into account different standards in the quality assessment met in various language editions of Wikipedia, defined by each community.
In order to build a synthetic measure, we chose five important content-based metrics:
- len—article length (in bytes);
- ref—number of references;
- img—number of images;
- hdr—number of first- and second-level headers;
- ral—the ratio of the number of references to the article length.
These metrics previously have showed high prediction power in quality assessment of English Wikipedia [3], as well as for other language editions of Wikipedia [4,5]. According to our findings, the above metrics are positively correlated with the quality grades [4,5,21] (see Figure 1).
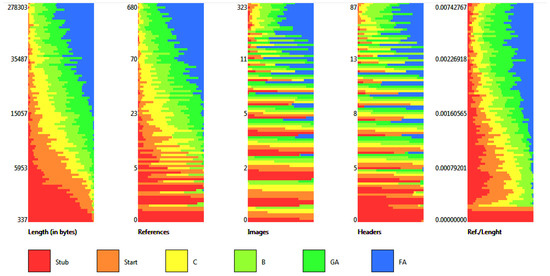
Figure 1.
Distribution of metrics in articles of each quality class in English Wikipedia (featured article (FA)—the highest grade; stub—the lowest). Source: own calculation.
Considering over 4 million articles with assigned quality classes in English Wikipedia, we have calculated the values of proposed metrics by quality classes. We can observe that the values of the metrics increase with an increase in the quality (stub—the lowest; FA—the highest). Table 1 presents medians of each metric of all articles in a particular quality class. As a side note, we do not take into account the A-class, because this class is usually assigned to articles that already have a FA or GA grade. We also excluded 111,412 articles that had two or more different quality grades assigned by various Wikipedia projects.

Table 1.
Median of metrics in each quality class in English Wikipedia. Source: own calculations.
In addition to the above metrics, which were used in our previous work [21], we also decided to take into account special quality flaw templates, which can indicate some problems as identified by Wikipedia editors in a considered article. There are 12 types of this template in English Wikipedia, for example, verifiability, the style of writing, the structure, and neutrality [10]. We conducted a preliminary analysis of the best articles for finding quality flaw templates. It turned out that articles with a FA grade virtually did not contain important quality flaw templates. Therefore, including this additional metric is important for decreasing the quality score for articles with high values of content-based metrics and some quality problems at the same time.
3.1. Language Versions
We applied the following selection criteria for language editions of Wikipedia: (a) more than 100,000 articles and (b) editing depth value higher than 20. The latter value reflects the depth of collaborativeness, that is, how frequently articles are updated (https://meta.wikimedia.org/wiki/Wikipedia_article_depth). This descriptor is highly relevant for Wikipedia. These criteria were met by 44 language versions. The list of languages along with a number of extracted articles and redirects is presented in Table 2.
Table 2.
Number of articles and redirects in considered language versions of Wikipedia.
3.2. Metrics Extraction
We used our own parser to extract the six considered metrics. This parser uses some of the files from Wikipedia dumps (a complete copy of all Wikimedia wikis, in the form of Wikitext source, raw database tables in SQL and metadata embedded in XML can be found at https://dumps.wikimedia.org/). Below is list of the files that were used by our parser for metrics extraction:
- {lang}wiki-latest-pages-articles.xml.bz2—Recombined articles, templates, media/file descriptions, and primary meta-pages. Used for calculation of articles’ length, number of headers and references.
- {lang}wiki-latest-imagelinks.sql.gz—Wiki media/files usage records. Used in calculation of number of images in articles.
- {lang}wiki-latest-templatelinks.sql.gz—Wiki template inclusion link records. Used in calculation of number of quality flaw templates and for searching of articles with selected infoboxes (topics).
- {lang}wiki-latest-redirect.sql.gz—Redirect list. Used for determining articles’ name that redirects to other articles.
- {lang}wiki-latest-langlinks.sql.gz—Wiki interlanguage link records. Used for determining name(s) of the article in other language version(s).
In the above file names, {lang} refers to the language code of the Wikipedia edition (as described in Table 2). Thus, for each language version, we downloaded and then processed these five compressed files.
To obtain the most complete list of language links of each article, it is necessary to follow language links from each language version. For example, if an article in a given language has Wikilinks to relevant articles in other languages, one needs to check if the links are mutual. An additional challenge was to overcome redirections in language links of the articles. Summarizing, we collected about 19.3 million language link sets, and 5.6 million remained after removing duplicates. Further refining, on the basis of the similarity analysis, reduced the number of articles to 4.2 million interlanguage link sets.
In the case of counting quality flaws, we had to take into account various names of templates that pointed to specific English counterparts. For this purpose, we used interlanguage links in important quality flaw templates in English Wikipedia to obtain automatically appropriate names for these templates in other languages.
In this paper, we have used the Wikipedia dumps from September 2017.
3.3. Building Quality Measure
As described in [21], often we can observe a positive correlation between the article quality and the value of each of the five considered quality metrics (article length, number of references, images, headers, and references per length). Figure 1 shows how the distribution of articles varies depending on metrics values considered by the example from the largest English Wikipedia version, which is noticeable if we consider the same number of articles with different quality grades.
As mentioned previously, English Wikipedia is the biggest edition, has an extensive grading system, and has a large number of assessed articles. The less developed languages (e.g., Belarusian, Georgian, Serbian, and Czech) do not always behave similarly to their more developed counterparts. However, taking into account the presence of the highest FA grade in all considered language versions of Wikipedia, we could calculate the median value of these best articles in each language. Medians for each considered metric and language versions are shown in Table 3.
Table 3.
Median metrics values in the highest quality class in various Wikipedia languages. Source: own calculation.
The above values were then used as thresholds in our quality measure. As proposed in [21], on the basis of the medians, we normalized each metric, in particular, the Wikipedia language version, according to the following rule: if the value of the given metric in a given language exceeded the threshold, it was set to 100 points; otherwise its value was linearly scaled to reflect the relation of the value to the median value. For example, if the median for the number of references in Japanese Wikipedia was 118, any article with a larger number of references would score 100 for this metric; an article with 59 references would score proportionally 50 points after normalizing.
Changing the value of any metric in a particular Wikipedia language version would have a different effect on the normalized value. For each language version of Wikipedia, each metric could play an important role in assessing the quality; therefore we first counted the normalized metrics average (NMA) by the following formula:
where is a normalized metric and c is the number of metrics.
Next we took into account the number of quality flaw templates QFT in the considered article (if they existed) and our final formula for the quality measure reads as follows:
In articles with a high quality score value (e.g., 90 points), each quality flaw template reduced the quality score by 5% (for one such template in our example, the article had 85.5 points). This way, if an article had the maximum values of a particular metric but at the same time had quality flaw template(s), this would not allow it to obtain the maximum value of the quality score (100).
After the assessing of more than 28 million articles in 44 considered language editions of Wikipedia, we found that most of the articles obtained scores of between 0 and 30 points. Figure 2 shows the distribution of articles in this scale (a more detailed and interactive chart is found on the Web page: http://data.lewoniewski.info/informatics2017/).
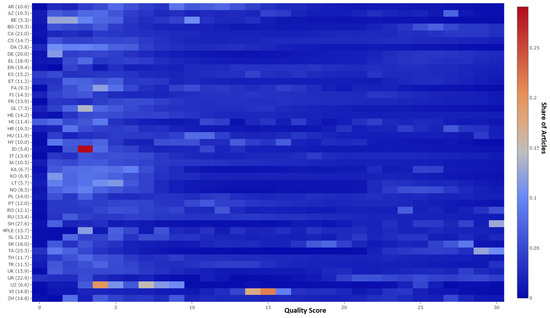
Figure 2.
Distribution of articles depending on quality score in each language version of Wikipedia. The medians of the quality scores for each language edition are in parentheses. Source: own calculation.
4. Popularity Measure
The quality of Wikipedia articles can change over time. This is particularly true for articles that contain time-sensitive information. If they are not regularly updated or are updated with delays, their quality will decrease over time. A lower quality will be observed particularly in comparison to equivalent articles in other languages that may be updated regularly. We can expect that more-popular language versions of the article will be verified by authors more often and, if necessary, can be updated faster than less-popular language versions. To some extent, this is reflected in the Wikipedia article depth measure. Concluding, it can be useful to consider popularity metrics of the articles.
Similarly to other studies [19,20], we have used the page view information in order to measure the popularity of articles. Wikipedia records data on users visiting their pages in all language versions every hour to special compressed files (https://dumps.wikimedia.org/other/analytics/). In order to measure the popularity of articles, we downloaded these data files with statistics for the last year (from September 2016 to August 2017)—about 442 GB of compressed raw data.
We define the following popularity metrics:
- tp—total popularity: total number of visits during the considered period;
- sp—stable popularity: stable number of visits, which is calculated as the median of daily visits during the considered period.
In order to calculate the relative popularity, we normalized both metrics with regard to maximum values of popularity metrics in corresponding articles in other languages. Thus, for the popularity metric of the particular article with v numbers of language versions, the language with the maximum value can be found by the formulas:
Now, in order to calculate the relative popularity (on a scale between 0 and 100) of the selected language version l of the article, we counted using the average of the normalized popularity metrics and :
We consider an example. We suppose we have three language versions of the article—en, de, and fr. For each language, we have the following popularity metrics:
- total popularity , , and ;
- stable popularity , , and .
English (1) has the highest value of the metric; therefore , and we normalize using the value : , , and .
German (2) has the highest value of the metric; therefore we normalize using the value for : , , and .
Now substituting the normalized values into Equation (4), we obtain the following values of the relative popularity measure for each considered language version of the article:
- ;
- ;
- .
5. Wikipedia Articles’ Assessment
In this section, we present the results of the quality and popularity assessment of Wikipedia articles in 44 languages on different topics: companies, films, persons, universities, and video games.
5.1. Dataset
Wikipedia provides a system of categories, specific to each language, that allows for the grouping of articles. Thus, each language version of Wikipedia usually has its own structure of categories and own practices concerning their assignment. For example, in some languages, it is customary to tag an article with more than 20 categories; in others, the number can be limited to 2–5 categories. The quality of structure of categories also differs among languages. For example, in some language versions, articles about people, events, transport and other topics can be assigned to just one category.
A more reliable approach for classification is based on the infobox system. An infobox is a table, located usually at the top right-hand corner of an article, that concisely presents main facts about the subject. Depending on the topic described, infoboxes have different names. This allows other popular knowledge bases (e.g., DBpedia, https://dbpedia.org) to develop detailed ontology on the basis of these Wikipedia templates [22]. Popular infoboxes usually have their own names in various languages. For the purpose of our research, we have chosen 12 different infobox types on the basis of popularity in English Wikipedia. Using interwiki links, we extracted infobox names in other language versions. Table 4 shows that almost all languages of Wikipedia have equivalents of popular infoboxes in the English version.
Table 4.
Number of considered language versions of Wikipedia with particular infobox. Source: own calculation.
In order to define groups of the articles that described the same topic, we extracted lists of articles separately for each infobox in a particular language version. In some languages, the lack of an infobox does not mean the absence of articles on a given topic. For example, German Wikipedia does not use infoboxes for people (office holders, musicians, etc.). Moreover, there is no obligation to add an infobox at all. However, it is often considered an important element of an article’s quality. In such cases, we can use interwiki links from identified articles in some languages to reach articles in other versions. Results of the above procedure are presented in Table 5, which presents the number of articles on a particular topic in the analyzed Wikipedia languages.
Table 5.
Number of articles on particular topic in various Wikipedia languages. Source: own calculations.
Table 6 presents the results from another perspective. Here we can find out, for each topic, the number of articles that were translated to a given number of languages. As data is best interpreted using visual cues, we also present the phenomenon in Figure 3 (logarithmic scale on vertical axis).
Table 6.
Number of articles that have a certain number of language versions (NoL) in particular topics. Source: own calculations.
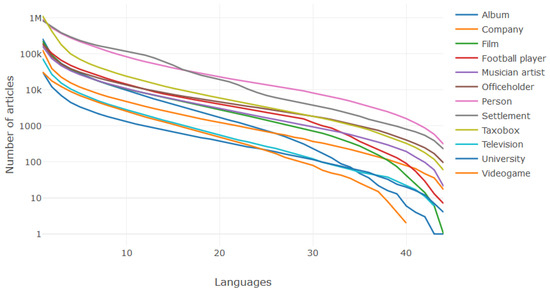
Figure 3.
Number of articles that have a certain number of language versions in particular topics. Source: own calculations.
Another possibility to analyze the data on language versions from Table 5 is to show overlaps between a group of three languages using Venn diagrams. These show how many articles specific languages have in common (see Figure 4).
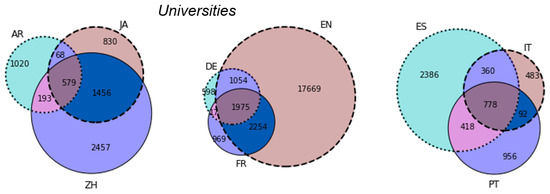
Figure 4.
Coverage of articles that describe universities in different languages. Source: own calculation. Other interactive Venn diagrams for this paper with different topics and languages are available on the following Web page: http://data.lewoniewski.info/informatics2017/vn/.
5.2. Quality Assessment
For all articles from our dataset, we calculated a synthetic measure of quality as described in Section 3.3. Table 7 presents the average quality scores of articles for each topic in 44 Wikipedia language editions.
Table 7.
Average quality scores of articles for each topic in 44 Wikipedia language editions. Source: own calculations.
If we consider the distribution of the quality scores of Wikipedia articles, we can also observe differences across language versions and topics. Figure 5 presents the distribution of quality scores for three Wikipedia language versions (English, German, and French) in 12 considered topics (charts for other languages are available from the Web page: http://data.lewoniewski.info/informatics2017/).
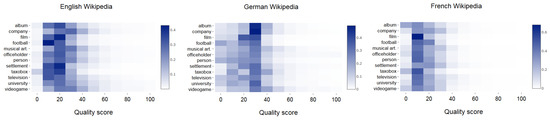
Figure 5.
Distribution of quality scores for three Wikipedia language versions (English, German, and French) in 12 considered topics. Source: own calculation.
5.3. Popularity Assessment
Our goal is to look for correlation between quality and popularity. Therefore, we also collected data about popularity as described in Section 4. In Table 8, we present the average popularity metric for articles in each topic in 44 Wikipedia language editions.
Table 8.
Average popularity metric in articles for each topic in 44 Wikipedia language editions. Source: own calculations.
6. Association between Quality and Popularity
In this section, we present a comparison of the quality and popularity of Wikipedia articles in different languages.
As there were additional requirements for relations between languages, we have conducted the analysis on a subset of Wikipedia articles. We selected only those articles in each topic that had at least three language versions (cf. Table 6). We further analyzed combinations of a language and a topic—a pair. Table 9 presents the top 25 pairs with a share of articles, which had the highest quality in comparison to other languages (full data is presented in Table A1 in the Appendix). For example, the first row of this table should be interpreted as follows: regarding the topic “videogame”, 60.5% of articles according to our quality score were best described in the English version.
Table 9.
Top 25 language–topic pairs with share of articles that have the highest quality in comparison to other languages (articles with at least three language versions were considered). Source: own calculations.
An analogous table was prepared for popularity. Table 10 presents the top 25 language–topic pairs with the share of articles that attracted the greatest popularity in comparison to other languages (full data is presented in Table A2 in the Appendix). Similarly to the previous table, the first row of this table should be interpreted as follows: regarding the topic “album”, 85.8% of articles had the English version as the most popular (attracted the greatest number of visits).
Table 10.
Top 25 language versions and topics with share of articles that have the highest popularity in comparison to other languages (articles with at least three language versions were considered). Source: own calculations.
The goal of our research is to analyze the association between quality and popularity. We have done this on two levels, using appropriate statistics, both parametric and non-parametric.
We first present results of a parametric test using a phi coefficient, calculated for each language–topic pair. This is a measure of association for two binary variables. Our variables were coded as follows: if an article about a specific topic in a given language was of the highest quality among all languages, then it was assigned a value of 1 (high score); otherwise, it was assigned 0 (low score). Popularity was coded similarly: if an article about a specific topic in a given language was the most popular among all languages, then it was assigned a value of 1 (high score); otherwise it was assigned 0 (low score).
Then, the phi coefficient was calculated by the following formula:
where is the number of articles of high quality and popularity scores, is the number of articles that have a high quality and low popularity score, is the number of articles that have a low quality and high popularity score, and is the number of articles that have low quality and popularity scores.
Depending on the language and topic, the correlation may differ significantly. Table 11 shows the top 25 language–topic pairs with the highest correlation coefficients (full data is presented in Table A3 in the Appendix).
Table 11.
Top 25 language versions and topics with the highest phi coefficients between articles with the highest quality and popularity (articles with at least three language versions were considered). Source: own calculations.
The problem with the phi coefficient, a special case of Pearson’s correlation coefficient, is that the results have a high granularity and that it cannot be easily generalized. Therefore, we also set up another experiment, in which we estimated the association between the quality and popularity within a topic. For every topic, we prepared two lists of languages: one ordered by the share of articles that were of highest quality (see Table A1), and the other ordered by the share of articles that were the most popular (see Table A2). These lists were effectively ranks. We wished to know whether the order of the languages was similar, which would support the hypothesis that quality and popularity are associated. For this purpose, we used Spearman’s rank correlation coefficient between shares of articles (also used by [19] in similar tasks). The results are presented in Table 12.
Table 12.
Spearman’s rank correlation coefficients for shares of the articles of the highest quality and popularity, on various topics. Source: own calculation using [23].
Spearman’s rank correlation assesses the strength of a link between two sets of considered data, which in our case reached 0.87 (for the topic “company”). The results show that depending on the topic, we could find a different correlation between quality and popularity, but a coefficient of no less then 0.61 (for the topic “settlement”). All associations were statistically significant (as shown by p-values). Overall, the results of our calculations supported the hypothesis that there is an association between high quality of articles and their popularity. However, the association strength depends on the topic and the language version of Wikipedia.
7. Conclusions and Future Work
In this paper, we have described how the quality and popularity of Wikipedia articles can be measured across different languages. Depending on the topic and language, different correlations can be observed between the quality and popularity of Wikipedia articles. This can be due to several reasons.
First, there are differences between Wikipedia language communities in terms of the number of experts in each area. In less-developed language versions of Wikipedia, there are a small number of experts (or even an absence of) in some topics. This can be observed particularly in domains not specific for a given language community. Therefore, for any created article, there is a greater chance to award the highest grade through an assessment procedure than would be possible in a more-developed language version. More-developed versions, having a larger user base, are more demanding and hence more critical. It is more difficult to obtain a high-quality grade when there are more eyes watching.
Second, quality can evolve over time. We suppose that a non-popular article once received a high grade from the community in a less-developed language version. Because it is not popular, there is no incentive to update this article. The same subject in another language can be much more popular, and therefore facts can be updated regularly. In the less-developed language versions, we observe a discrepancy between the “graded” quality and the real quality. The factor that can help in this distinction is popularity.
Third, a large number of unassessed articles make it difficult to build accurate quality models on the basis of awards provided by users. Except for English and French Wikipedia, most of the language versions have a large number of unrated articles. In such models, important metrics are often related to the volume of information (e.g., articles’ length, number of references, and images). Unfortunately, these metrics cannot measure other quality dimensions of the article content, such as, for example, timeliness.
The approach for quality assessment presented in this paper takes into account the specifics of the best articles of each language version of Wikipedia. By considering the popularity measure, we can improve the process of identification of language versions with the highest quality.
The proposed quality and popularity measures can be helpful particularly in automated knowledge extraction from Wikipedia articles. One of these such solutions is DBpedia. The problem that is often encountered is a conflict resolution, which is necessary when various language versions concerning the same subject have conflicting information [24]. Our quality metrics can help in building more-effective conflict-resolution strategies for data fusing. An example of such conflict in DBpedia is presented in Figure 6.
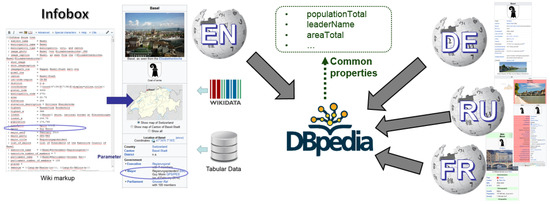
Figure 6.
Infobox about Basel with its data sources and its extraction to DBpedia from different Wikipedia language versions.
Conflict resolution is a first step towards the overall objective of enriching less-developed Wikipedia language versions, for which the appropriate information is of poor quality or is even absent. Figure 7 shows the general scheme of enrichment of information by transferring values from infoboxes of language versions with the highest quality and popularity scores. Before transferring values of particular parameters of an infobox, the information is compared to other language versions, and versions with higher quality and popularity scores will have a higher influence (weight) on selecting the proper value.
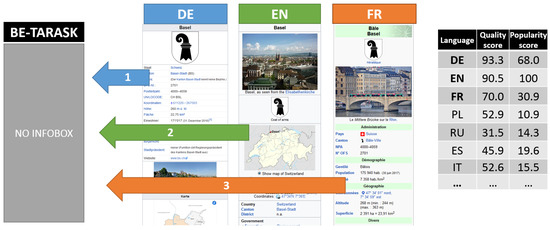
Figure 7.
Scheme of information enrichment of Wikipedia infobox on the basis of quality and popularity assessment of other language versions by an example of Basel city. Source: own calculations from September 2017.
The methods proposed in the paper have practical implications. The synthetic quality measure is used in the WikiRank service (http://wikirank.net), which assesses and compare articles in the various language versions of Wikipedia. A quality and popularity assessment of an article can help to evaluate the quality of its important part—the infobox. Such evaluation is used in the Infoboxes service (http://infoboxes.net).
Some of the presented metrics can be expanded. For example, by analyzing the similarity of sources in Wikipedia articles across languages, we can also evaluate the quality of their content [25]. Furthermore, the references themselves can have their own quality metrics (e.g., impact factor), which can be used as an indirect indicator of the article’s quality. For popularity measurementsm it can be useful to add some metrics related to link analysis in Wikipedia articles [26]. In the future, we plan to continue studies on new metrics and their extraction methods for improving the Wikipedia article quality assessment model.
Author Contributions
K.W. and W.L. conceived the research problem; W.L. conducted state of the art analysis; K.W. proposed research methodology and designed the experiments, starting from hypotheses to be verified statistically; W.L. collected data and performed the analysis; W.L. and K.W. interpreted the results; W.A. provided an overall guidance.
Conflicts of Interest
The authors declare no conflict of interest.
Appendix A
Appendix A.1
Table A1.
Shares of Wikipedia articles with the highest quality score compared with other language versions (articles with at least three language versions were considered). Source: own calculations.
Table A1.
Shares of Wikipedia articles with the highest quality score compared with other language versions (articles with at least three language versions were considered). Source: own calculations.
| Lang. | Album | Comp. | Film | Footb. | Music. | Offic. | Person | Settl. | Taxobox | Telev. | Univ. | Videog. |
|---|---|---|---|---|---|---|---|---|---|---|---|---|
| ar | 0.0 | 0.002 | 0.001 | 0.008 | 0.001 | 0.003 | 0.007 | 0.001 | 0.004 | 0.001 | 0.007 | 0.004 |
| az | 0.0 | 0.0 | 0.001 | 0.001 | 0.001 | 0.004 | 0.001 | 0.006 | 0.001 | 0.0 | 0.004 | 0.0 |
| be | 0.0 | 0.0 | 0.0 | 0.003 | 0.0 | 0.001 | 0.0 | 0.0 | 0.0 | 0.0 | 0.0 | 0.0 |
| bg | 0.003 | 0.001 | 0.006 | 0.003 | 0.004 | 0.003 | 0.004 | 0.01 | 0.03 | 0.002 | 0.005 | 0.0 |
| ca | 0.001 | 0.003 | 0.03 | 0.012 | 0.004 | 0.004 | 0.04 | 0.005 | 0.033 | 0.004 | 0.004 | 0.008 |
| cs | 0.003 | 0.005 | 0.002 | 0.016 | 0.009 | 0.002 | 0.006 | 0.003 | 0.006 | 0.002 | 0.002 | 0.002 |
| da | 0.001 | 0.002 | 0.001 | 0.003 | 0.002 | 0.001 | 0.0 | 0.0 | 0.0 | 0.001 | 0.0 | 0.0 |
| de | 0.032 | 0.133 | 0.147 | 0.091 | 0.035 | 0.013 | 0.038 | 0.015 | 0.08 | 0.036 | 0.071 | 0.047 |
| el | 0.005 | 0.002 | 0.003 | 0.005 | 0.004 | 0.006 | 0.006 | 0.002 | 0.002 | 0.002 | 0.002 | 0.002 |
| en | 0.555 | 0.497 | 0.437 | 0.291 | 0.49 | 0.393 | 0.387 | 0.212 | 0.271 | 0.478 | 0.435 | 0.605 |
| es | 0.058 | 0.027 | 0.017 | 0.053 | 0.057 | 0.062 | 0.062 | 0.046 | 0.139 | 0.073 | 0.039 | 0.025 |
| et | 0.001 | 0.004 | 0.001 | 0.002 | 0.003 | 0.007 | 0.004 | 0.003 | 0.003 | 0.001 | 0.004 | 0.0 |
| fa | 0.001 | 0.002 | 0.002 | 0.003 | 0.002 | 0.008 | 0.003 | 0.012 | 0.0 | 0.002 | 0.005 | 0.001 |
| fi | 0.018 | 0.013 | 0.014 | 0.007 | 0.012 | 0.009 | 0.012 | 0.005 | 0.009 | 0.005 | 0.006 | 0.006 |
| fr | 0.032 | 0.05 | 0.06 | 0.052 | 0.067 | 0.065 | 0.077 | 0.115 | 0.026 | 0.038 | 0.06 | 0.051 |
| gl | 0.0 | 0.001 | 0.0 | 0.0 | 0.001 | 0.001 | 0.001 | 0.001 | 0.002 | 0.0 | 0.001 | 0.0 |
| he | 0.002 | 0.006 | 0.005 | 0.003 | 0.008 | 0.014 | 0.011 | 0.002 | 0.001 | 0.006 | 0.009 | 0.001 |
| hi | 0.001 | 0.002 | 0.006 | 0.0 | 0.001 | 0.002 | 0.001 | 0.002 | 0.0 | 0.002 | 0.002 | 0.0 |
| hr | 0.008 | 0.005 | 0.007 | 0.007 | 0.008 | 0.01 | 0.007 | 0.016 | 0.002 | 0.004 | 0.003 | 0.001 |
| hu | 0.011 | 0.006 | 0.008 | 0.015 | 0.01 | 0.013 | 0.01 | 0.015 | 0.009 | 0.011 | 0.003 | 0.005 |
| hy | 0.0 | 0.0 | 0.001 | 0.0 | 0.001 | 0.002 | 0.001 | 0.019 | 0.0 | 0.0 | 0.0 | 0.0 |
| id | 0.004 | 0.004 | 0.007 | 0.002 | 0.005 | 0.005 | 0.003 | 0.001 | 0.002 | 0.007 | 0.007 | 0.001 |
| it | 0.063 | 0.03 | 0.066 | 0.181 | 0.051 | 0.059 | 0.1 | 0.031 | 0.042 | 0.057 | 0.014 | 0.027 |
| ja | 0.011 | 0.046 | 0.017 | 0.036 | 0.035 | 0.019 | 0.018 | 0.004 | 0.006 | 0.043 | 0.047 | 0.053 |
| ka | 0.01 | 0.001 | 0.001 | 0.001 | 0.001 | 0.002 | 0.001 | 0.003 | 0.01 | 0.0 | 0.003 | 0.001 |
| ko | 0.003 | 0.007 | 0.001 | 0.003 | 0.005 | 0.005 | 0.003 | 0.001 | 0.002 | 0.011 | 0.013 | 0.004 |
| lt | 0.001 | 0.002 | 0.001 | 0.003 | 0.003 | 0.006 | 0.002 | 0.004 | 0.001 | 0.0 | 0.001 | 0.0 |
| no | 0.006 | 0.008 | 0.011 | 0.011 | 0.012 | 0.014 | 0.033 | 0.011 | 0.007 | 0.006 | 0.006 | 0.004 |
| pl | 0.038 | 0.016 | 0.018 | 0.027 | 0.038 | 0.06 | 0.04 | 0.088 | 0.034 | 0.024 | 0.025 | 0.015 |
| pt | 0.043 | 0.015 | 0.027 | 0.024 | 0.02 | 0.018 | 0.019 | 0.028 | 0.033 | 0.035 | 0.013 | 0.018 |
| ro | 0.003 | 0.003 | 0.002 | 0.004 | 0.003 | 0.004 | 0.003 | 0.017 | 0.029 | 0.002 | 0.003 | 0.001 |
| ru | 0.034 | 0.032 | 0.031 | 0.057 | 0.04 | 0.078 | 0.04 | 0.039 | 0.026 | 0.019 | 0.04 | 0.045 |
| sh | 0.0 | 0.001 | 0.005 | 0.0 | 0.001 | 0.005 | 0.002 | 0.036 | 0.0 | 0.001 | 0.002 | 0.0 |
| simple | 0.002 | 0.002 | 0.002 | 0.006 | 0.004 | 0.006 | 0.004 | 0.004 | 0.001 | 0.003 | 0.004 | 0.002 |
| sl | 0.003 | 0.001 | 0.001 | 0.0 | 0.003 | 0.004 | 0.003 | 0.017 | 0.0 | 0.0 | 0.0 | 0.001 |
| sr | 0.001 | 0.001 | 0.001 | 0.001 | 0.002 | 0.003 | 0.002 | 0.002 | 0.013 | 0.002 | 0.001 | 0.001 |
| ta | 0.0 | 0.002 | 0.001 | 0.0 | 0.001 | 0.005 | 0.002 | 0.002 | 0.001 | 0.001 | 0.003 | 0.0 |
| th | 0.001 | 0.001 | 0.001 | 0.001 | 0.002 | 0.003 | 0.001 | 0.001 | 0.002 | 0.002 | 0.008 | 0.002 |
| tr | 0.002 | 0.003 | 0.002 | 0.011 | 0.005 | 0.007 | 0.004 | 0.006 | 0.002 | 0.004 | 0.008 | 0.002 |
| uk | 0.019 | 0.019 | 0.021 | 0.041 | 0.017 | 0.037 | 0.02 | 0.151 | 0.011 | 0.007 | 0.023 | 0.01 |
| ur | 0.0 | 0.0 | 0.0 | 0.0 | 0.0 | 0.001 | 0.001 | 0.037 | 0.0 | 0.0 | 0.002 | 0.0 |
| uz | 0.0 | 0.0 | 0.0 | 0.0 | 0.0 | 0.001 | 0.0 | 0.001 | 0.0 | 0.0 | 0.0 | 0.0 |
| vi | 0.001 | 0.001 | 0.002 | 0.001 | 0.002 | 0.002 | 0.001 | 0.017 | 0.135 | 0.004 | 0.004 | 0.002 |
| zh | 0.022 | 0.044 | 0.032 | 0.012 | 0.029 | 0.032 | 0.019 | 0.009 | 0.025 | 0.105 | 0.109 | 0.052 |
Appendix A.2
Table A2.
Shares of Wikipedia articles with the highest popularity compared with other language versions (articles with at least three language versions were considered). Source: own calculations.
Table A2.
Shares of Wikipedia articles with the highest popularity compared with other language versions (articles with at least three language versions were considered). Source: own calculations.
| Lang. | Album | Comp. | Film | Footb. | Music. | Offic. | Person | Settl. | Taxobox | Telev. | Univ. | Videog. |
|---|---|---|---|---|---|---|---|---|---|---|---|---|
| ar | 0.0 | 0.001 | 0.002 | 0.004 | 0.003 | 0.003 | 0.006 | 0.0 | 0.001 | 0.001 | 0.01 | 0.0 |
| az | 0.0 | 0.0 | 0.0 | 0.0 | 0.001 | 0.002 | 0.0 | 0.0 | 0.0 | 0.0 | 0.004 | 0.0 |
| be | 0.0 | 0.0 | 0.0 | 0.0 | 0.0 | 0.0 | 0.0 | 0.0 | 0.0 | 0.0 | 0.0 | 0.0 |
| bg | 0.0 | 0.0 | 0.001 | 0.001 | 0.002 | 0.003 | 0.001 | 0.002 | 0.0 | 0.001 | 0.003 | 0.0 |
| ca | 0.0 | 0.0 | 0.0 | 0.0 | 0.0 | 0.0 | 0.001 | 0.0 | 0.0 | 0.0 | 0.0 | 0.0 |
| cs | 0.0 | 0.003 | 0.003 | 0.006 | 0.006 | 0.001 | 0.004 | 0.001 | 0.001 | 0.001 | 0.003 | 0.0 |
| da | 0.0 | 0.001 | 0.001 | 0.001 | 0.002 | 0.003 | 0.0 | 0.0 | 0.0 | 0.001 | 0.001 | 0.0 |
| de | 0.005 | 0.06 | 0.032 | 0.041 | 0.008 | 0.004 | 0.017 | 0.008 | 0.033 | 0.023 | 0.032 | 0.004 |
| el | 0.0 | 0.001 | 0.001 | 0.002 | 0.001 | 0.005 | 0.002 | 0.002 | 0.0 | 0.001 | 0.001 | 0.0 |
| en | 0.858 | 0.663 | 0.733 | 0.552 | 0.676 | 0.544 | 0.624 | 0.391 | 0.736 | 0.644 | 0.508 | 0.857 |
| es | 0.019 | 0.024 | 0.02 | 0.089 | 0.046 | 0.069 | 0.065 | 0.052 | 0.061 | 0.095 | 0.051 | 0.007 |
| et | 0.0 | 0.001 | 0.0 | 0.0 | 0.001 | 0.002 | 0.001 | 0.004 | 0.0 | 0.0 | 0.001 | 0.0 |
| fa | 0.0 | 0.001 | 0.002 | 0.004 | 0.002 | 0.006 | 0.004 | 0.005 | 0.0 | 0.001 | 0.008 | 0.0 |
| fi | 0.003 | 0.004 | 0.001 | 0.001 | 0.006 | 0.005 | 0.003 | 0.002 | 0.001 | 0.001 | 0.002 | 0.0 |
| fr | 0.011 | 0.032 | 0.043 | 0.035 | 0.029 | 0.037 | 0.049 | 0.113 | 0.033 | 0.022 | 0.051 | 0.005 |
| gl | 0.0 | 0.0 | 0.0 | 0.0 | 0.0 | 0.0 | 0.0 | 0.0 | 0.0 | 0.0 | 0.0 | 0.0 |
| he | 0.0 | 0.002 | 0.001 | 0.002 | 0.003 | 0.004 | 0.002 | 0.003 | 0.001 | 0.001 | 0.003 | 0.0 |
| hi | 0.0 | 0.0 | 0.0 | 0.0 | 0.0 | 0.0 | 0.0 | 0.0 | 0.0 | 0.0 | 0.0 | 0.0 |
| hr | 0.002 | 0.001 | 0.001 | 0.0 | 0.004 | 0.004 | 0.002 | 0.011 | 0.0 | 0.002 | 0.001 | 0.0 |
| hu | 0.0 | 0.001 | 0.001 | 0.005 | 0.003 | 0.006 | 0.004 | 0.019 | 0.001 | 0.001 | 0.003 | 0.0 |
| hy | 0.0 | 0.0 | 0.0 | 0.0 | 0.0 | 0.0 | 0.0 | 0.0 | 0.0 | 0.0 | 0.001 | 0.0 |
| id | 0.0 | 0.002 | 0.0 | 0.0 | 0.003 | 0.004 | 0.001 | 0.002 | 0.008 | 0.0 | 0.005 | 0.0 |
| it | 0.011 | 0.018 | 0.037 | 0.035 | 0.019 | 0.027 | 0.038 | 0.024 | 0.006 | 0.012 | 0.012 | 0.004 |
| ja | 0.058 | 0.077 | 0.035 | 0.06 | 0.06 | 0.022 | 0.029 | 0.007 | 0.014 | 0.08 | 0.093 | 0.075 |
| ka | 0.0 | 0.0 | 0.0 | 0.0 | 0.0 | 0.002 | 0.0 | 0.0 | 0.0 | 0.0 | 0.0 | 0.0 |
| ko | 0.0 | 0.006 | 0.0 | 0.002 | 0.002 | 0.004 | 0.002 | 0.001 | 0.001 | 0.006 | 0.011 | 0.0 |
| lt | 0.0 | 0.001 | 0.0 | 0.0 | 0.001 | 0.002 | 0.001 | 0.001 | 0.0 | 0.0 | 0.002 | 0.0 |
| no | 0.0 | 0.002 | 0.001 | 0.003 | 0.003 | 0.003 | 0.004 | 0.003 | 0.001 | 0.001 | 0.001 | 0.0 |
| pl | 0.003 | 0.01 | 0.006 | 0.015 | 0.011 | 0.032 | 0.018 | 0.075 | 0.015 | 0.005 | 0.016 | 0.001 |
| pt | 0.007 | 0.012 | 0.004 | 0.03 | 0.014 | 0.012 | 0.013 | 0.025 | 0.008 | 0.019 | 0.017 | 0.002 |
| ro | 0.0 | 0.001 | 0.001 | 0.0 | 0.003 | 0.005 | 0.002 | 0.035 | 0.001 | 0.0 | 0.002 | 0.0 |
| ru | 0.013 | 0.05 | 0.051 | 0.096 | 0.059 | 0.142 | 0.084 | 0.169 | 0.052 | 0.029 | 0.076 | 0.036 |
| sh | 0.0 | 0.0 | 0.0 | 0.0 | 0.0 | 0.0 | 0.0 | 0.001 | 0.0 | 0.0 | 0.0 | 0.0 |
| simple | 0.0 | 0.0 | 0.0 | 0.0 | 0.0 | 0.0 | 0.0 | 0.0 | 0.0 | 0.0 | 0.0 | 0.0 |
| sl | 0.0 | 0.0 | 0.0 | 0.0 | 0.001 | 0.001 | 0.001 | 0.004 | 0.0 | 0.0 | 0.0 | 0.0 |
| sr | 0.001 | 0.0 | 0.004 | 0.0 | 0.003 | 0.005 | 0.003 | 0.014 | 0.0 | 0.002 | 0.005 | 0.0 |
| ta | 0.0 | 0.0 | 0.0 | 0.0 | 0.0 | 0.0 | 0.0 | 0.0 | 0.0 | 0.0 | 0.0 | 0.0 |
| th | 0.0 | 0.002 | 0.001 | 0.001 | 0.002 | 0.002 | 0.001 | 0.003 | 0.002 | 0.001 | 0.008 | 0.0 |
| tr | 0.001 | 0.004 | 0.003 | 0.01 | 0.006 | 0.011 | 0.005 | 0.012 | 0.0 | 0.006 | 0.012 | 0.0 |
| uk | 0.0 | 0.001 | 0.0 | 0.0 | 0.001 | 0.002 | 0.001 | 0.007 | 0.001 | 0.0 | 0.009 | 0.0 |
| ur | 0.0 | 0.0 | 0.0 | 0.0 | 0.0 | 0.0 | 0.0 | 0.0 | 0.0 | 0.0 | 0.0 | 0.0 |
| uz | 0.0 | 0.0 | 0.0 | 0.0 | 0.0 | 0.0 | 0.0 | 0.0 | 0.0 | 0.0 | 0.0 | 0.0 |
| vi | 0.0 | 0.001 | 0.0 | 0.0 | 0.002 | 0.002 | 0.001 | 0.002 | 0.007 | 0.001 | 0.006 | 0.0 |
| zh | 0.006 | 0.017 | 0.013 | 0.002 | 0.015 | 0.025 | 0.01 | 0.002 | 0.015 | 0.042 | 0.042 | 0.007 |
Appendix A.3
Table A3.
Phi correlation coefficients of articles with the highest quality and popularity in selected Wikipedia languages. Source: own calculations.
Table A3.
Phi correlation coefficients of articles with the highest quality and popularity in selected Wikipedia languages. Source: own calculations.
| Lang. | Album | Comp. | Film | Footb. | Music. | Offic. | Person | Settl. | Taxobox | Telev. | Univ. | Videog. |
|---|---|---|---|---|---|---|---|---|---|---|---|---|
| ar | 0.334 | 0.199 | 0.243 | 0.086 | 0.380 | 0.177 | 0.241 | 0.104 | 0.274 | 0.457 | 0.390 | — |
| az | — | −0.006 | 0.463 | 0.101 | 0.350 | 0.263 | 0.226 | 0.063 | 0.158 | −0.005 | 0.458 | −0.010 |
| be | 0.304 | 0.263 | — | — | 0.269 | 0.099 | 0.161 | 0.028 | 0.349 | — | — | — |
| bg | 0.140 | 0.367 | 0.223 | 0.097 | 0.534 | 0.488 | 0.244 | 0.358 | 0.139 | 0.602 | 0.603 | — |
| ca | 0.180 | 0.051 | 0.041 | 0.186 | 0.073 | 0.033 | 0.170 | 0.167 | 0.053 | 0.288 | 0.181 | 0.088 |
| cs | 0.211 | 0.455 | 0.331 | 0.279 | 0.405 | 0.400 | 0.406 | 0.209 | 0.178 | 0.580 | 0.640 | 0.269 |
| da | 0.427 | 0.372 | 0.358 | 0.225 | 0.419 | 0.461 | 0.162 | 0.289 | 0.182 | 0.477 | 0.411 | 0.405 |
| de | 0.334 | 0.523 | 0.338 | 0.364 | 0.263 | 0.341 | 0.309 | 0.512 | 0.207 | 0.535 | 0.593 | 0.215 |
| el | 0.196 | 0.303 | 0.564 | 0.246 | 0.238 | 0.511 | 0.335 | 0.026 | 0.066 | 0.522 | 0.134 | — |
| en | 0.636 | 0.625 | 0.445 | 0.434 | 0.576 | 0.565 | 0.390 | 0.454 | 0.363 | 0.630 | 0.676 | 0.589 |
| es | 0.262 | 0.466 | 0.295 | 0.337 | 0.436 | 0.567 | 0.315 | 0.642 | 0.419 | 0.543 | 0.683 | 0.185 |
| et | 0.207 | 0.332 | 0.189 | 0.151 | 0.461 | 0.362 | 0.283 | 0.211 | 0.157 | 0.650 | 0.359 | — |
| fa | 0.298 | 0.402 | 0.386 | 0.220 | 0.595 | 0.455 | 0.458 | 0.161 | 0.141 | 0.655 | 0.601 | 0.181 |
| fi | 0.325 | 0.443 | 0.254 | 0.250 | 0.456 | 0.557 | 0.299 | 0.386 | 0.166 | 0.511 | 0.324 | 0.176 |
| fr | 0.238 | 0.430 | 0.237 | 0.263 | 0.343 | 0.362 | 0.330 | 0.370 | 0.204 | 0.457 | 0.636 | 0.205 |
| gl | −0.001 | 0.103 | 0.065 | −0.005 | 0.024 | 0.083 | 0.247 | 0.082 | 0.102 | 0.367 | — | — |
| he | 0.343 | 0.504 | 0.281 | 0.525 | 0.459 | 0.410 | 0.325 | 0.256 | 0.179 | 0.586 | 0.552 | — |
| hi | — | — | 0.074 | — | −0.015 | −0.006 | 0.074 | 0.015 | 0.200 | −0.027 | 0.026 | — |
| hr | 0.262 | 0.421 | 0.257 | 0.402 | 0.593 | 0.400 | 0.352 | 0.409 | 0.341 | 0.443 | 0.456 | — |
| hu | 0.103 | 0.467 | 0.252 | 0.417 | 0.425 | 0.458 | 0.419 | 0.546 | 0.093 | 0.369 | 0.537 | 0.094 |
| hy | 0.163 | −0.004 | 0.198 | −0.002 | 0.220 | 0.245 | 0.124 | −0.003 | −0.007 | 0.168 | 0.341 | — |
| id | 0.249 | 0.362 | 0.190 | 0.212 | 0.435 | 0.582 | 0.322 | 0.656 | 0.033 | 0.466 | 0.705 | — |
| it | 0.248 | 0.438 | 0.137 | 0.344 | 0.337 | 0.440 | 0.313 | 0.466 | 0.283 | 0.254 | 0.536 | 0.159 |
| ja | 0.309 | 0.637 | 0.455 | 0.594 | 0.562 | 0.482 | 0.492 | 0.447 | 0.342 | 0.532 | 0.614 | 0.379 |
| ka | 0.052 | — | 0.268 | 0.020 | 0.176 | 0.201 | 0.195 | 0.501 | −0.001 | 0.111 | 0.214 | — |
| ko | 0.213 | 0.454 | 0.190 | 0.319 | 0.369 | 0.567 | 0.417 | 0.552 | 0.176 | 0.426 | 0.511 | 0.150 |
| lt | 0.133 | 0.247 | 0.232 | 0.088 | 0.353 | 0.396 | 0.369 | 0.541 | 0.235 | 0.318 | 0.558 | — |
| no | 0.149 | 0.338 | 0.191 | 0.036 | 0.253 | 0.353 | 0.155 | 0.170 | 0.536 | 0.351 | 0.342 | 0.227 |
| pl | 0.319 | 0.607 | 0.256 | 0.292 | 0.414 | 0.424 | 0.339 | 0.524 | 0.134 | 0.304 | 0.717 | 0.160 |
| pt | 0.334 | 0.474 | 0.179 | 0.444 | 0.496 | 0.486 | 0.367 | 0.553 | 0.064 | 0.632 | 0.707 | 0.252 |
| ro | 0.129 | 0.445 | 0.441 | 0.101 | 0.498 | 0.370 | 0.398 | 0.113 | 0.435 | 0.259 | 0.473 | — |
| ru | 0.268 | 0.460 | 0.392 | 0.365 | 0.414 | 0.456 | 0.330 | 0.421 | 0.360 | 0.470 | 0.607 | 0.296 |
| sh | — | −0.007 | 0.075 | −0.001 | 0.067 | 0.027 | 0.175 | 0.011 | −0.004 | −0.005 | 0.495 | — |
| simple | 0.098 | 0.091 | 0.137 | −0.007 | 0.049 | — | 0.071 | 0.077 | 0.074 | — | — | — |
| sl | 0.214 | 0.436 | 0.642 | −0.005 | 0.329 | 0.230 | 0.329 | 0.113 | 0.140 | −0.026 | 0.597 | — |
| sr | 0.122 | 0.189 | 0.305 | 0.045 | 0.330 | 0.251 | 0.301 | 0.113 | 0.081 | 0.398 | 0.556 | — |
| ta | −0.012 | −0.013 | 0.010 | — | — | 0.038 | 0.039 | 0.033 | 0.212 | — | 0.082 | — |
| th | 0.196 | 0.440 | 0.407 | 0.226 | 0.684 | 0.762 | 0.481 | 0.495 | 0.151 | 0.544 | 0.838 | 0.173 |
| tr | 0.451 | 0.367 | 0.453 | 0.366 | 0.507 | 0.397 | 0.405 | 0.507 | 0.290 | 0.560 | 0.677 | 0.163 |
| uk | 0.104 | 0.188 | 0.083 | 0.110 | 0.206 | 0.216 | 0.201 | 0.204 | 0.091 | 0.184 | 0.391 | — |
| ur | — | — | — | — | — | 0.104 | 0.044 | 0.013 | — | — | — | — |
| uz | — | — | — | — | 0.236 | 0.314 | 0.201 | 0.073 | 0.338 | — | — | — |
| vi | 0.121 | 0.302 | 0.261 | 0.420 | 0.607 | 0.481 | 0.369 | 0.142 | 0.372 | 0.209 | 0.719 | 0.096 |
| zh | 0.363 | 0.423 | 0.378 | 0.250 | 0.456 | 0.615 | 0.410 | 0.185 | 0.126 | 0.550 | 0.462 | 0.243 |
References
- Staub, T.; Hodel, T. Wikipedia vs. Academia: An Investigation into the Role of the Internet in Education, with a Special Focus on Wikipedia. Univ. J. Educ. Res. 2016, 4, 349–354. [Google Scholar] [CrossRef]
- Blumenstock, J.E. Size matters: Word count as a measure of quality on wikipedia. In Proceedings of the 17th International Conference on World Wide Web, Beijing, China, 21–25 April 2008; pp. 1095–1096. [Google Scholar]
- Warncke-wang, M.; Cosley, D.; Riedl, J. Tell Me More: An Actionable Quality Model for Wikipedia. In Proceedings of the 9th International Symposium on Open Collaboration, Hong Kong, China, 5–7 August 2013; pp. 1–10. [Google Scholar]
- Węcel, K.; Lewoniewski, W. Modelling the Quality of Attributes in Wikipedia Infoboxes. In Business Information Systems Workshops; Abramowicz, W., Ed.; Lecture Notes in Business Information Processing; Springer International Publishing: Cham, Switzerland, 2015; Volume 228, pp. 308–320. [Google Scholar]
- Lewoniewski, W.; Węcel, K.; Abramowicz, W. Quality and Importance of Wikipedia Articles in Different Languages. In Information and Software Technologies: 22nd International Conference, ICIST 2016, Druskininkai, Lithuania, October 13-15, 2016, Proceedings; Springer International Publishing: Cham, Switzerland, 2016; pp. 613–624. [Google Scholar]
- Lex, E.; Voelske, M.; Errecalde, M.; Ferretti, E.; Cagnina, L.; Horn, C.; Stein, B.; Granitzer, M. Measuring the quality of web content using factual information. In Proceedings of the 2nd Joint WICOW/AIRWeb Workshop on Web Quality—WebQuality’12, Lyon, France, 16–20 April 2012; p. 7. [Google Scholar]
- Khairova, N.; Lewoniewski, W.; Węcel, K. Estimating the Quality of Articles in Russian Wikipedia Using the Logical-Linguistic Model of Fact Extraction. In Business Information Systems: 20th International Conference, BIS 2017, Poznan, Poland, June 28–30, 2017, Proceedings; Abramowicz, W., Ed.; Springer International Publishing: Cham, Switzerland, 2017; pp. 28–40. [Google Scholar]
- Lipka, N.; Stein, B. Identifying Featured Articles in Wikipedia: Writing Style Matters. In Proceedings of the 19th International Conference on World Wide Web (2010), Raleigh, NC, USA, 26–30 April 2010; pp. 1147–1148. [Google Scholar]
- Xu, Y.; Luo, T. Measuring article quality in Wikipedia: Lexical clue model. In Proceedings of the 2011 3rd Symposium on Web Society (SWS), Port Elizabeth, South Africa, 26–28 October 2011; pp. 141–146. [Google Scholar]
- Anderka, M. Analyzing and Predicting Quality Flaws in User-generated Content: The Case of Wikipedia. Ph.D. Thesis, Bauhaus-Universitaet, Weimar, Germany, 2013. [Google Scholar]
- Wu, G.; Harrigan, M.; Cunningham, P. Characterizing Wikipedia Pages Using Edit Network Motif Profiles. In Proceedings of the 3rd International Workshop on Search and Mining User-generated Contents, Glasgow, UK, 24–28 October 2011; pp. 45–52. [Google Scholar]
- Suzuki, Y.; Nakamura, S. Assessing the Quality of Wikipedia Editors Through Crowdsourcing. In Proceedings of the 25th International Conference Companion on World Wide Web, Montreal, QC, Canada, 11–15 April 2016; International World Wide Web Conferences Steering Committee: Geneva, Switzerland, 2016; pp. 1001–1006. [Google Scholar]
- Wilkinson, D.M.; Huberman, B.A. Cooperation and quality in wikipedia. In Proceedings of the 2007 International Symposium on Wikis WikiSym 07, Montreal, QC, Canada, 21–23 October 2007; pp. 157–164. [Google Scholar]
- Ingawale, M.; Dutta, A.; Roy, R.; Seetharaman, P. Network analysis of user generated content quality in Wikipedia. Online Inf. Rev. 2013, 37, 602–619. [Google Scholar] [CrossRef]
- Halfaker, A.; Taraborelli, D. Artificial Intelligence Service “ORES” Gives Wikipedians X-Ray Specs to See Through Bad Edits. Available online: https://blog.wikimedia.org/2015/11/30/artificial-intelligence-x-ray-specs/ (accessed on 31 October 2017).
- Dang, Q.V.; Ignat, C.L. Quality assessment of Wikipedia articles without feature engineering. In Proceedings of the 2016 IEEE/ACM Joint Conference on Digital Libraries (JCDL), Newark, NJ, USA, 19–23 June 2016; pp. 27–30. [Google Scholar]
- Dalip, D.H.; Lima, H.; Gonçalves, M.A.; Cristo, M.; Calado, P. Quality assessment of collaborative content with minimal information. In Proceedings of the IEEE/ACM Joint Conference on Digital Libraries, London, UK, 8–12 September 2014; pp. 201–210. [Google Scholar]
- Reinoso, A.J. Temporal and Behavioral Patterns in the Use of Wikipedia. Ph.D. Thesis, Universidad Rey Juan Carlos, Madrid, Spain, 2011. Available online: https://gsyc.urjc.es/~ajreinoso/thesis/ (accessed on 31 October 2017).
- Lehmann, J.; Müller-Birn, C.; Laniado, D.; Lalmas, M.; Kaltenbrunner, A. Reader preferences and behavior on wikipedia. In Proceedings of the 25th ACM Conference on Hypertext and Social Media, Santiago, Chile, 1–4 September 2014; pp. 88–97. [Google Scholar]
- Warncke-Wang, M.; Ranjan, V.; Terveen, L.G.; Hecht, B.J. Misalignment Between Supply and Demand of Quality Content in Peer Production Communities. In Proceedings of the ICWSM, Oxford, UK, 26–29 May 2015; pp. 493–502. [Google Scholar]
- Lewoniewski, W.; Węcel, K. Relative Quality Assessment of Wikipedia Articles in Different Languages Using Synthetic Measure. In Business Information Systems Workshops: BIS 2017 International Workshops, Poznań, Poland, June 28-30, 2017, Revised Papers; Abramowicz, W., Ed.; Springer International Publishing: Cham, Switzerland, 2017; pp. 282–292. [Google Scholar]
- Bizer, C.; Lehmann, J.; Kobilarov, G.; Auer, S.; Becker, C.; Cyganiak, R.; Hellmann, S. DBpedia-A crystallization point for the Web of Data. Web Semant. Sci. Serv. Agents World Wide Web 2009, 7, 154–165. [Google Scholar] [CrossRef]
- Wessa, R. Spearman Rank Correlation (v1.0.3) in Free Statistics Software (v1.2.1), Office for Research Development and Education. Available online: https://www.wessa.net/rwasp_spearman.wasp/ (accessed on 31 October 2017).
- Bryl, V.; Bizer, C. Learning conflict resolution strategies for cross-language wikipedia data fusion. In Proceedings of the 23rd International Conference on World Wide Web, Seoul, Korea, 7–11 April 2014; pp. 1129–1134. [Google Scholar]
- Lewoniewski, W.; Węcel, K.; Abramowicz, W. Analysis of References Across Wikipedia Languages. In Information and Software Technologies: 23rd International Conference, ICIST 2017, Druskininkai, Lithuania, October 12–14, 2017, Proceedings; Damaševičius, R., Mikašytė, V., Eds.; Springer International Publishing: Cham, Switzerland, 2017; pp. 561–573. [Google Scholar]
- Hanada, R.; Cristo, M.; Pimentel, M.D.G.C. How do metrics of link analysis correlate to quality, relevance and popularity in wikipedia? In Proceedings of the 19th Brazilian Symposium on Multimedia and the Web, Salvador, Brazil, 5–8 November 2013; pp. 105–112. [Google Scholar]
© 2017 by the authors. Licensee MDPI, Basel, Switzerland. This article is an open access article distributed under the terms and conditions of the Creative Commons Attribution (CC BY) license (http://creativecommons.org/licenses/by/4.0/).