Article

Temporal and Atemporal Provider Network Analysis in a Breast Cancer Cohort from an Academic Medical Center (USA)

1
Department of Biomedical Informatics, Vanderbilt University, Nashville, TN 37201, USA
2
Department of Medicine, Division of Hematology and Oncology, Vanderbilt University Medical Center, Nashville, TN 37201, USA
*
Author to whom correspondence should be addressed.
Informatics 2018, 5(3), 34; https://doi.org/10.3390/informatics5030034
Submission received: 30 May 2018 / Revised: 30 July 2018 / Accepted: 31 July 2018 / Published: 6 August 2018
(This article belongs to the Special Issue Data-Driven Healthcare Research)

Abstract

:
Social network analysis (SNA) is a quantitative approach to study relationships between individuals. Current SNA methods use static models of organizations, which simplify network dynamics. To better represent the dynamic nature of clinical care, we developed a temporal social network analysis model to better represent care temporality. We applied our model to appointment data from a single institution for early stage breast cancer patients. Our cohort of 4082 patients were treated by 2190 providers. Providers had 54,695 unique relationships when calculated using our temporal method, compared to 249,075 when calculated using the atemporal method. We found that traditional atemporal approaches to network modeling overestimate the number of provider-provider relationships and underestimate common network measures such as care density within a network. Social network analysis, when modeled accurately, is a powerful tool for organizational research within the healthcare domain.

1. Introduction

Social network analysis (SNA), applied in healthcare settings, has been used to understand provider communication [1,2,3,4], care team structures [5,6,7], knowledge sharing among clinicians [8,9,10,11,12], and the flow of patients between institutions [13,14,15]. SNA is an approach to study relationships between individuals. It explores hidden channels of collaboration and information flow among individuals and exposes potential disconnects in an organization [16,17,18]. SNA has been applied widely across technology, business, and manufacturing industries to identify trends [19,20,21,22] and improve efficiency [23,24,25]. However, SNA has been only minimally applied to healthcare domains. Secondary use of routinely collected health data, analyzed using SNA, can enable data-driven analysis at an organizational scale.
Provider interactions contribute to shared knowledge and effective patient management within healthcare organizations [13]. Both knowledge sharing and collaborative patient management are key features of multidisciplinary care [26,27,28]. Multidisciplinary care has received attention as an approach to deliver high-value care [29]. A study by O’Mahony and colleagues found that multidisciplinary inpatient rounding teams improved patient outcomes and reduced length of stay [30]. Similarly, a study by Kesson and colleagues discovered that multidisciplinary care was associated with improved survival in breast cancer patients [31]. Effective and timely communication is an important feature of multidisciplinary teams to maintain coordination of care [30]. Without appropriate coordination of care, patients experience treatment delays, higher costs, and poorer outcomes [32,33,34].
Social networks and inter-personal collaboration are inherently dynamic [35]. Networks evolve in response to new memberships and termination of existing relationships. Clinical networks change as new care patterns are adopted. Nonetheless, current methods of SNA use atemporal models of organizations [23]. These models simplify network dynamics and neglect the temporality of clinical care coordination [31]. To better apply SNA to healthcare contexts, it is necessary to devise a method that can more accurately represent dynamics of clinical care. In this study, we developed a temporal social network model to better represent care temporality. We apply our method to evaluate networks of clinicians treating stage I, stage II, and stage III breast cancer patients using outpatient appointment data collected from the electronic health record. We hypothesize that our method will better portray the patterns of clinical care compared to traditional, static, network analysis methods.

2. Materials and Methods

This study was conducted at the Vanderbilt-Ingram Cancer Center at the Vanderbilt University Medical Center, an academic tertiary care center located in middle Tennessee and a major referral center for the Southeastern United States. We collected outpatient appointment data from the electronic health record on patients who met inclusion criteria for the VUMC tumor registry; those who had been diagnosed or received part of the first course of their treatment at VUMC. The Vanderbilt University Institutional Review Board approved this study.

2.1. Study Population

We gathered data from the Vanderbilt University tumor registry on patients with stage I, stage II, or stage III breast cancer diagnosed between 1 January 2002 and 31 December 2016. The Vanderbilt University tumor registry collects cancer diagnosis and treatment data for all patients who were either diagnosed or received part of their first course of treatment at our institution [36,37]. Tumor registry data included a unique patient identifier, date of initial diagnosis, and cancer stage. We similarly extracted from the clinical data warehouse all respective appointment data two years prior to diagnosis date until 31 December 2016 for all patients included in our tumor registry cohort. Patients who had at least one outpatient visit with a provider between their date of diagnosis and six-months following their date of diagnosis were included in the study. Appointment data included a unique patient identifier, unique provider identifier, and appointment date. We mapped each unique provider to their national provider identifier (NPI) to determine their specialty [5]. For providers who were no longer practicing or did not have an NPI number, we used the role and specialty that was specified in the medical record.

2.2. Network Representation

To understand relationships among clinicians, we represented the data as a social network. Social networks consist of ‘nodes’, or entities that interconnect, and ‘edges’, which represent the existence of a relationship between entities. In our networks, nodes represent a clinician with whom a patient had an appointment. Edges represent a shared patient between two clinicians. Nodes and edges can additionally assume properties to further characterize relationships. In this network, the size of each node represents the total number of patients seen by a respective provider. The thickness of each edge represents the total number of patients shared between two providers.
To create social networks, we extracted the set of all providers associated with an appointment for a patient in our cohort to define the list of nodes. We computed two types of edges: temporal and atemporal, such that we can compare network creation methods. To create temporal edges, we use a timeline projection approach to calculate provider pairs based on periods of overlapping care (Figure 1). We first obtain a list of all appointments for each patient, and sequence them in ascending order by appointment date. We iterate through the list of ordered appointments, recording the initial date that each provider entered the network as the ‘enter date’ and updating the last date in which each provider remained in the network as the ‘exit date’. Using the enter date and exit date for each provider, we examined overlapping time periods and calculated a relationship duration for each provider pair as the first and last dates that both providers were present in the network. To aggregate provider-pairs across patients, we take the sum of unique patients for whom the start date and end date of each provider-pair is included in a respective analysis timeframe.
To create atemporal edges we computed pairwise combinations of providers associated with care for a single patient such that each provider who treated a patient was paired with every other provider associated with a treatment of the same patient. We reduced edge combinations from our entire patient cohort to the set of unique relationships and an associated count of occurrences of the respective relationships.

2.3. Network Analysis

We analyzed social networks with respect to two types of temporality: absolute and relative. Absolute temporality refers to chronological time sequence, beginning from a specific date. Absolute temporal analyses assess how a network changes over time. Relative temporality refers to the difference in elapsed time between two events. Events occurring within a timeframe since diagnosis or since entering a network are analyzed in relative time. Respective to each type of temporality, we evaluate both institutional and provider networks. In our analysis, institutional networks refer to all providers and edges associated with the treatment of a patient in our cohort over a given time period; provider networks refer to the providers and edges connected to a single, central, provider who treated a patient in our cohort.
For each social network, we calculated the number of patients and providers included in the graph, and the respective number of relationships. Node and edge sizes were summarized with means, medians and ranges. We calculated descriptive statistics for the institutional network by year. Network measures are presented in Table 1. To assess network connectedness, we calculated yearly network density. We similarly calculated care density for each medical oncologist to quantify the amount of patient sharing among providers with whom the medical oncologist had a relationship [38]. Finally, we visualized each social network and assessed each node’s color to identify the significance of a particular specialty and collaboration between specialties. We created and visualized each network using the igraph [39] package within R 3.3.1 [40].

3. Results

Between 1 January 2002 and 31 December 2016, there were 6104 breast cancer patients included in the Vanderbilt University tumor registry, 5046 of whom had stage I, stage II, or stage III disease. We excluded 964 patients who did not have an outpatient visit with a provider between their initial diagnosis date and the following six months, restricting our analysis to 4082 patients. 2190 providers representing 68 unique specialties treated our patient cohort. Table 2 presents the outpatient provider network by stage. Stage I had the largest patient population and more provider-provider collaborations than either of the other stages. The number of shared patients between provider pairs was similar across all stages. Stage III patients saw, on average, more providers and had more appointments than either stage I or stage II patients.
Table 3 presents the institutional network statistics by year. In 2002, there were 155 new diagnoses, 456 providers, and 596 edges; fewer than any other year. There was a consistent yearly increase among all measures between 2002 and 2015. The number of shared patients (sum of edges) increased by 2794% between 2002 and 2015, the largest change across all measures in the institutional network. The institutional network density remained consistent across all studied years. There was the least growth (134%) in the number of unique providers treating our patient cohort. A total 39.8% of providers only entered the network for a single appointment with one patient, while 36.7% of providers remained in the network for at least one year. Providers remained, on average, in the network for 13.7 months with a median of 5.4 months. Oncology-related providers remained in the network for an average of 67 months with a median of 42.6 months; 42% of the oncology-related providers remained in the network for at least five years; 19.4% of oncology-related providers remained in the network for at least 10 years.
Between 2002 and 2015, there was a 170% and 165% growth in new breast cancer diagnoses and total patients, respectively. Nearly two-thirds (71.4%) of patients remain in the network for at least two years from their first appointment after diagnosis; 43% of possible patients remain in the network five years after diagnosis; while 14% of possible patients remain after 10 years. Figure 2 shows the percentage of oncology-related providers by stage and month relative to diagnosis date. Patients across all stages see the highest percent of oncology-related providers in the first year following diagnosis. For patients with stage II and stage III disease, oncology-related providers account for the majority of visits in the first five years following diagnosis.
Table 4 presents the care densities for full-time and part-time medical oncology providers by year in network, relative to enter date. Care densities for the top (A) full-time and (B) part-time medical oncologist by patient volume are visualized in Figure 3. Full-time providers each have a higher care density than the part-time providers. The highest volume full-time provider treated 1155 patients, was connected to 1159 unique providers and had a care density of 12.3. Each of the full-time providers had more patients than provider-relationships, while part-time providers had more provider relationships than patients. The highest volume part-time provider treated 286 patients, was connected to 423 unique providers and had a care density of 6.9.

4. Discussion

This work makes contributions both to the field of network analysis and to the understanding of breast cancer care teams. This study advances the network analysis literature by presenting a temporal network model that is scalable throughout clinical environments using EHR data. We apply this model to understand care team composition for long-term cancer survivors in an academic medical center. Finally, this work contributes to the understanding of the work required of breast cancer providers to establish, maintain, and evolve a collaborative network of care team providers for their patients.
We have developed a temporal social network model to represent the dynamic collaborative relationships in clinical care using EHR appointment data for breast cancer patients. Using a timeline projection method for edge creation, we were able to represent providers entering and exiting the social network and assessed the evolution of collaborative relationships over time. Few prior studies have performed temporal social network analysis in the healthcare domain, but have relied on self-reported and observational data, rather than routinely collected health data, to model networks. A study by Samarth and colleagues surveyed clinicians in a pediatric acute care unit to analyze social networks for efficiency trends [41]. Other studies have modeled events sequentially to assess temporal relationships [42,43,44]. Chen and colleagues developed a model to discover bundled care opportunities by sequentially modeling events from the EHR [43]. Other prior studies have relied on dynamic analyses to assess dispersion phenomena [45,46]. One study by Christakis and Fowler examined the influence of individuals in the Framingham study dataset [47].
Our methodology offers a scalable approach to analyze provider networks within a single institution. The scalable approach is supported by the use of EHR appointment data. EHR data sources allow us to evaluate a broad range of providers, extending the breadth of single payer data across a single institution. In our prior work, we used VUMC tumor registry data to evaluate networks between cancer providers both inside and outside of our healthcare delivery system [5]. Use of EHR data similarly extends the breadth of providers such that we can evaluate ancillary providers who are integral to the cancer care team but not directly involved in cancer care. Furthermore, the use of appointment data allows us to evaluate the number of encounters between a patient and a provider rather than only the existence of a relationship. Incorporating encounter frequency allows us to evaluate provider collaboration by their relevance to patient care.
To our knowledge, this study is one of the first to use data from the electronic health record to temporally assess provider networks. A comparison of atemporal and temporal edge creation methods indicated that the traditional atemporal method of edge creation greatly over estimates the number of relationships between providers in the network. The accurate representation of edges has important implications for existing network analysis research [48]. Across our entire network, there were 249,075 atemporal and 54,695 temporal edges. Similarly, provider degree centrality in the temporal network was nearly half the atemporal degree centrality. Our method of edge creation more accurately reflects patterns of clinical care in that providers who treat a patient over the same time period likely coordinate actively through clinical messaging or conversation, or passively, through reading provider notes from a similar treatment period.
Our scalable approach is not without limitations. Our data was limited to appointments at a single institution and may not fully represent the patient’s entire scope of care that occurs at outside institutions. Payer data may better reflect a patient’s full scope of care across institutions, however with a large number of payers in our system, the data is difficult to acquire across an entire population. We could improve our networks by incorporating additional data sources. Wang and colleagues incorporated billing data to model social networks [49]. Future studies could incorporate billing data, clinical communications between providers, electronic whiteboard data [50], clinical documentation, orders, and other EHR artifacts to better represent an institution’s entire social network.
This study is one of the first to address temporal changes in networks. We looked at institutional networks and provider networks in relative and absolute time, which attempts to assess the evolution of care networks at a low level. Our results from the institutional network analysis indicated that the number of patients treated for breast cancer more than doubled over our studied period. A similar growth in yearly diagnoses contributed to an increasing patient population. We attribute this growth to an increase in the regional population surrounding our medical center and the growing positive reputation of our comprehensive cancer center. This also demonstrates the impact of long-term survivors of breast cancer treatments in that they maintain relationships with their oncology care team for a lengthy period of time. There were 43% and 14% of patients still in the network after 5 years and 10 years, respectively. We expect that some of these patients are on adjuvant hormone therapy, which often continues for five to ten years following diagnosis. However, in other secondary analyses, we found that many of these patients are receiving subsequent, non-cancer related, treatments at our medical center. Of those patients still in the network at 5 and 10 years, cancer providers made up only 47% and 32% of their care teams. We hypothesize that the cancer treatments introduce a ‘medical home’ phenomenon, in which patients who are already receiving care at our institution will similarly receive care for additional, non-cancer related health conditions. These data could inform optimal care team composition and resource allocation for long-term management of cancer survivors within a medical center.
Our absolute time analysis of the institutional network indicated that the number providers more than doubled while the number of edges increased more than 2400% over our studied period. Despite this growth, network density remained relatively stable by year, indicating that providers maintain a high degree of connectivity in cancer patient care coordination despite colleagues joining and leaving the network. In our relative time provider network analysis, we were able to identify a considerable difference in care densities between full-time and part-time medical oncologists. Full-time medical oncologists had a relatively stable care density over time, while the care density of part-time medical oncologists increased yearly. We hypothesize that full-time providers establish members of their care team more quickly than part-time providers. Nonetheless, all medical oncologists had an increase in care density after the first year, indicating a startup period in which each provider becomes established in their network. Network density reflects the work a provider must do to establish, maintain, and evolve care coordination collaborations among their provider peers. Once established, the density of the medical oncology provider network remained relatively stable over time. The composition of the members of that network was highly dynamic, representing a continuous effort to establish and maintain new relationships with other providers.

5. Conclusions

Social network analysis, when modeled accurately, is a powerful tool for organizational research within the healthcare domain. While early data suggests that providers who are more tightly connected may have better clinical outcomes and lower costs, few formal methods exist to accurately model networks over time. Current methods utilize single payer claims data and rely on pairwise provider combinations to model connectivity. We employed a timeline projection approach to edge creation. We found that traditional atemporal approaches to edge creation overestimate the number of provider-provider relationships and underestimate measures such as care density within the network. Applying social network analysis to our temporal approach to edge creation can promote quantitative approaches to more accurately describe complex provider care networks that can be used to evaluate care coordination and correlation with clinical outcomes. Future applications of this modeling strategy will be used to understand how provider connectivity relates to treatment outcomes and to assess the relationship between provider connectivity and communication patterns to understand operational efficiency.

Author Contributions

Both B.D.S. and M.A.L. designed the study; B.D.S. conducted the analysis and interpreted results; B.D.S. drafted the manuscript, which was proofread and revised by M.A.L.

Funding

Bryan Steitz was supported by the 4T15LM007450 training grant from the National Library of Medicine.

Conflicts of Interest

The authors declare no conflicts of interest.

References

  1. van Beek, A.P. Communication, advice exchange and job satisfaction of nursing staff: A social network analyses of 35 long-term care units. BMC Health Serv. Res. 2011, 11, 1–9. [Google Scholar] [CrossRef] [PubMed]
  2. Creswick, N.; Westbrook, J.I.; Braithwaite, J. Understanding communication networks in the emergency department. BMC Health Serv. Res. 2009, 9, 713–719. [Google Scholar] [CrossRef] [PubMed]
  3. Alexander, G.L.; Steege, L.M.; Pasupathy, K.S.; Wise, K. Case studies of IT sophistication in nursing homes: A mixed method approach to examine communication strategies about pressure ulcer prevention practices. Int. J. Ind. Ergon. 2015, 49, 156–166. [Google Scholar] [CrossRef]
  4. Alexander, G.L.; Pasupathy, K.S.; Steege, L.M.; Strecker, E.B.; Carley, K.M. Multi-disciplinary communication networks for skin risk assessment in nursing homes with high IT sophistication. Int. J. Ind. Ergon. 2014, 83, 581–591. [Google Scholar] [CrossRef] [PubMed] [Green Version]
  5. Steitz, B.D.; Levy, M.A. A social network analysis of cancer provider collaboration. AMIA Annu. Symp. Proc. 2016, 2016, 1987–1996. [Google Scholar] [PubMed]
  6. Barnett, M.L.; Landon, B.E.; O’Malley, A.J.; Keating, N.L.; Christakis, N.A. Mapping physician networks with self-reported and administrative data. Health Serv. Res. 2011, 46, 1592–1609. [Google Scholar] [CrossRef] [PubMed]
  7. Boyer, L.; Belzeaux, R.; Maurel, O.; Baumstarck Barrau, K.; Samuelian, J.C. A social network analysis of healthcare professional relationships in a French hospital. Int. J. Health Care Qual. Assur. 2010, 23, 460–469. [Google Scholar] [CrossRef] [PubMed]
  8. Rangachari, P. Knowledge sharing networks related to hospital quality measurement and reporting. Health Care Manag. Rev. 2008, 33, 253–263. [Google Scholar] [CrossRef] [PubMed]
  9. Wiemken, T.L.W.P.M.; Ramirez, J.A.R.M.; Polgreen, P.P.M.; Peyrani, P.P.; Carrico, R.M.C.P.R.F. Evaluation of the knowledge-sharing social network of hospital-based infection preventionists in Kentucky. Am. J. Infect. Control 2012, 40, 440–445. [Google Scholar] [CrossRef] [PubMed]
  10. Menchik, D.A.; Meltzer, D.O. The cultivation of esteem and retrieval of scientific knowledge in physician networks. J. Health Soc. Behav. 2010, 51, 137–152. [Google Scholar] [CrossRef] [PubMed]
  11. Creswick, N.; Westbrook, J.I. Social network analysis of medication advice-seeking interactions among staff in an Australian hospital. Int. J. Med. Inform. 2010, 79, e116–e125. [Google Scholar] [CrossRef] [PubMed]
  12. Sabot, K.; Wickremasinghe, D.; Blanchet, K.; Avan, B.; Schellenberg, J. Use of social network analysis methods to study professional advice and performance among healthcare providers: A systematic review. Syst. Rev. 2017, 6, 1–23. [Google Scholar] [CrossRef] [PubMed]
  13. Barnett, M.L.; Christakis, N.A.; O’Malley, J.; Onnela, J.-P.; Keating, N.L.; Landon, B.E. Physician patient-sharing networks and the cost and intensity of care in US hospitals. Med. Care 2012, 50, 152–160. [Google Scholar] [CrossRef] [PubMed]
  14. Bridewell, W.; Das, A.K. Social network analysis of physician interactions: The effect of institutional boundaries on breast cancer care. AMIA Annu. Symp. Proc. 2011, 2011, 152–160. [Google Scholar]
  15. Iwashyna, T.J.; Christie, J.D.; Moody, J.; Kahn, J.M.; Asch, D.A. The structure of critical care transfer networks. Med. Care 2009, 47, 787–793. [Google Scholar] [CrossRef] [PubMed]
  16. Chambers, D.; Wilson, P.; Thompson, C.; Harden, M. Social network analysis in healthcare settings: A systematic scoping review. PLoS ONE 2012, 7, e41911. [Google Scholar] [CrossRef] [PubMed]
  17. Wasserman, S.; Faust, K. Social Network Analysis: Methods and Applications; Cambridge University Press: New York, NY, USA, 1994. [Google Scholar]
  18. O’Malley, A.J.; Marsden, P.V. The analysis of social networks. Health Serv. Outcomes Res. Method 2008, 8, 222–269. [Google Scholar] [CrossRef] [PubMed] [Green Version]
  19. Wu, D.; Rosen, D.W.; Wang, L.; Schaefer, D. Cloud-based design and manufacturing: A new paradigm in digital manufacturing and design innovation. Comput. Aided Des. 2015, 59, 1–14. [Google Scholar] [CrossRef] [Green Version]
  20. Casper, S. How do technology clusters emerge and become sustainable? Res. Policy 2007, 36, 438–455. [Google Scholar] [CrossRef]
  21. Cross, R.; Borgatti, S.P.; Parker, A. Making invisible work visible: Using social network analysis to support strategic collaboration. Calif. Manag. Rev. 2002, 44, 25–46. [Google Scholar] [CrossRef]
  22. Bonchi, F.; Castillo, C.; Gionis, A.; Jaimes, A. Social network analysis and mining for business applications. ACM Trans. Intell. Syst. Technol. 2011, 2, 1–37. [Google Scholar] [CrossRef]
  23. Larruscain, J.; Río-Belver, R.; Arraibi, J.R.; Garechana, G. Efficiency in knowledge transmission in R&D project networks: European renewable energy sector. J. Renew. Sustain. Energy 2017, 9, 065908. [Google Scholar]
  24. Latora, V.; Marchiori, M. Is the Boston subway a small-world network? Phys. A Stat. Mech. Appl. 2002, 314, 109–113. [Google Scholar] [CrossRef] [Green Version]
  25. Tichy, N.M.; Tushman, M.L.; Fombrun, C. Social network analysis for organizations. Acad. Manag. Rev. 1979, 4, 507–519. [Google Scholar] [CrossRef]
  26. Oborn, E.; Dawson, S. Knowledge and practice in multidisciplinary teams: Struggle, accommodation and privilege. Hum. Relat. 2010, 63, 1835–1857. [Google Scholar] [CrossRef]
  27. Hartgerink, J.M.; Cramm, J.M.; Bakker, T.J.E.M.; van Eijsden, A.M.; Mackenbach, J.P.; Nieboer, A.P. The importance of multidisciplinary teamwork and team climate for relational coordination among teams delivering care to older patients. J. Adv. Nurs. 2013, 70, 791–799. [Google Scholar] [CrossRef] [PubMed] [Green Version]
  28. Schepman, S.; Hansen, J.; de Putter, I.D.; Batenburg, R.S.; de Bakker, D.H. The common characteristics and outcomes of multidisciplinary collaboration in primary health care: A systematic literature review. Int. J. Integr. Care 2015, 15, e027. [Google Scholar] [CrossRef] [PubMed]
  29. Committee on Quality of Health Care in America, Institute of Medicine (US). Crossing the Quality Chasm: A New Health System for the 21st Century; The National Academies Press: Washington, DC, USA, 2001.
  30. Shannon, D. Effective physician-to-physician communication: An essential ingredient for care coordination. Phys. Exec. 2012, 38, 16–21. [Google Scholar]
  31. Kesson, E.M.; Allardice, G.M.; George, W.D.; Burns, H.J.G.; Morrison, D.S. Effects of multidisciplinary team working on breast cancer survival: Retrospective, comparative, interventional cohort study of 13,722 women. BMJ 2012, 344, e2718. [Google Scholar] [CrossRef] [PubMed]
  32. McDonald, K.M.; Sundaram, V.; Bravata, D.M.; Lewis, R.; Lin, N.; Kraft, S.A.; McKinnon, M.; Paguntalan, H.; Owens, D.K. Closing the Quality Gap: A Critical Analysis of Quality Improvement Strategies; Agency for Healthcare Research and Quality (AHRQ): Rockville, MD, USA, 2007; Volume 7.
  33. Peikes, D.; Chen, A.; Schore, J.; Brown, R. Effects of care coordination on hospitalization, quality of care, and health care expenditures among medicare beneficiaries. JAMA 2009, 301, 603–616. [Google Scholar] [CrossRef] [PubMed]
  34. Forster, A.J. The incidence and severity of adverse events affecting patients after discharge from the hospital. Ann. Intern. Med. 2003, 138, 161–167. [Google Scholar] [CrossRef] [PubMed]
  35. Casteigts, A.; Flocchini, P.; Quattrociocchi, W.; Santoro, N. Time-varying graphs and dynamic networks. Int. J. Parallel Emerg. Distrib. Syst. 2012, 27, 387–408. [Google Scholar] [CrossRef] [Green Version]
  36. Cancer Registry. Available online: https://seer.cancer.gov/registries/cancer_registry/cancer_registry.html (accessed on 30 July 2018).
  37. Tennessee Cancer Registry. Available online: https://www.tn.gov/health/health-program-areas/tcr.html (accessed on 30 July 2018).
  38. Pollack, C.E.; Weissman, G.E.; Lemke, K.W.; Hussey, P.S.; Weiner, J.P. Patient sharing among physicians and costs of care: A network analytic approach to care coordination using claims data. J. Gen. Intern. Med. 2012, 28, 459–465. [Google Scholar] [CrossRef] [PubMed]
  39. Csardi, G.; Nepusz, T. The igraph software package for complex network research. InterJournal Complex Syst. 2006, 1695, 1–9. [Google Scholar]
  40. Team, R.C. R: A Language and Environment for Statistical Computing, version 3.0; R Foundation for Statistical Computing: Vienna, Austria, 2013. [Google Scholar]
  41. Samarth, C.N.; Gloor, P.A. Process efficiency. Redesigning social networks to improve surgery patient flow. J. Healthc. Inf. Manag. 2009, 23, 20–26. [Google Scholar] [PubMed]
  42. Merrill, J.A.; Sheehan, B.M.; Carley, K.M.; Stetson, P.D. Transition networks in a cohort of patients with congestive heart failure. Appl. Clin. Inform. 2015, 6, 548–564. [Google Scholar] [PubMed]
  43. Chen, Y.; Kho, A.N.; Liebovitz, D.; Ivory, C.; Osmundson, S.; Bian, J.; Malin, B.A. Learning bundled care opportunities from electronic medical records. J. Biomed. Inform. 2018, 77, 1–10. [Google Scholar] [CrossRef] [PubMed] [Green Version]
  44. Chen, Y.; Xie, W.; Gunter, C.A.; Liebovitz, D.; Mehrotra, S.; Zhang, H.; Malin, B. Inferring clinical workflow efficiency via electronic medical record utilization. AMIA Annu. Symp. Proc. 2015, 2015, 416–425. [Google Scholar] [PubMed]
  45. Fowler, J.H.; Christakis, N.A. Dynamic spread of happiness in a large social network: Longitudinal analysis over 20 years in the Framingham Heart Study. BMJ 2008, 337, a2338. [Google Scholar] [CrossRef] [PubMed] [Green Version]
  46. Christakis, N.A.; Fowler, J.H. The collective dynamics of smoking in a large social network. N. Engl. J. Med. 2008, 358, 2249–2258. [Google Scholar] [CrossRef] [PubMed] [Green Version]
  47. Christakis, N.A.; Fowler, J.H. Social contagion theory: Examining dynamic social networks and human behavior. Stat. Med. 2012, 32, 556–577. [Google Scholar] [CrossRef] [PubMed]
  48. Blanchet, K.; James, P. How to do (or not to do) … a social network analysis in health systems research. Health Policy Plan. 2012, 27, 438–446. [Google Scholar] [CrossRef] [PubMed]
  49. Wang, F.; Srinivasan, U.; Uddin, S.; Chawla, S. Application of network analysis on healthcare. In Proceedings of the IEEE/ACM International Conference on Advances in Social Network Analysis and Mining, Beijing, China, 17–20 August 2014; pp. 596–603. [Google Scholar]
  50. Steitz, B.D.; Weinberg, S.T.; Danciu, I.; Unertl, K.M. Managing and communicating operational workflow. Appl. Clin. Inform. 2016, 7, 59–68. [Google Scholar] [PubMed]
Figure 1. Temporal edge creation.
Informatics 05 00034 g001
Figure 2. Percentage of appointments with oncology-related providers by month relative to diagnosis.
Informatics 05 00034 g002
Figure 3. Care density for (A) top full-time provider and (B) top part-time provider by patient volume. The top full-time provider and top part-time provider are the central nodes in each respective graph. Edges are calculated using the temporal network creation method.
Informatics 05 00034 g003
Table 1. Network analysis measures.
CalculationDefinitionInterpretation
Network Density 2 ( N u m b e r   o f   E d g e s ) ( N u m b e r   o f   N o d e s ) ( N u m b e r   o f   N o d e s 1 ) The percentage of potential connections in a network that are actual connections.A measure to quantify the relative degree of connectivity within a network.
Network Care Density S u m   o f   E d g e   W e i g h t s T o t a l   N u m b e r   o f   E d g e s The average number of patients shared per provider connection.A measure to quantify the amount of patient sharing between providers in a network.
Degree CentralityThe sum of unique connections adjacent to a single node.The total number of connections associated with a single node.The number of providers who share a patient with a single provider of interest.
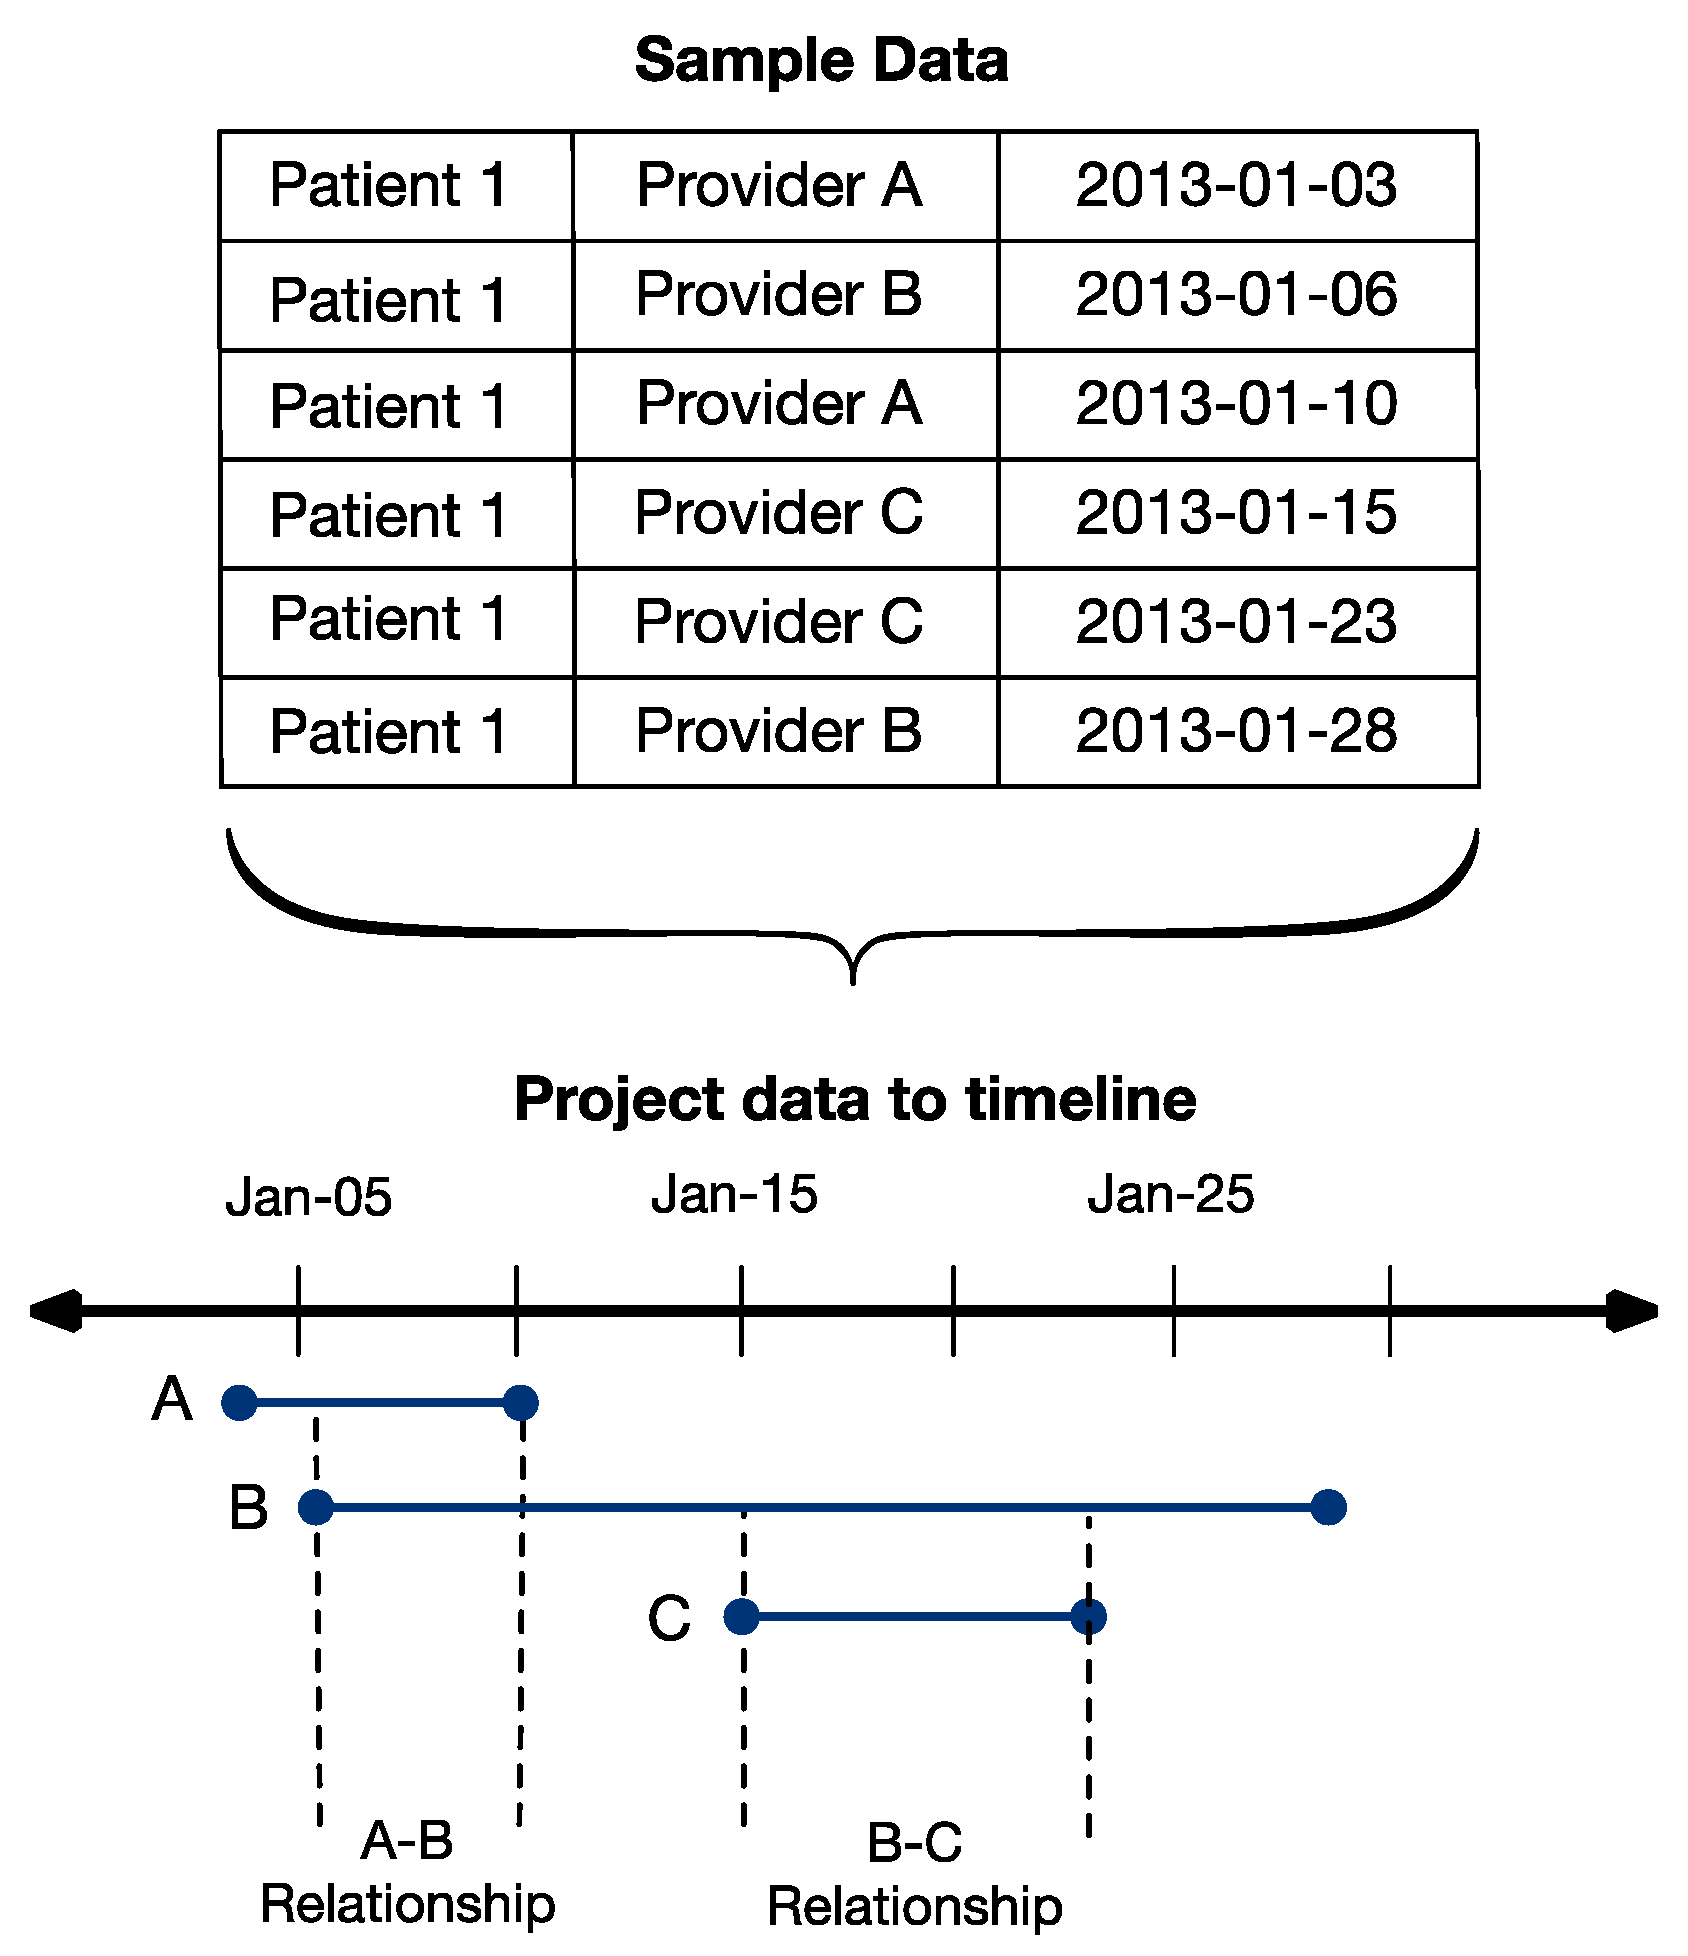
Temporal EdgePair of providers associated with overlapping treatment of a single patient.Connection between nodes relative to time at which each node was present in the network.Provider–provider connections that represent instances in which care was likely coordinated.
Atemporal EdgePairwise combination of providers associated with treatment of a single patient.Connection between nodes, irrespective of time when node was present in the network.Provider–provider connections that represent potential connections based on caring for a shared patient.
Table 2. Outpatient network statistics by cancer stage.
Stage IStage IIStage IIIStage I–III
Number of Patients211614525144082
Number of Providers10909485032190
Unique Temporal Edges35,40223,265978954,695
Unique Atemporal Edges167,318107,01841,686249,075
Node Size
   Mean (range)16.3 (1, 1084)10.7 (1, 675)5.6 (1, 164)31.4 (1, 2351)
   Median432179
Temporal Edge Size
   Mean (range)3.4 (1, 371)3.5 (1, 400)3.1 (1, 164)4.2 (1, 838)
   Median2222
Atemporal Edge Size
   Mean (range)1.8 (1, 467)1.7 (1, 306)1.5 (1, 157)2.2 (1, 908)
   Median1111
Providers per Patient
   Mean (range)15.3 (1, 414)15.1 (1, 64)15.7 (1, 44)15.3 (1, 74)
   Median12121312
Appointments per Patient
   Mean (range)70.5 (1, 414)72.8 (1, 498)80.4 (1, 363)72.7 (1, 498)
   Median50566554
Table 3. Institutional network statistics by year.
Number of DiagnosesNumber of PatientsNumber of ProvidersNumber of Temporal EdgesNumber of Atemporal EdgesSum of Temporal Edge WeightsSum of Atemporal Edge WeightsTemporal Network DensityAtemporal Network Density
200215514244585962033181428311.561.57
2003156167853313093355442548431.521.62
2004174184056919194273657562391.71.76
2005173202363127485095971475501.731.7
200620222496823378534012,08280781.691.53
200720524617534372662515,40899931.631.6
200825626257865455796218,80512,1771.661.63
200927627997907055945324,15314,8001.851.79
20102712989863965811,84133,06619,1881.881.94
2011303312794511,58113,61440,55222,1461.821.84
2012331336699513,01614,60144,77823,3941.81.69
20134063593103814,66316,38751,36627,0151.841.74
20143563711103414,72916,21252,38226,7941.831.83
20154183775107415,36617,49352,50528,2401.661.76
20164003826107614,14217,02549,26329,2631.51.74
Table 4. Medical oncologist care densities, relative to date at which each provider entered the network.
Full-TimePart-Time
Medical Oncologist 1Medical Oncologist 2Medical Oncologist 3Medical Oncologist 4Medical Oncologist 5Medical Oncologist 6
Overall Degree Centrality
Temporal11591034950423517342
Atemporal1963197918649941493836
Overall Care Density
Temporal12.312.314.26.97.85.4
Atemporal7.26.47.22.92.72.2
Yearly Temporal Care Density
Year 14.14.866.43.7723.74
Year 26.646.697.074.4944.11
Year 35.957.726.964.475.044.34
Year 46.947.697.65.115.164.2
Year 56.767.518.794.975.844.22
Year 66.697.469.345.036.19
Year 76.766.869.335.49
Year 87.387.239.36
Year 97.647.24
Year 107.177.28
Year 117.236.74
Year 127.25
Year 136.68
Year 146.66

