Abstract
Social Business Intelligence (SBI) enables companies to capture strategic information from public social networks. Contrary to traditional Business Intelligence (BI), SBI has to face the high dynamicity of both the social network’s contents and the company’s analytical requests, as well as the enormous amount of noisy data. Effective exploitation of these continuous sources of data requires efficient processing of the streamed data to be semantically shaped into insightful facts. In this paper, we propose a multidimensional formalism to represent and evaluate social indicators directly from fact streams derived in turn from social network data. This formalism relies on two main aspects: the semantic representation of facts via Linked Open Data and the support of OLAP-like multidimensional analysis models. Contrary to traditional BI formalisms, we start the process by modeling the required social indicators according to the strategic goals of the company. From these specifications, all the required fact streams are modeled and deployed to trace the indicators. The main advantages of this approach are the easy definition of on-demand social indicators, and the treatment of changing dimensions and metrics through streamed facts. We demonstrate its usefulness by introducing a real scenario user case in the automotive sector.
1. Introduction
The main objective of Business Intelligence (BI) is extracting strategic knowledge from the information provided by different data sources to help during the decision-making process and achieve the strategic goals of a company. The processing and analysis of massive data oriented to BI has evolved in recent years. Traditionally, the most commonly used approaches have combined data warehouse (DW), online analytical processing (OLAP), and multidimensional (MD) technologies [1], on very specific scenarios, making use of static and well-structured data sources of corporate nature, being all the information fully materialized and periodically processed in batch mode for future analysis. More recently, new technologies for Exploratory OLAP have been introduced, aimed at exploiting semi-structured external data sources (e.g., XML, RDF) for the discovery and acquisition of relevant data that can be combined with corporate data for decision making process.
Today, BI processes related to decision making are affected by trends in social media, the latter providing immediate user feedback on products and services. Social networks are a fundamental part of the information ecosystem, social media platforms have achieved an unprecedented reach for users, consumers, and companies providing a useful information channel for any professional environment. For the above reasons, there has been a growing interest in the development of solutions from the commercial and scientific perspectives. However, there are peculiarities that do not allow for the direct adaptation of traditional BI techniques because the social data to be analyzed are considered Big Data (i.e., big volume, unbounded, heterogeneity, semi and unstructured data, volatility, and speed or streaming).
The development of new methods and architectures for Big Data analysis has also evolved. Currently, we can clearly differentiate two trends, namely: Traditional and Streaming analytics architectures for Big Data. The first is the most widely used in the literature, integrating various Big Data sources into a raw data repository under a multidimensional scheme (DW/OLAP). All the information is stored in a historical repository, although sometimes the dynamism of the data makes it unnecessary wasting resources. Data processing is done in batch, which causes late alerts and a delay in the decision making of a BI system.
A newer approach and in accordance with the current needs for Big Data processing, focuses more on the speed and immediacy of information, processing data in streaming and, depending on the model designed, incorporating batch analysis processes to obtain knowledge models. In this way, they can offer fresh analysis data and enriched information from models. Only the information needed for the knowledge models are stored, optimizing memory usage.
However, these approaches are still in development and the literature has addressed approaches aimed at solving very specific problems, combining technologies such as Stream Processing Engines (SPE) together with OLAP systems. The main difficulties encountered are the deployment of independently created technologies and connecting them through ad-hoc processes, which can lead to unnecessary replication of information and performance degradation. The analysis dimensions are treated in a static way, when the nature of Big Data has a dynamic and unlimited multidimensionality. They are not integral solutions neither extensible nor scalable.
Thus, the goal of this paper is to propose a generic architecture for the analysis of Big Data, which allows the processing of dynamic multidimensional data in streaming. The main contributions of this work can be summarized as follows:
- We present a comprehensive revision of the main methods proposed for Social Business Intelligence.
- We propose a streaming architecture specially aimed at Social Business Intelligence.
- We propose a new method to model analytical streams for Social Business Intelligence.
The rest of the article is organized as follows. In Section 2 we review the work related to solutions for social analysis, identifying the main methods and tasks of analysis addressed by the scientific literature. Section 3 presents the proposed architecture and Section 4 a prototype implementation with a use case based on the car sector. Finally, Section 5 presents the main conclusions.
2. Methods and Task for Social Analysis
The processing and analysis of Big Data is a field of research still very young. Recently several authors have proposed some architectures for streaming data processing, among them we can highlight the Streaming Analytics, Lambda, Kappa, and unified architectures [2]. So far, these proposals do not constitute standards since they have not been evaluated enough, nor validated on several domains. When selecting an architecture, it is essential to clearly know the uses cases that are to be modeled. With the aim of developing a generic architecture that covers a wide range of Big Data analysis tasks, we have developed a state of the art identifying the main tasks and the most used methodologies for processing them. Our review is focused on relevant articles that propose solutions for processing social data in streaming, especially those data offered by the API services of Twitter.
Table 1 summarizes the findings related to the analysis tasks. In the reviewed literature, we have identified a large set of analysis tasks that have been grouped into six main categories: sentiment analysis, user profiling, post profiling, event detection, user network interactions, and systems recommendations. Most of these tasks focus on the analysis of behavior patterns and features that can be coded and adopted by machine learning techniques for classification. Different kinds of features classes are commonly used to capture orthogonal dimensions for the objects of analysis (e.g., users, posts, events), as summarized in Table 2.

Table 1.
Analysis tasks for social data.
Table 2.
Classes of features used in different tasks for social analysis [14].
Below we summarize the main methods for processing Big Data from Twitter. We divide existing proposals in two main methods for Intelligent Data Processing, namely: Semantic Enrichment and Inductive Processing, represented in Table 3 and Table 4 respectively. Since some exhibit both elements we also present methods that mix ideas from these two main approaches and are also shown in Table 4.
Table 3.
Methods for intelligent social analysis that use Semantic Enrichment.
Table 4.
Methods for intelligent social analysis that use Inductive Processing and Mixed.
Providing Semantic Enrichment refers to extract the semantic information hidden in the post texts and metadata. Semantic enrichment is achieved as the combination of different (and possibly alternative) techniques [29]: crawler meta-data, information retrieval, crawler sentiment, NLP (Natural Language Processing) analysis, and domain experts.
The methods revised in the literature based on Inductive Processing make use of different techniques, see Figure 1, for solving more complex tasks that require more in-depth learning such as real-time event detection, user and post profiling, marketing campaigns, spammers or bots detection, as well as development of referral systems.
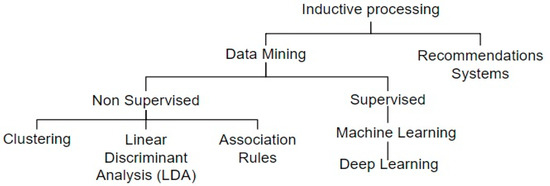
Figure 1.
Inductive processing techniques used for intelligent social analysis.
We have also identified some important dimensions of analysis that group and distinguish the work reviewed, namely: model type, whether the system does streaming processing, Key Framework Components (KFC), and if they make use of Linked Open Data (LOD) technologies. The last columns at each table list the specific analysis tasks that are developed in each proposed method.
Although, in Table 3 and Table 4 we have pointed out several types of models, three of them are worth mentioning because they really represent the evolution of the technological solutions to process Big Data: first social media analytics (SMA), then the proposals towards social media intelligence until reaching social media BI.
The work related to SMA mainly proposes tools and frameworks to capture, monitor, summarize, and visualize social metrics and sentiment analysis, usually aimed at solving specific use cases. It is important to highlight that the revised works have evolved towards more efficient mechanisms to organize information: social data are modeled within a multidimensional scheme, they organize linguistic features and sentimental indicators in a cube data model, facilitating query and visualization from various perspectives. These approaches usually integrate multiple engines to achieve OLAP over evolving data streams, calculations, and aggregations are done in batch so data analysis is deferred.
On the other hand, the goal of social media intelligence is to obtain actionable information from social media in context-rich application environments, to develop corresponding decision support frameworks, and to provide architectural designs and solution frameworks for applications that can benefit from the intrinsic knowledge of social conversations [33].
In this study the solutions reviewed in this study mainly make use of inductive processes in batch, so it is not possible to obtain insights in real-time. The most frequently used analysis tasks are event detection, user and post profiling and very simple recommendation systems. Research on social media intelligence is still at an early stage of development, despite the growing interest of companies and different professional areas that could benefit from such studies.
In the field of Social BI there are very few approaches in the literature. In this sense we highlight the contributions of [3,29], who propose frameworks to exploit BI by integrating social data. In the work [29], the authors propose the development of an OLAP architecture for social media analysis, while [3] offers a semantic LOD-based data infrastructure for the capture, processing, analysis, and publication of social data in RDF, so that it can be easily consumed by BI systems. Both propose a traditional approach since their architectures do not process the data in streaming (real-time), in turn materialize all the information in storages, so they are oriented to cases of high latency use.
In the literature reviewed, few solutions actually do streaming processing, analysis tasks are mainly oriented towards event detection [19] and recommendation systems [25]. It should be noted that both works make use of Semantic Web (SW) technologies to structurally enrich the processed data, allowing for reasoning tasks on them and facilitating the link with external sources. They take LOD technology to a higher level by proposing to share semantic information in the form of RDF streams. However, systematic research and well evaluated results are still lacking.
The work in [34] proposes an extended lambda architecture for Big Data processing that includes a semantic data processing layer and, similar to our proposal, it establishes mechanisms to semantically enrich raw data with metadata from various sources. Batch data processing is carried out in parallel with streaming processing. At the speed layer, events are validated and routed for either real-time or batch processing. Compared to the previous solution, our architecture allows mutual retrofitting between two parallel stages (see Section 3) for the improvement of each of their processes. It adds a layer for the inclusion of intelligent data processing algorithms implemented by the data scientist. We model stream types and stream workflows to facilitate data processing and Social BI oriented analysis. In addition, queries only need to search in a single service location rather than in batch and real-time views.
Social media data are dynamic streams whose volume is growing rapidly so it is necessary to create efficient mechanisms for their processing. Most of the current proposals focus on social media analysis aimed at solving problems in a closed context and do not solve the problem of the dynamism, variety, and speed of social data. In this sense it is still necessary to establish mechanisms to discover and add new dimensions of analysis and new types of facts dynamically. It is necessary to create mechanisms to classify data according to the context. It is necessary to solve issues such as semantic consistency check, conflict detection, absence of structures and the difficulty of integrating different types of data and components in the same infrastructure.
To offer a solution to the previous problem situation, in this article we propose a unified, generic architecture that facilitates the deployment of an intelligent social analysis system of easy integration with BI systems. In this sense the use of SW technologies to model data streams as a multidimensional model facilitates the integration of structures and data between systems.
Following the guidelines of [35], we will now set out the requirements that the proposed architecture must meet:
- Keep the data moving. To support real-time stream processing, messages must be processed in streaming. Due to the low latency of social data, the system must be able to process data “on the fly” and avoid costly storage operations.
- Support for ad-hoc stream queries to filter out events of interest and perform real-time analysis. Support for high-level query languages for continuous results and set up primitives and operators to manage common stream properties (such as data window size and calculation frequency). Some streaming languages include StreamSQL and C-SPARQL.
- Establish mechanisms for handling stream imperfections. In real applications, streaming data may arrive out of order, with some delay, with missing information or arrive in the wrong format. The system must be able to identify the type of error and offer automatic solutions for each case.
- It must be robust and fault tolerant. The first property is related to the possibility of dealing with execution errors and erroneous inputs, in turn guaranteeing outputs in accordance with the expected results. Furthermore, it is necessary to guarantee the availability and security of the data, so that if any module has a failure, the system can continue working (to face this it is convenient to keep processes in the background that often synchronize states with primary processes).
- Allow the integration of stored data with streaming data. A streaming architecture must support integrating data from two basic states: a long-term stage for keeping and batch processing historical information and a short-term stage for generating data in streaming. In many scenarios, it is necessary to compare a current state with past states in order to obtain better insights from the data (e.g., for machine learning tasks). It is therefore necessary to efficiently manage the storage and access of previous states. On the other hand, it is not always necessary to store historical data forever, but it is recommended to establish a time window that maintains the last period of interest so that in case of process failure it is possible to recalculate all data from the latest historical data, thus supporting fault tolerance.
- The system must be partitionable and scalable automatically. That is, it must be able to automatically balance process overload, distributing processes in threads transparently to the user.
- High speed processing and response. It must support high performance for a large volume of very low latency streaming data.
- Finally, we have included integration with LOD technologies to semantically enrich the input and output of data. SW technologies enable the linking and exploration of external sources for the discovery and acquisition of relevant data (e.g., the discovery of new dimensions of analysis). On the other hand, it is also useful to enable the publication of streaming data in some standard for LOD so that it can be easily understood by external applications.
3. Proposed Architecture
In this section we describe the proposed architecture for analytical processing of Social BI according to the tasks and requirements discussed in previous sections.
First of all, we include two kinds of actors in the architecture, namely: data scientists and data analysts. The former is in charge of defining intelligent data processing tasks over the stream of data whereas the latter is in charge of defining over the resulting flow of measures the analytical tasks that trace the organizational goals and indicators. In this scenario, data analysts fetch requests to data scientists for inferring new perspectives from data (e.g., classifiers) and data scientists can demand new data streams to feed their analysis processes. The role of the data scientist is to define, develop, implement, and test inductive processing algorithms. As shown later, data analysts will define the analytical data streams as they are composed of analysis facts.
As Figure 2 shows, the proposed architecture allows for the reprocessing of analytics on historical data whenever a new logic needs to be applied. It roughly corresponds to a Kappa streaming architecture [2,36], which is an evolution of the Lambda architecture [37] in order to avoid the implementation of functionality twice for batch and real-time streaming. Our architecture basically consists of two streaming stages: a long-term stage for keeping recent historical information as a data stream of long duration and a short-term stage with some workflows for generating the required analysis data in real-time. In our scenario, data scientists get samples with training data for their algorithms from the long-term stage and test them over the data in the short-term stage. Data analysts usually consume data from the short-term stage through the serving layer. The long-term stage is also used to recover data when the stream workflow needs to be reconfigured or updated. In this case, whenever the short-term stage stops generating data and once it starts over, it needs to re-compute all the income data stored at the long-term stage.
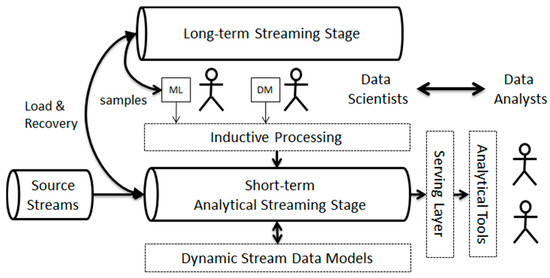
Figure 2.
The proposed architecture for Dynamic Social Business Intelligence.
In our proposal, source data streams are semantically enriched through a series of vocabularies to produce useful data for analysis tasks. Similarly, all the produced and consumed data streams are factual and semantic, as they consist of facts and dimension data linked to the elements of the multidimensional analysis model. This allows the entire system to maintain the stream data models up-to-date with respect to the incoming data and analysis models. Any differences between them will cause the updating and reconfiguration of the corresponding workflows.
In the Lambda architecture the batch layer is a repository that stores the raw data as it arrives for processing by batch processes that will occur on some interval and will be long-lived. The stored data will be processed by iterative algorithms and transformed according to the needs of analysis [34]. While the speed layer is used to compute the real-time views that complement the batch views in the serving layer. The batch layer is mainly used to produce results without stringent latency constraints and to rectify the errors generated in the speed layer. With the Kappa architecture, when required, the batch layer also feeds the real-time layer, so that both real-time and batch processing is executed by the same real-time data processing module.
In contrast, in the proposed architecture, data is always processed as a continuous stream. As in the Kappa architecture, the idea is to handle both real-time data processing and reprocessing in a single stream processing engine. In contrast to the Lambda and Kappa architectures, the long-term stage is a temporary data buffer that can be used for two purposes. First as continuous input for Machine Learning algorithms, whose outputs are used during the PRE and POST processes of the short-term stage. And secondly, it is also used for data recovery in case of system failure or stream workflow reconfiguration. Short-term stage corresponds to the same speed-layer as the Lambda and Kappa architectures.
The proposed architecture offers many advantages for each type of actor involved. It first clearly establishes the flow and channels for information exchange with the system and between actors. Secondly, it greatly accelerates communication and information exchange, as it reduces the time for data preparation and data collection thanks to the PRE and POST processes (see Section 3.1). Thirdly, it facilitates the work of the actors, allowing them to obtain results that are tailored to their needs and on demand. Many of the processes are often performed manually for the preparation and integration of data, our architecture allows to execute them automatically or semi-automatically.
In the next section we discuss how the elements of these architecture are modeled to build the complex workflows that fulfill Social BI tasks.
3.1. Stream Modeling
We basically distinguish two groups of data streams in the architecture: source streams and fact streams. Source streams are in turn divided into data streams and linked data streams. Data streams are directly connected to the sources of incoming social data (e.g., posts, user updates, etc.) whereas linked data streams leverage semantically the enrichment of incoming data to properly shape them for analysis. Fact streams are placed at the short-term stage with the main purpose of producing ready-to-use analytical data. In other words, fact streams process and aggregates source data to provide useful insights to data analysts.
Fact streams are fed by source data streams. For this purpose, they need to transform incoming data into multidimensional facts. We call these transformations ETLink processes. The name ETLink comes from the traditional Extract/Transform/Load phases, but instead of loading the transformed data, ETLink produces linked data graphs on the fly [3]. This process needs domain ontologies and controlled vocabularies to annotate, normalize, and link data. As these semantic sources can also evolve along time, we would need a third type of streams: the linked data streams.
Linked data streams are directly connected to Linked Open Data (LOD) endpoints, accessed via SPARQL queries [38]. Although many LOD sources are static, there is a great trend towards dynamic LOD (e.g., Live DBPedia [39] or Live BabelNet [40]), which ensures the provision of fresh semantic data. If a LOD source feeds some fact stream within the short-term stage, it must be transformed into a multidimensional model. We call this process a MD-star process. We can find several methods in the literature aimed at fitting linked data into multidimensional models [28,41], which can be considered to implement MD-star processes.
In Figure 3 we show the graphical representation of the previous stream types for the proposed architecture. We model each stream with three main components: a query Q and two optional processes (PRE and POST). Incoming data can be pre-processed by a PRE-operation, then Q is executed on the resulted data, and eventually a POST operation can be applied to produce the output data. The previously defined ETLink and MD-star processes are two types of POST operations.
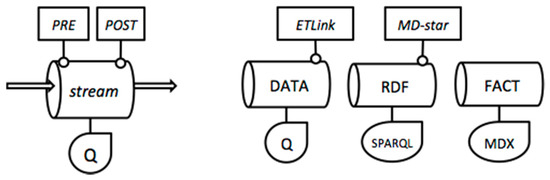
Figure 3.
Stream graphical models for the proposed architecture.
In the case of fact streams, PRE and POST operations can only add new measures and dimension attributes before (PRE) or after (POST) the analytical query (MDX) is executed. An example of PRE-process would calculate the tweet probability to be in the domain. POST processes make inferences and calculations from aggregated data, for example, to determine the profile of a user after aggregating the metrics of the related posts. As shown in Figure 4, some processes can be fed by other streams to get fresh data required by their algorithms. This is the case of continuous learning algorithms like k-means, LDA and some machine learning methods like neural networks.
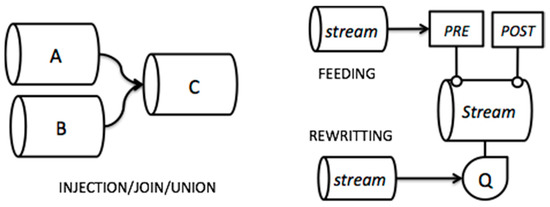
Figure 4.
Modeling workflows of streams.
Additionally, any stream is characterized by its temporal behavior. Basically, each stream defines a time window and a slider. The time window indicates for how long data must be kept in the stream, and the slider indicates the periodicity or frequency of the output. For example, a time window of a week with a slider of one day means that the stream keeps the income data of the last seven days and generates an output every day. These two parameters depend on the analytical task at hand and can be derived from the specification of the MDX query. It must be pointed out that in this scenario, MDX queries must be tuned with respect to time dimensions by using relative tags like now. This is the same issue as for any continuous query language like C-SQL and C-SPARQL [42].
Modeling streams workflows with this approach has several advantages. The coherence between components can be checked before execution, and the resulting models can be dynamically updated as data is processed. For example, model updating will be necessary whenever either new dimensions attributes/members or new metrics appear in the source streams.
3.2. Multidimensional Coherence
Checking multidimensional coherence basically implies to infer two data schemas for each stream: the input data schema (IS) and the output data schema (OS). Notice that stream transformation process consists of three steps: (IS) PRE→Q→POST→(OS). From the stream definitions it is possible to infer how the IS is being transformed into the OS, and consequently analyze the whole processing of the workflow.
The IS of a stream will depend on the data streams it consumes. More specifically, the IS of a stream is the proper combination of the OS of the streams it consumes. As for fact streams, stream combination can have several interpretations according to the multidimensional paradigm:
The IS of the combined stream represents the injection of attributes from the OS of stream A into some dimensions of the OS of stream B.
The IS of the combined stream represents the join of the OS of two fact streams with complementary dimensions and measures.
The IS of the combined stream represents the union of complementary facts with the same multidimensional structure (i.e., equivalent data schemas).
The system will only accept workflows with a coherent combination of data streams according to the previous interpretations (see Figure 4).
3.3. Temporal Consistency
When designing workflows, temporal consistency must be checked in the combined data streams. Temporal consistency is associated to the speed of the streams. For example, a stream that is injecting dimension members/attributes to another fact stream must be slower than it, otherwise its aggregation power degrades. Performing joint and union operations on fact streams can also affect the temporal consistency: the speed of the joined stream cannot be faster than those of the input streams. Additionally, to make sense, time windows must be always longer or equal than the time slider. Finally, as the workflow is intended to get summarized facts, aggregations should be performed on increasingly coarser granularities.
It is worth mentioning that the formal representation of all these restrictions is beyond the scope of this paper. The natural way to make explicit an actionable representation of the presented models is with the OWL language [43], as most data in the streams are expressed as RDF graphs.
4. An Example Use Case
In this section we present a real-scenario use case to show how the previous architecture allow us to express the workflow of a complex streaming analysis problem. The problem we want to model consists of getting a proper insight from the tweets written by relevant actors within the automotive sector by considering current car brands and models. The chosen application scenario is related to companies whose business depends on the Car Industry. Specifically, business like rent-a-car should continuously monitor the user preferences and claims in order to renew the fleet of cars they should offer. With the proposed solutions, a Business Analyst can propose user profiles and specific metrics, which can be quickly deployed and monitored in the stream infrastructure. Thus, analysts can dramatically reduce the time spent in extracting and shaping social data, consuming directly the facts produced by the designed workflows. Figure 5 shows the proposed workflow for this problem, which is described in turn.
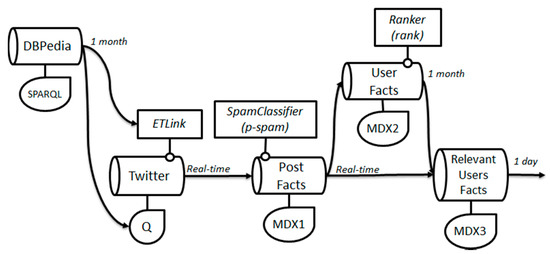
Figure 5.
Example workflow for the use case scenario.
Firstly, we define a stream for identifying new car brands and models, which uses Live DBPedia via its SPARQL endpoint. The query is parametrized by using as reference the date of a month ago (parameter $one_month_ago$), which is set when fetching the query to the endpoint:
    select ?car,?date,?brand where {
       ?car dbo:manufacturer ?brand.
       ?car dbo:productionStartYear ?date.
    FILTER (?date > $one_month_ago$^^xsd:dateTime)
    }
This stream feeds both the ETLink process that semantically enrich tweet data, and the Twitter query track, which includes the names of the car brands and models to be followed in Twitter. Whenever a new car model appears in DBPedia, the ETLink and Twitter query are accordingly updated. In this example, ETLink basically consists of a dictionary that maps text chunks to entities in a reference ontology [3]. An interesting indicator could measure the delay between the updates in DBPedia and the mentions in the tweets of car models.
Once facts are generated applying the ETLink process, these are processed to get incrementally the desired analytical data. The first fact stream consists of a PRE-process to automatically assign a probability to each fact to be a spam. Basically, this process consists of a classifier previously trained with recent historical data. It adds to each fact a new measure for reflecting its probability as spam. The MDX1 query then select facts with low spam probability. The resulting facts feed two streams with different processing speeds. In Figure 5 we show stream speeds at the output of each stream. In this example, time windows coincide with the time sliders.
The User fact stream summarizes a group of metrics concerning the user (e.g., followers, published tweets on domain, total published tweets, etc.) at month granularity to get a ranking of users. This process is reflected in the Ranker POST-process, which calculates the relevance of the user according to their aggregated metrics. Finally, another fact stream joins the incoming post facts with the user fact streams to select the non-spam facts of the relevant users (this join will be expressed in the MDX3 query). This is an example of attribute injection for one of the dimensions of the post facts.
The resulting stream workflow generates summarized data at day level, which is stored in the Serving Layer of the architecture to be consumed and visualized by means of the proper analytical tools.
Figure 6 shows the schema of the output of the Twitter stream after the ETLink is applied. We can see a constellation of two fact types, which can be joined by the User dimension. The multidimensional query MDX1 outputs the schema shown in Figure 7, where the User Fact dimensions become attributes of the User dimension of Post Fact. These facts are again transformed at the User Fact stream, where the multidimensional query MDX2 shapes facts as follows: the number of the post facts associated to each user within the time window are summarized into a measure of User Fact (on_domain). Figure 7 also shows the derived measures and attributes from POST/PRE-processes with dotted lines. The final output multidimensional schema, which is fetched to the serving layer, is shown in Figure 8.
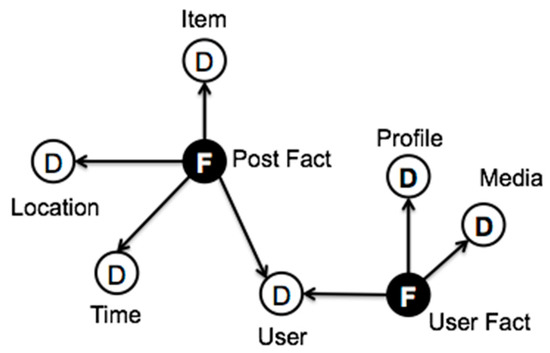
Figure 6.
Graphs obtained after applying ETLink.
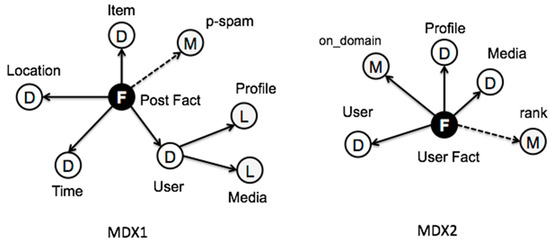
Figure 7.
Output schemas after applying MDX1 and MDX2.
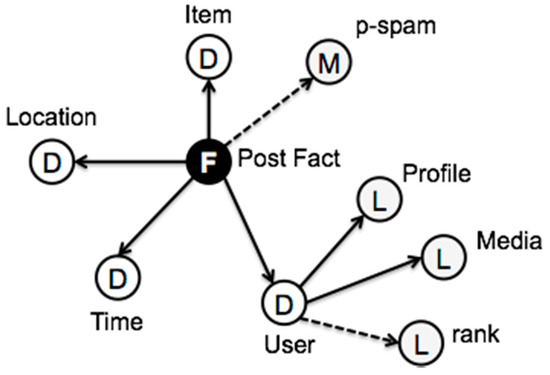
Figure 8.
Output Schema after applying MDX3.
5. Prototype Implementation
We have implemented a small prototype with Python to show some analyses performed using this approach. The implementation of the source streams is quite straightforward with the available libraries for Twitter. We have also adopted libraries from SLOD-BI to implement the ETLink process for generating the tweet facts as shown in Figure 5. It is worth mentioning that ETLink processes are very efficient since they rely on automatic semantic annotation methods that map text chunks and data to ontology entities. Moreover, ETLink processes can be easily parallelized so that they can be adapted to the speed of the incoming posts stream.
In the current prototype, each stream is implemented as a web service, whose data are pulled by the consumer streams. These web services maintain a cursor for each consumer stream. After all data in the current time window has been served to the consumer streams, cursors are closed and once data has been computed for a new time window, cursors are opened back for further processing. These stream services deal with JSON data and fact streams serve and consume data JSON-LD format [44]. In this way, for future implementations, it will be possible to use NoSQL databases for supporting large stream buffers. We also plan to automatically execute these workflows within a fully scalable Big Data framework such as Kafka and Spark.
Regarding the Spam Classifier, it has been trained and tested using the Anaconda framework (Pandas and ScikitLearn packages) [45], which is also implemented in Python so classifiers can be easily integrated into the stream services. Following the proposed architecture, we maintain a long-term stage store of one year from where obtain the necessary samples for training the Spam Classifier with a Linear SVM. After applying the Spam Classifier, the number of facts is reduced around 40%.
The Ranker process shown in Figure 5 has been implemented with a simple formula that is applied after user facts have been aggregated. This measure corresponds to the ordering of the on_domain and total number of tweets per user.
We have simulated the streaming workflow with a series of historical tweets about car models tracked during the year 2015. Figure 9 shows the results generated by the User Fact streams during that year (only the top 15 are considered). As it can be noticed, the users ranking is different at each month, and therefore it is necessary to maintain a relatively stable list of relevant users to perform interesting analysis with post facts. If it is not possible to obtain a stable user list then “user” is not a valid dimension for analysis.
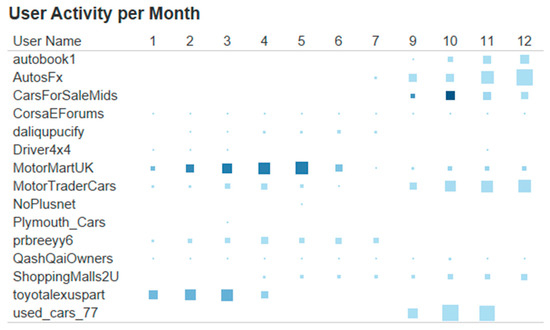
Figure 9.
Relevant Users per activity. Size is proportional to the number of on domain tweets and color indicates the total number of posted tweets.
Figure 10 shows the number of on-domain tweets per brand generated by the initial ETLink process aggregated at the week level. In the figure we can clearly identify two main brands dominating the published tweets in this domain (i.e., Toyota, Aichi, Japan, and Ford, Dearborn, MI, USA). It must be said that the original post facts are associated to the names of car models, which are grouped by brand for visualization.
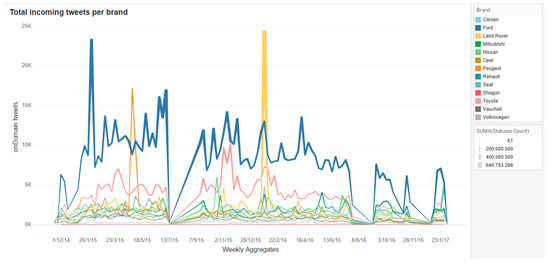
Figure 10.
Total incoming post facts for the example use case.
Figure 11 shows the final output after selecting the top 15 relevant users shown in Figure 9, and after removing spam post facts. In this figure can see that the main relevant users focus on different brands than in the incoming fact stream of Figure 10. For example, Toyota brand paid a great attention during the first half of the year, whereas other brands competed with it during the second half of the year.
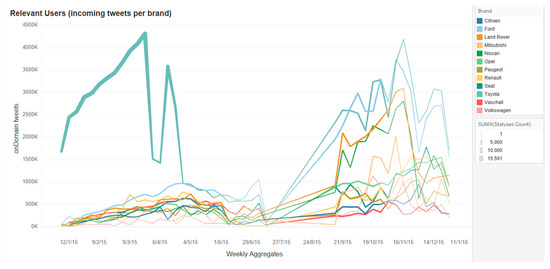
Figure 11.
Post facts per brand for top 15 relevant users.
6. Conclusions
In this work we have analyzed a comprehensive set of methods related to Social Business Intelligence (SBI). We conclude that streaming is the natural way to process social data, and it implies new challenges for analytical tasks. The main challenge is the dynamicity of all the elements implied in the analyses, starting from the data sources and ending up with the analytical indicators. Another challenge is the need for intelligent processing in most of the analysis tasks associated to SBI, like sentiment analysis, spam detection, and so on. Indeed, we cannot think of a SBI task without including both analysis types: multidimensional and predictive.
We propose a new architecture that aims at covering all these requirements as well as at integrating Data Science and Data Analysis tasks in the same working area. We adopt a Kappa-like streaming architecture to cover the requirements of both kinds of actors. The architecture relies on both Linked Data and multidimensional modeling. The former easies the semantic data enrichment whereas the latter shapes them for analysis purposes. The adoption of semantics also facilitates the validation and follow-up of the developed workflows.
Future work has two main directions. One is to achieve a full implementation of the architecture in Python and its integration with a highly scalable streaming framework like Kafka. Another direction is to get a complete theoretical model for the stream workflows relying on Description Logics. The goal of this model is to keep an up-to-date and consistent logic representation of the workflow, which can be used to validate stream re-use and composition as well as the automatic execution of workflows.
Author Contributions
Conceptualization, R.B., I.L.-C. and M.J.A.; Methodology, R.B., I.L.-C. and M.J.A.; Software, R.B.; Validation, R.B. and I.L.-C.; Formal Analysis, R.B., I.L.-C. and M.J.A.; Investigation, R.B., I.L.-C. and M.J.A.; Resources, R.B. and I.L.-C.; Data Curation, R.B. and I.L.-C.; Writing-Original Draft Preparation, I.L.-C. writes the introduction and Section 2, R.B. writes Section 3, Section 4 and Section 5 and conclusions; Writing-Review & Editing, R.B., I.L.-C. and M.J.A.; Visualization, R.B. and I.L.-C.; Supervision, R.B.; Project Administration, R.B.; Funding Acquisition, the members of the project TIN2017-88805-R are R.B., I.L.-C. and M.J.A., I.L.-C. is the pre-doctoral student benefiting from the grant “PREDOC/2017/28”.
Funding
This research was funded by the Spanish Ministry of Industry and Commerce grant number TIN2017-88805-R and by the pre-doctoral grant of the Universitat Jaume I with reference PREDOC/2017/28.
Conflicts of Interest
The authors declare no conflict of interest.
References
- Inmon, W. Building the Data Warehouse; John Wiley & Sons, Inc.: Hoboken, NJ, USA, 2005. [Google Scholar]
- Kreps, J. Questioning the Lambda Architecture 2014. Available online: https://www.oreilly.com/ideas/questioning-the-lambda-architecture (accessed on 11 June 2018).
- Berlanga, R.; García-Moya, L.; Nebot, V.; Aramburu, M.; Sanz, I.; Llidó, D. SLOD-BI: An Open Data Infrastructure for Enabling Social Business Intelligence. Int. J. Data Warehous. Data Min. 2015, 11, 1–28. [Google Scholar] [CrossRef]
- Liu, X.; Tang, K.; Hancock, J.; Han, J.; Song, M.; Xu, R.; Pokorny, B. A Text Cube Approach to Human, Social, Cultural Behavior in the Twitter Stream. In Proceedings of the International Conference on Social Computing, Behavioral-Cultural Modeling, and Prediction, Washington, DC, USA, 2–5 April 2013. [Google Scholar]
- Rosenthal, S.; Farra, N.; Nakov, P. SemEval-2017 Task 4: Sentiment Analysis in Twitter. In Proceedings of the 11th International Workshop on Semantic Evaluations (SemEval-2017), Vancouver, BC, Canada, 3–4 August 2017. [Google Scholar]
- Montejo-Ráez, A.; Martínez-Cámara, E.; Martín-Valdivia, M.; Ureña-López, L.A. Ranked Wordnet graph for sentiment polarity classification in Twitter. Comp. Speech Lang. 2014, 28, 93–107. [Google Scholar] [CrossRef]
- Volkova, S.; Bachrach, Y.; Armstrong, M.; Sharma, V. Inferring Latent User Properties from Texts Published in Social Media. In Proceedings of the Twenty-Ninth AAAI Conference on Artificial Intelligence, Austin, TX, USA, 25–30 January 2015; pp. 4296–4297. [Google Scholar]
- Pennacchiotti, M.; Popescu, A.-M. A Machine Learning Approach to Twitter User Classification. In Proceedings of the Fifth International AAAI Conference on Weblogs and Social Media, Catalonia, Spain, 17–21 July 2011; pp. 281–288. [Google Scholar]
- Colleoni, E.; Rozza, A.; Arvidsson, A. Echo Chamber or Public Sphere? Predicting Political Orientation and Measuring Political Homophily in Twitter Using Big Data. J. Commun. 2014, 64, 317–332. [Google Scholar] [CrossRef]
- Kapanipathi, P.; Jain, P.; Venkataramani, A.C. User interests identification on twitter using a hierarchical knowledge base. In Proceedings of the 11th European Semantic Web Conference ESWC 2017, Portorož, Slovenia, 28 May–1 June 2017. [Google Scholar]
- Miller, Z.; Dickinson, B.; Deitrick, W.; Hu, W.; Wang, A. Twitter spammer detection using data stream clustering. Inf. Sci. 2014, 260, 64–73. [Google Scholar] [CrossRef]
- Varol, O.; Ferrara, E.; Davis, C.; Menczer, F.; Flammini, A. Online Human-Bot Interactions: Detection, Estimation, and Characterization. Available online: https://arxiv.org/abs/1703.03107 (accessed on 11 June 2018).
- Subrahmanian, V.; Azaria, A.; Durst, S.; Kagan, V.; Galstyan, A.; Lerman, K.; Zhu, L.; Ferrara, E.; Flammini, A.; Menczer, F. The DARPA Twitter Bot Challenge. Computer 2016, 49, 38–46. [Google Scholar] [CrossRef]
- Ferrara, E.; Varol, O.; Davis, C.; Menczer, F.; Flammini, A. The Rise of Social Bots. Commun. ACM 2016, 59, 96–104. [Google Scholar] [CrossRef]
- Li, H.; Mukherjee, A.; Liu, B.; Kornfield, R.; Emery, S. Detecting Campaign Promoters on Twitter using Markov Random Fields. In Proceedings of the IEEE International Conference on Data Mining, Shenzhen, China, 14–17 December 2014. [Google Scholar]
- Roelens, I.; Baecke, P.; Benoit, D. Identifying influencers in a social network: The value of real referral data. Decis. Support Syst. 2016, 91, 25–36. [Google Scholar] [CrossRef]
- Xie, W.; Zhu, F.; Jiang, J.; Lim, E.-P.; Wang, K. TopicSketch: Real-Time Bursty Topic Detection from Twitter. IEEE Trans. Knowl. Data Eng. 2016, 28, 2216–2229. [Google Scholar] [CrossRef]
- Feng, W.; Zhang, C.; Zhang, W.; Han, J.; Wang, J.; Aggarwal, C.; Huang, J. STREAMCUBE: Hierarchical spatio-temporal hashtag clustering for event exploration over the Twitter stream. In Proceedings of the 2015 IEEE 31st International Conference on Data Engineering, Seoul, Korea, 13–17 April 2015. [Google Scholar]
- Zhang, C.; Zhou, G.; Yuan, Q.; Zhuang, H.; Zheng, Y.; Kaplan, L.; Wang, S.; Han, J. GeoBurst: Real-Time Local Event Detection in Geo-Tagged Tweet Streams. In Proceedings of the 39th International ACM SIGIR conference on Research and Development in Information Retrieval, Pisa, Italy, 17–21 July 2016. [Google Scholar]
- Zhou, X.; Chen, L. Event detection over twitter social media streams. VLDB J. 2014, 23, 381–400. [Google Scholar] [CrossRef]
- Atefeh, F.; Khreich, W. A Survey of Techniques for Event Detection in Twitter. Comput. Intell. 2013, 31, 132–164. [Google Scholar] [CrossRef]
- Zubiaga, A.; Spina, D.; Martínez, R.; Fresno, V. Real-time classification of Twitter trends. J. Assoc. Inf. Sci. Technol. 2015, 66, 462–473. [Google Scholar] [CrossRef]
- Cao, G.; Wang, S.; Hwang, M.; Padmanabhan, A.; Zhang, Z.; Soltani, K. A scalable framework for spatiotemporal analysis of location-based social media data. Comput. Environ. Urban Syst. 2015, 51, 70–82. [Google Scholar] [CrossRef]
- Smith, M.A. NodeXL: Simple Network Analysis for Social Media. In Encyclopedia of Social Network Analysis and Mining; Springer: New York, NY, USA, 2014. [Google Scholar]
- Barbieri, D.; Braga, D.; Ceri, S.; Della Valle, E.; Huang, Y.; Tresp, V.; Rettinger, A.; Wermser, H. Deductive and Inductive Stream Reasoning for Semantic Social Media Analytics. IEEE Intell. Syst. 2010, 25, 32–41. [Google Scholar] [CrossRef]
- Smith, M.A.; Shneiderman, B.; Milic-Frayling, N.; Mendes Rodrigues, E.; Barash, V.; Dunne, C.; Capone, T.; Perer, A.; Gleave, E. Analyzing (Social Media) Networks with NodeXL. In Proceedings of the Fourth International Conference on Communities and Technologies, New York, NY, USA, 25–27 June 2009; pp. 255–264. [Google Scholar]
- Berlanga, R.; Aramburu, M.; Llidó, D.; García-Moya, L. Towards a Semantic Data Infrastructure for Social Business Intelligence. In New Trends in Databases and Information Systems; Springer: Cham, Switzerland, 2014. [Google Scholar]
- Nebot, V.; Berlanga, R. Statistically-driven generation of multidimensional analytical schemas from linked data. Knowl.-Based Syst. 2016, 110, 15–29. [Google Scholar] [CrossRef]
- Francia, M.; Gallinucci, E.; Golfarelli, M.; Rizzi, S. Social Business Intelligence in Action. In Proceedings of the Advanced Information Systems Engineering: 28th International Conference CAiSE, Ljubljana, Slovenia, 13–17 June 2016; pp. 33–48. [Google Scholar]
- Scholl, S.R.H. Discovering OLAP dimensions in semi-structured data. Inf. Syst. 2014, 44, 120–133. [Google Scholar]
- Mauri, A.; Calbimonte, J.; Dell’Aglio, D.; Balduini, M.; Brambilla, M.; Della Valle, E. TripleWave: Spreading RDF Streams on the Web. In Proceedings of the Semantic Web—ISWC 2016. ISWC 2016, Kobe, Japan, 17–21 October 2016. [Google Scholar]
- Balduini, M.; Della Valle, E.; Dell’Aglio, D.; Tsytsarau, M.; Palpanas, T.; Confalonieri, C. Social Listening of City Scale Events Using the Streaming Linked Data Framework; Springer: Berlin/Heidelberg, Germany, 2013; pp. 1–16. [Google Scholar]
- Zeng, D.; Chen, H.; Lusch, R. Social Media Analytics and Intelligence. IEEE Intell. Syst. 2010, 25, 13–16. [Google Scholar] [CrossRef]
- Nadal, S.; Herrero, V.; Romero, O.; Abelló, A.; Franch, X.; Vansummeren, S.; Valerio, D. A software reference architecture for semantic-aware Big Data systems. Inf. Softw. Technol. 2017, 90, 75–92. [Google Scholar] [CrossRef]
- Stonebraker, M.; Çetintemel, U.; Zdonik, S. The 8 Requirements of Real-Time Stream Processing. SIGMOD Rec. 2005, 34, 42–47. [Google Scholar] [CrossRef]
- Marz, N.; Warren, J. Big Data: Principles and Best Practices of Scalable Realtime Data Systems, 1st ed.; Manning Publications Co.: Greenwich, CT, USA, 2015. [Google Scholar]
- Javed, M.H.; Lu, X.; Panda, D.K. Characterization of Big Data Stream Processing Pipeline: A Case Study using Flink, Kafka. In Proceedings of the Fourth IEEE/ACM International Conference on Big Data Computing, Applications, Technologies, New York, NY, USA, 5–8 December 2017; pp. 1–10. [Google Scholar]
- Hebeler, J.; Fisher, M.; Blace, R.; Perez-Lopez, A. Semantic Web Programming; John Wiley & Sons: Hoboken, NJ, USA, 2009. [Google Scholar]
- DBPedia Live. Available online: https://wiki.dbpedia.org/online-access/DBpediaLive (accessed on 20 June 2018).
- BabelNet Live. Available online: http://live.babelnet.org/ (accessed on 20 June 2018).
- Romero, O.; Abelló, A. A framework for multidimensional design of data warehouses from ontologies. Data Knowl. Eng. 2010, 69, 1138–1157. [Google Scholar] [CrossRef]
- Barbieri, D.F.; Braga, D.; Ceri, S.; Della Valle, E.; Grossniklaus, M. Querying RDF streams with C-SPARQL. SIGMOD Rec. 2010, 39, 20–26. [Google Scholar] [CrossRef]
- OWL Language. Available online: https://www.w3.org/OWL/ (accessed on 20 June 2018).
- JSON-LD. Available online: https://json-ld.org/ (accessed on 20 June 2018).
- Anaconda. Available online: https://anaconda.org/ (accessed on 20 June 2018).
© 2018 by the authors. Licensee MDPI, Basel, Switzerland. This article is an open access article distributed under the terms and conditions of the Creative Commons Attribution (CC BY) license (http://creativecommons.org/licenses/by/4.0/).