Electrical Model for Analyzing Chemical Kinetics, Lasing and Bio-Chemical Processes
Abstract
:1. Introduction

2. Simulation Modeling


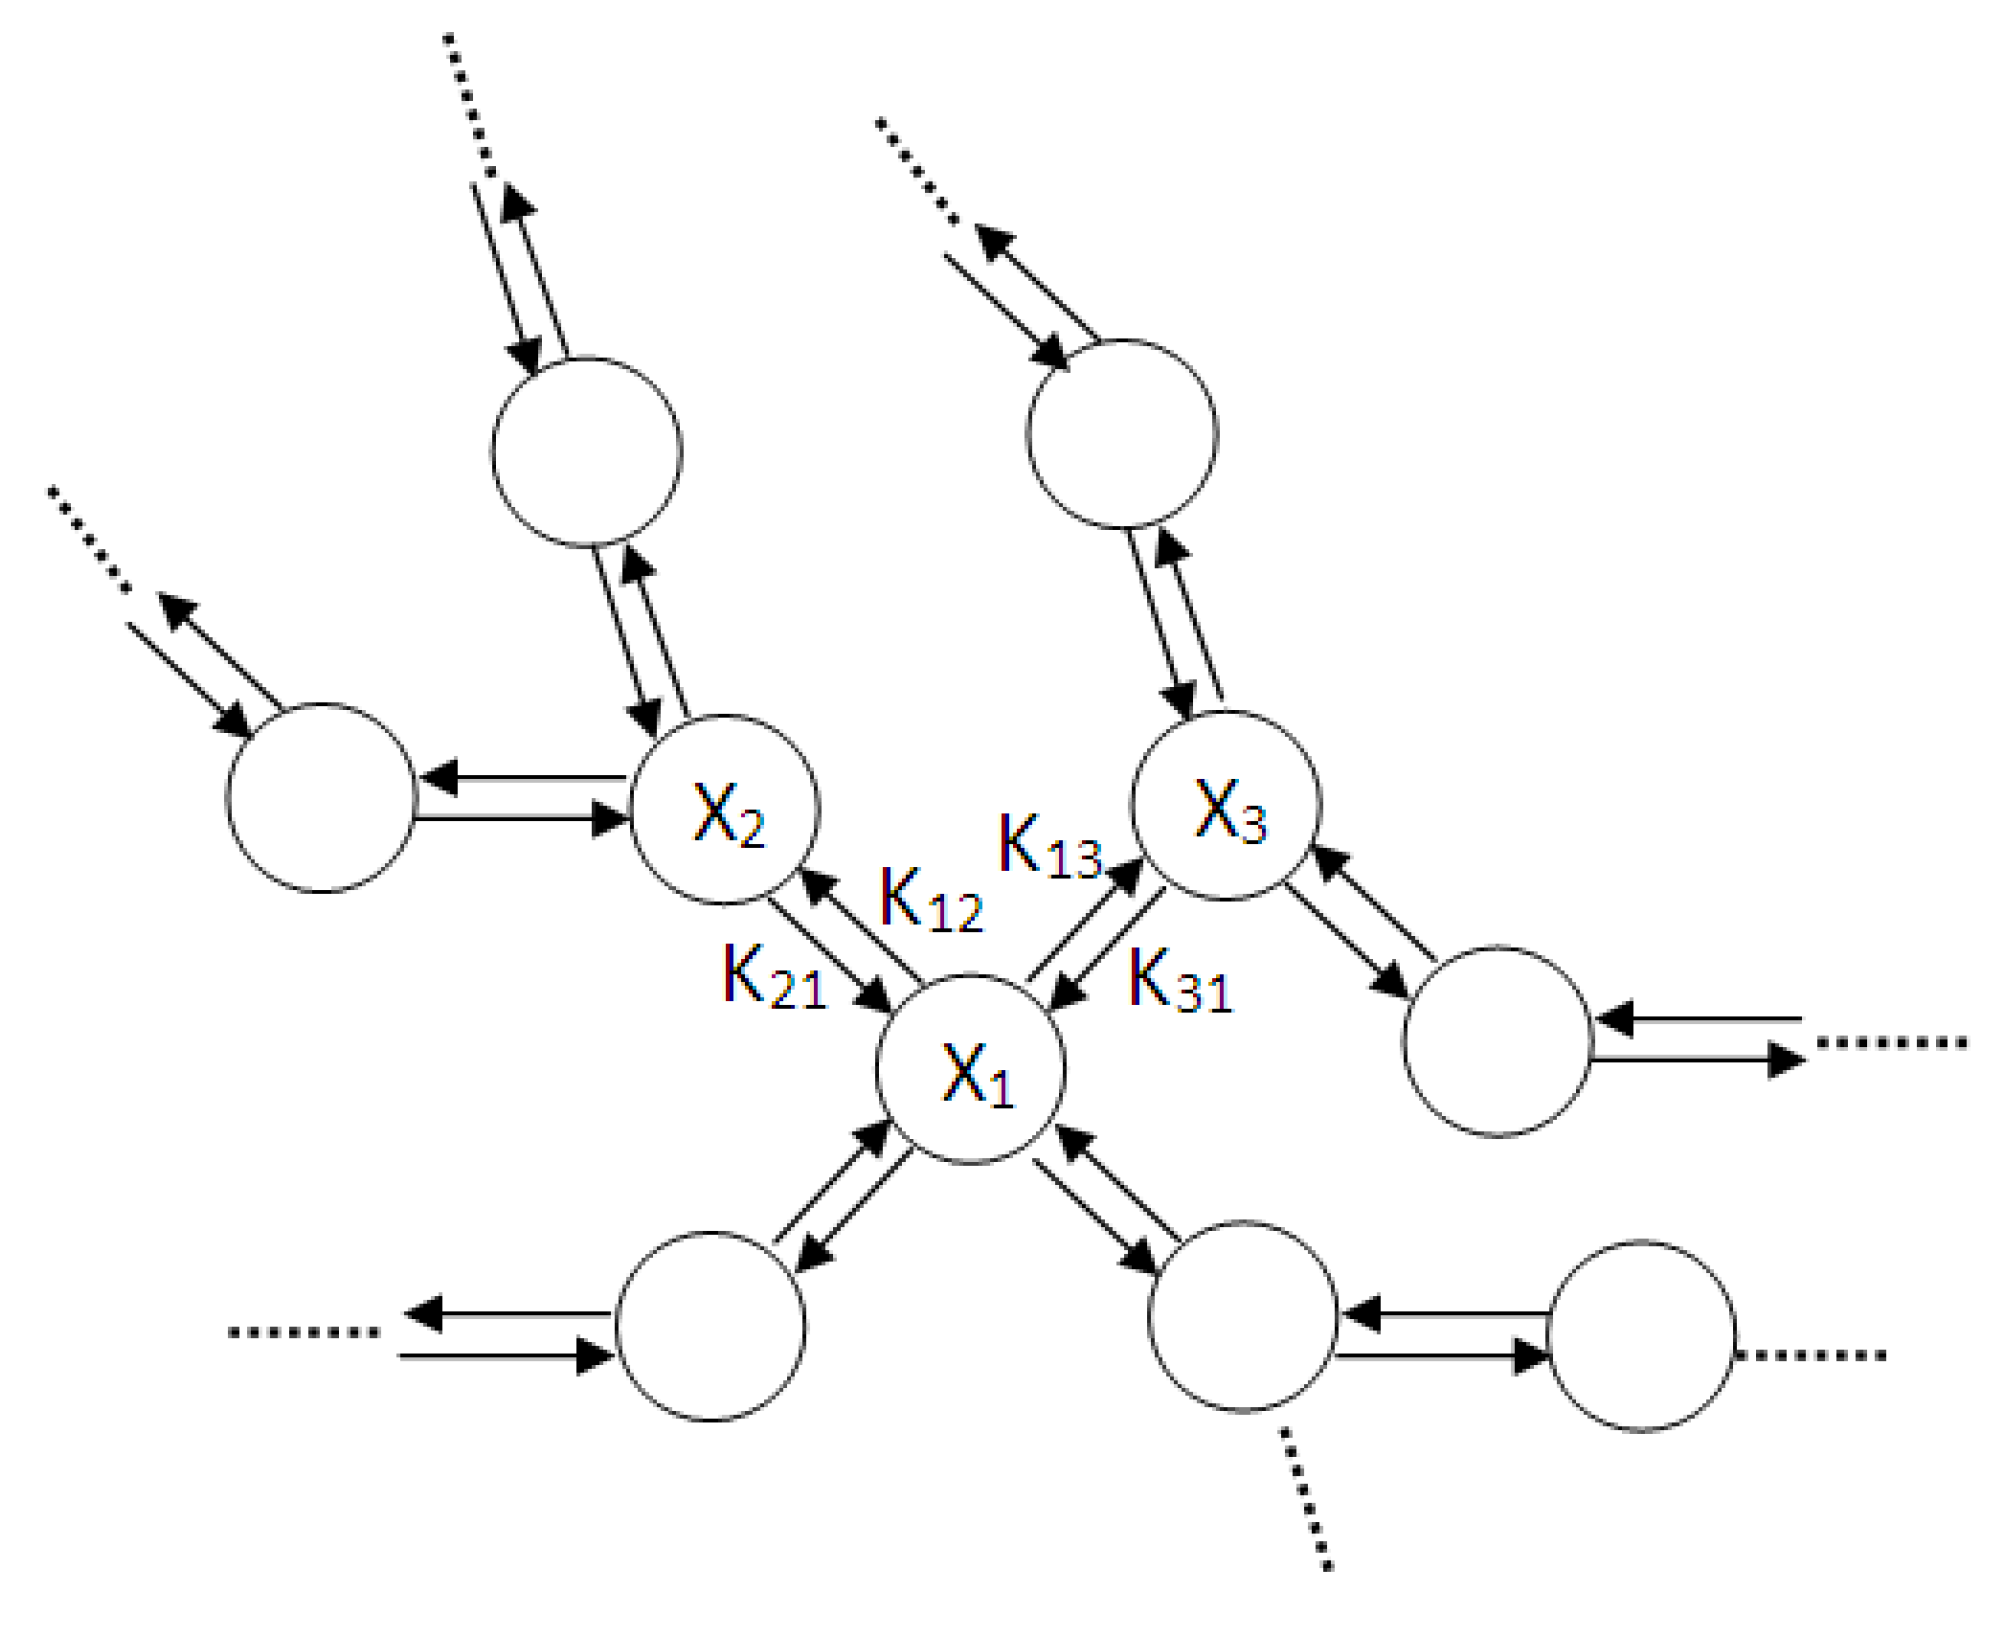
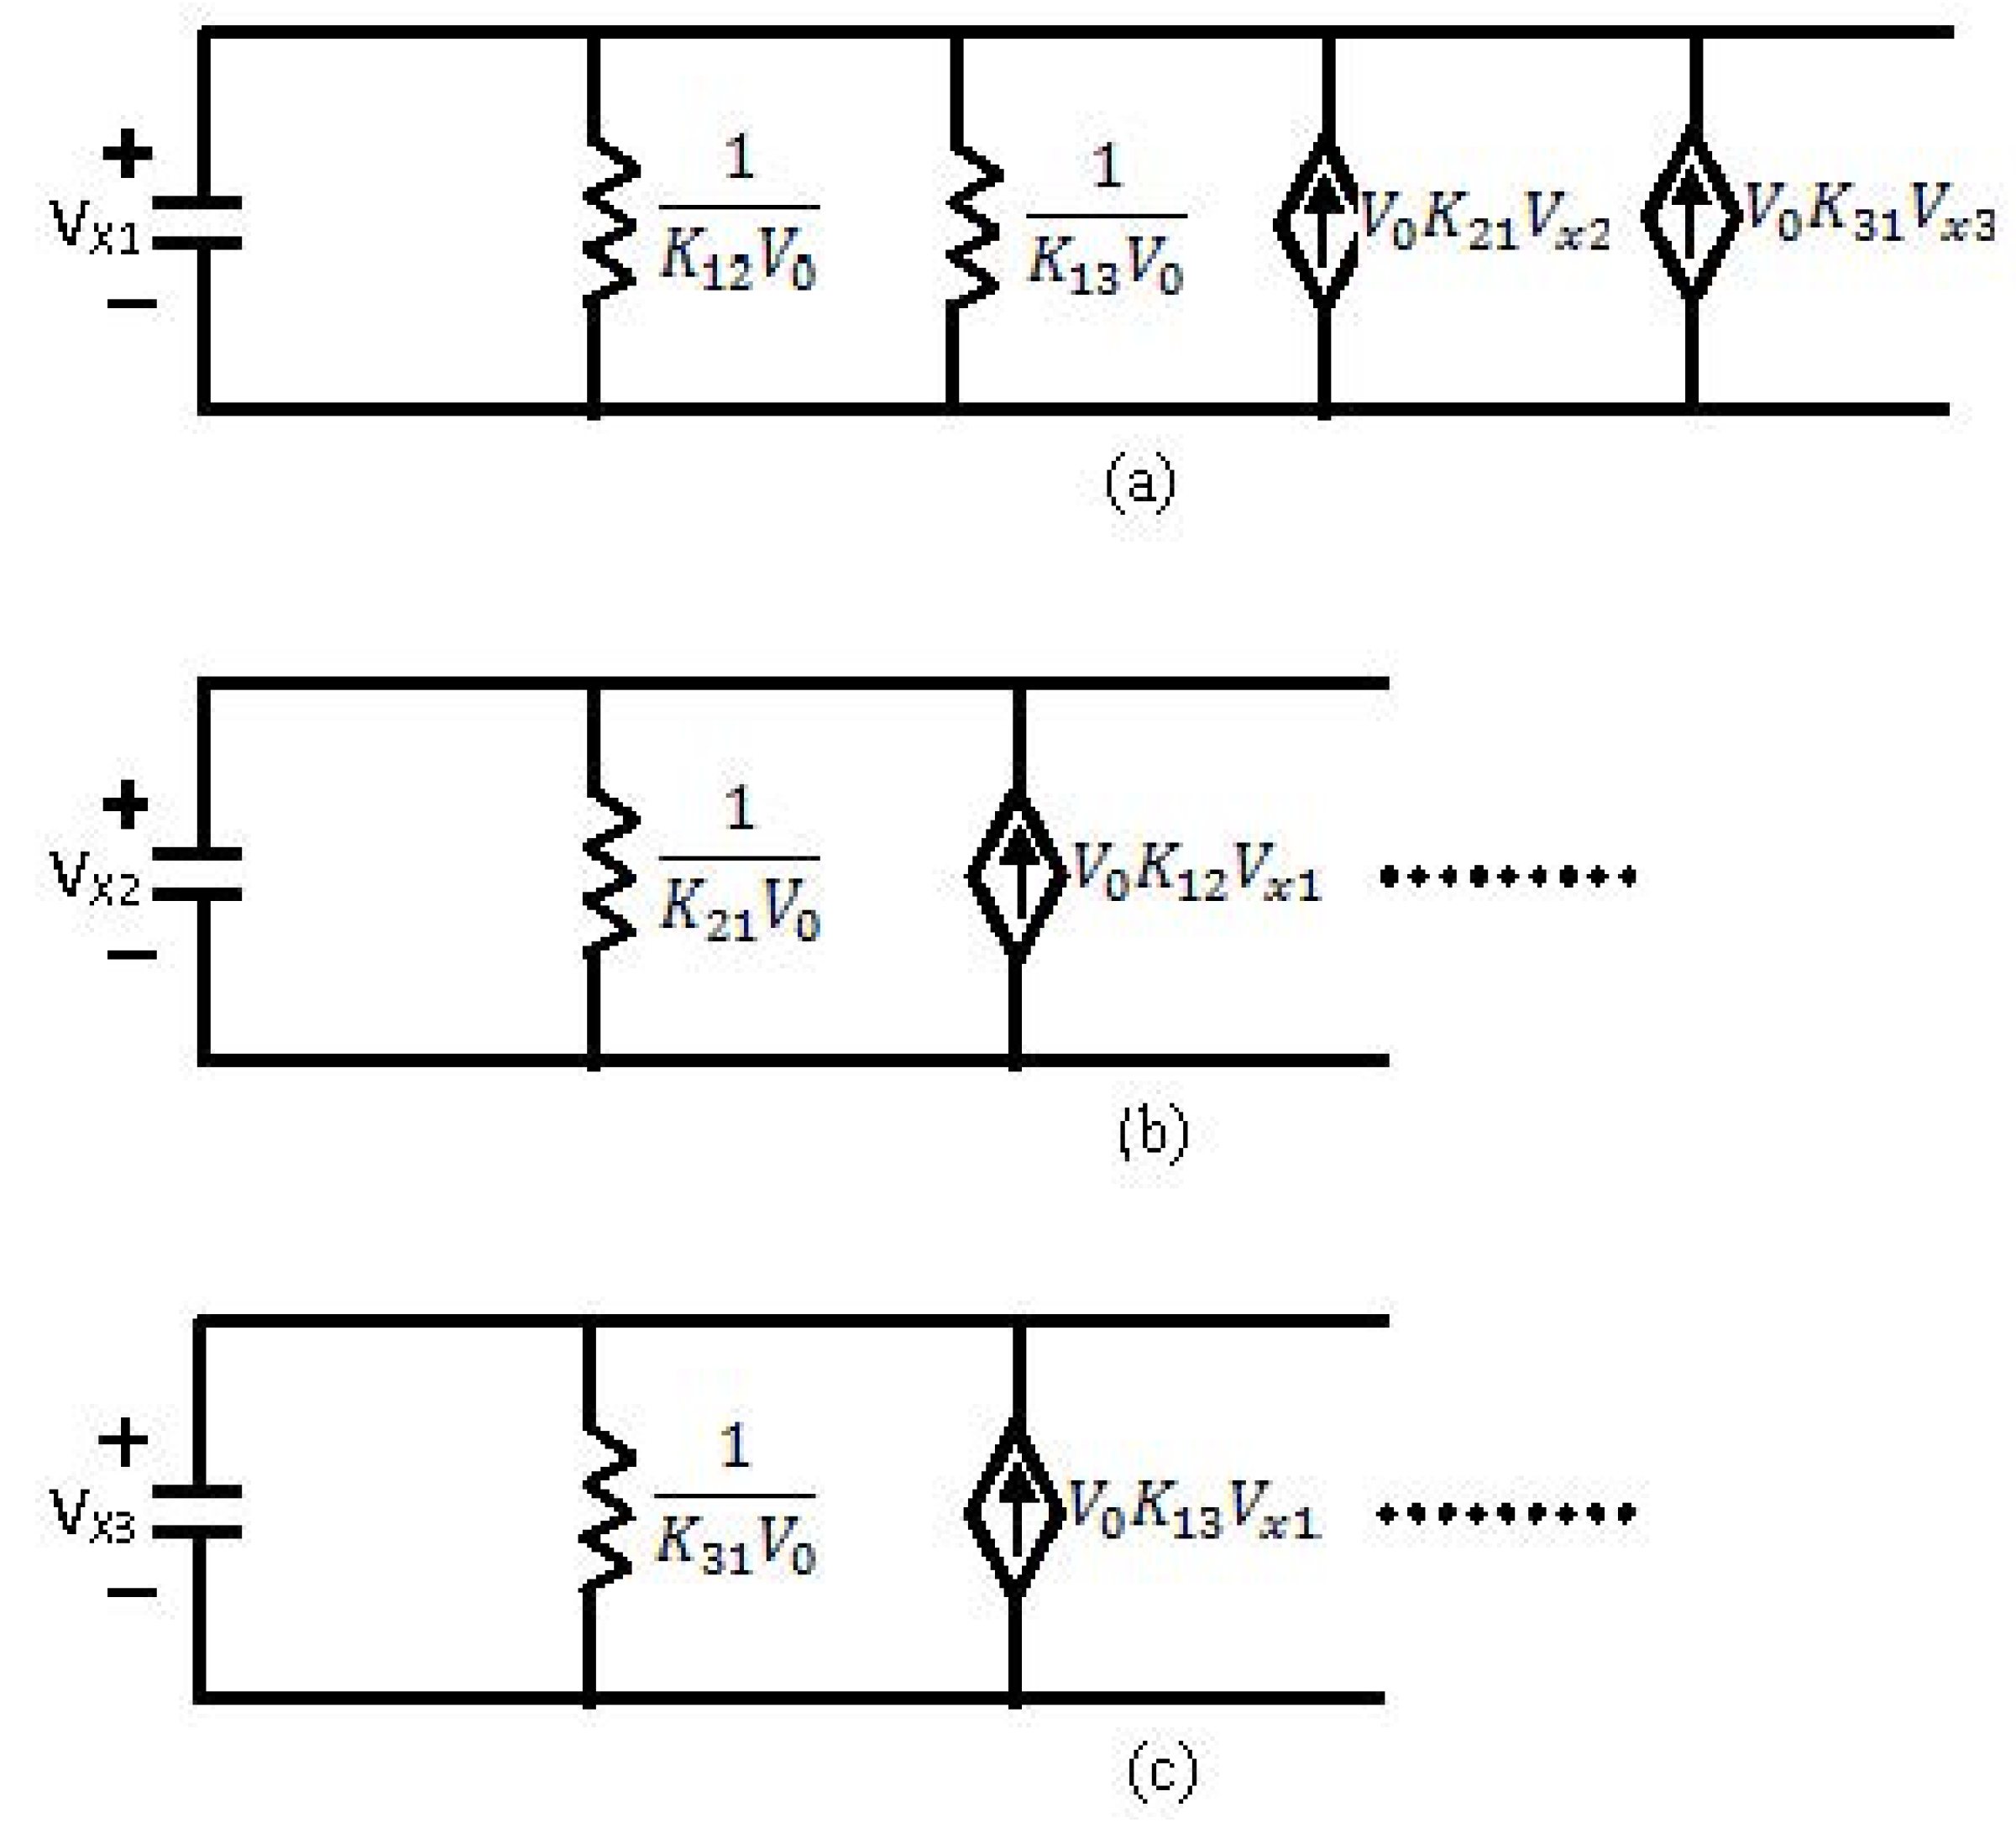
- For each chemical element a different analogous circuit should be drawn.
- The circuit is drawn only according to the chemical reaction equations.
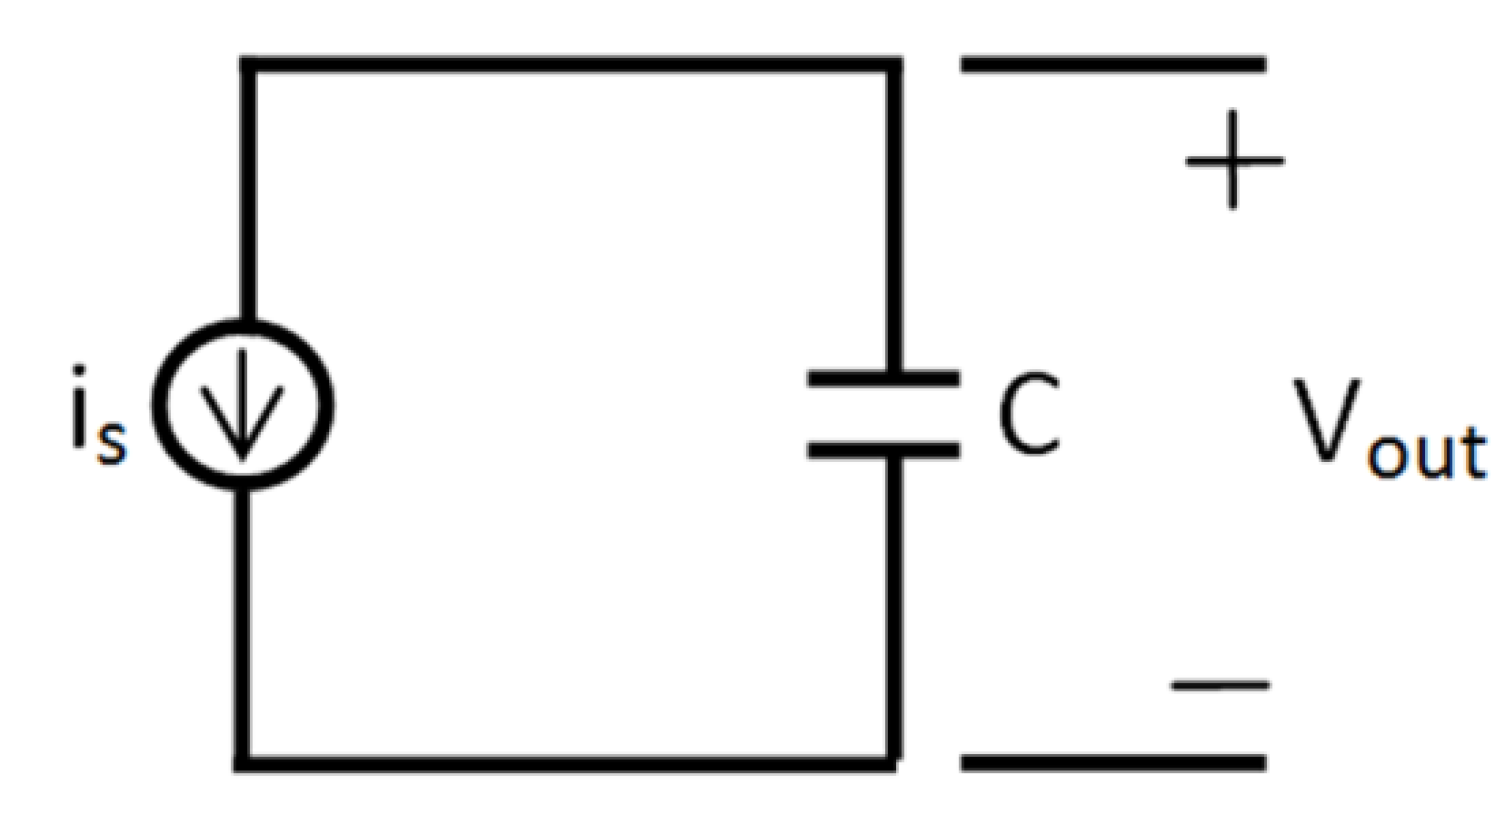
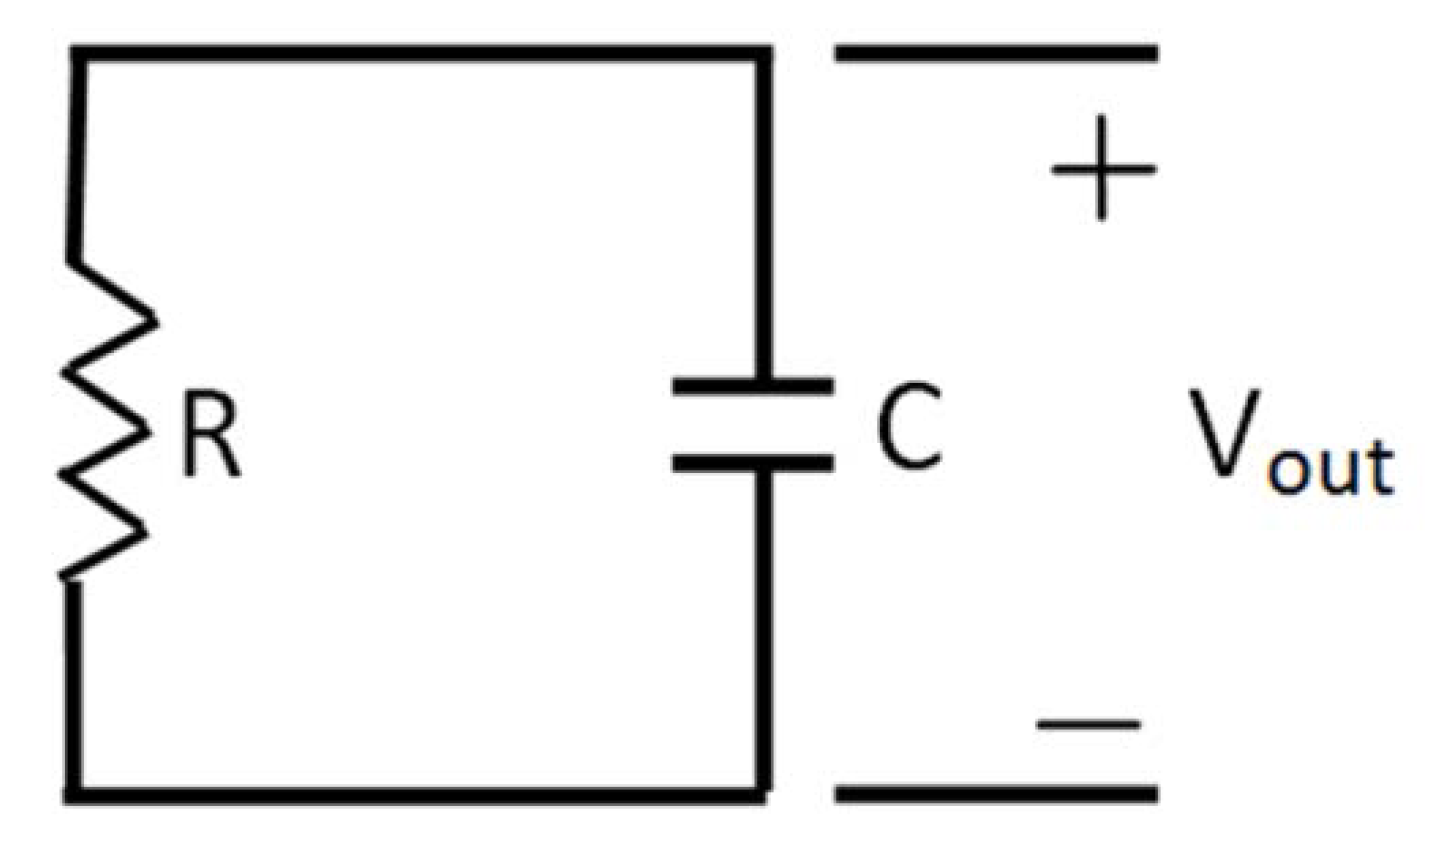
- First a capacitor is drawn. The voltage upon this capacitor (VC) will be analogous to the concentration of the certain element.
- Each arrow getting out of this element in its chemical reaction equation will be represented by a resistance in parallel to the capacitor. This is because each resistance is drawing current from the capacitor, an effect that is analogous to the “chemical current drawing”, i.e., the decomposition of one element and the creation of a new one. The value of each such resistance is
.
- Each arrow pointing toward our element will correspond to a controlled current source, parallel to the resistance and the capacitor. Each current source like this will provide current to the capacitor, a phenomenon that is analogous to “chemical reaction” supplied by the decomposing element for the creation of a new element. The value of the current will be kiVi which is written in the base of this arrow while pointing toward the new element.
3. Results and Discussion
3.1. Chemical Kinetics Reactions


 are compatible. In addition, since
  the units of k and v are the same and equal to the chemical reaction velocity (i.e., concentration/time).


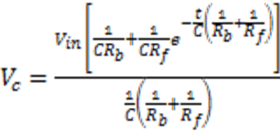


 ) and there is a complete converges to the first order reaction (as seen in the previous model shown in Figure 4).
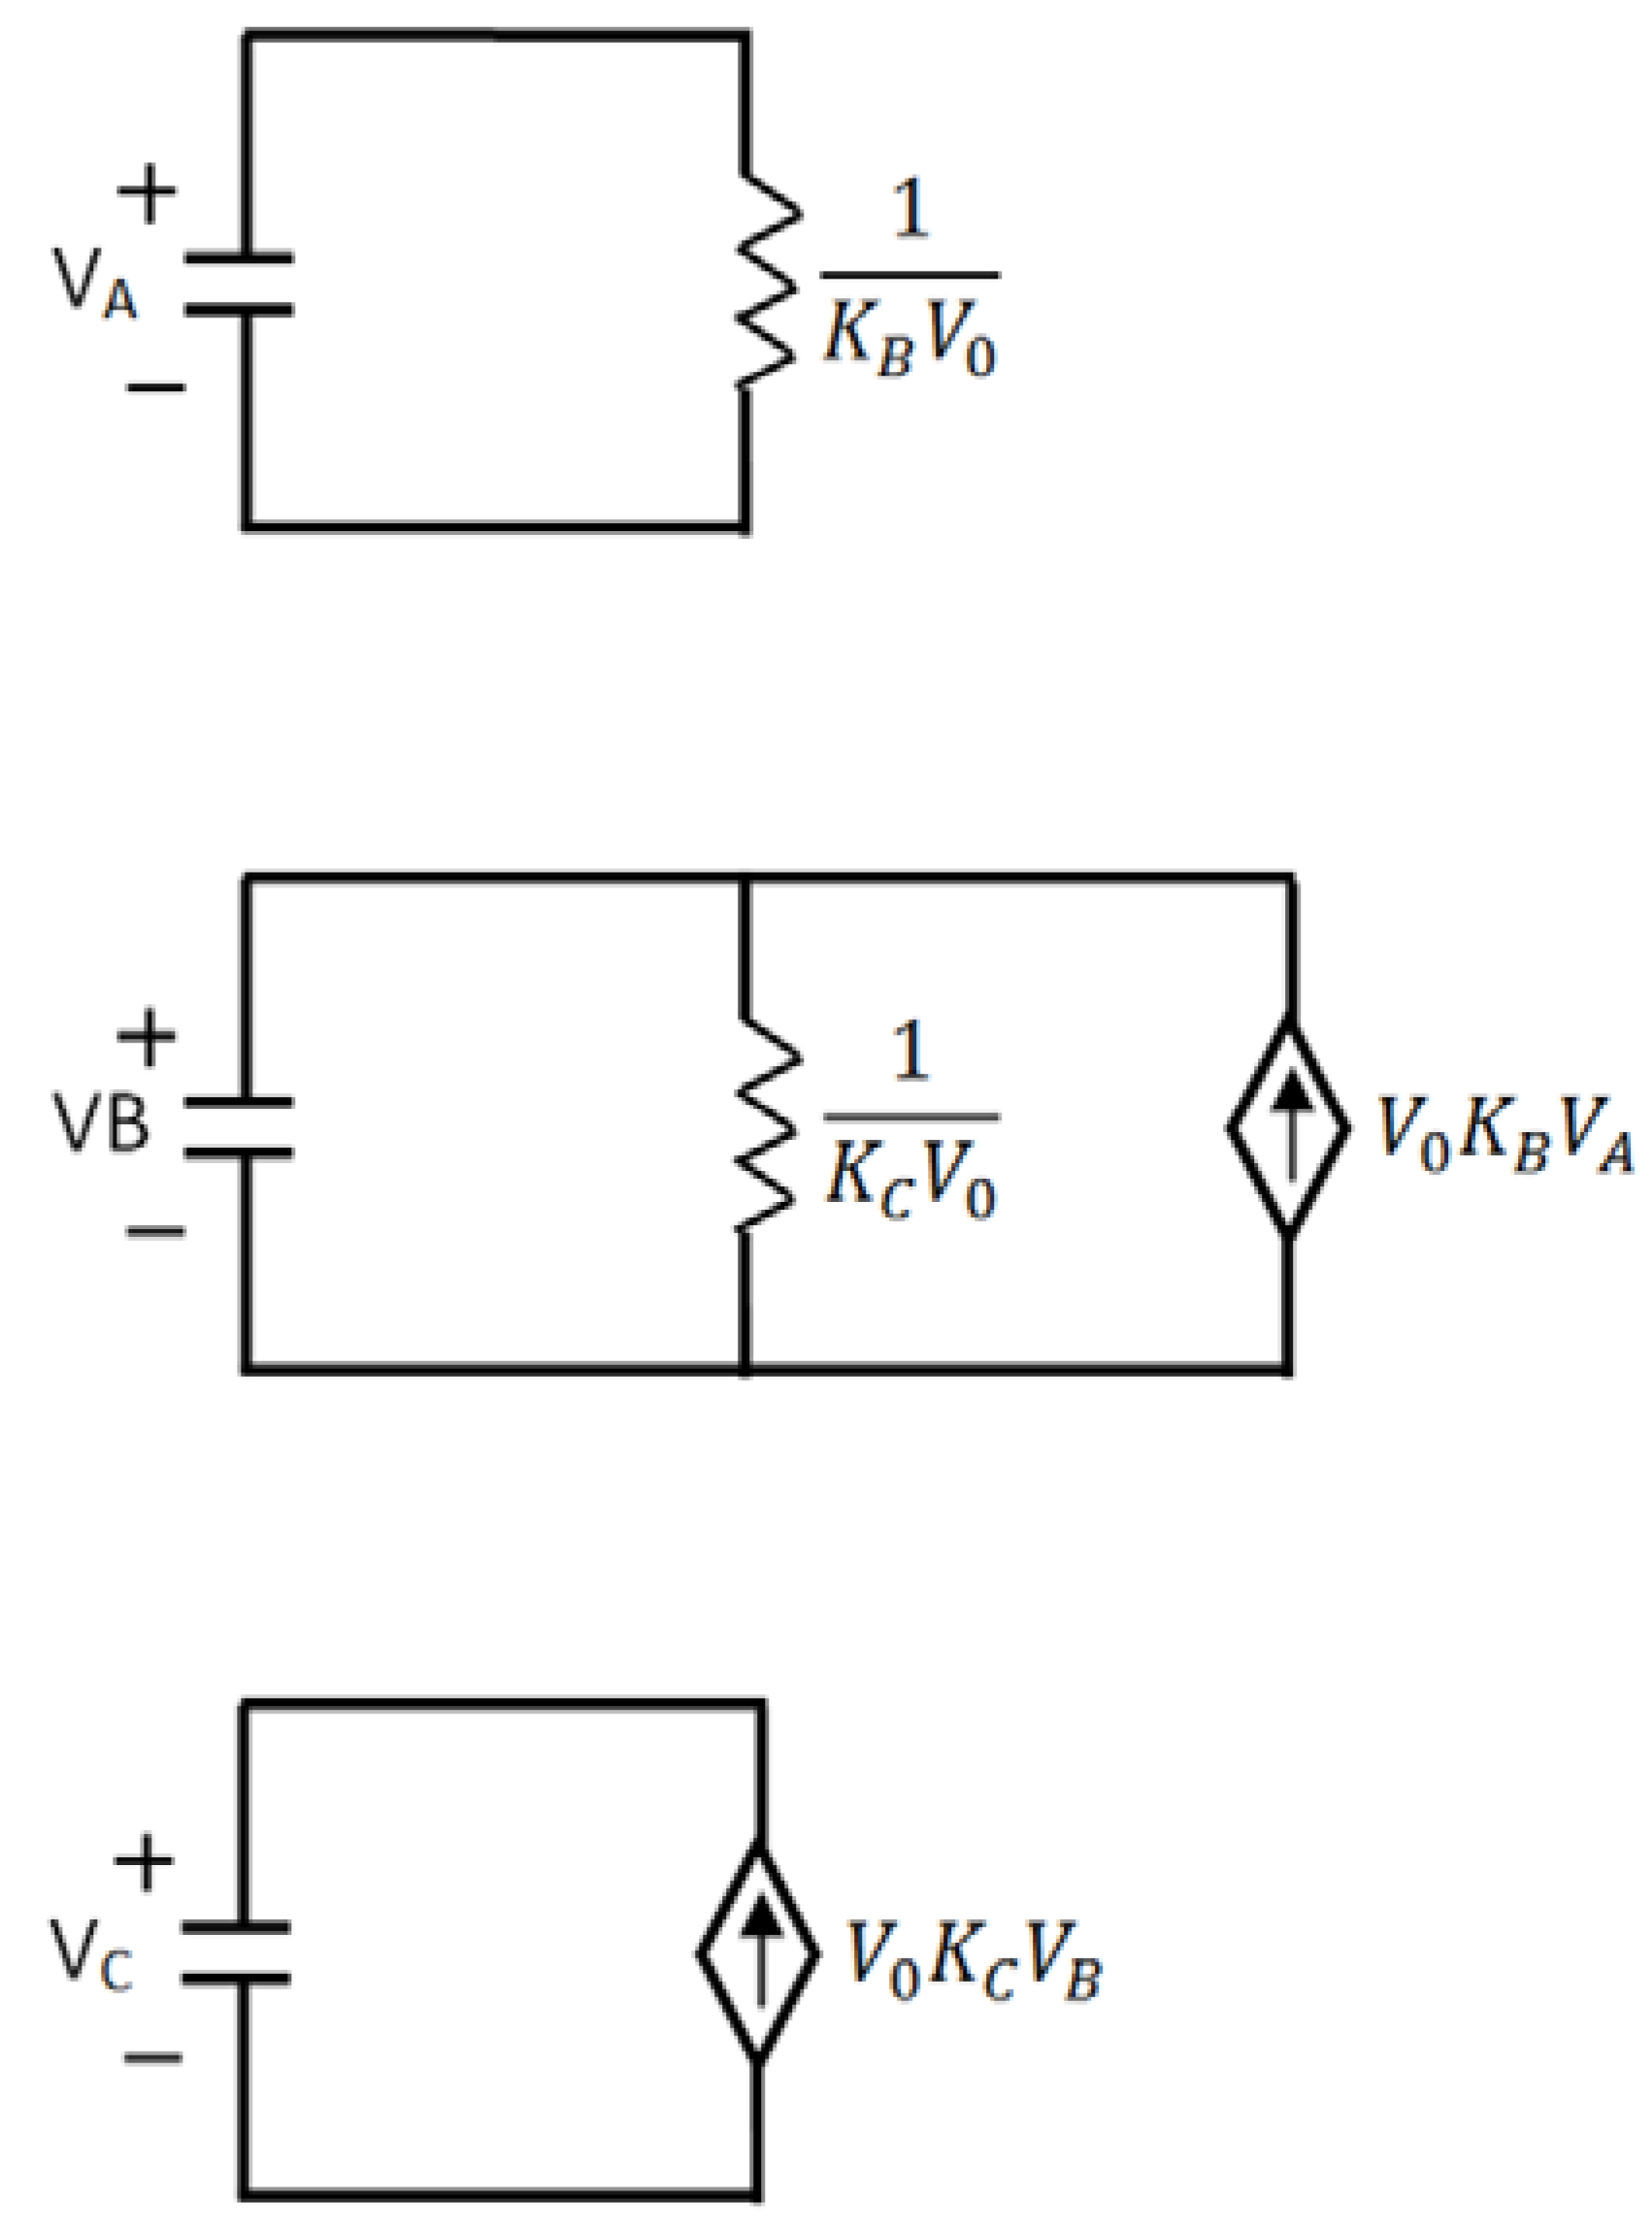
 has been chosen. The reaction constants used in the simulations are: kb = 0.1 [min−1], kc = 0.05 [min−1], [A]0 = 1, [B]0 = 0, [C]0 = 0. Figure 6 shows the analogous electrical circuit used for this reaction. VA, VB and VC are the analogous voltages of concentrations [A], [B] and [C], respectively. The circuit is designed according to Figure 1, Figure 2. The output of the electrical simulation software is shown in Figure 7. The solid line presents the concentration of element A, while the dashed and the dotted lines present the concentrations of elements, B and C, respectively. According to [1], one may see the complete compatibility between the desired output and simulation results.


 was adjusted in the electrical circuit in order to obtain compatibility with experimental reference data. The constant that gave good compatibility was k = 0.0123 [min−1], which is indeed the correct rate constant of this reaction. Figure 8 shows the compatibility between the experimental reference data and the measured analogous output (i.e., voltage) related to the adjusted rate constant. The experimental data and the measured voltage were drawn in solid and dashed lines, respectively.
3.2. Opto-Chemical Analysis

 , υ is the radiation frequency and υo is the atom’s resonant frequency. h = 6.626 × 10⁻³⁴ [J·sec] is the Planck’s constant. The common case is related to a narrow band illumination described by:


 and
and  . a and M are the atom’s radius and mass, respectively, P is the pressure in the tube and T is the temperature. In the experimental simulation we assumed that the material is illuminated at a radiation frequency that is near the resonant frequency of the atom υo and thus:

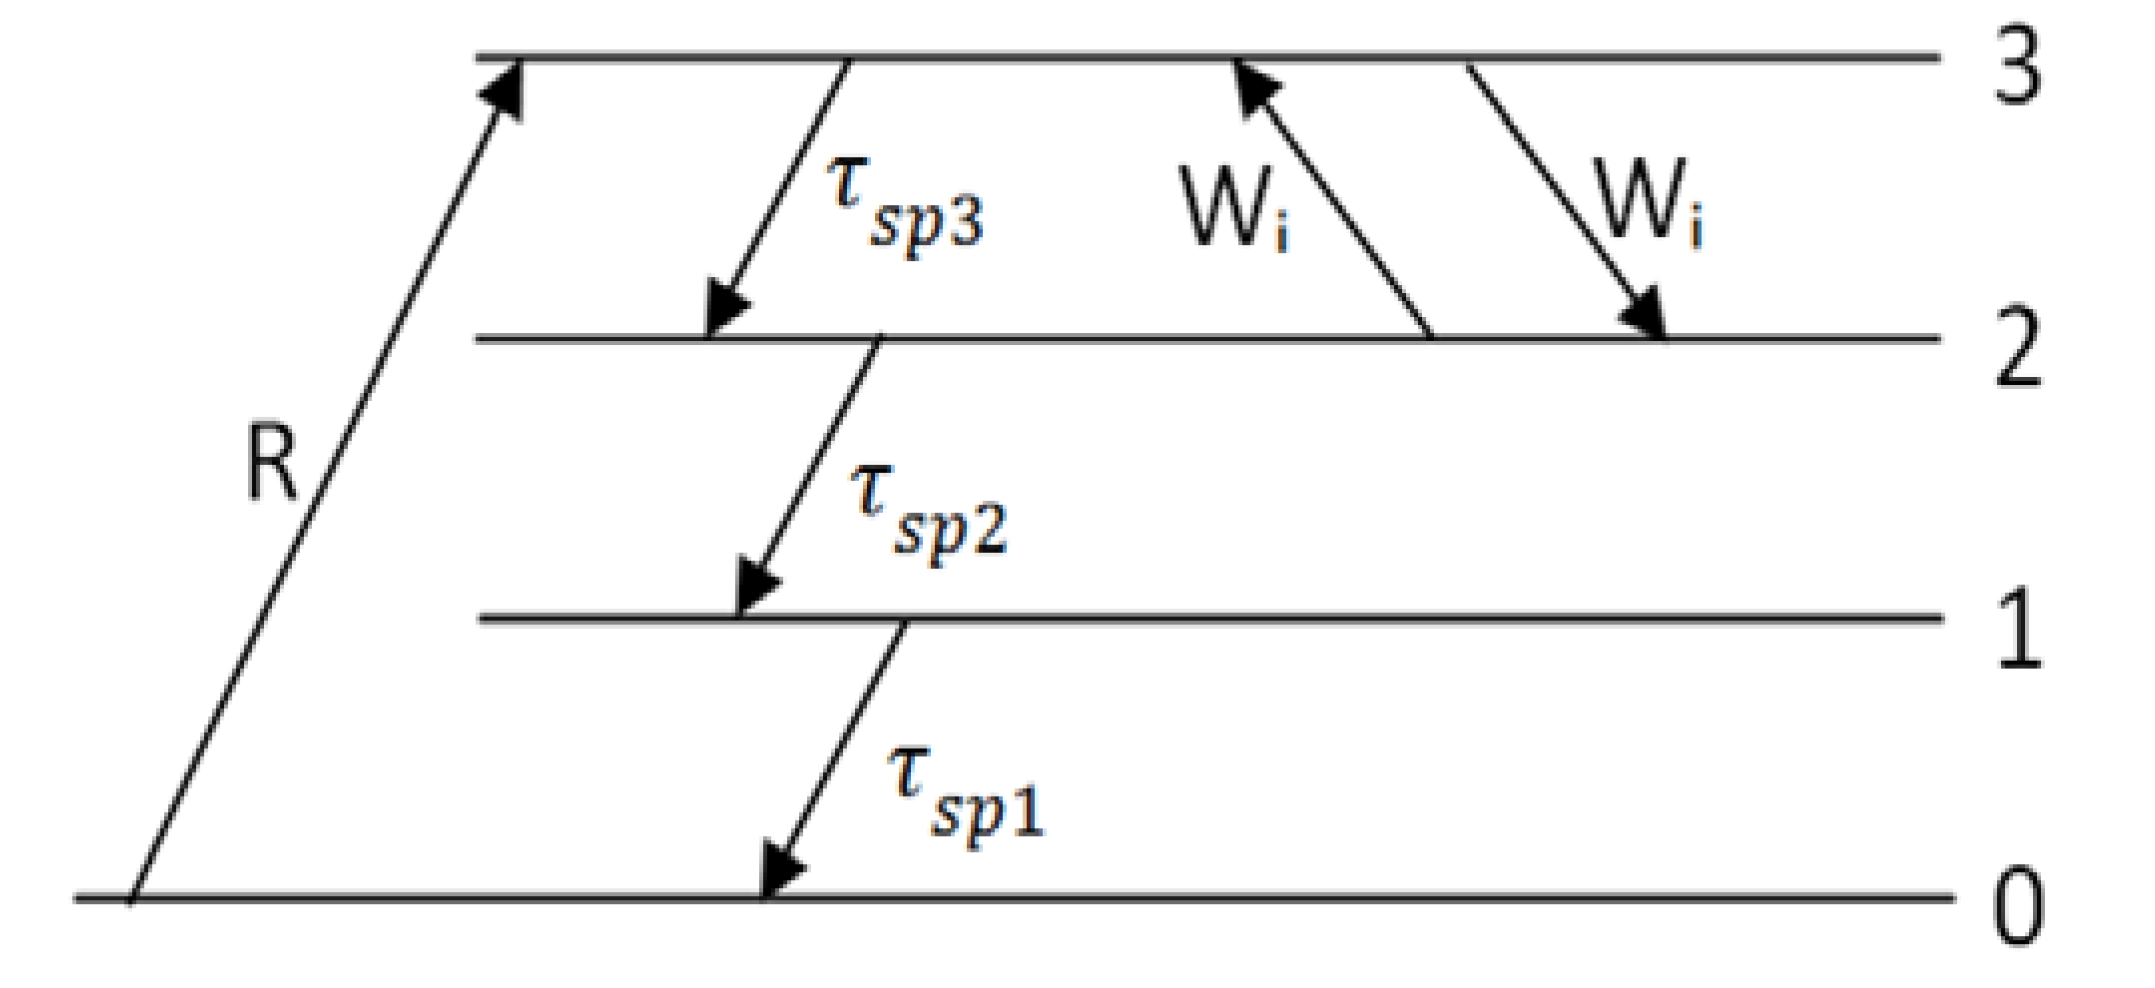


3.3. Bio Chemical Applications
3.3.1. Bio Chemical Analysis of Kinetics of Cell’s Membrane


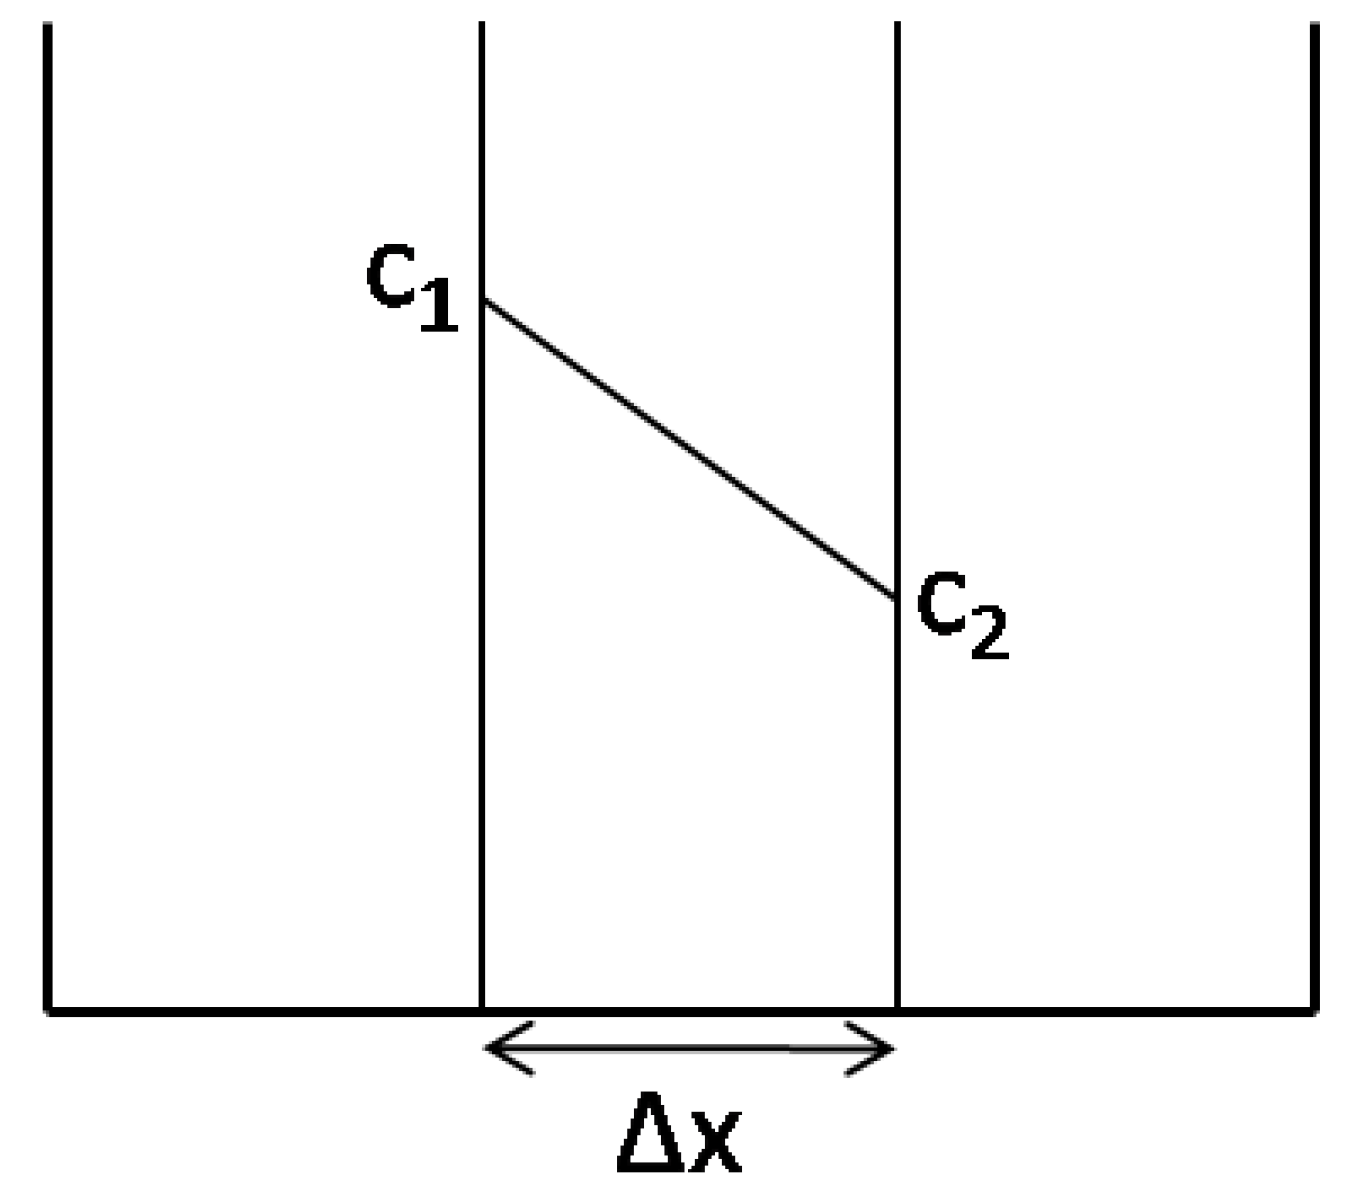


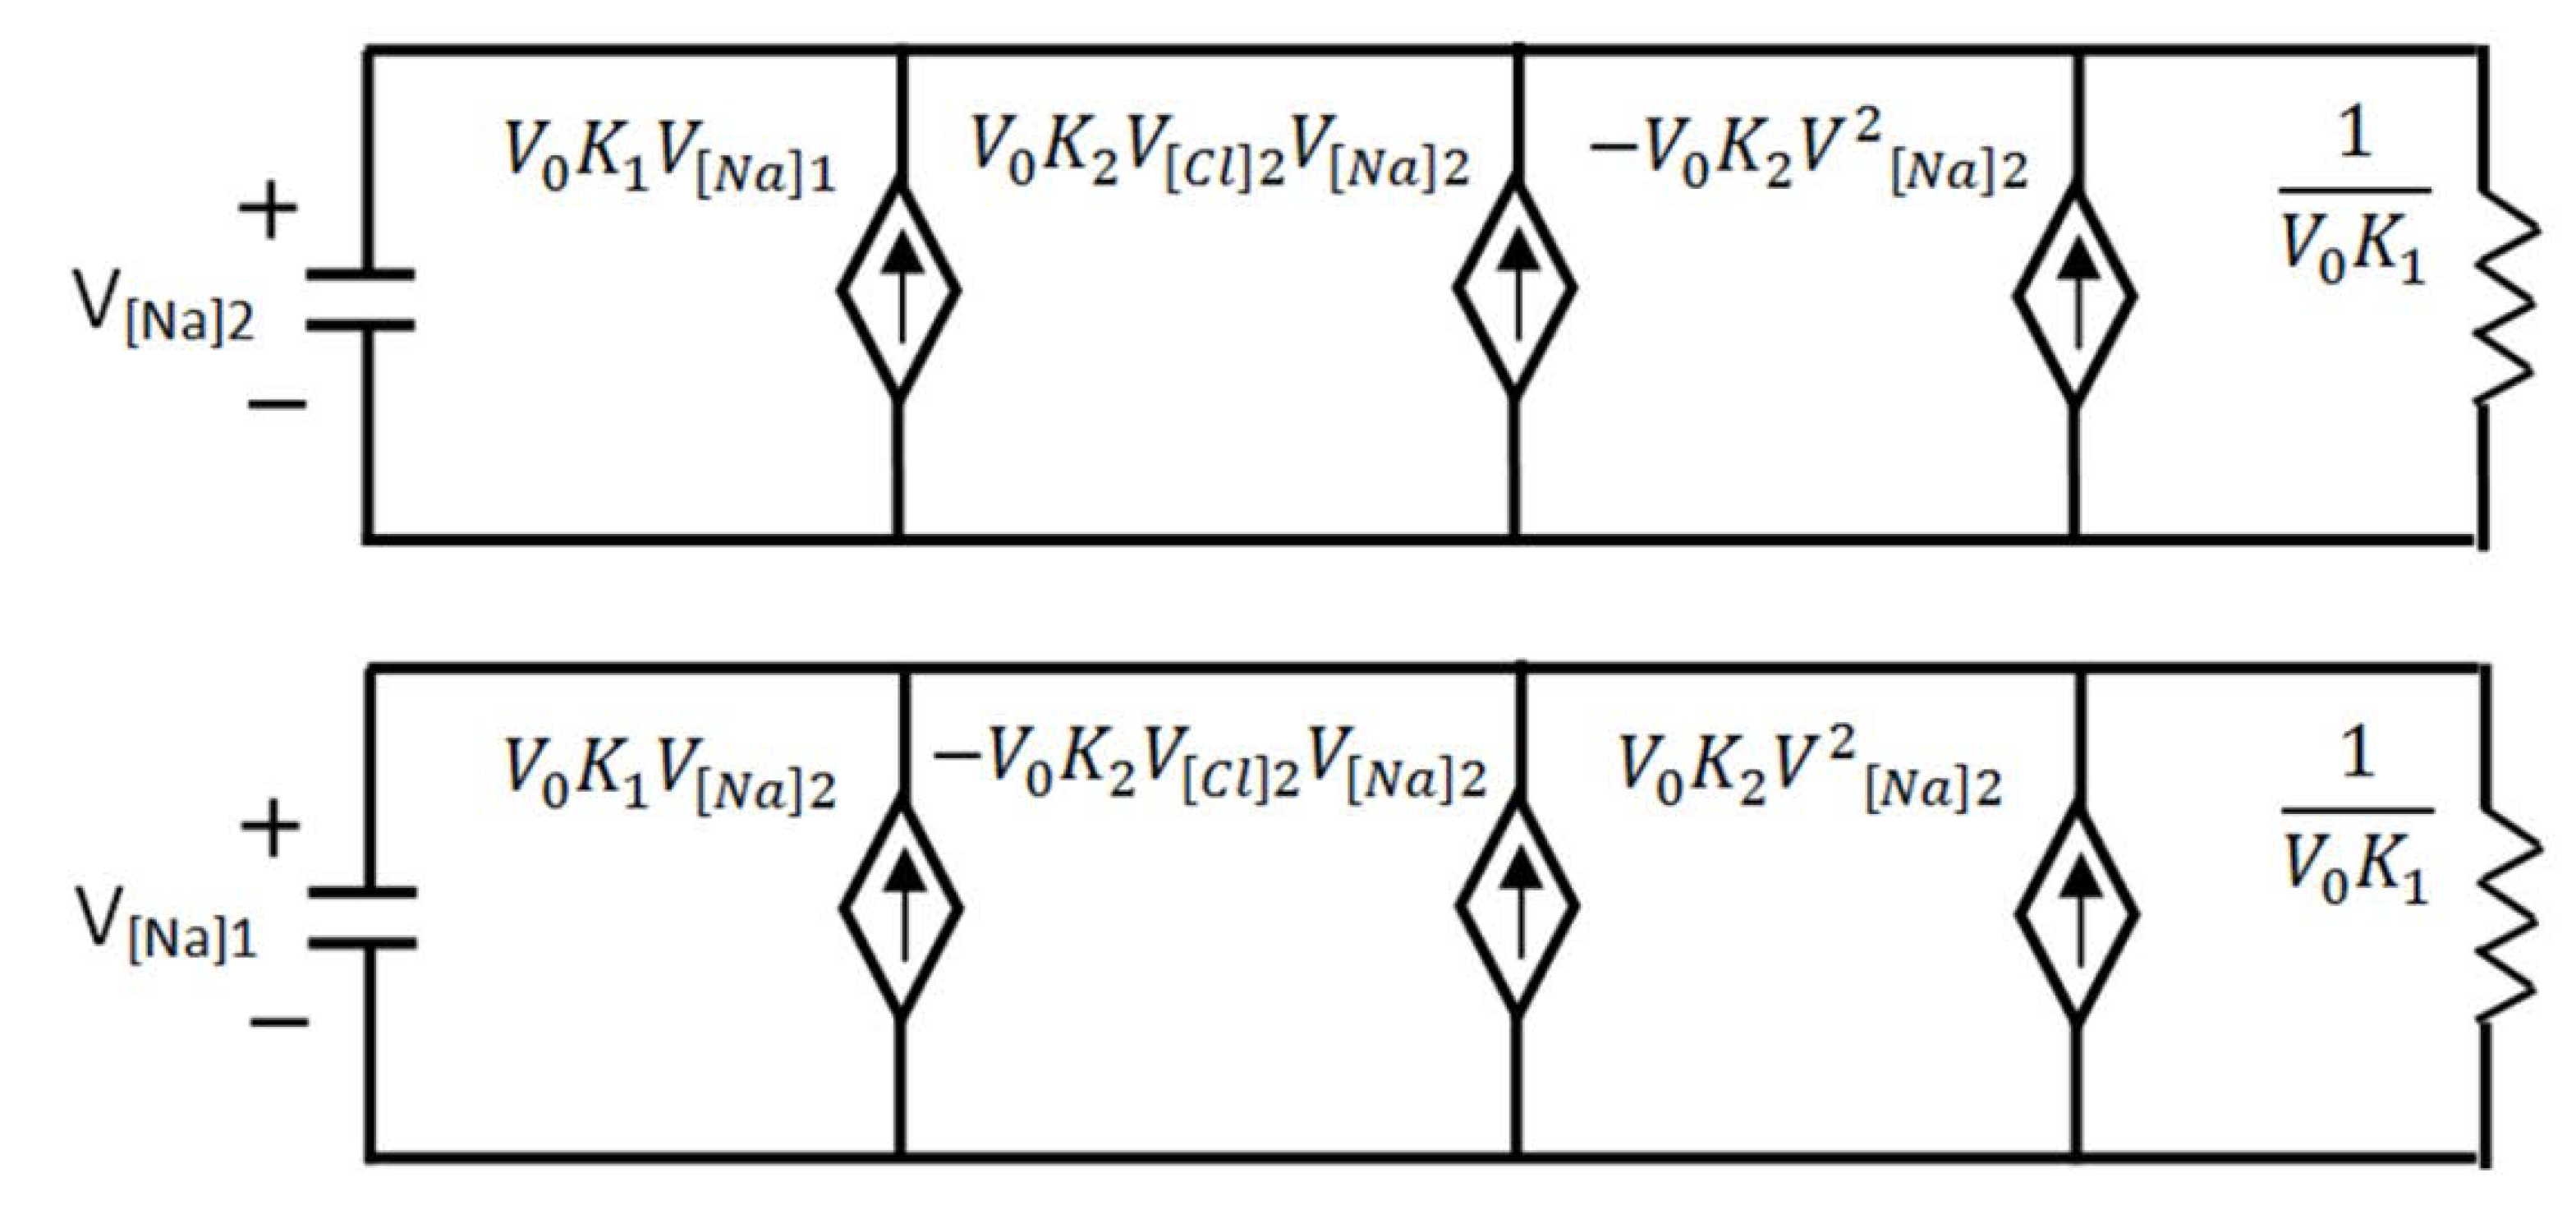


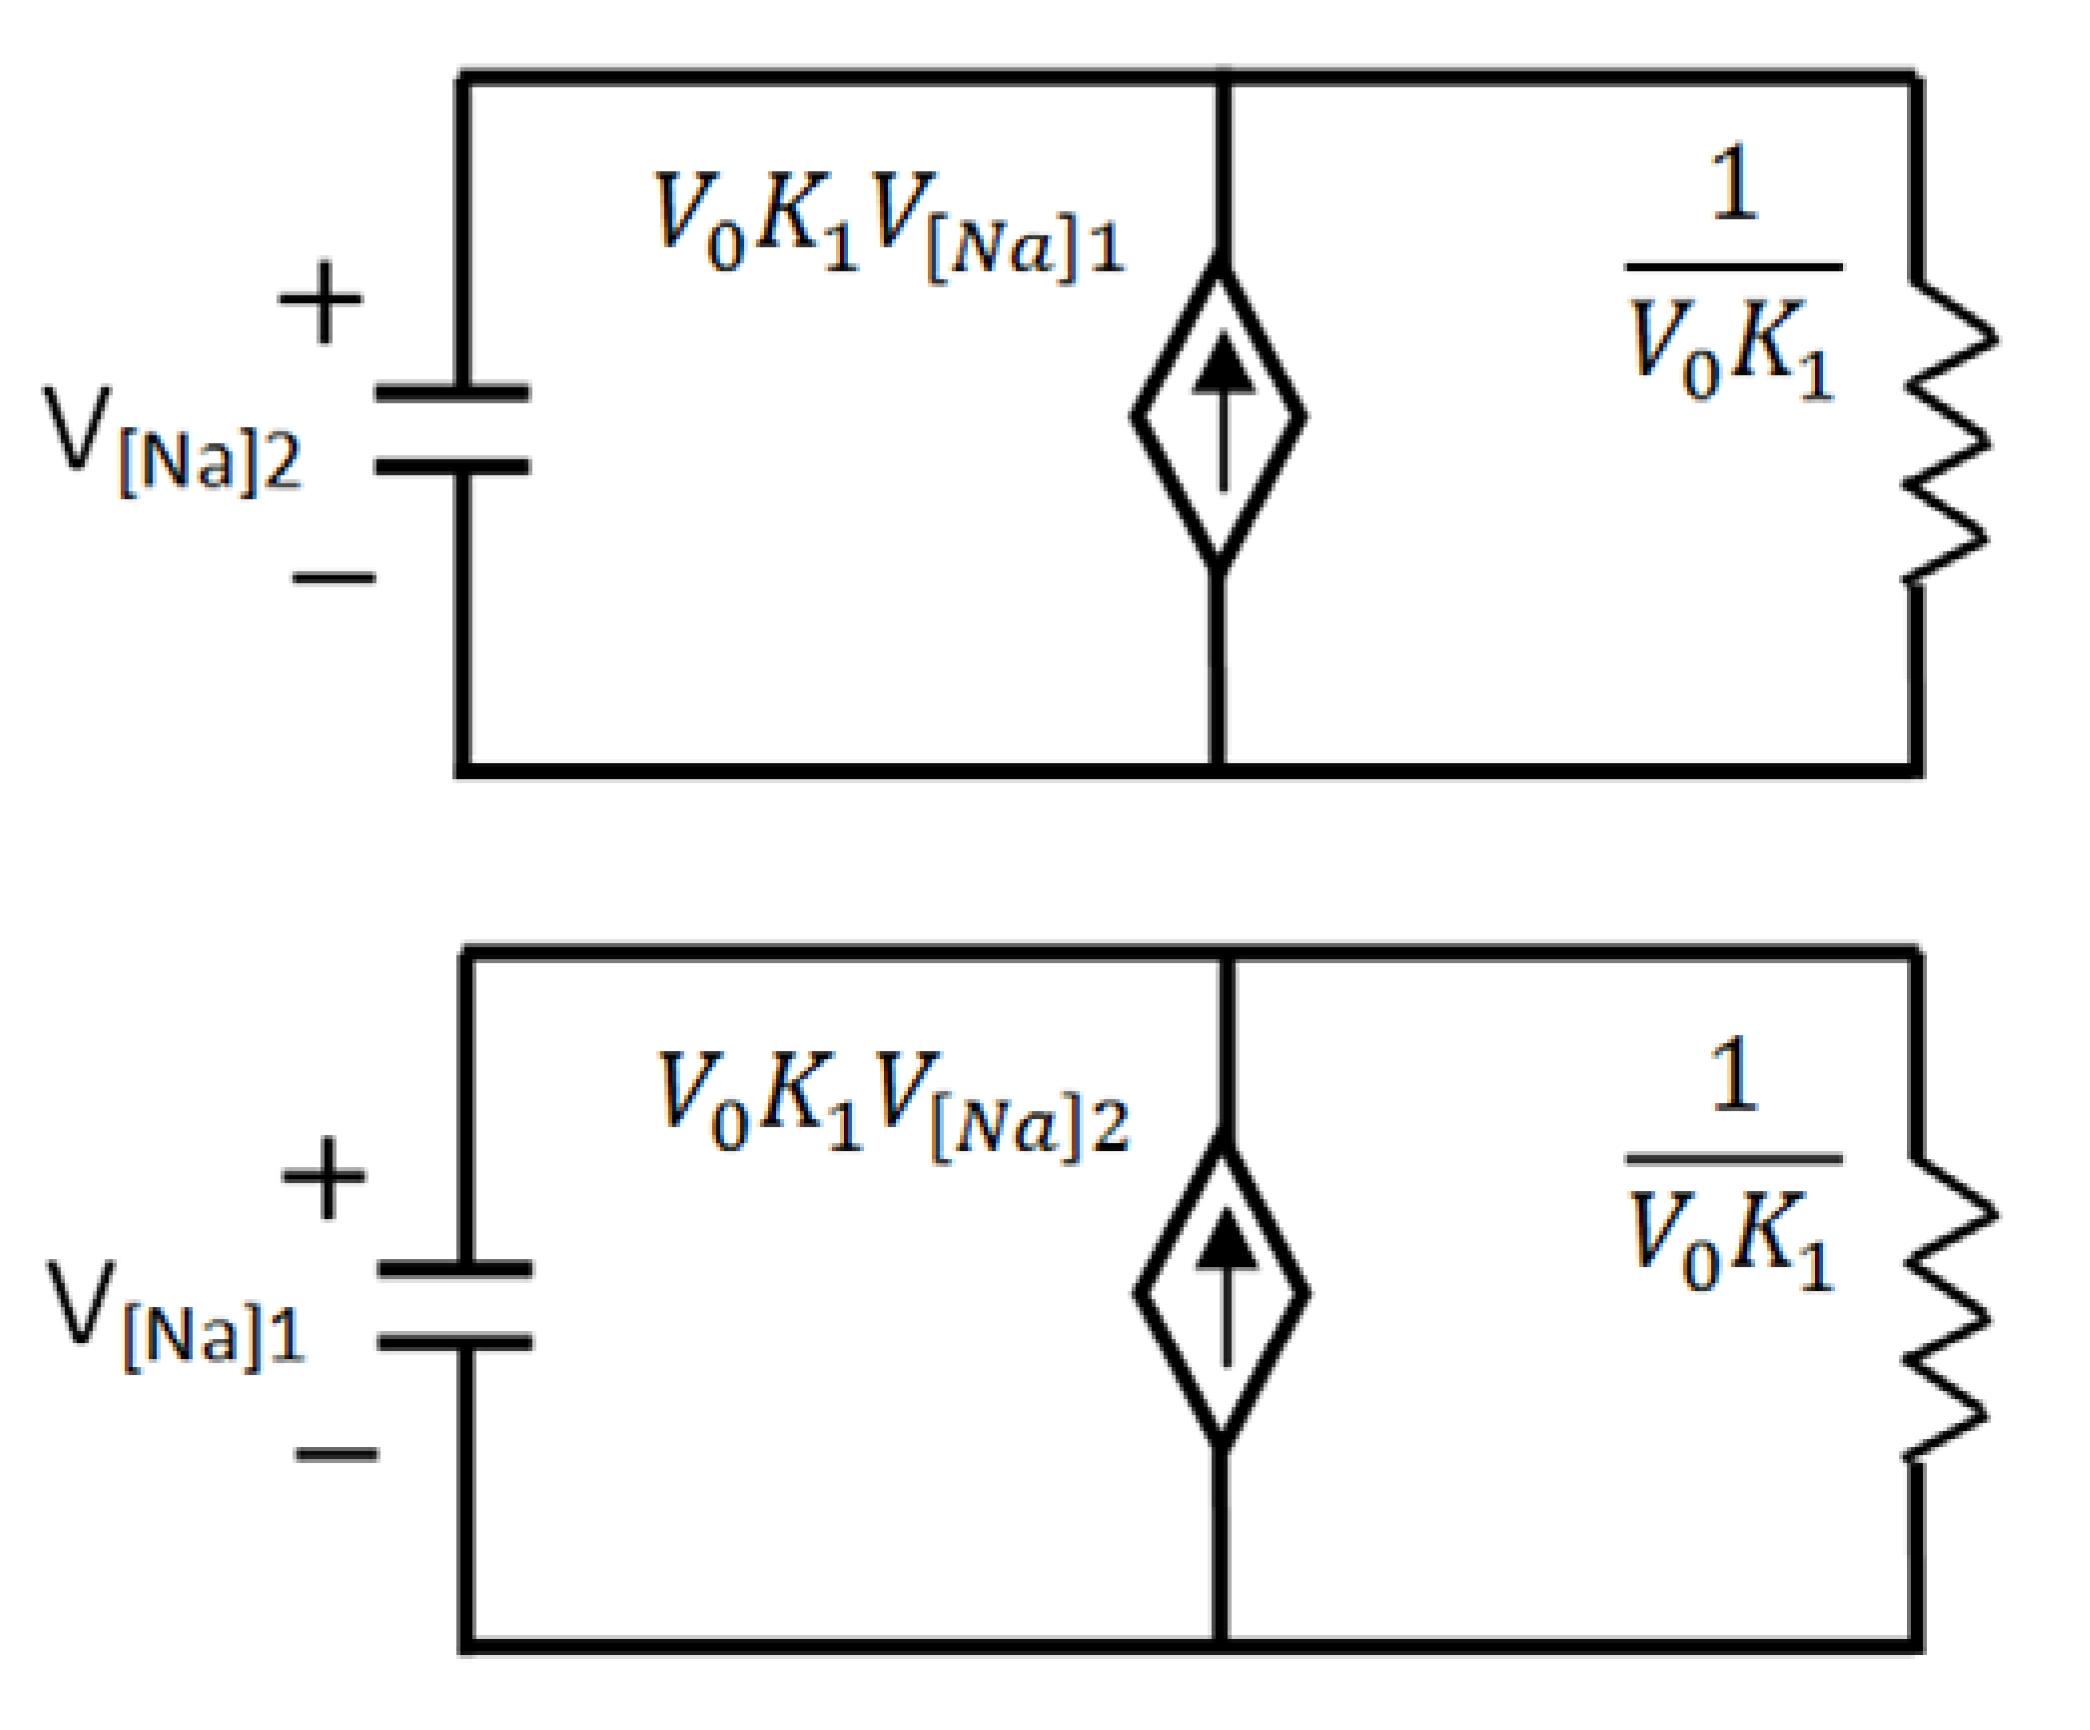
3.3.2. Osmosis Kinetics
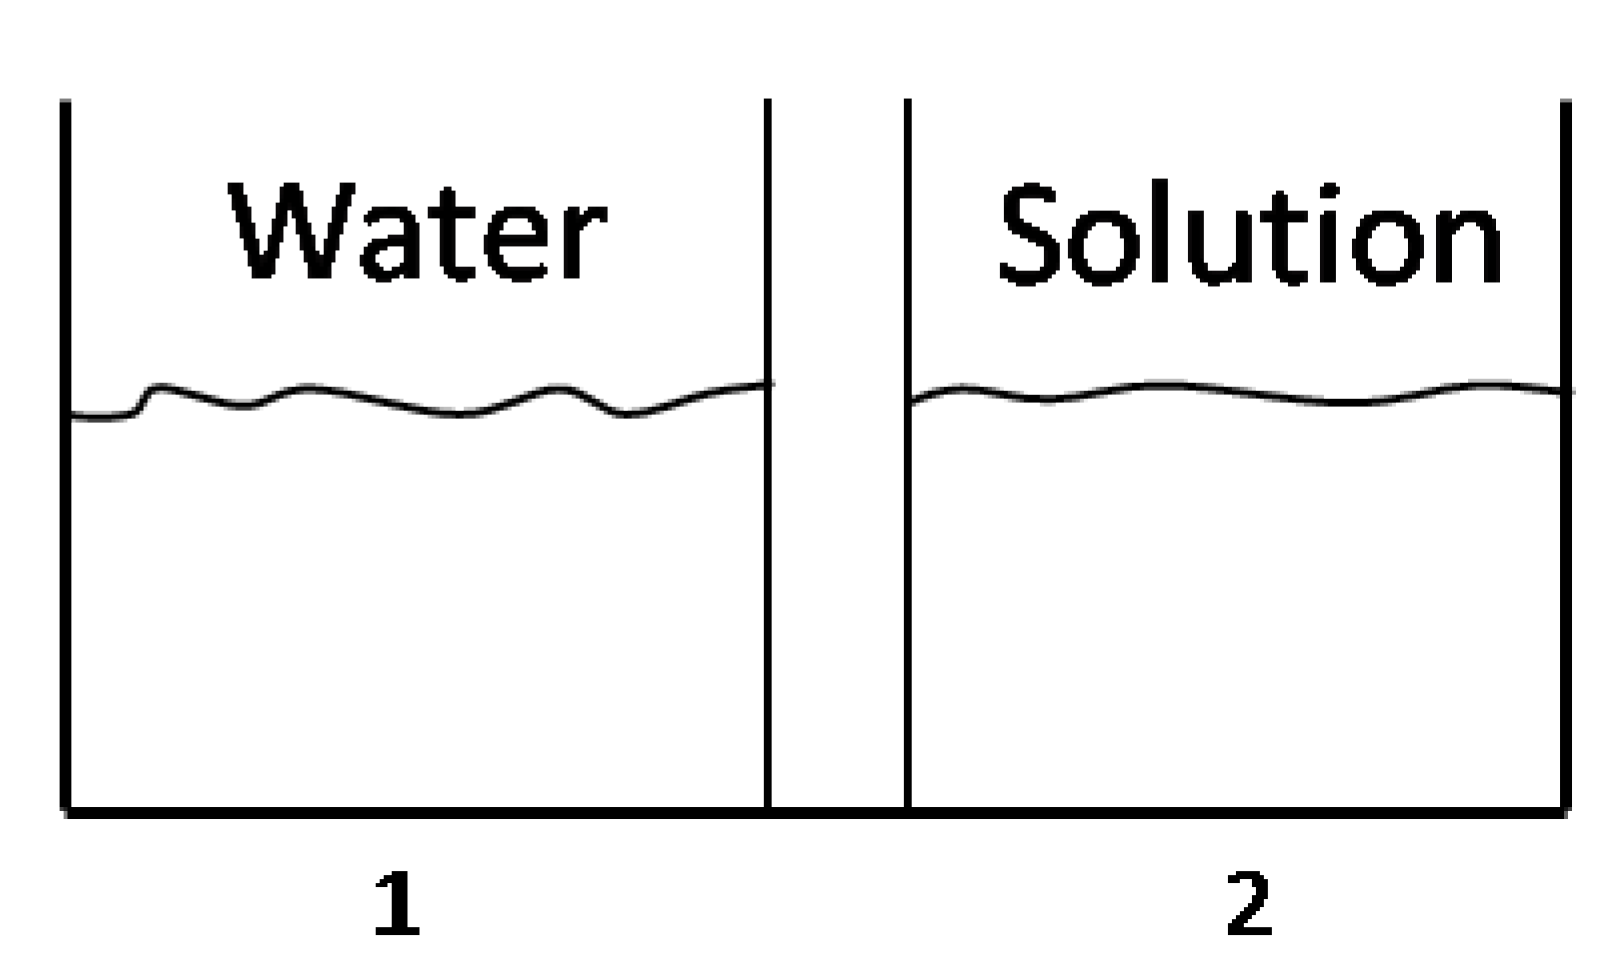


 . Thus, Using


 is the molar weight of water and V is the volume. Specifically in our case V1, V2 denote the volumes of the left and right cells, respectively. Using


 is constant for the process and thus the equations may rewritten as:


 and
and  that are related to the osmosis system analysis.
 and
and  that are related to the osmosis system analysis.
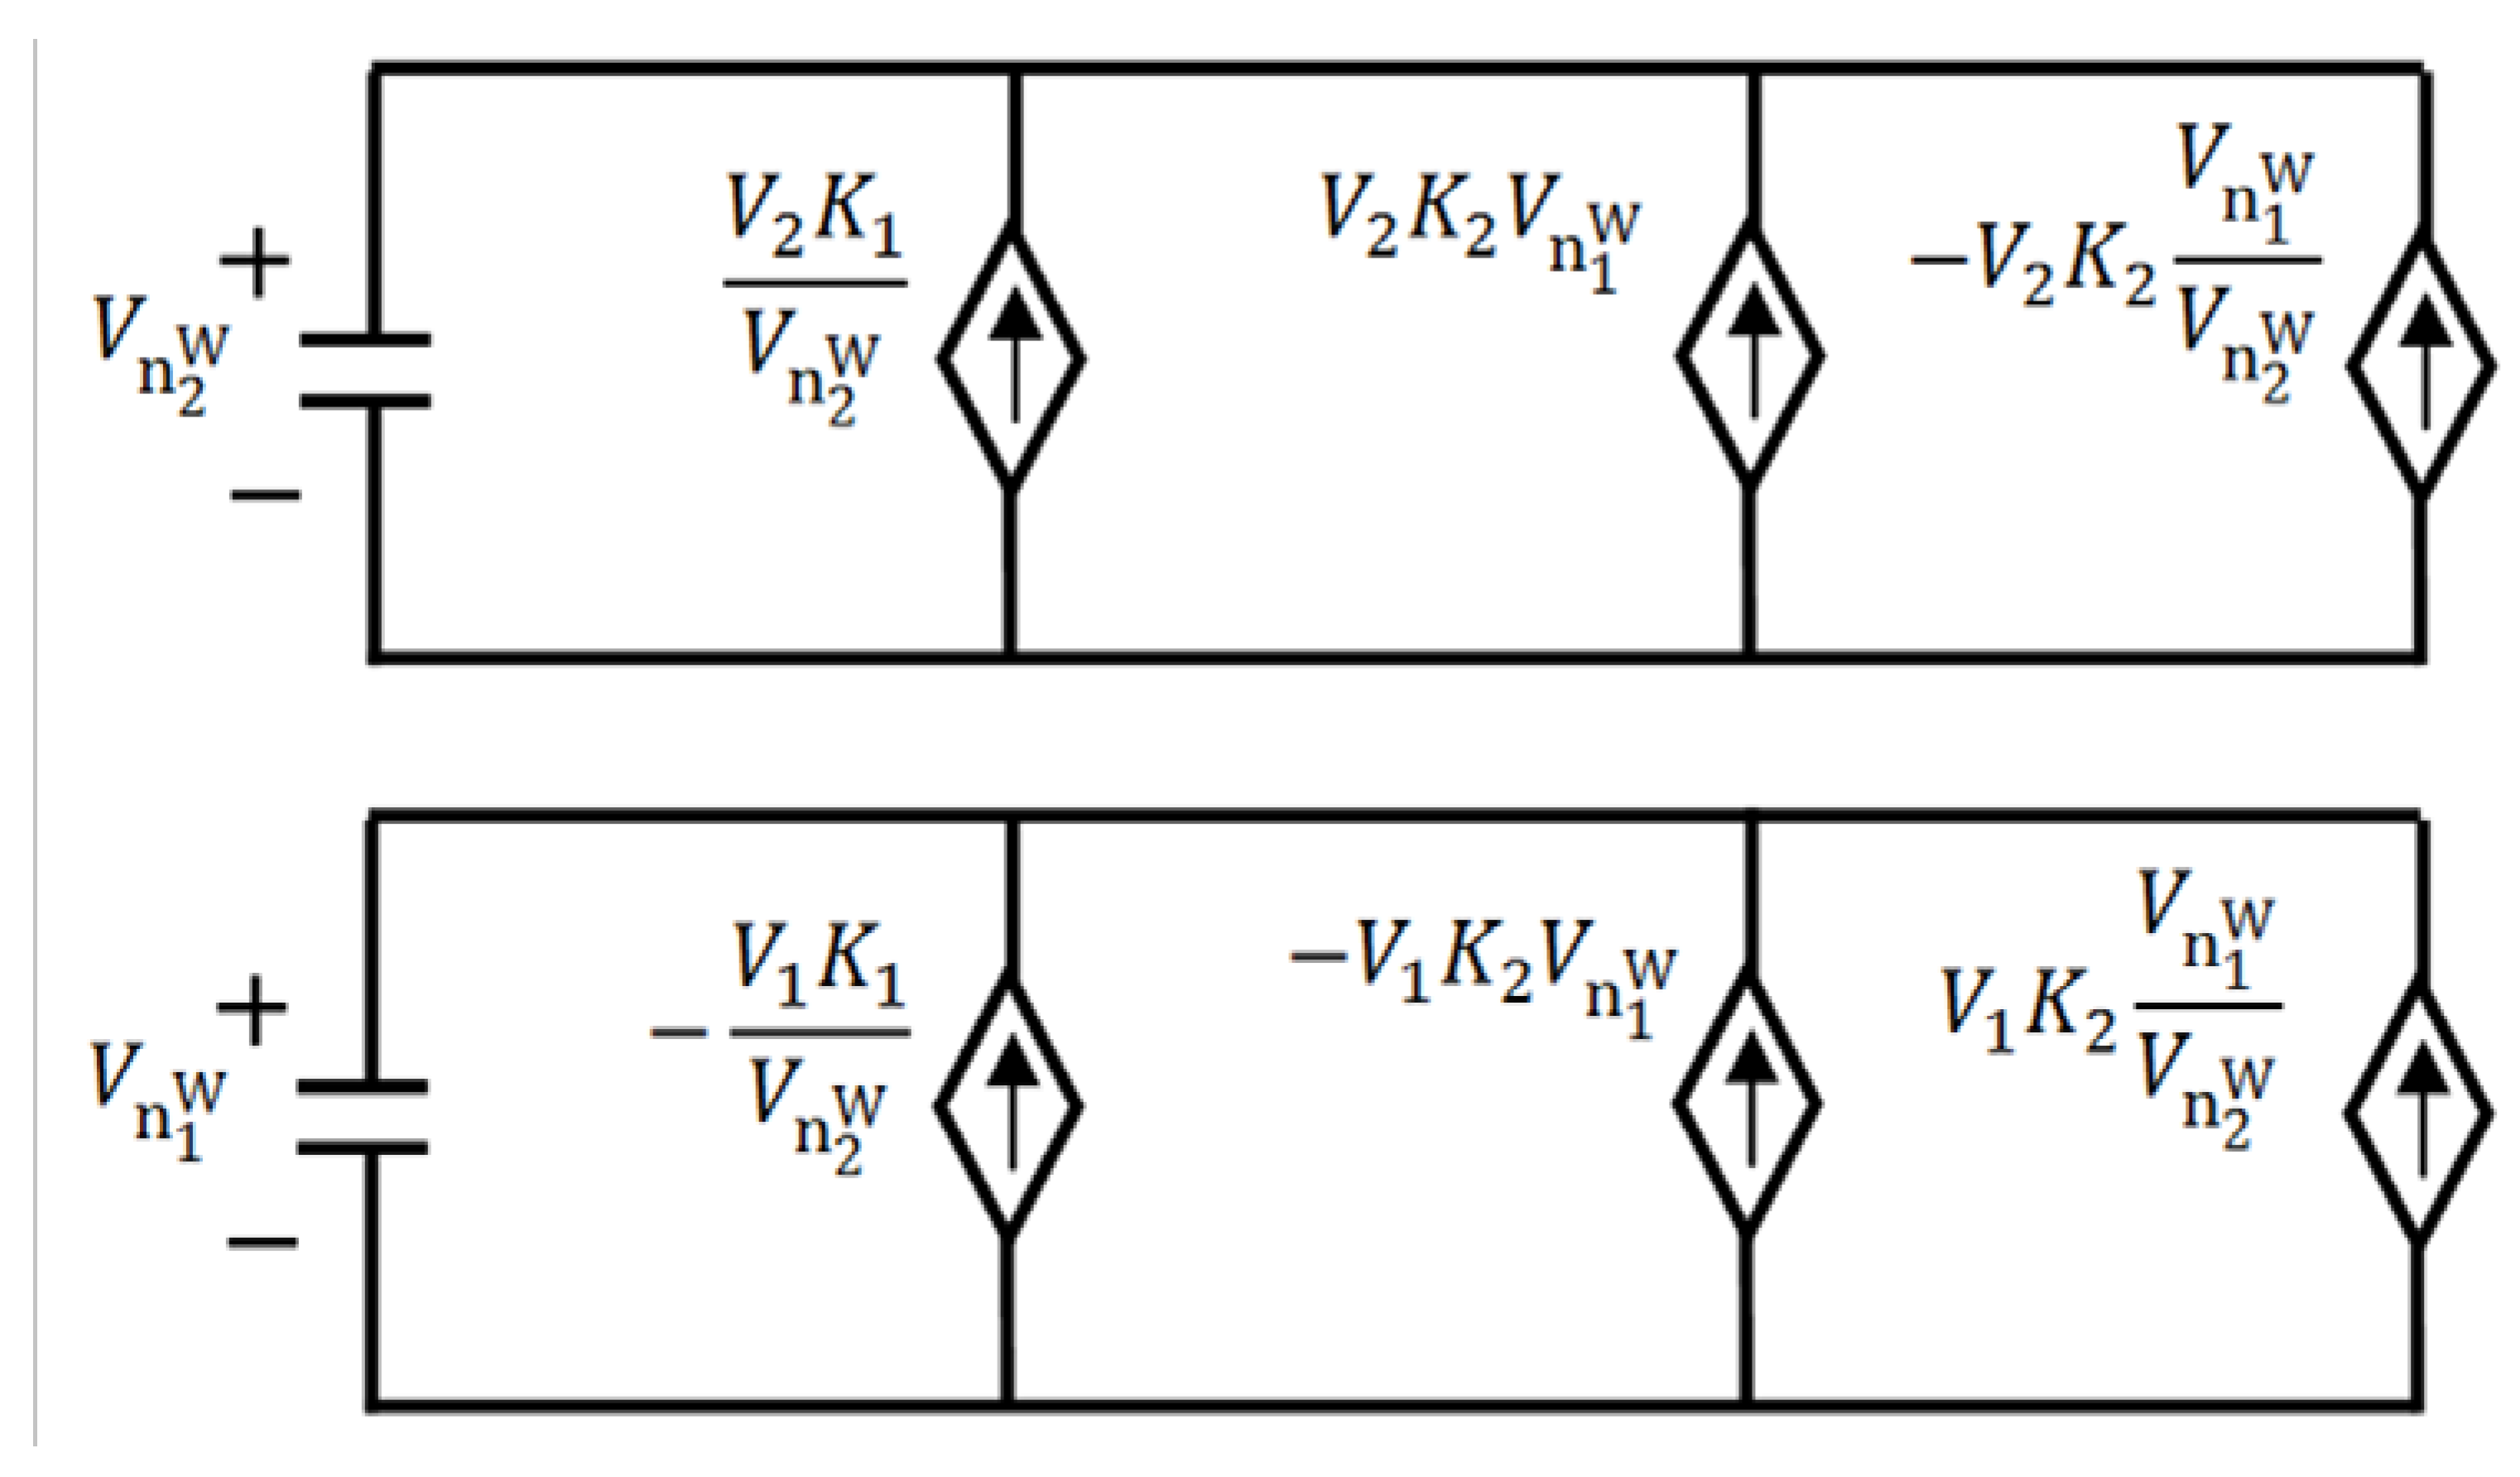
 has the capacity of V2, while the capacitor whose voltage is analogous to the concentration
  has the capacity of V1.
4. Conclusions
References
- Bamford, C.H.; Tipper, C.F.H. Comprehensive Chemical Kinetics; Elsevier: New York, NY, USA, 1969; Volume 2. [Google Scholar]
- Heckert, W.; Mack, E. The Thermal decomposition of gaseous ethylene oxide. J. Am. Chem. Soc. 1929, 51, 2706–2717. [Google Scholar] [CrossRef]
- Palani, S. Control. System Engineering; Tata McGraw-Hill: Noida, India, 2010. [Google Scholar]
- Kamlesh, M.T.; Wood, J.H.; Mikulecky, D.C. Dynamic simulation of pharmacokinetic systems using the electrical circuit analysis program SPICE2. Comput. Progr. Biomed. 1982, 15, 61–72. [Google Scholar] [CrossRef]
- D’Azzo, J.J.; Houpis, C.H.; Sheldon, S.N. Linear Control. System Analysis and Design; CRC: New York, NY, USA, 2003. [Google Scholar]
- Wang, C.; Nehrir, M.H.; Shaw, S.R. Dynamic models and model validation for PEM fuel cells using electrical circuits, Energy Conversion. IEEE Trans. 2005, 20, 442–451. [Google Scholar]
- Fletcher, S. An electrical model circuit that reproduces the behaviour of conducting polymer electrodes in electrolyte solutions. J. Electroanal. Chem. 1992, 337, 127–145. [Google Scholar]
- User Manual for PSpice software. Available online: http://www.cadence.com/products/orcad/pspice_simulation/pages/default.aspx (accessed on 20 August 2012).
- Siegman, A.E. Lasers; University Science Books: Sausalito, CA, USA, 1986. [Google Scholar]
- Stryer, L. Biochemistry, 4th ed; W.H. Freeman and Company: New York, NY, USA, 1995. [Google Scholar]
- Sheeler, P.; Bianchi, D.E. Cell Biology; John Wiley & Sons, Inc: New York, NY, USA, 1987. [Google Scholar]
- Alberty, R.A.; Silbey, J.R. Physical Chemistry; John Wiley & Sons, Inc.: New York, NY, USA, 1992. [Google Scholar]
© 2013 by the authors; licensee MDPI, Basel, Switzerland. This article is an open access article distributed under the terms and conditions of the Creative Commons Attribution license (http://creativecommons.org/licenses/by/3.0/).
Share and Cite
Shahmoon, A.; Zalevsky, Z. Electrical Model for Analyzing Chemical Kinetics, Lasing and Bio-Chemical Processes. Processes 2013, 1, 12-29. https://doi.org/10.3390/pr1010012
Shahmoon A, Zalevsky Z. Electrical Model for Analyzing Chemical Kinetics, Lasing and Bio-Chemical Processes. Processes. 2013; 1(1):12-29. https://doi.org/10.3390/pr1010012
Chicago/Turabian StyleShahmoon, Asaf, and Zeev Zalevsky. 2013. "Electrical Model for Analyzing Chemical Kinetics, Lasing and Bio-Chemical Processes" Processes 1, no. 1: 12-29. https://doi.org/10.3390/pr1010012
APA StyleShahmoon, A., & Zalevsky, Z. (2013). Electrical Model for Analyzing Chemical Kinetics, Lasing and Bio-Chemical Processes. Processes, 1(1), 12-29. https://doi.org/10.3390/pr1010012


