Article

The Bi-Level Optimization Model Research for Energy-Intensive Load and Energy Storage System Considering Congested Wind Power Consumption

1
School of Electrical Engineering, Xi’an University of Technology, Xi’an 710048, China
2
State Key Laboratory of Eco-Hydraulics in Northwest Arid Region, Xi’an University of Technology, Xi’an 710048, China
3
State Grid Qinghai Electric Power Company, Xining 810001, China
4
Haixi Electric Power Supply Company, State Grid Qinghai Electric Power Company, Golmud 817077, China
*
Author to whom correspondence should be addressed.
Processes 2022, 10(1), 51; https://doi.org/10.3390/pr10010051
Submission received: 8 November 2021 / Revised: 23 December 2021 / Accepted: 23 December 2021 / Published: 27 December 2021
(This article belongs to the Topic Energy Storage and Conversion Systems)

Abstract

:
Due to the uncertainty of wind power output, the congestion of wind power has become prominent. Exactly how to improve the capacity of wind power consumption has become a problem that needs to be studied urgently. In this paper, an energy storage system and energy-extensive load with adjustable characteristics are used as an important means of consuming wind power. Firstly, we analyze the reasons for the congestion according to the characteristics of wind power output, and establish a model of the grid’s ability to integrate wind power based on the concept of a wind power admissible interval. Secondly, we analyze the energy-extensive load regulation characteristics and establish an energy-extensive load dispatch model. Thirdly, on the basis of considering the energy-extensive load and energy storage system adjustment constraints, a bi-level optimization model is established. The upper level determines the configured capacity of the energy storage system with the goal of minimizing the total economic investment of the energy storage system, and the lower level coordinates the dispatching with the goal of maximizing wind power consumption and minimizing system operating costs. Finally, a certain region is taken as an example to verify the validity of the proposed method.

1. Introduction

By the end of 2020, Chinese-installed wind power capacity has continued to grow to 281 million kilowatts. However, wind power output is volatile and random [1]. When large-scale wind power is integrated into the grid, the wind power consumption of the wind farm is hindered due to the insufficient peak shaving capacity of the system, which results in a large number of wind abandonment [2]. To improve the consumption level of wind power, the energy storage resources [3] and the load-side resources need to be fully utilized at the same time [4]. In recent years, due to the rapid development of energy storage technology, energy storage devices have gradually been deployed into new energy systems [5]. This strategy can effectively increase the rate of new energy consumption, which has attracted wide attention from many researchers and governments [6]. Besides, enterprises with energy-intensive load are usually built near large-scale wind power bases [7], so the load is highly concentrated and large in capacity, making the control of the load more flexible [8]. Therefore, to alleviate the problem of Chinese wind power consumption, it is feasible to use energy storage systems and load-side to consume congested wind power on-site.
At present, the existing references have researched the load-side participation in wind power consumption. Reference [9] divides the energy-intensive load into interruptible and translatable loads according to the response mode, and comprehensively considers all available factors on the source side, grid side, and load side. On this basis, a source-grid-load comprehensive planning model is established. However, this model does not consider the power consumption characteristics and adjustment methods of an energy-intensive load. Since improper adjustment of the energy-intensive load can cause serious losses, in order to make reasonable use of the adjustable performance of the energy-intensive load, it is necessary to carry out fine modeling of the electrical characteristics of load. Since demand response is playing an increasingly important role in balancing short-term supply and demand, researchers propose three different methods to integrate demand response into a unit combination optimization model that considers operating constraints [10]. However, this model is established when the wind power forecasting is accurate and does not consider the volatility of wind power. In order to alleviate the problems of grid integration and safe operation of the power system caused by the uncertainty of wind power, pumped storage and demand response participate in the process of grid operation as auxiliary services. In addition, the Lagrangian relaxation method is proposed to solve the unit combination problem [11]. However, the adjustment cost of an energy-intensive load is not considered in this process, which will lead to excessively high overall operating costs of the system. Aiming at the uncertainty of renewable energy output, reference [12] proposes a two-stage robust scheduling model. Due to the high flexibility of demand response, this model can meet electricity demand with minimal energy costs and maximize the use of clean energy potential. However, due to the complexity of the model, it is not suitable for grid dispatch calculation. Reference [13] uses the dynamic adjustment capabilities of hydropower and energy-intensive load to propose an optimal wind power-solar capacity allocation method to reduce the uncertainty of output. However, the risk constraints of energy-intensive load and wind power are not considered. When the discretely adjustable energy-intensive load participates in the consumption of wind power, since it cannot be continuously adjusted in a short time, the adjustment increment of the energy-intensive load does not match the output of wind power, which increases the risk of wind power curtailment or load shedding of the energy-intensive load.
On the other hand, the energy storage system can store the power during the low load period and release it during the peak load period [14]. Joint dispatch with wind power can effectively reduce the wind power curtailment rate [15]. Therefore, there are currently many studies that combine energy storage and wind power into a joint system for optimal dispatch [16]. By analyzing the negative impact of wind speed variability on the large-scale grid integration of wind power, the researcher proposes to use energy storage systems to mitigate it [17]. Based on the reliability analysis under the unit operation and technical constraints, the AC power flow model is used to determine the scale of the energy storage system. However, the operating cost of the energy storage system is not considered, which leads to excessively high system operating costs, and is not conducive to the economic operation of the system. Reference [18] is based on the complementary characteristics of solar and wind energy, and proposes a method to optimize the configuration of renewable energy by using battery energy storage technology so as to make the system more reliable. However, this research does not take into account the uncertainty of renewable energy output, which affects the planning and operation of the energy storage system, thereby reducing the applicability and reliability of the results. In view of the fact that wind power cannot be accurately predicted, reference [19] proposes an approach for planning and operating an energy storage system for a wind farm in the electricity market while using electrochemical batteries to compensate for changes in power generation. However, this method does not explain how to determine the capacity of the energy storage system and cannot guarantee that the capacity is the optimal value. The energy storage capacity should be optimally configured to improve the overall investment benefit. Reference [20] proposes a multi-objective optimal scheduling model based on the operating characteristics of the battery energy storage system and the uncertainty of wind power output, which reduces the risk of the integrated power system with wind farms and batteries. Although the scheduling model considers the uncertainty of wind power, it does not quantify the risk of wind power curtailment. Besides, the existing references mostly focus on the exploration of the effect of energy-intensive load or energy storage system alone. Few references analyze the effective coordination between the energy-intensive load and energy storage system.
In view of the above problems, this paper takes the energy-intensive load and energy storage system together as an important means to consume wind power and jointly participate in the optimal dispatch of the power grid. Firstly, the regulation characteristics of the energy-intensive load are analyzed, and the energy-intensive load dispatching model is established. On the basis of fully considering the uncertainty of wind power, the risk constraints of the energy-intensive load and wind power have been established. At the same time, taking into account the adjustment cost and adjustment constraints of the energy-intensive load and energy storage system, a bi-level optimization model considering the congested wind power consumption is established. The upper level determines the configured capacity of the energy storage system with the goal of minimizing the total economic investment of the energy storage system, and the lower level coordinates the dispatching with the goal of maximizing wind power consumption and minimizing system operating costs. The simulation results show that the above method can effectively improve the consumption capacity of wind power and reduce the operating cost of the system.

2. Uncertainty Analysis of Wind Power

Wind power output has strong randomness and volatility. When large-scale wind farms are integrated into the grid, the safe and stable operation of the system will be affected. Therefore, the uncertainty of wind power output needs to be analyzed. This chapter firstly proposes the concept of wind power admissible interval to represent the power grid’s ability to integrate wind power. Then, the characteristics of wind power output are analyzed, considering the uncertainty of wind speed changes, and a probability distribution model is usually used to describe it. On this basis, analysis and research are carried out according to the wind curtailment situation outside of the capacity of the grid, and the curtailment risk is characterized by the wind curtailment expected value.

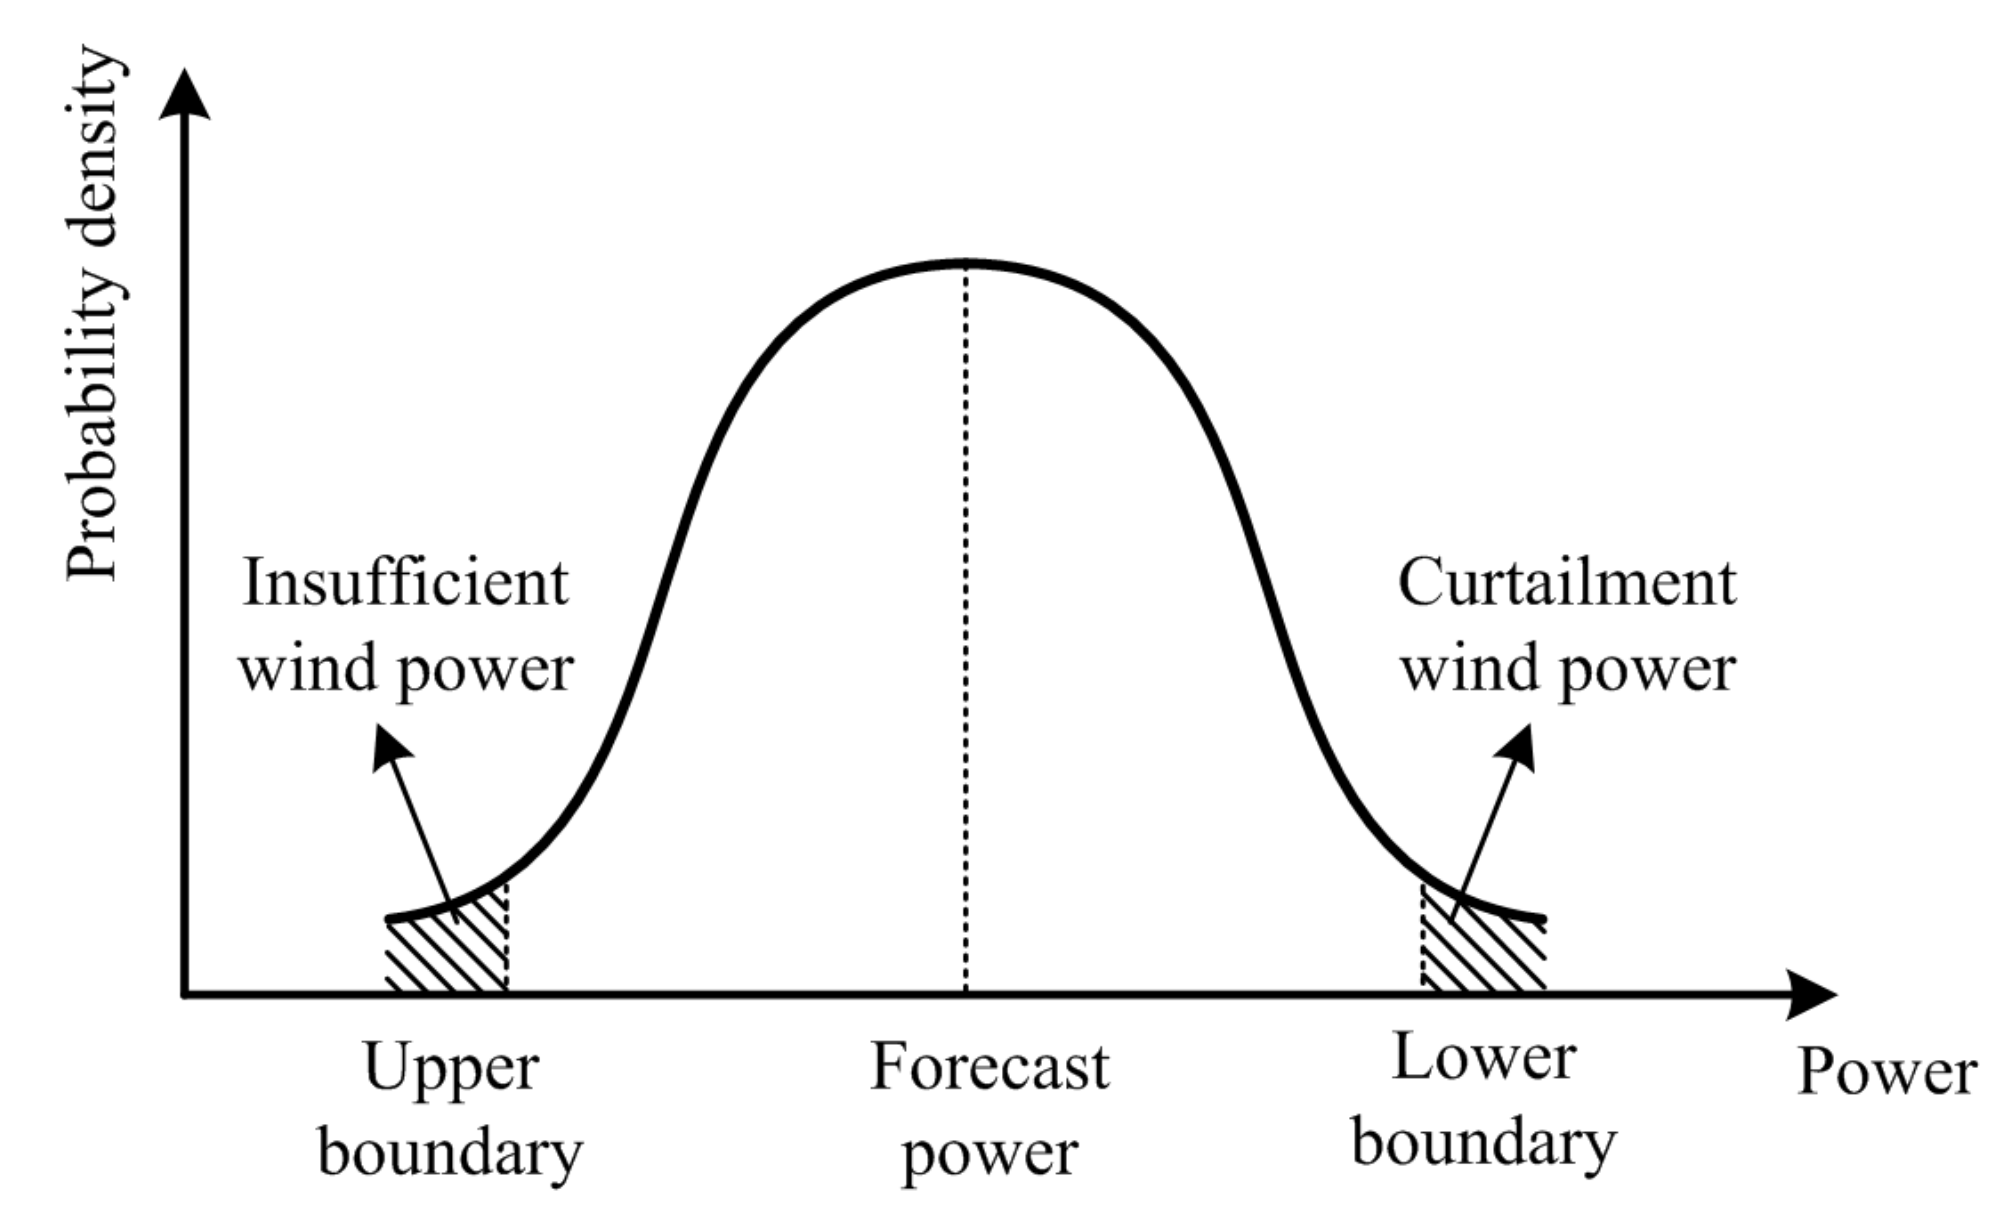
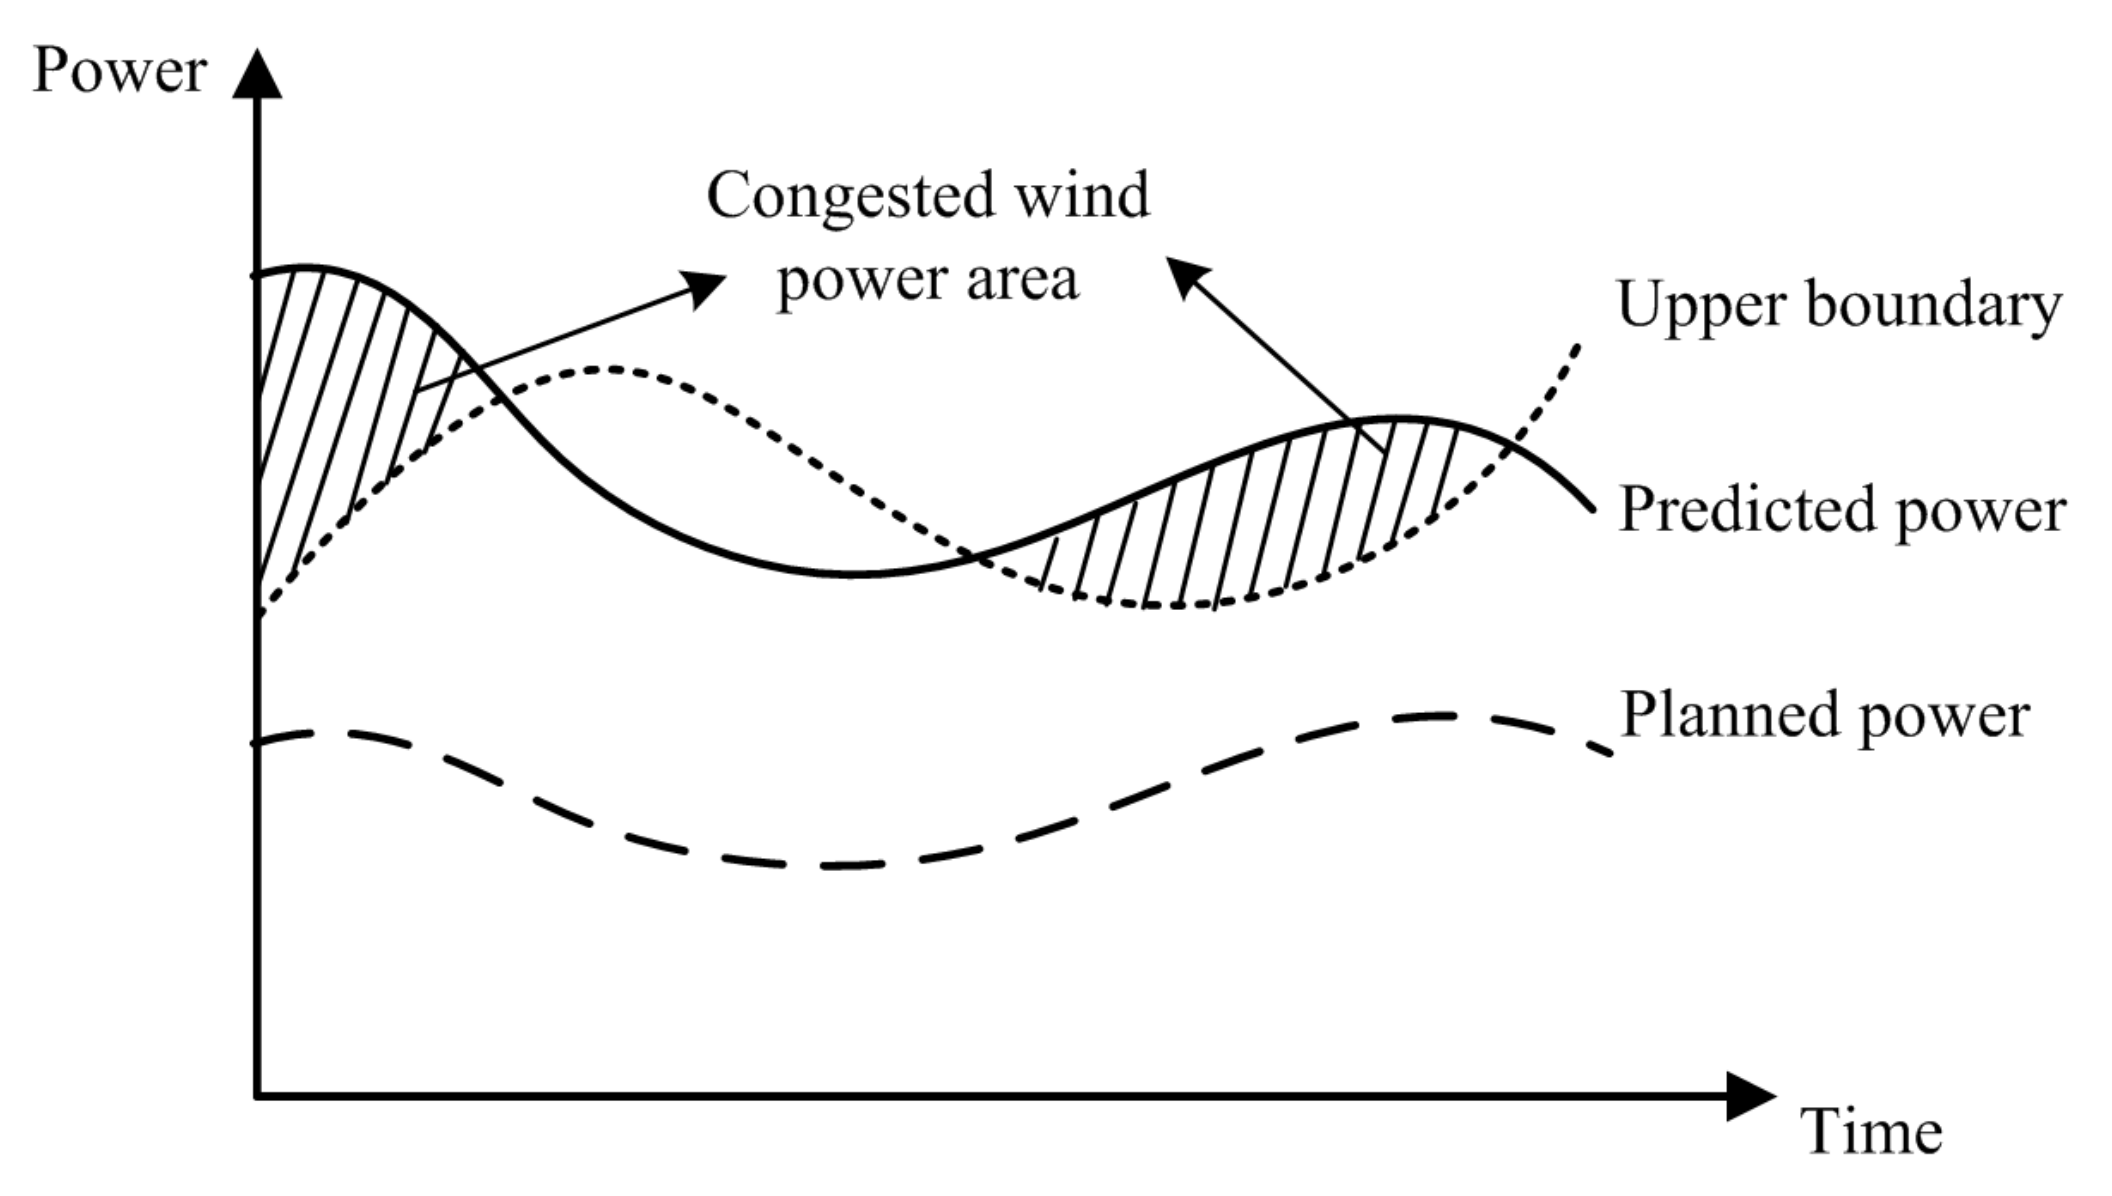
2.1. The Admissible Region of Wind Power

Energy-intensive load and energy storage system are mainly used to consume wind curtailment. Therefore, the acceptance level of power grid to wind power should be calculated to evaluate the wind curtailment situation in the future [21].
The calculation of the wind curtailment index is closely related to the grid’s acceptance level to wind power. This paper uses the admissible region of wind power (ARWP) to indicate the acceptance level of wind power in power grid [22]. The acceptance region of the power grid for the output of a wind farm is shown in Figure 1. The blue solid line in the figure is the planned output of the wind farm, and the red dotted line is the admissible wind power output range of the power grid without curtailed wind or reduced load.
According to the concept of ARWP, the wind power output satisfies the following relationship:
w i , t l w i , t w i , t u w i , t = w i , t p + Δ w ^ i , t p
where w i , t p , Δ w ^ i , t , w i , t , w i , t u , and w i , t l represent planned output, wind power output fluctuation, actual output, the upper boundary before coordinated dispatching, and the lower boundary before coordinated dispatching of the i-th wind farm at time t, respectively.

2.2. Distribution of Wind Power Output

Wind power output is highly uncertain. In this paper, the uncertainty of wind power output is described as a probability function that obeys a normal distribution near the predicted point [23]. As shown in Figure 2.
The distribution of wind farm output is:
( w i , t p + Δ w ^ i , t p ) ~ N ( w i , t f , ( σ i + t Δ σ i ) 2 )
where N ( w i , t f , ( σ i + t Δ σ i ) 2 ) represents the normal distribution with expectation w i , t f and variance ( σ i + t Δ σ i ) 2 ; w i , t f is the predicted output of wind farm i at time t; σ i is the initial standard deviation of wind farm i load forecasting; and Δ σ i is the standard deviation increment of wind farm i load forecasting process with time scale.

2.3. Risk Analysis of Wind Curtailment

Due to the randomness and volatility of wind power output, prediction errors are prone to occur when predicting wind power output, which will increase the uncertainty of large-scale wind power integrated into the grid. It will have a great impact on the peak shaving capacity of the power grid, which will lead to the obstruction of wind power consumption and a large amount of wind curtailment [24]. Figure 3 is the schematic diagram of congested wind power consumption.
Based on the above analysis, the risk of wind curtailment of wind farm i can be expressed as:
C i u , V a R ( w i , t u ) = ρ u t = 1 T E i , t u ( w i , t u ) = ρ u t = 1 T w i , t u w i , t max ( x w i , t u ) f i , t ( x ) d x
where ρ u is the penalty for wind curtailment; E i , t u ( ) is the wind curtailment expectation of wind farm i at time t; T is the time scale of dispatching control; w i , t max is the upper limit of output of wind farm i at time t, taking the installed capacity of wind farm; f i , t ( x ) is the probability density function of wind farm i output at time t.
According to Formula (3), C i u , V a R is a complex nonlinear nonconvex function. It will not only increase the difficulty of finding the global optimal solution, but also increase the computational complexity and time. Therefore, this paper linearizes E i , t u ( w i , t u ) piecewise, and the piecewise linearization models with different values are shown in Formula (4).
E i , t u ( w i , t u ) = s = 1 n a i , t u , s w i , t u , s + b i , t u , s z i , t u , s 0 w i , t u , s M z i , t u , s s = 1 n w i , t u , s = w i , t u s = 1 n z i , t u , s = 1
where n is the total number of sections; w i , t u , s and z i , t u , s are respectively the continuous and discrete auxiliary variables of the s-th segment of the upper boundary of the ARWP of wind farm i at time t before the load participates in the coordination; a i , t u , s and b i , t u , s are respectively the slope and intercept of the s-th segment of the ARWP upper boundary of wind farm i at time t, which can be obtained in advance from the distribution of wind farm i. Here, M is a preset large number constant.
From Formula (4), it can be seen that C i u , V a R ( ) can be changed from a complex function to a series of mixed integer linear constraints, which is easy to solve.

3. Model of Energy-Intensive Load Dispatching

The uncertainty of wind power output imposes a burden on the regulation of the power grid. When the regulation capacity of conventional power sources is insufficient, the energy-intensive load can be adjusted to ensure the balance between supply and demand of the power system. The premise for using energy-intensive load to consume congested wind power is to have an accurate understanding of load power characteristics. Therefore, it is necessary to analyze the characteristics of different types of energy-intensive load regulation and establish a mathematical model of energy-intensive load regulation. On this basis, combined with the wind curtailment situation outside the capacity of the grid analyzed in Section 2.3, the risk constraints related to load consumption increment and wind curtailment volume are constructed. The flow chart of this process is shown in Figure 4.

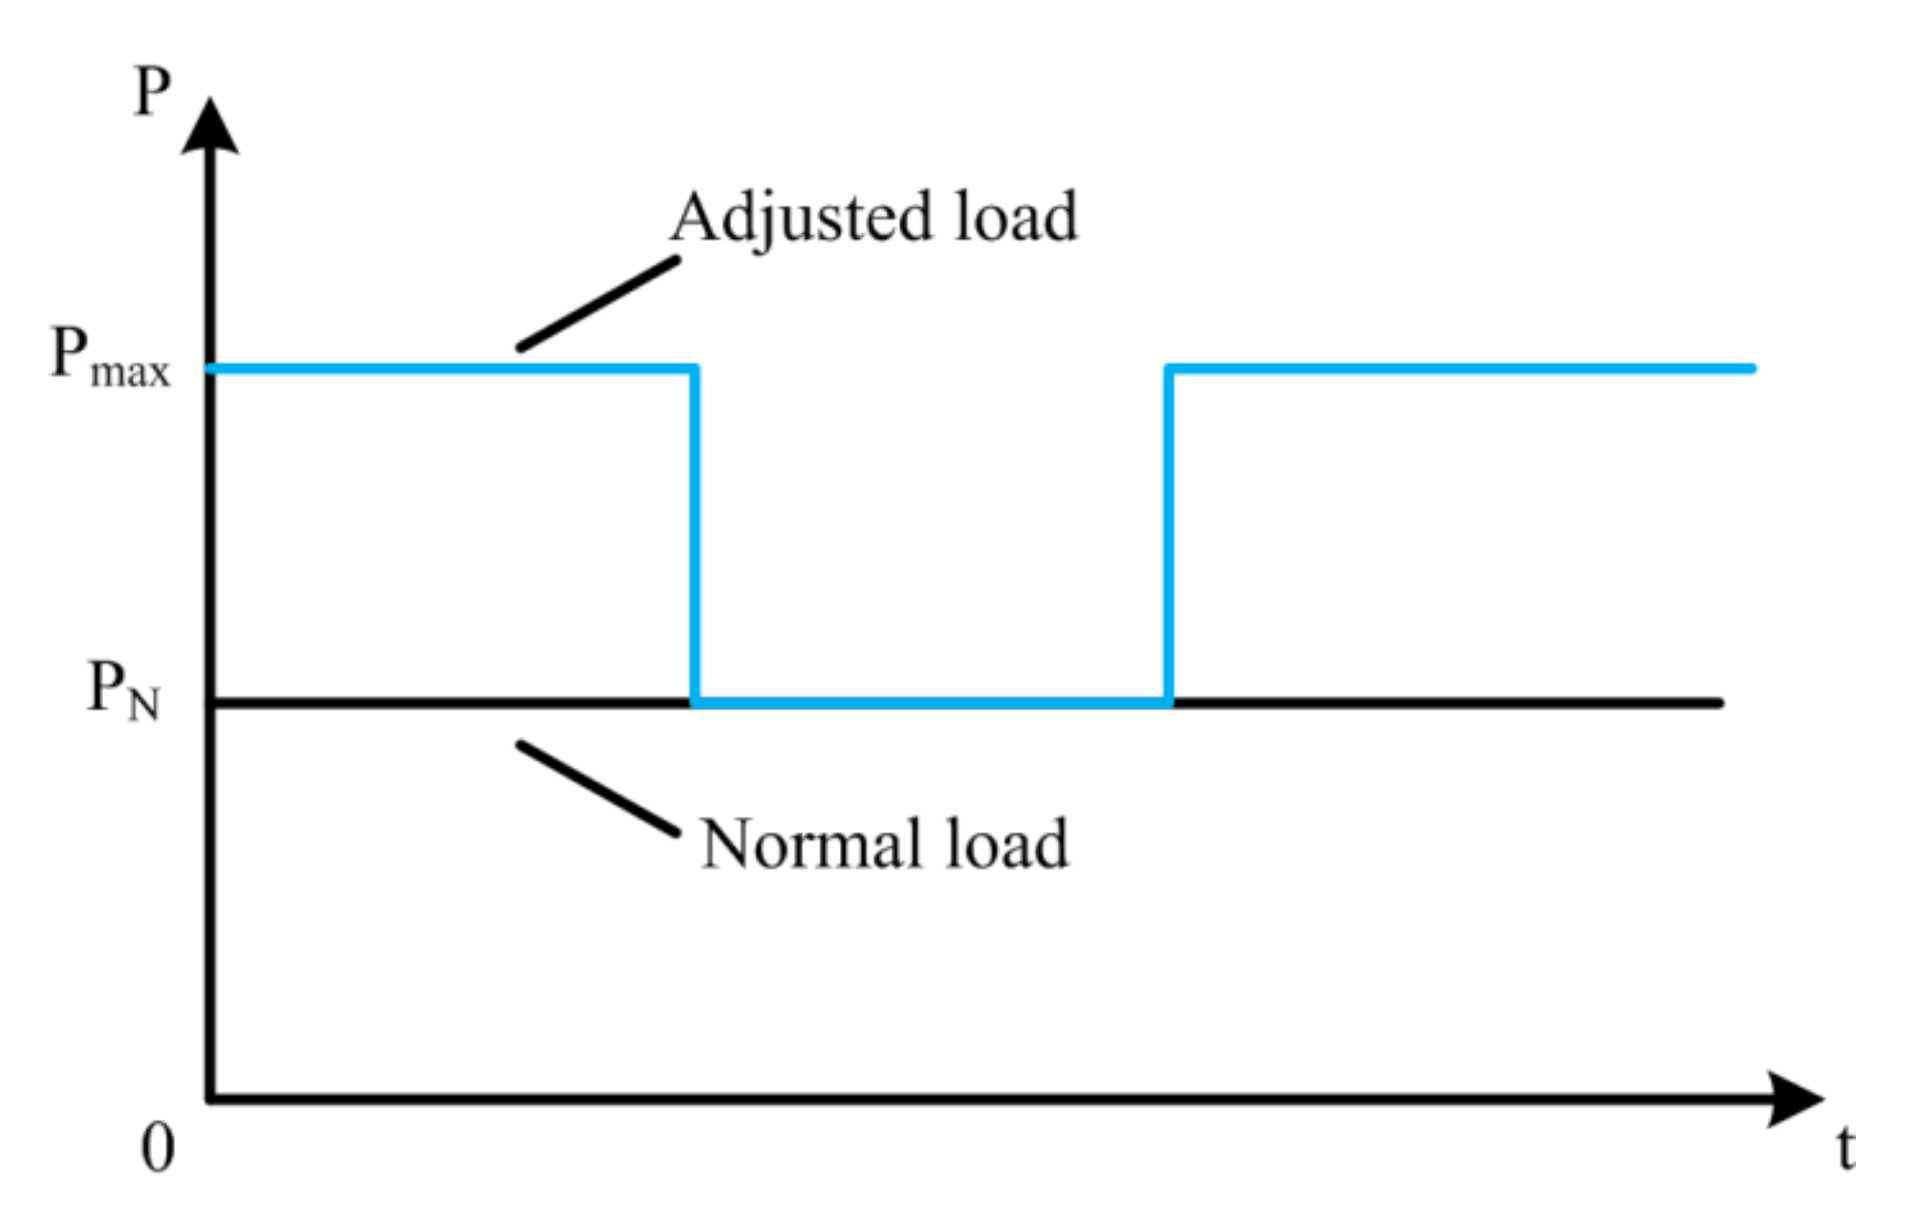
3.1. Regulation Characteristics of Energy-Intensive Load

Energy-intensive load are divided into continuously adjustable load and discretely adjustable load. In this section, the regulation characteristics of two typical energy-intensive load of an electrolytic aluminum and titanium alloy are analyzed as examples [25].
(1)
Electrolytic aluminum production load
Electrolytic aluminum production uses cryolite-alumina as raw materials, and direct current is applied to electrolysis in its molten salt until, finally, aluminum is obtained. Under normal circumstances, the load of electrolytic aluminum is stable, and adjustment within a certain range only affects the output and does not affect product quality and equipment safety. However, due to the limited impact tolerance of electrolytic aluminum equipment, stable production is required for a period of time after one adjustment, and frequent adjustments are not allowed. The schematic diagram of electrolytic aluminum load adjustment is shown in Figure 5.
(2)
Titanium alloy production load
Titanium alloy production uses alloy oxide charge as raw material to reduce to titanium alloy at high temperature. Titanium alloys generally adopt uninterrupted production methods, and their production load fluctuates slightly, basically stable, with continuous adjustment capabilities, and flexible adjustments, which are not affected by stable production time. The schematic diagram of titanium alloy load adjustment is shown in Figure 6.
Summarizing the above load regulation characteristics, energy-intensive load can be divided into continuously adjustable loads and discretely adjustable loads. Various types of energy-intensive load regulation characteristics are shown in Table 1.

3.2. Model of Energy-Intensive Load Dispatching

From the analysis in Section 3.1, it can be seen that the continuously adjustable load can be adjusted in real time according to the fluctuation of wind power, and the risk is relatively small. However, the discretely adjustable load cannot be adjusted continuously in a short period of time. After one adjustment, it needs to run stably for a period of time before the next adjustment can be carried out. The time period is longer. If the load regulation is large, the predicted output of wind power during this period is higher but the actual output is lower, which will cause the problem of a mismatch between the load increment and the power generation increment, resulting in a higher risk of load shedding. Conversely, if the load regulation amount is small, the flexibility of the energy-intensive load cannot be fully utilized, and a large wind curtailment may also occur. Therefore, the uncertainty of wind power and the regulation characteristics of the load should be fully considered when the discrete energy-intensive load participates in the wind power consumption.
In this paper, the discrete adjustable load is analyzed and studied [26]. Without losing generality, the mathematical model of a smelting furnace is used to represent the discrete adjustable load [27].
Other constraints of the electricity load and active power model of the smelting furnace are as follows:
P j , t E F = P j E F , int ( 1 x j , t E F ) + P j E F , o n x j , t E F + P j , t E F , a d j P j E F , d x j , t E F P j , t E F , a d j P j E F , u x j , t E F M ( u j , t E F + 1 x j , t E F ) P j , t E F , a d j P j , t 1 E F , a d j M u j , t E F
Formula (5) is the active power constraints of the smelting furnace. Where P j , t E F , P j , t E F , a d j , x j , t E F , u j , t E F are the total active power, continuous regulation, state variable and start flag of smelting furnace j at time t, respectively; P j E F , int , P j E F , o n , P j E F , d and P j E F , u are the oven power, normal production power, maximum down-regulated power and maximum up-regulated power of smelting furnace j, respectively.
x j , t E F x j , t 1 E F u j , t E F u j , t E F x j , t E F u j , t E F 1 x j , t 1 E F x j , t 1 E F x j , t E F 1 x j , τ E F τ t + 1 , min t + T j E F , o n 1 , T u j , t E F 1 x j , t + T j E F , o n E F τ τ + T j E F , int - 1 x j , τ E F 1 τ 1 , T T j E F , int + 1
Formula (6) is the logical constraints of smelting furnace j, which are used to describe the discrete operating characteristics of smelting furnaces. Where T j E F , o n and T j E F , int are the maximum smelting time and the maximum oven time of smelting furnace j, respectively.

3.3. Risk Constraints of Energy-Intensive Load

Energy-intensive load has a large load capacity. In order to make the energy be used efficiently, this paper introduces an energy-intensive load to participate in wind power consumption. When energy-intensive loads participate in wind power consumption, and considering that wind farms have obviously volatility, the risk constraint adjustment of energy-intensive load can modify the admissible range of wind power in Section 2.1 (so as to control the risk of wind curtailment).
When energy-intensive loads participate in wind power consumption, energy-intensive load enterprises can purchase electric energy from wind farms at a relatively low price. If the output of wind power is lower than expected after load adjustment, the interests of load enterprises may be harmed, thus dampening the enthusiasm of energy-intensive load to participate in wind power consumption. Therefore, in a dispatch cycle, the wind farm’s curtailment expectations and load increase should meet certain risk constraints to ensure the abundance of wind power. This paper defines the conservative degree of load participating in coordinated dispatch as: the expected wind power curtailment before the load participates in the regulation can meet the minimum proportion of the load’s increased power consumption after the load participates in the coordination. The concept of conservativeness can form the risk constraints when energy-intensive loads participate in the consumption of wind power.
i = 1 W t = 1 T E i , t u w i , t u β adj j = 1 E t = 1 T max ( 0 , P j , t E F P j , t E F )
where β adj represents the degree of conservation; P j , t E F and P j , t E F represent the electricity consumption plan before the adjustment of the energy-intensive load j at time t and the electricity consumption plan after the adjustment, respectively; W represents the number of wind farms; and E represents the number of energy-intensive load. This formula shows that the total wind curtailment expectation of the wind farm before the energy-intensive load participates in the mediation is greater than β adj times the energy-intensive load adjustment.
Since the purpose of energy-intensive load is to consume wind power, after energy-intensive load participates in wind power consumption, the change of electric energy caused by the adjustment of the upper boundary of wind power curtailment shall be greater than or equal to β adj times of the energy-extensive adjustment. This process meets the following requirements:
w i , t u , a d d w i , t p t = 1 T i = 1 W ( w i , t u , a d d w i , t u ) β adj j = 1 E t = 1 T max ( 0 , P j , t E F P j , t E F )
where w i , t u , a d d represents the adjusted upper boundary of ARWP. It can be seen from the above calculation formula that when the upper boundary of wind power admissible interval is adjusted and changed, the risk of wind curtailment of the wind farm will be reduced, and the risk constraint of wind curtailment of the wind farm is further realized.

4. Bi-Level Optimization Model Considering Congested Wind Power Consumption
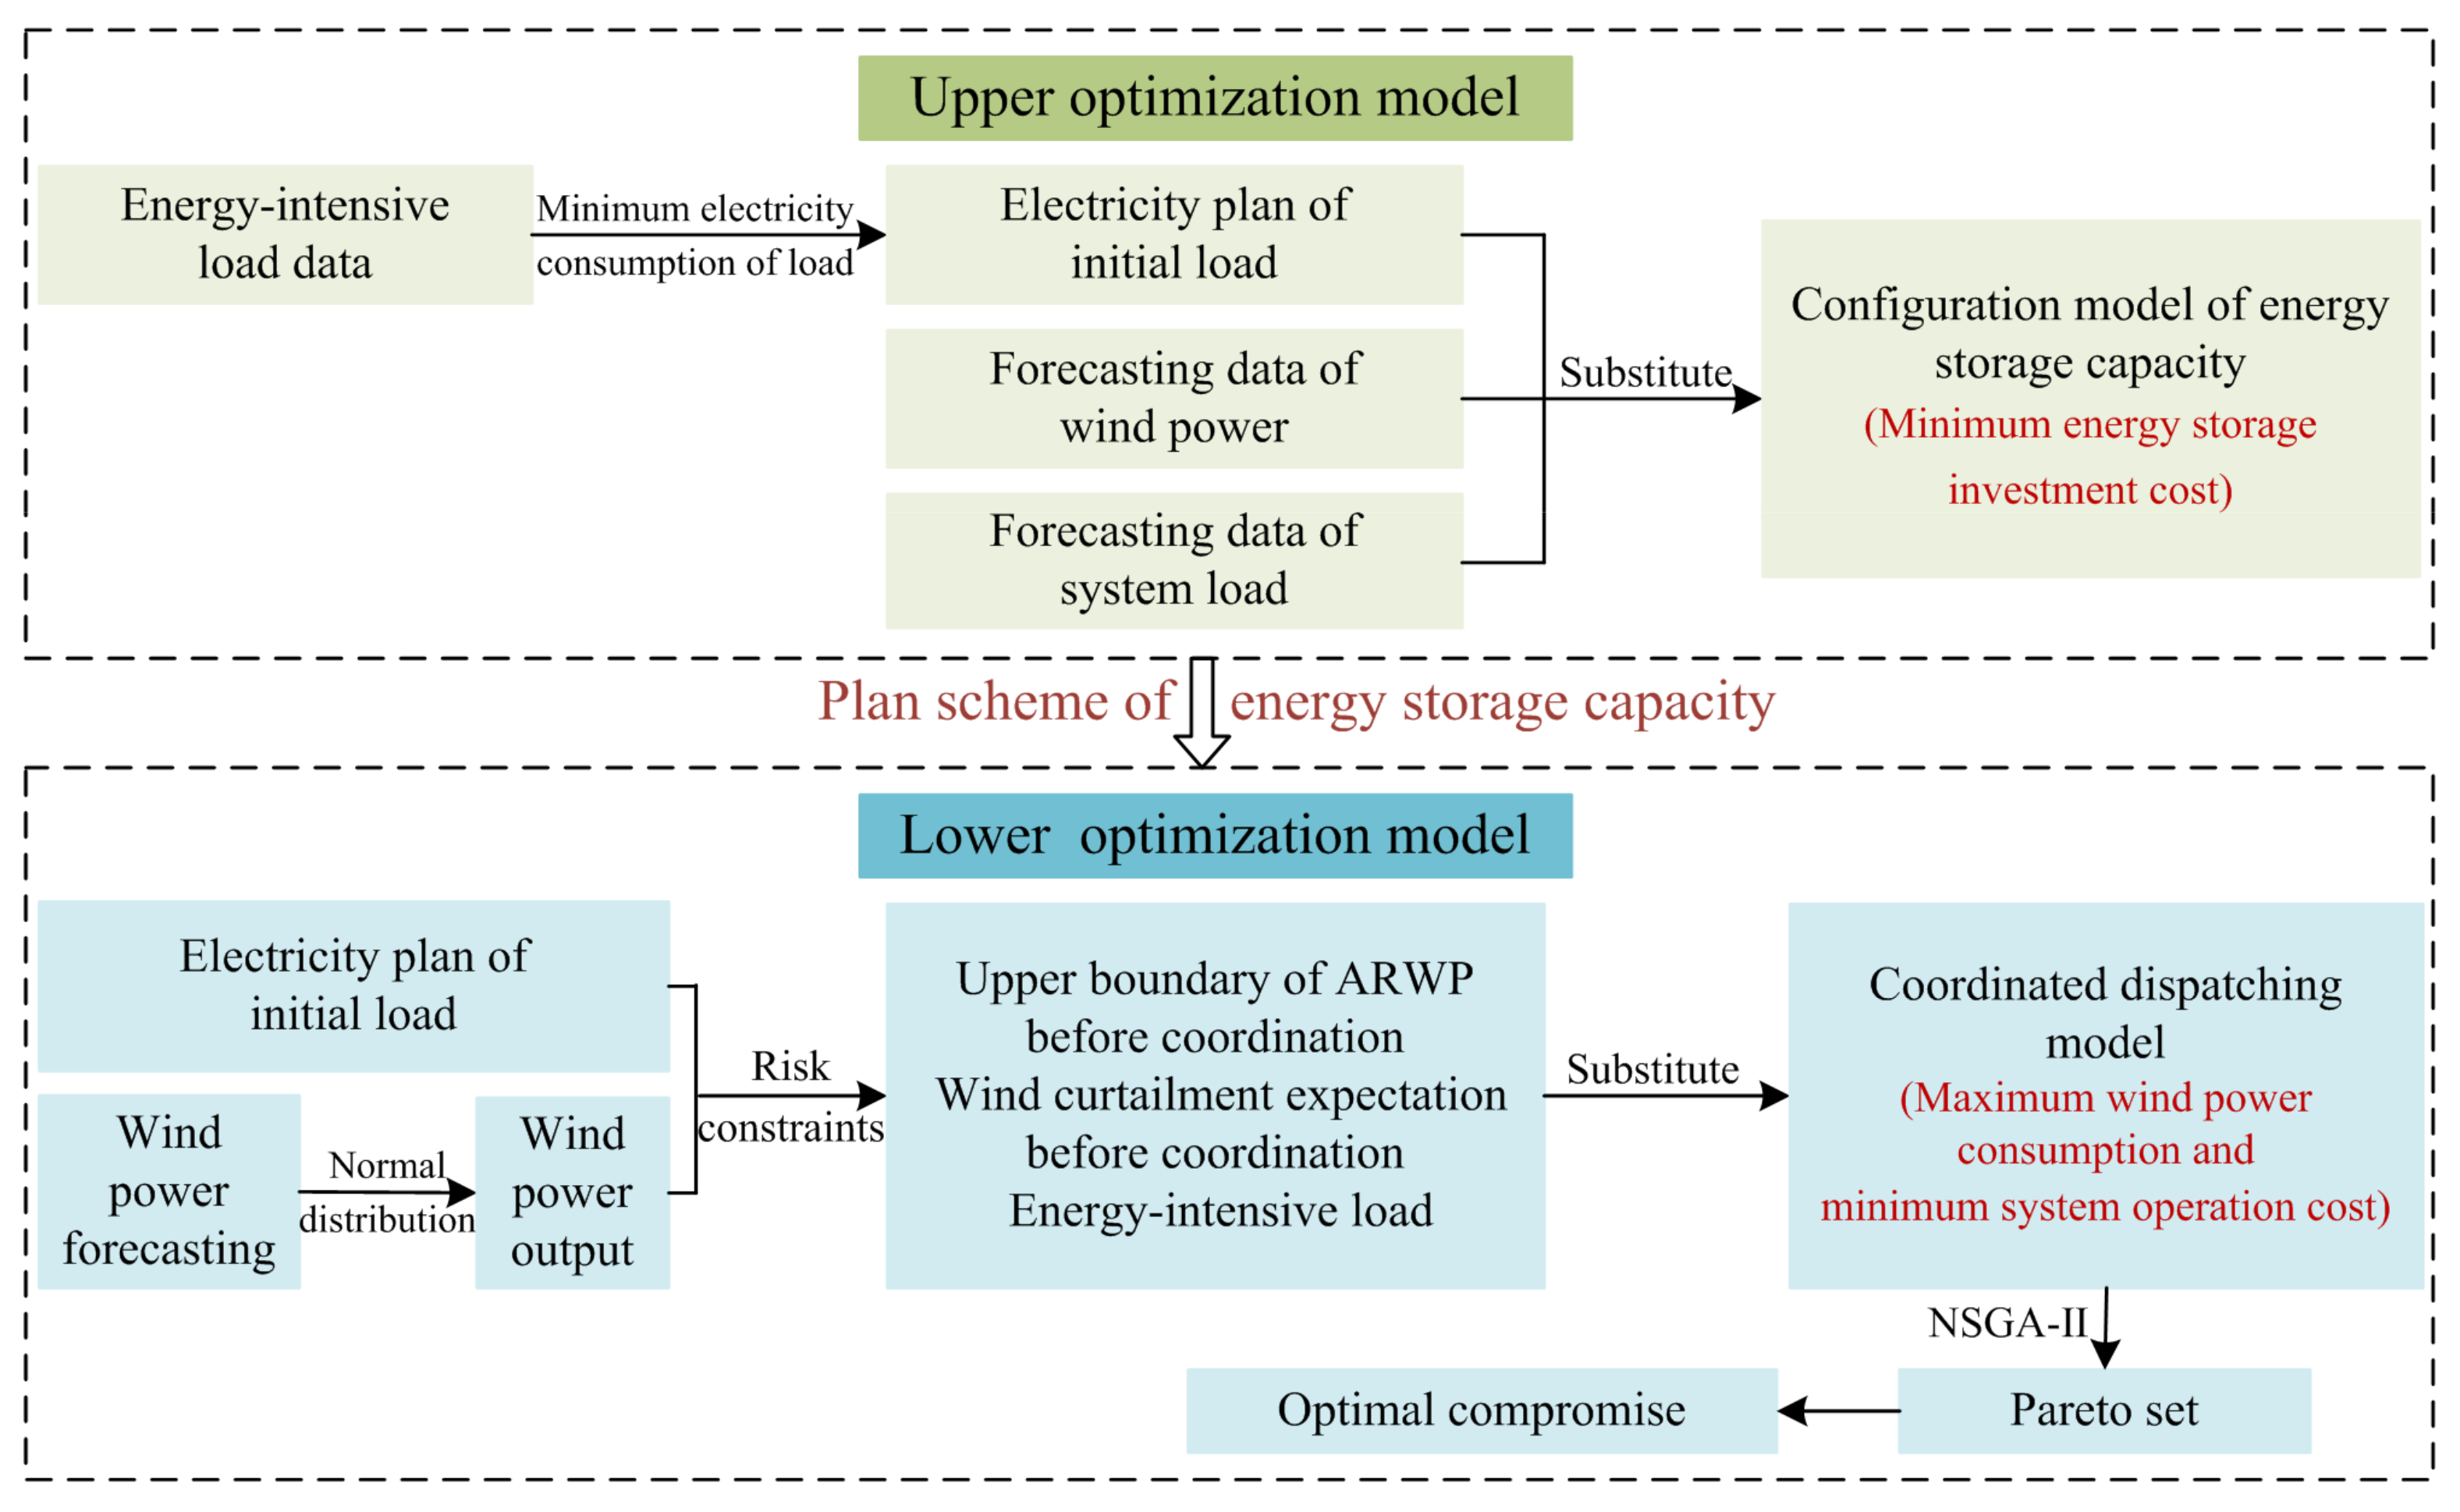
Based on the above analysis of the wind power uncertainty and energy-intensive load dispatching model, the upper model aims at the lowest investment cost of the energy storage system, and establishes an energy storage capacity optimization configuration model on the basis of ensuring the system power balance. The lower model aims at the maximum wind power consumption and the lowest operation cost of the system. Combined with the capacity configuration’s results of the energy storage system obtained from the upper optimization model, a coordinated dispatching model of energy-intensive load and energy storage system is constructed. The bi-level optimization model considering congested wind power consumption is shown in Figure 7.
(1)
Upper optimization model. According to the energy-intensive load data, the energy-intensive load model is self-dispatch with the goal of minimizing power consumption, and the initial energy-intensive load’s electricity plan is obtained. At the same time, according to the wind power prediction data, system load prediction data, combined with the initial energy-intensive load’s electricity plan, the configuration of energy storage capacity is optimized to minimize the investment cost of energy storage system.
(2)
Lower optimization model. The uncertainty of wind power output follows the normal distribution, combined with the initial electricity plan of energy-intensive load, the upper boundary of ARWP before coordination, the expectation of wind curtailment before coordination and the increment of energy-intensive load are obtained by the risk constraint of energy-intensive load. Bring the above results into the coordinated dispatching model, aiming at the maximum wind power consumption and the lowest comprehensive operating cost of the system, using NSGA-II; to solve the problem, and finally the pareto solution set is obtained.

4.1. Model of Energy Storage Capacity Configuration

In order to improve the level of wind power consumption, this paper establishes the model by means of effective cooperation between the energy-intensive load and energy storage system. Wind farms are equipped with energy storage systems [28], relying on the peak-load shifting of the energy storage systems to improve system flexibility and reduce wind curtailment rate.

4.1.1. Objective Function

Configuring energy storage capacity with the goal of minimizing energy storage system investment, operation and maintenance costs, the expression is shown in (9):
min C = 1 365 [ a C i n v + C o n ] a = τ ( 1 + τ ) γ ( 1 + τ ) γ 1 C i n v = ( k S P b + k E E b ) C o n = k S k M P b
where a is the equal-year system coefficient; τ is the annual interest rate; γ is the service life of the energy storage system; C i n v and C o n are the investment and construction cost and operation and maintenance cost of the energy storage system respectively; k S and k E are the unit power cost and unit capacity cost of the energy storage system respectively; k M is the operation and maintenance cost rate of the energy storage system; and P b and E b are the investment power and investment capacity of the energy storage system, respectively.

4.1.2. Constraints

E b min E b E b max P b min P b P b max
where E b max and E b min are the upper and lower limits of the investment capacity of the energy storage system; P b max and P b min are the upper and lower limits of the investment power of the energy storage system, respectively.

4.2. Coordinated Dispatching Model of Energy-Intensive Load and Energy Storage System

4.2.1. Objective Function

The coordinated operation of energy-intensive load and energy storage system can enable the system to consume more wind power within the existing regulation capacity. However, using this method will increase the operation cost of the system. Therefore, how to maximize wind power consumption with the lowest operating cost is the key to cooperative operation. In this paper, a multi-objective optimization model is established with the goal of maximizing wind power consumption and minimizing system operating cost, and the expression is as follows:
min F = t = 1 T ( C t C o n + C t B + C t G + C t W )
where C t C o n , C t B , C t G and C t W are the operating cost of conventional units, the charge and discharge management cost of energy storage system, the dispatching cost of energy-intensive load, and the penalty cost of curtailment wind, respectively. The specific calculation formula for each cost is as follows:
(3)
The operating cost of conventional units C t C o n
C t C o n = k = 1 N ( a k p k , t 2 + b k p k , t + c k d k , t + d o n , k , t C u , k , t )
where N is the number of thermal power units; a k , b k and c k are the cost coefficient of thermal power units; p k , t is the output of the k-th thermal power unit at time t; C u , k , t is the start-up cost of the thermal power unit; d k , t is a 0–1 variable, which is used to indicate the current on/off state of the unit; d o n , k , t is a 0–1 variable, which is used to indicate the starting state.
(4)
The charge and discharge management cost of energy storage system C t B
C t B = λ b , dis P dis , t + λ b , ch P c h , t
where λ b , d i s is the discharging cost coefficient of the energy storage system; λ b , c h is the charging cost coefficient of the energy storage system; P d i s , t is the discharge power of the energy storage system at time t; P c h , t is the charging power of the energy storage system at time t.
(5)
The dispatching cost of energy-intensive load C t G
C t G = ( β M I + β W r ) E i , t u ( w i , t u ) + π N f + ε ( E i , t u ( w i , t u ) ) c L r
where N f is the number of power changes of energy-intensive load; π is the corresponding equipment loss cost in case of single power change; β M I is the raw material cost coefficient per unit energy consumption; β W r is the equipment loss cost coefficient of unit regulated power; E i , t u ( w i , t u , a d d ) is the expected curtailment of wind during the dispatching period; c L r is the increased labor cost of participating in the consumption of congested wind power during the control period; ε ( E i , t u ( w i , t u ) ) is shown in Formula (15).
ε ( E i , t u ( w i , t u ) ) = 0 1 E i , t u ( w i , t u ) = 0 E i , t u ( w i , t u ) > 0
(6)
The penalty cost of curtailment wind C t W
C t G = ( β M I + β W r ) E i , t u ( w i , t u ) + π N f + ε ( E i , t u ( w i , t u ) ) c L r

4.2.2. Constraints

Constraints include conventional unit constraints, system power balance constraints, energy storage system charging and discharging constraints, energy-intensive load constraints, etc.
(1)
Conventional unit constraints
p min , k p k , t p max , k
p d n , k p k , t p k , t 1 p u p , k
d o n , k , t d k , t d k 1 , t 1
( d k , t 1 d k , t ) ( S o n , k , t S o n , min , k ) 0 ( d k , t d k , t 1 ) ( S o f f , k , t S o f f , min , k ) 0
S o n , k , t = S o n , k , t - 1 d k , t + d k , t S o f f , k , t = S o f f , k , t - 1 ( 1 d k , t ) + ( 1 d k , t )
Formula (17) is the output constraint of the conventional unit, p max , k and p min , k are the upper and lower limits of the output of the k-th conventional unit respectively; Formula (18) is the ramp rate constraint of the conventional unit, p d n , k and P u p , k are the maximum descent rate and maximum ascent rate of the active power output of the k-th conventional unit, respectively; Formula (19) is the 0–1 constraint for unit startup; Formula (20) is the minimum start-stop time constraint of the k-th conventional unit, which S o n , k , t is the continuous start-up time of the k-th conventional unit, S o n , min , k is the minimum startup time of the k-th conventional unit, S o f f , k , t is the continuous shutdown time of the k-th conventional unit, and S o f f , min , k is the minimum shutdown time of the k-th conventional unit; Formula (21) is the constraint of the continuous operation time and continuous shutdown time of the unit.
(7)
System power balance constraints
i = 1 W w i , t p + k = 1 G p k , t g + P b , d ( t ) = P l o a d ( t ) + j = 1 E ( P j , t E F + Δ P j , t E F ) + P b , c ( t )
where P b , d ( t ) and P b , c ( t ) represent the discharge and charging power of the battery at time t, respectively; P l o a d ( t ) represents the conventional load power at time t; Δ P j , t E F represents the active power of the energy-intensive load j at time t.
(8)
Energy storage system charging and discharging constraints are as follows:
0 p c h , t ( 1 E S S t ) p c h , max 0 p d i s , t E S S t p d i s , max
S O C t 1 + η E S S , c h p c h , t / E E S S + E S S t D S O C t S O C t 1 + η E S S , c h p c h , t / E E S S + E S S t D S O C t 1 p d i s , t / ( η E S S , d i s E E S S ) E S S t D S O C t S O C t 1 p d i s , t / ( η E S S , d i s E E S S ) E S S t D
0.1 S O C t 0.9
Formula (23) is the constraint equation for the charge and discharge power of the energy storage system, p c h , t and p d i s , t are the charge and discharge power of the energy storage system; p c h , max and p d i s , max are the upper limit of the charge and discharge power of the energy storage device; E S S t is a 0–1 variable indicating the state of energy storage: when E S S t = 0 is in the charging state, when E S S t = 1 is in the discharging state; Formula (24) is the energy storage state of charge constraint, η E S S , c h and η E S S , d i s represent the charging and discharging efficiency of the energy storage system; S O C t is the energy storage state of charge; and E E S S is the upper limit of the capacity of the energy storage device; Formula (25) is the range constraint of the state of charge of energy storage. The D appearing in the model is a sufficiently large parameter introduced.
(9)
Constraints of energy-intensive load are shown in Formulas (5) and (6).

5. Case Analysis

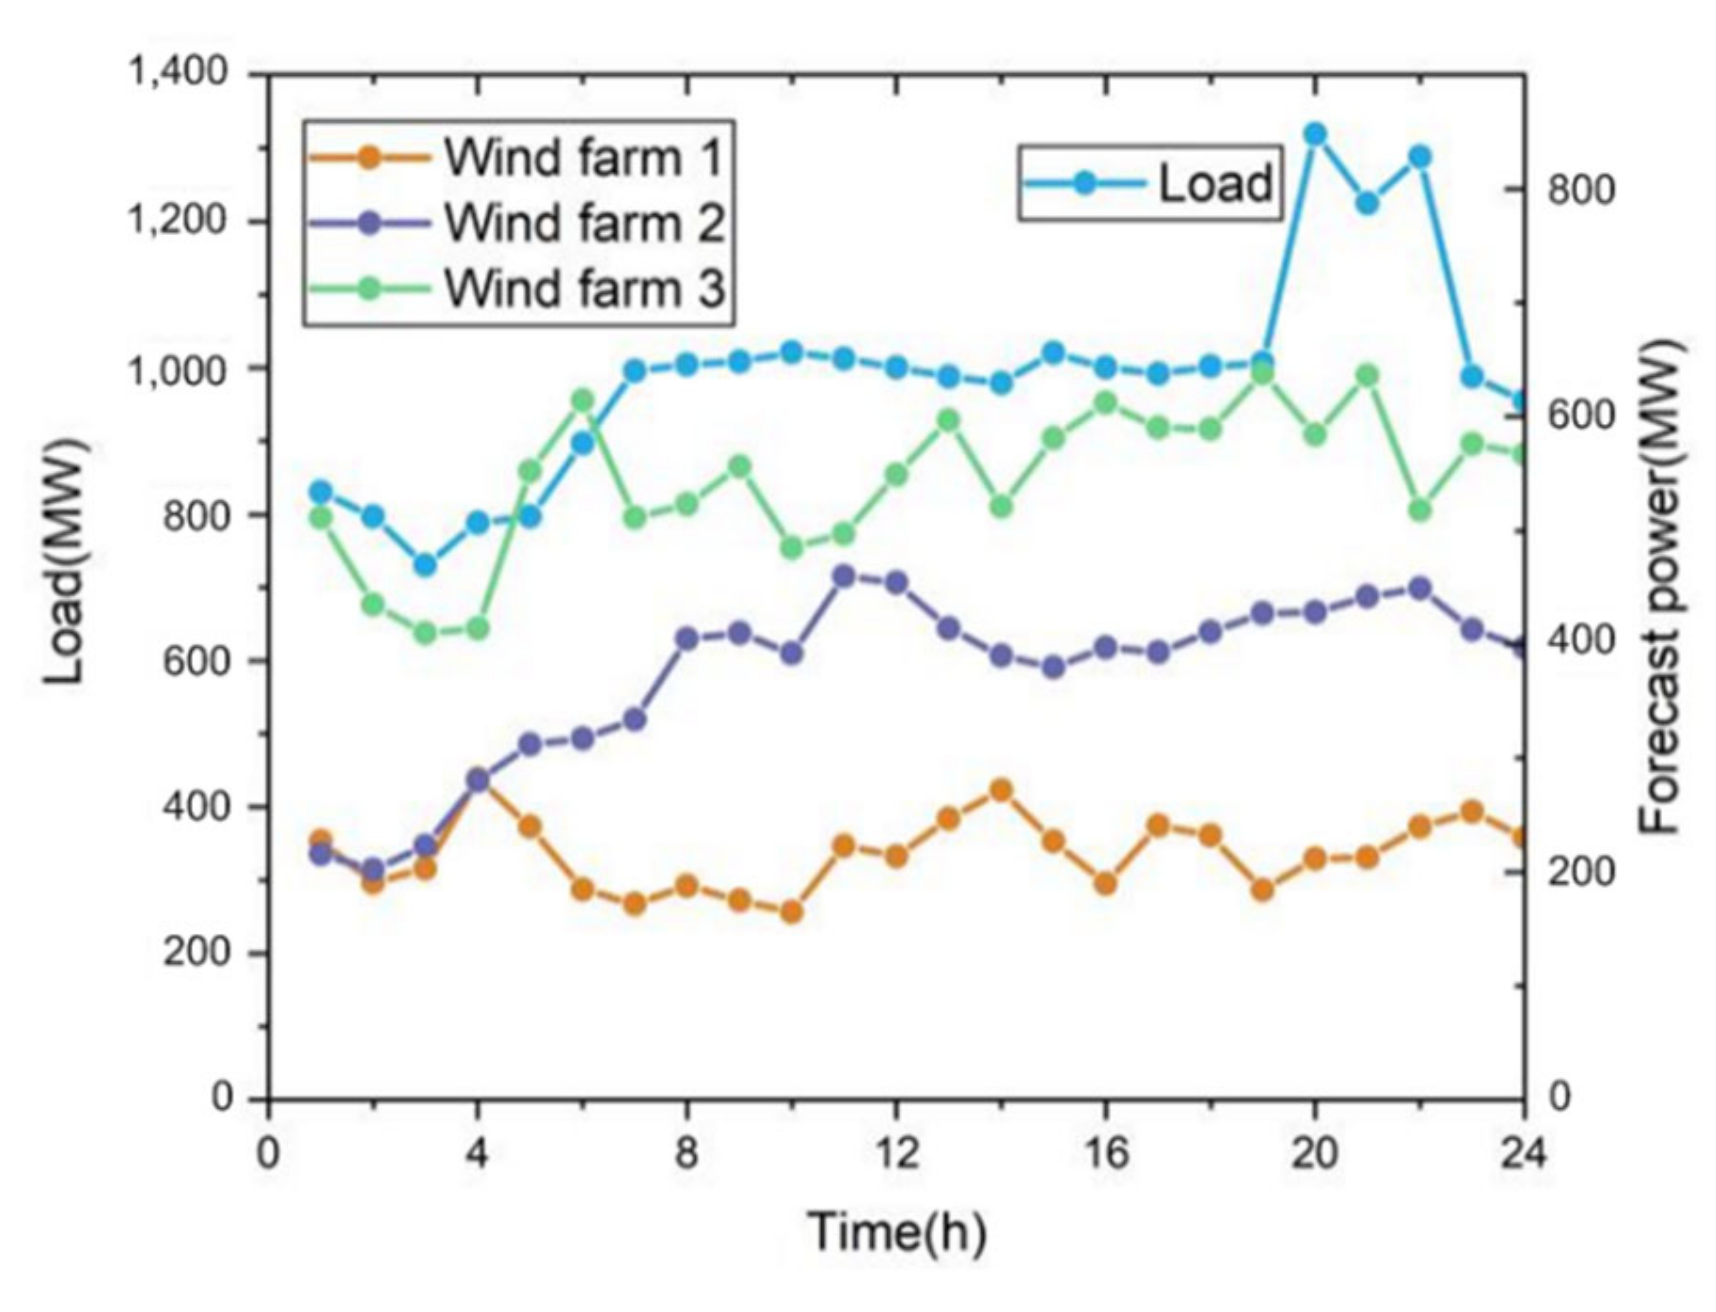
5.1. Basic Data and Scene Settings

This paper takes a wind farm in Gansu as an example to simulate and verify the effectiveness of the proposed model. The system includes 3 wind farms with installed capacities of 300 MW, 500 MW, and 700 MW; the energy-intensive load consists of 12 smelting furnaces, with a single operating power of 17.5–21.5 MW, oven power of 10.5 MW, and longest oven time of 2 h; wind curtailment cost is 300 yuan/MW·h. The energy-intensive load, energy storage system, and related parameter information of conventional units are shown in Table 2, Table 3 and Table 4 and the system load curve and forecasting curve of wind farms are shown in Figure 8.
In order to analyze the impact of wind power uncertainty and the addition of energy-intensive load and energy storage system on wind power consumption, this paper mainly considers the following four cases.
  • Case 1: Without considering the uncertainty of wind power, only energy-intensive load participates in regulation.
  • Case 2: Considering the uncertainty of wind power, only energy-intensive load participates in the regulation.
  • Case 3: Without considering the uncertainty of wind power, energy-intensive load and energy storage system work together.
  • Case 4: Considering the uncertainty of wind power, energy-intensive load and energy storage system work together.

5.2. Result Analysis

5.2.1. Analysis of Storage Capacity Configuration Results

For case 3 and 4, the energy storage capacity is configured with the lowest investment cost of the energy storage system as the goal, and the particle swarm algorithm is used to solve the problem [29]. The population size is 25, and the number of iterations is 50. The operation results are shown in Figure 9 and Table 5.
It can be seen from Figure 9 that the operation results of case 3 and 4 converge in the 12th and 14th generations, respectively, and the best fitness values are 7437 and 9366, respectively. At the same time, the analysis in Table 5 shows that when case 4 considers the uncertainty of wind power, the energy storage capacity is increased compared to case 3 since, at this time, the risk constraints of wind power and energy-intensive load are considered, and the energy-intensive load regulation will be to reduce wind curtailment, and the capacity and power of energy storage will increase.

5.2.2. Analysis of Coordinated Dispatching Results

In this paper, the NSGA-II; algorithm is used to solve the model established in the paper, and the distribution of the Pareto solution set in the four cases obtained in the objective function space is shown in Figure 10.
It can be seen from Figure 10 that the wind power curtailment volume and the operation cost of the system have previously shown an inverse proportional relationship. When the wind power curtailment volume decreases, the operation cost of the system will increase, which is not conducive to the economic indicators of the system. When the operation cost of the system decreases, the wind power curtailment volume will increase, which is not conducive to wind power consumption. Therefore, this paper selects the solution with the highest degree of satisfaction according to the multi-objective compromise strategy. Table 6 presents the two sets of solutions with the smallest wind power curtailment volume and the lowest system operating cost and the optimal compromise solution selected from the Pareto solution set.
In addition, Table 7 shows the overall system operating costs, energy-intensive load costs, energy storage costs, expected curtailment of wind, and energy-intensive load increments in the four cases.
As can be seen from Table 7, the system operation cost in case 2 is reduced by 23,980 yuan compared with case 1. This is due to the fact that the introduction of risk constraints restricts the regulation of energy-intensive load and reduces the load increment, and the output of conventional units will also be reduced, so the system operation cost will be reduced. However, due to the impact of risk constraints, the expected curtailment of wind in case 2 has increased by 11.6 MW compared with case 1. Compared with case 1, the system operation cost of case 3 increased by 48,591 yuan. This is due to the fact that the energy storage system is introduced to participate in wind power consumption, and the energy storage cost is high, so the system operation cost increases. However, the energy storage system is adjusted flexibly and rapidly, the expectation of wind curtailment is significantly reduced, which is 31.27% lower than that in case 1, and the level of wind power consumption is significantly improved. The system operation cost of case 4 is slightly lower than that of case 3. This is due to the fact that the uncertainty of wind power has been taken into account, the risk of the load side has been further avoided, and the increment of energy-intensive load has been reduced. Meanwhile, the increase of energy storage capacity is conducive to the consumption of more wind power. It can be seen that the expected curtailment of wind is reduced by 19.4 MW·h compared with case 3. It can be seen from the comparison of different cases that through the effective cooperation between energy-intensive load and energy storage system, the expected curtailment of wind is significantly reduced and the consumption level of congested wind power is effectively improved. And through the risk constraints of energy-intensive load, enterprises can adjust the load in a targeted manner, which can effectively avoid the risk of mismatch between the adjustment increment of energy-intensive load and the wind power output, so as to greatly reduce the overall operating cost of the system. Moreover, with the reduction of the conventional units output, the startup and shutdown times of units are also relatively reduced, which increases the stability of unit operation. The specific operation conditions under different cases are analyzed below.
(1)
Operation result analysis of case 1
In case 1, the uncertainty of wind power is not considered, and the wind power is consumed by adjusting energy-intensive load. Figure 11 shows the wind power curtailment expectation curve, load power plan curve, upper and lower boundaries of ARWP before and after energy-intensive load participates in the regulation, and system dispatching curve.
As can be seen from Table 7 and Figure 11, since the uncertainty of wind power output is not considered in case 1, in order to consume more wind power, energy-intensive load enterprises will increase load regulation as much as possible. It also increases the operating cost of energy-intensive load while reducing wind curtailment. Since the discretely adjustable energy-intensive load cannot be adjusted continuously in a short time, when the predicted output of wind power is higher but the actual output is lower, it will cause the problem of a mismatch between the load increment and the power generation increment, resulting in a higher risk of load shedding. In order to meet the constraints of system power balance and to try and avoid the risk of load shedding due to the uncertainty of wind power, conventional units will increase output, so the overall operating cost of the system will increase.
(10)
Operation result analysis of case 2
In case 2, the uncertainty of wind power is considered, and the wind power is consumed by adjusting the high load energy load. Figure 12 shows the wind power curtailment expectation curve, load power plan curve, upper and lower boundaries of ARWP before and after energy-intensive load participates in the regulation, and system dispatching curve.
In case 2, the risk constraints of wind power and energy-intensive load are considered. The increment of energy-intensive load is reduced by 44.38 MW·h compared with case 1, and the operation cost of corresponding energy-intensive load is reduced by 25,296 yuan. At the same time, the cost of conventional units is reduced by 2164 yuan, so the comprehensive operation cost of the system is slightly lower than that in case 1. It can be seen that due to the influence of risk constraints, the wind curtailment expectation of case 2 has increased by 11.6 MW·h compared with case 1. In addition, after the energy-intensive load participates in coordinated dispatch, the total ARWP upper boundary of the grid has increased by 499.29 MW·h the lower boundary of ARWP has increased by 9.96 MW·h, and the total amount of APWP has increased by 489.33 MW·h, which greatly improves the acceptance capacity of the power grid for wind power and effectively promotes the consumption of wind power.
It can be seen from Figure 12 that due to the increased risk constraints of wind power and energy-intensive load, compared with the original plan for energy-intensive load, the time period during which the adjusted high-energy load power increases generally corresponds to the time when wind power is relatively curtailed. This indicates that in the coordinated dispatching process of energy-intensive load and wind power, the addition of risk constraint makes the energy-intensive load tend to adjust electricity consumption in the period of more wind curtailment so as to avoid the economic risks brought by wind power shortage to the load side.
In addition, according to Table 7, the increment of energy-intensive load before and after coordination is not equal to the expected reduction of wind abandoning, nor is it equal to the increase of the upper and lower boundary width of the grid ARWP. The reason is that the three are not the same. The load increment is E i , t u ( w i , t u ) , the expected reduction of wind curtailment is E i , t u ( w i , t u , a d d ) E i , t u ( w i , t u ) , and the upper boundary increase of ARWP is w i , t u , a d d w i , t u .
(11)
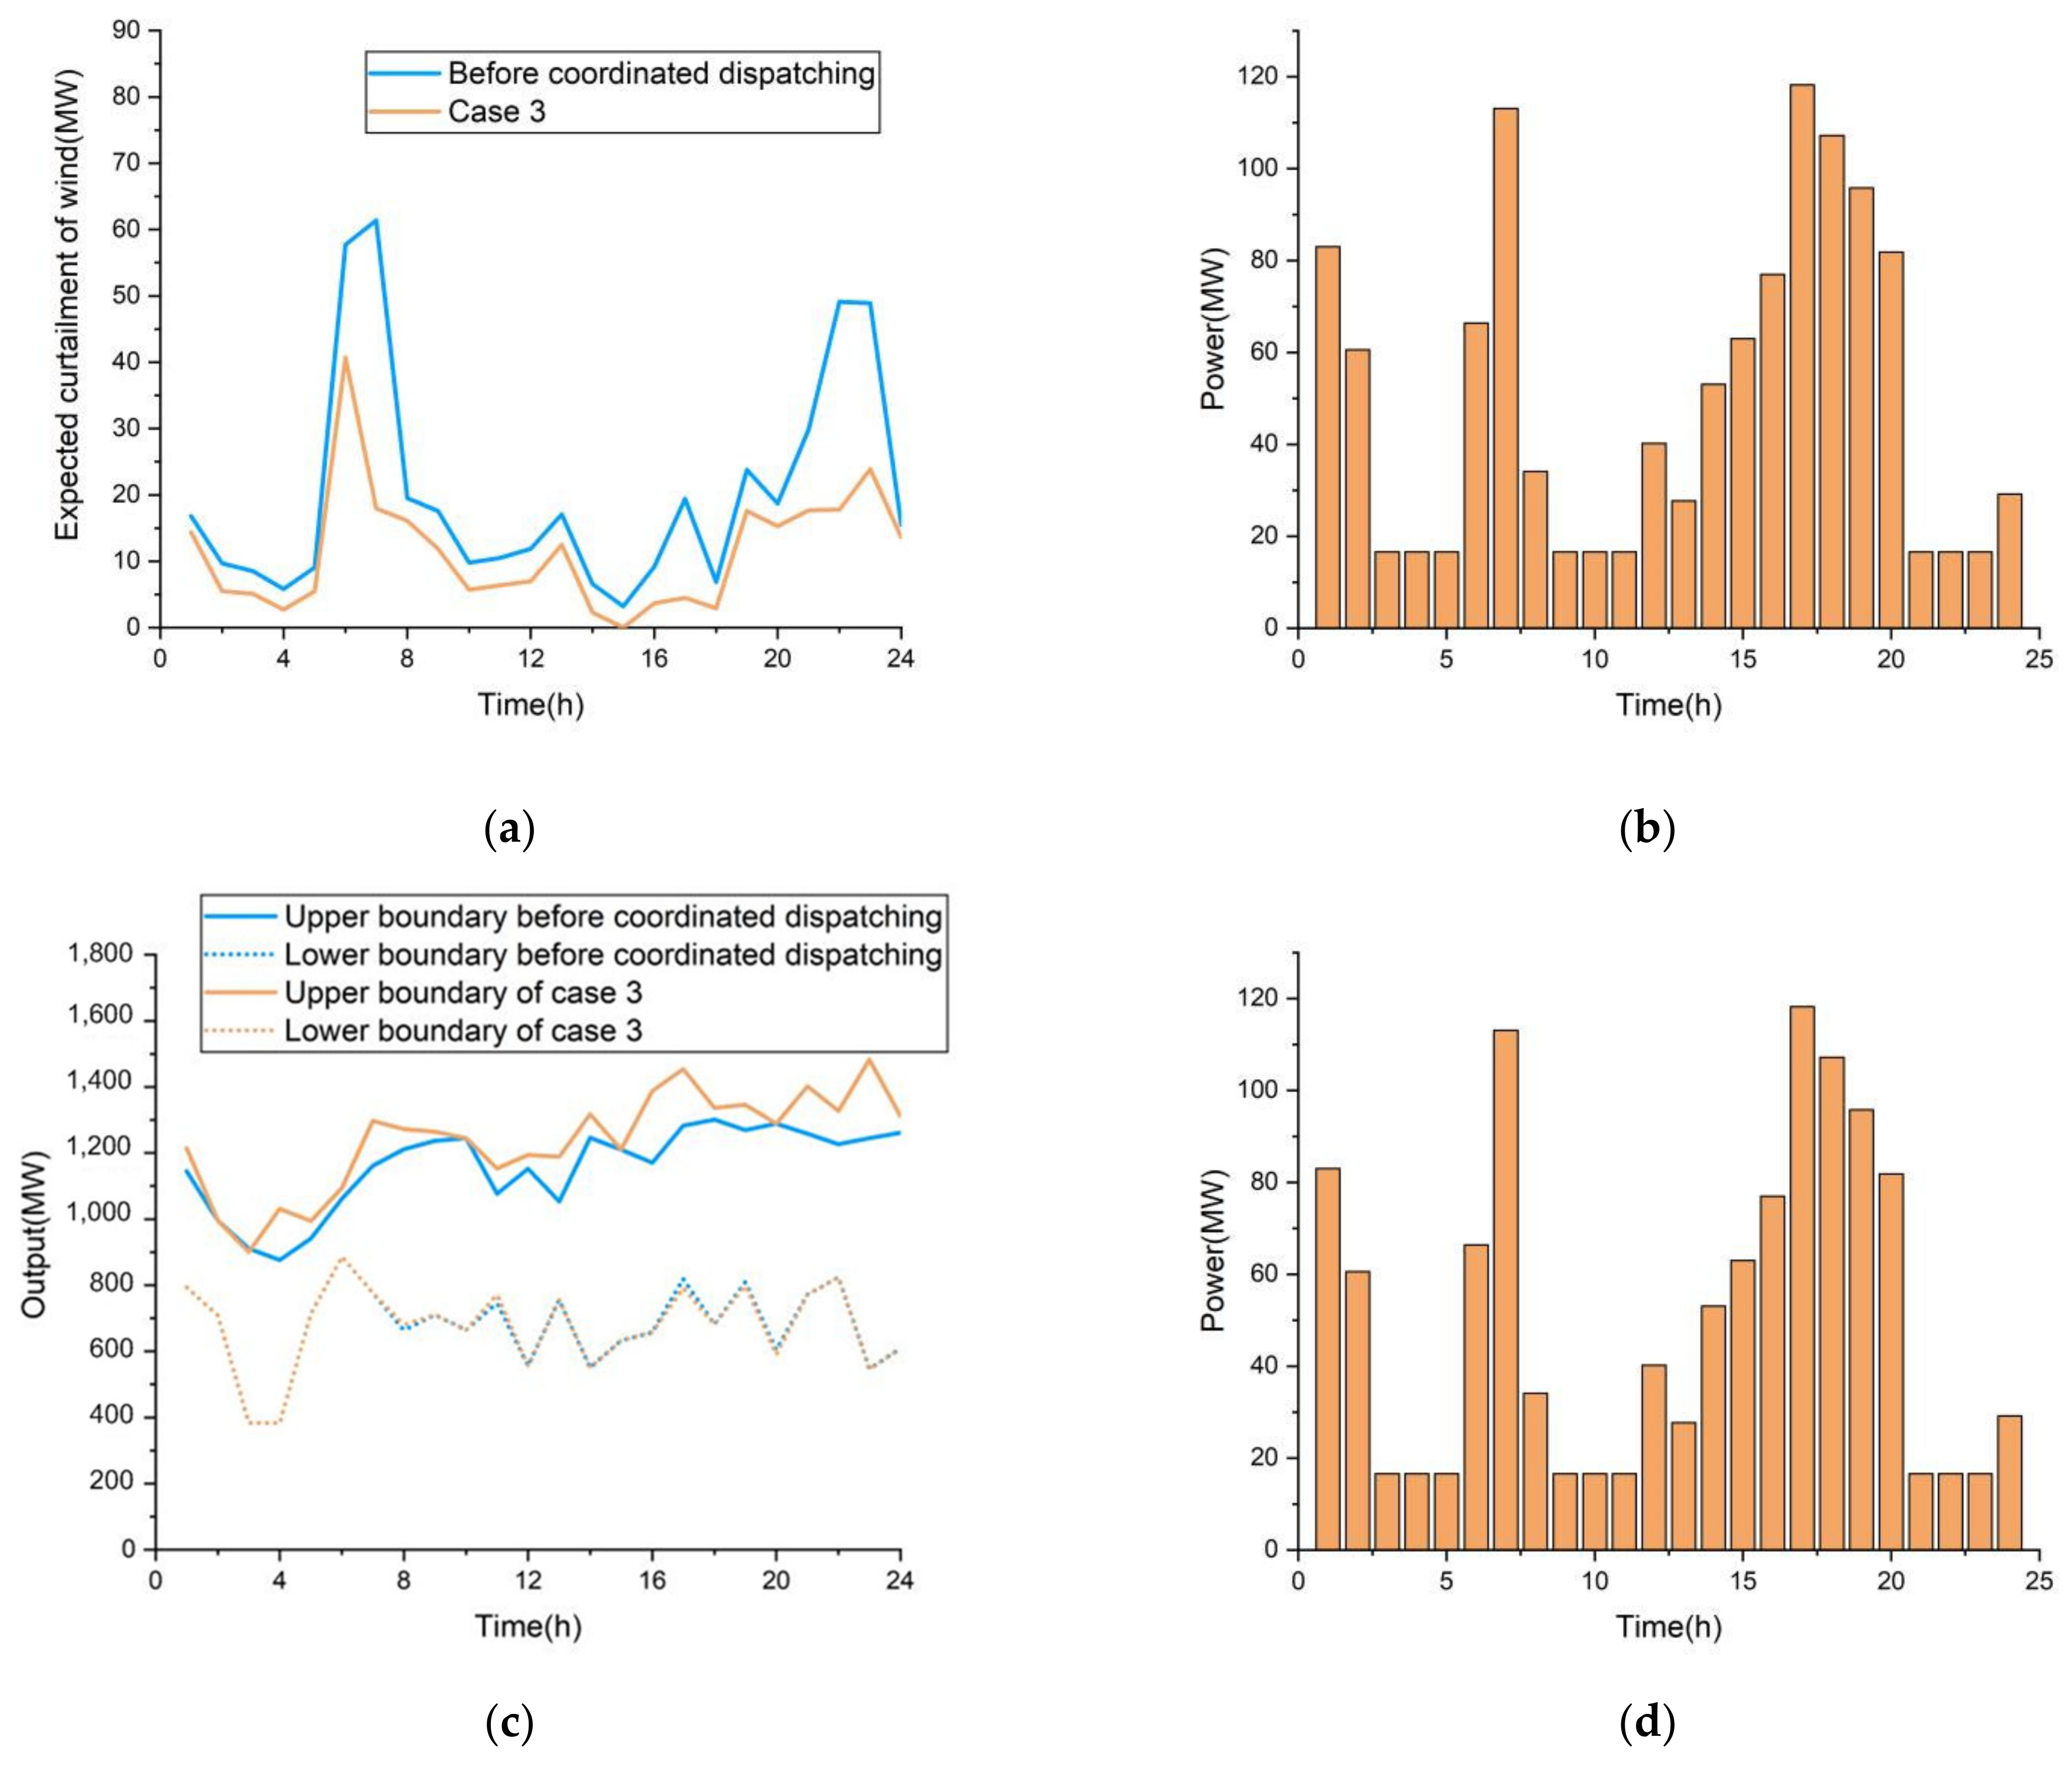
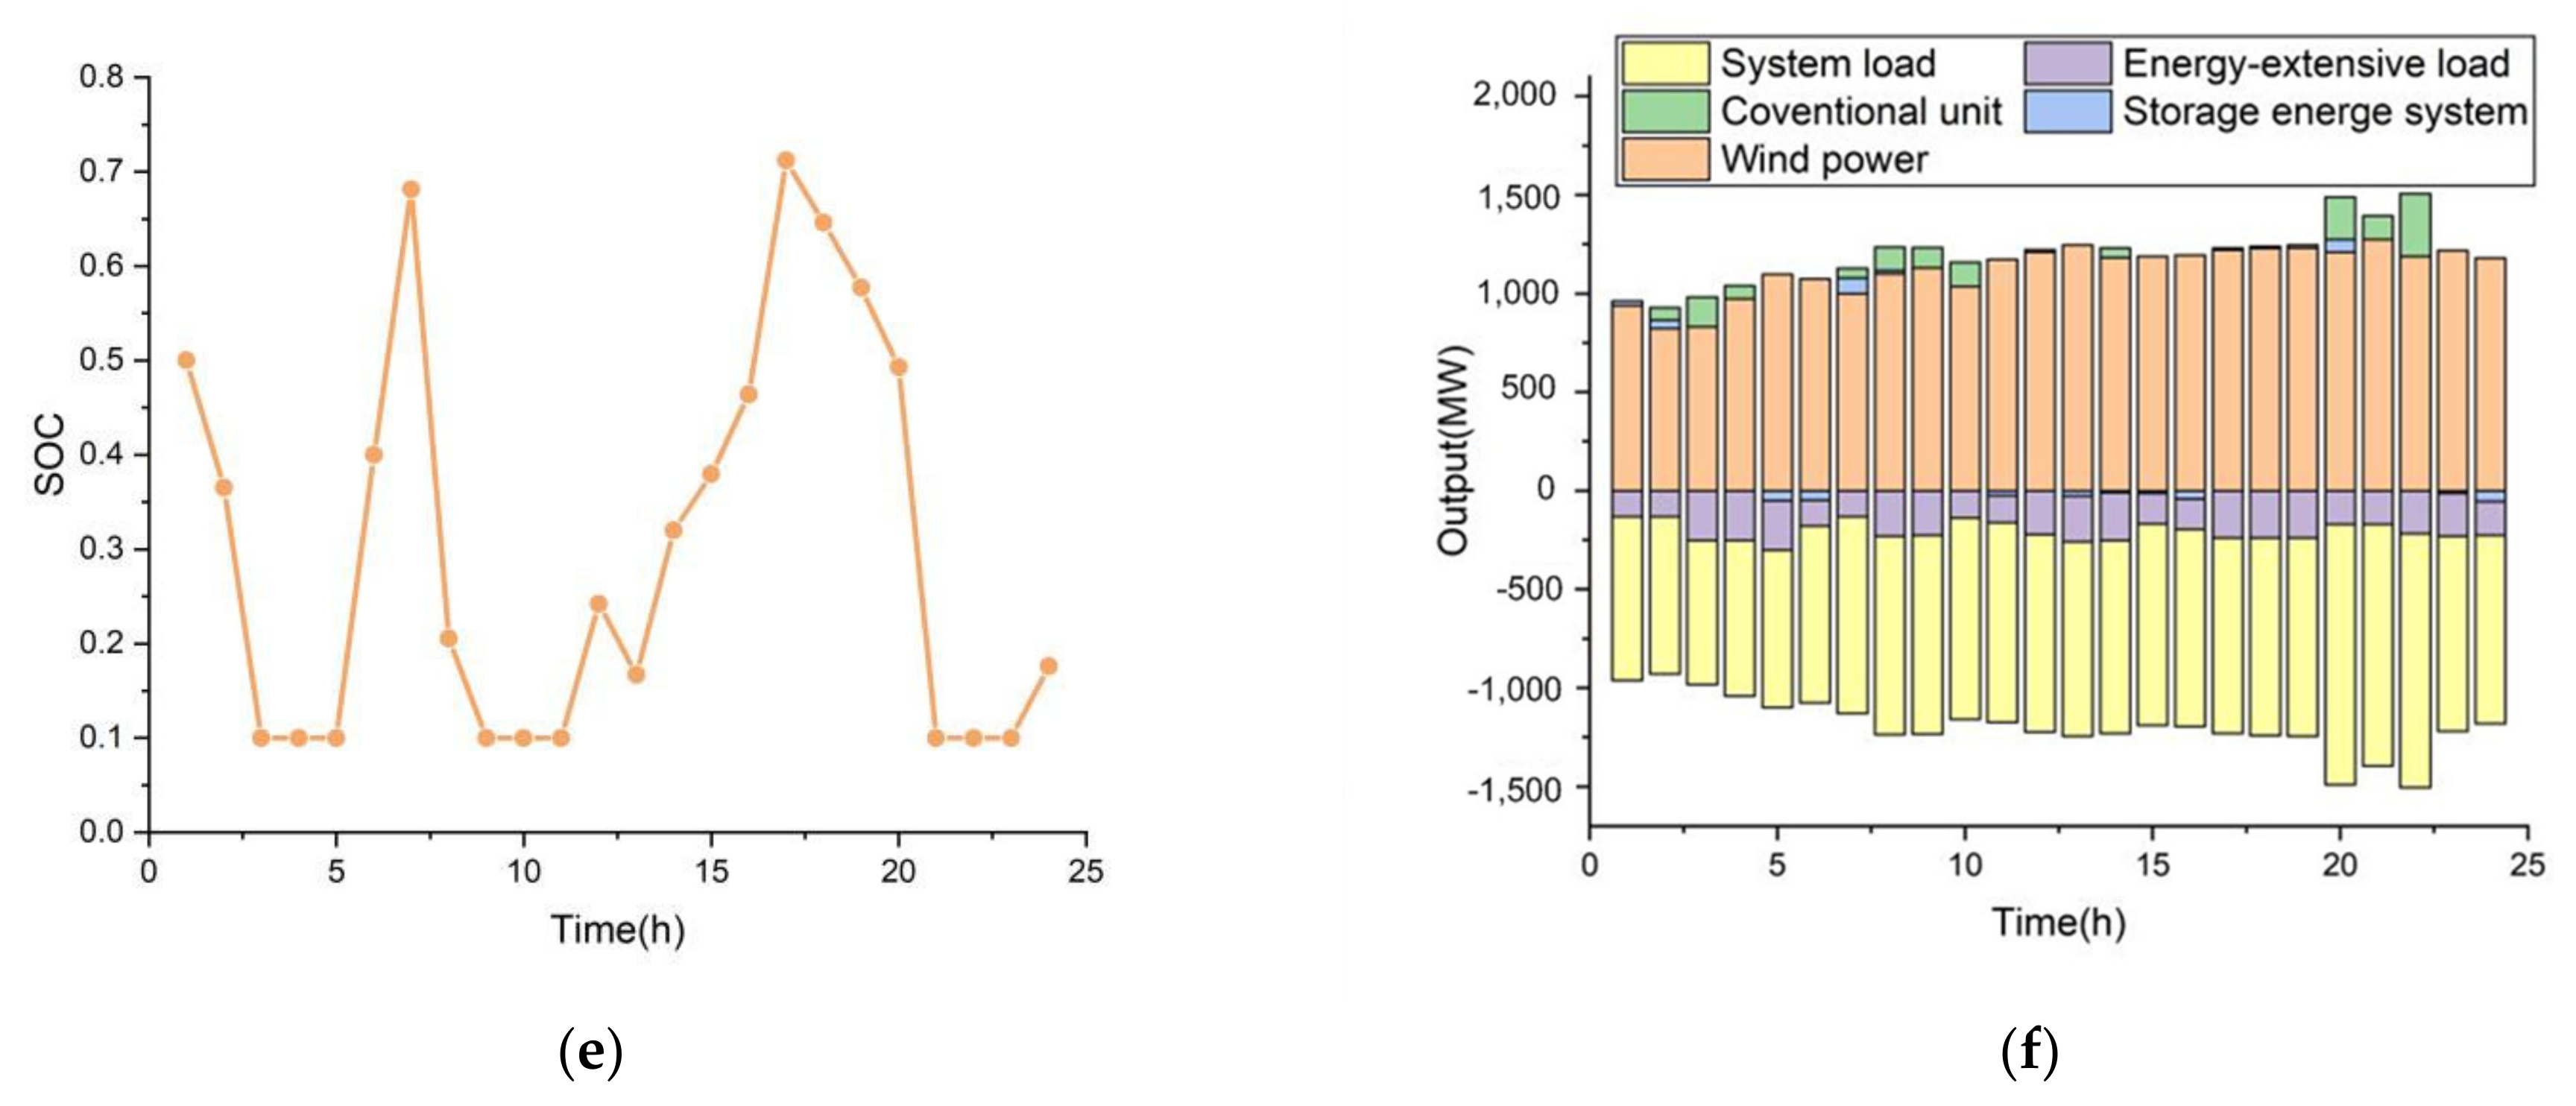
Operation result analysis of case 3
In case 3, the uncertainty of wind power is not considered, and wind power is consumed through the joint adjustment of energy-intensive load and energy storage system. Figure 13 show the wind power curtailment expectation curve, load power plan curve, upper and lower boundaries of ARWP before and after energy-intensive load participates in the regulation, charging and discharging conditions and energy storage system SOC change, and system dispatching curve.
After adding the energy storage system in case 3, it can be seen that the output of conventional units has been significantly decreased, and the start and stop of some conventional units have been reduced, saving the cost of conventional units. At the same time, when the system load is low, the excess electric energy can be stored in the energy storage system. When the load is high, the discharge of the energy storage system can make up for the insufficient wind power output. This shows that the energy storage system can assist the operation of the power system and optimit.
(12)
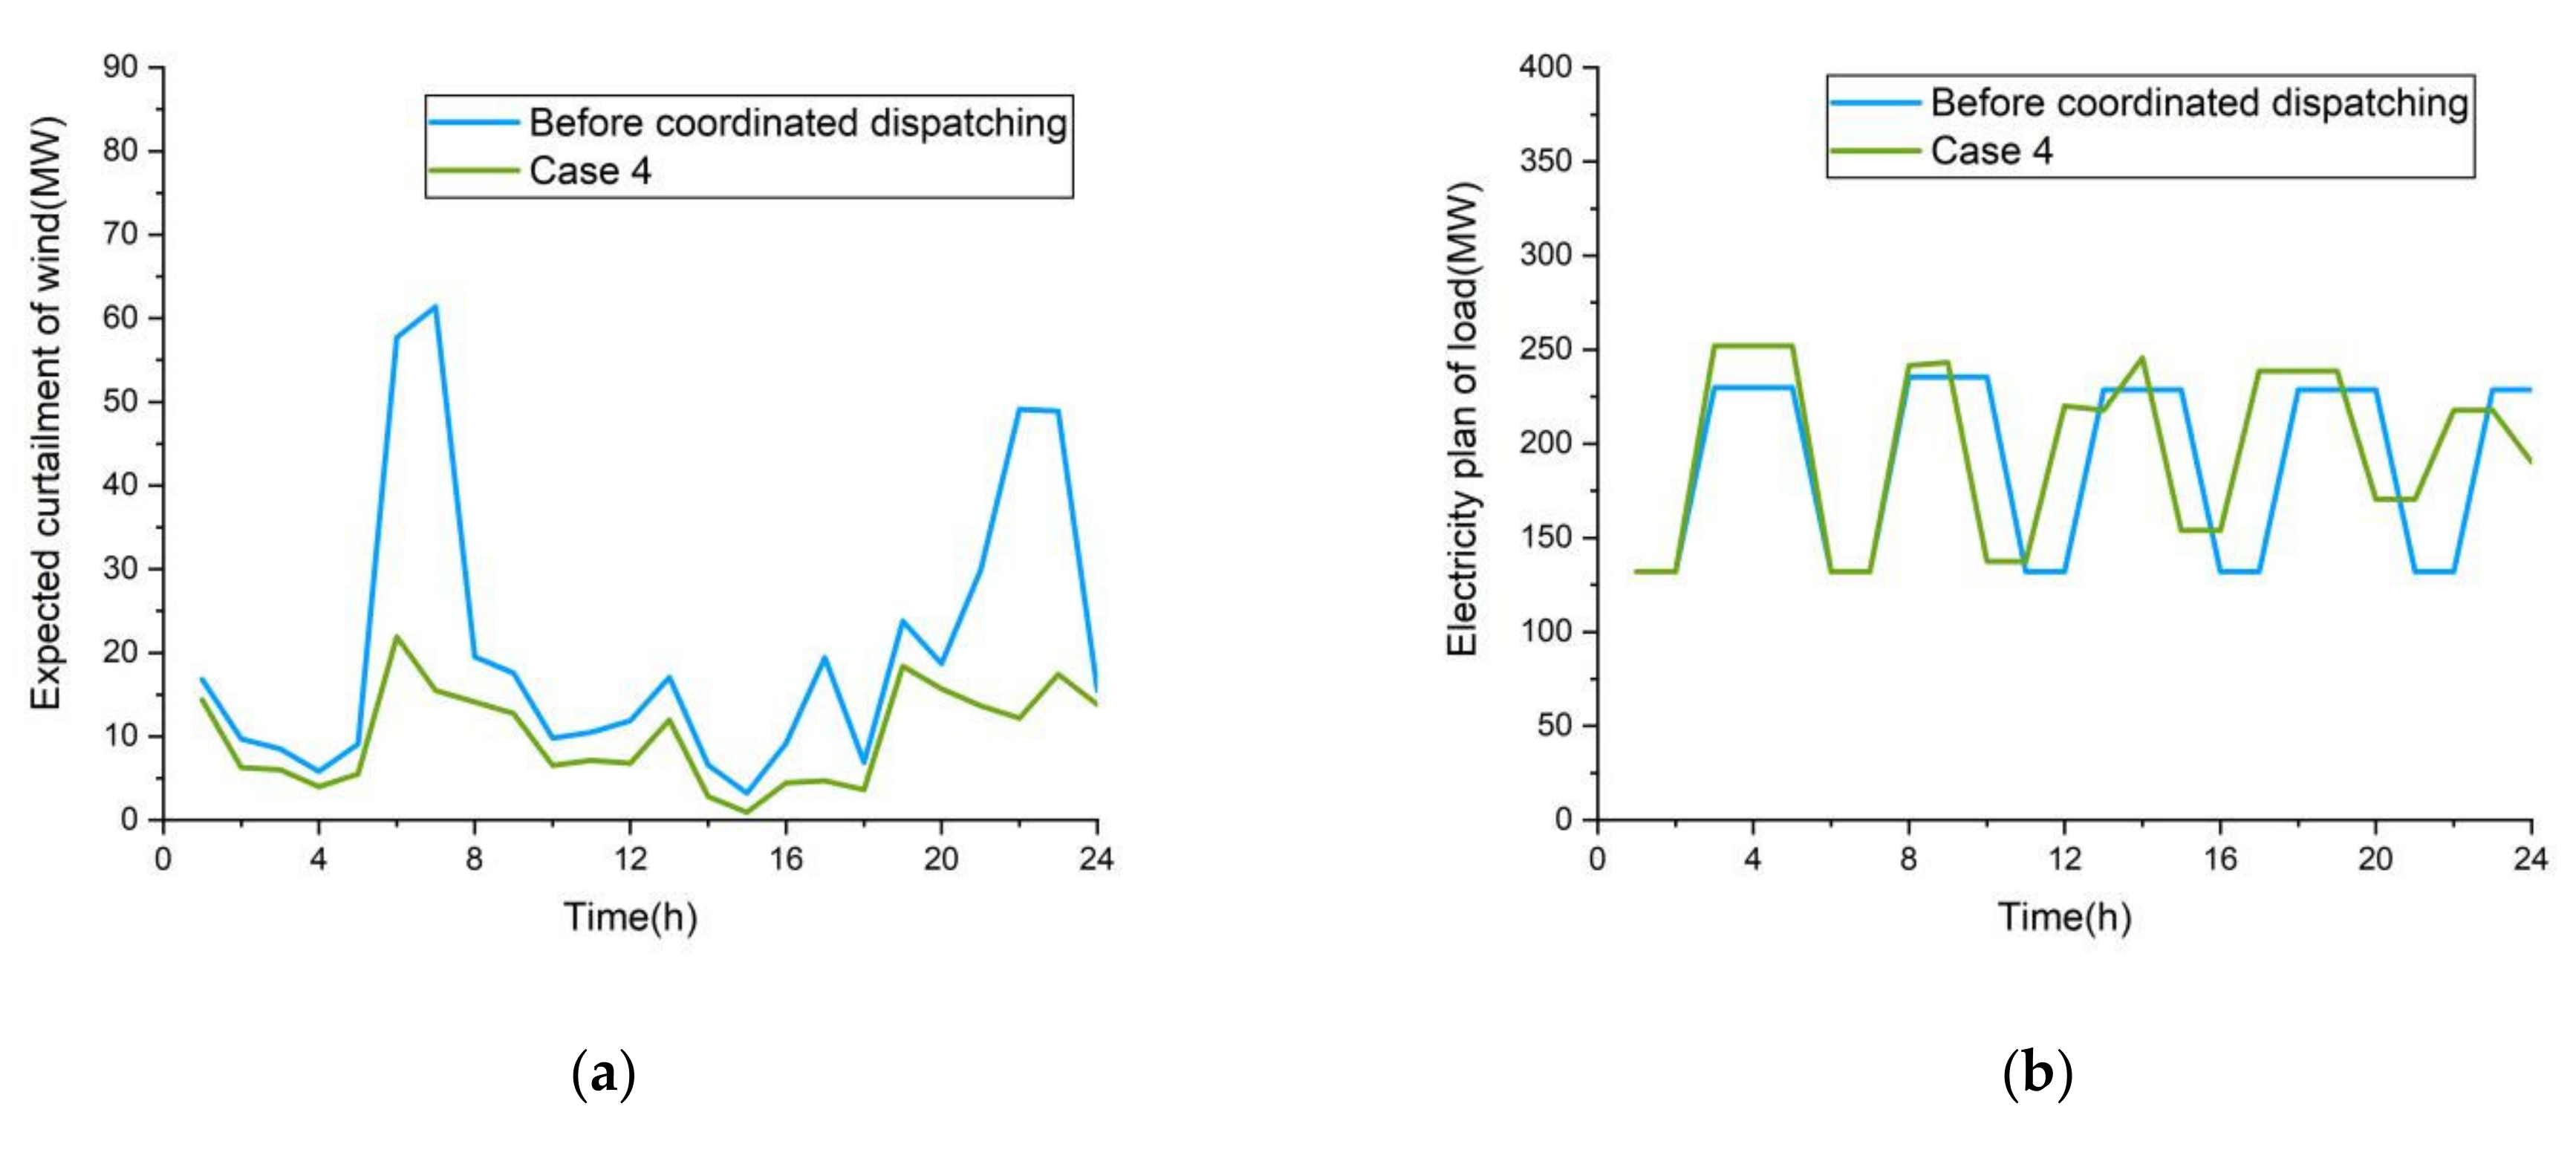
Operation result analysis of case 4
In case 4, the uncertainty of wind power is considered, and wind power is consumed through the joint adjustment of energy-intensive load and energy storage system. Figure 14 shows the wind power curtailment expectation curve, load power plan curve, upper and lower boundaries of ARWP before and after energy-intensive load participates in the regulation, energy storage system SOC change and charging and discharging conditions, and system dispatching curve.
It can be seen from Table 7 that when considering the uncertainty of wind power, the increase in energy-intensive load is reduced by 12.99 MW·h compared with case 3, and the capacity configuration of the energy storage system is increased by 26 MW. The energy storage system can convert part of the wind power waste into chemical energy and store it in the energy storage system when wind power is generated. Therefore, the conventional unit output in case 4 is the smallest among the four cases. In the comparison of different cases, case 4 is the optimal operation scenario, with the lowest expectation of wind curtailment and the most significant effect of wind power consumption.
Through the analysis of different cases, it can be seen that energy-intensive load and the energy storage system can effectively reduce the wind power curtailment volume, decrease the total system operation cost, and reduce the output fluctuation of conventional units while increasing the operation stability of the power system.

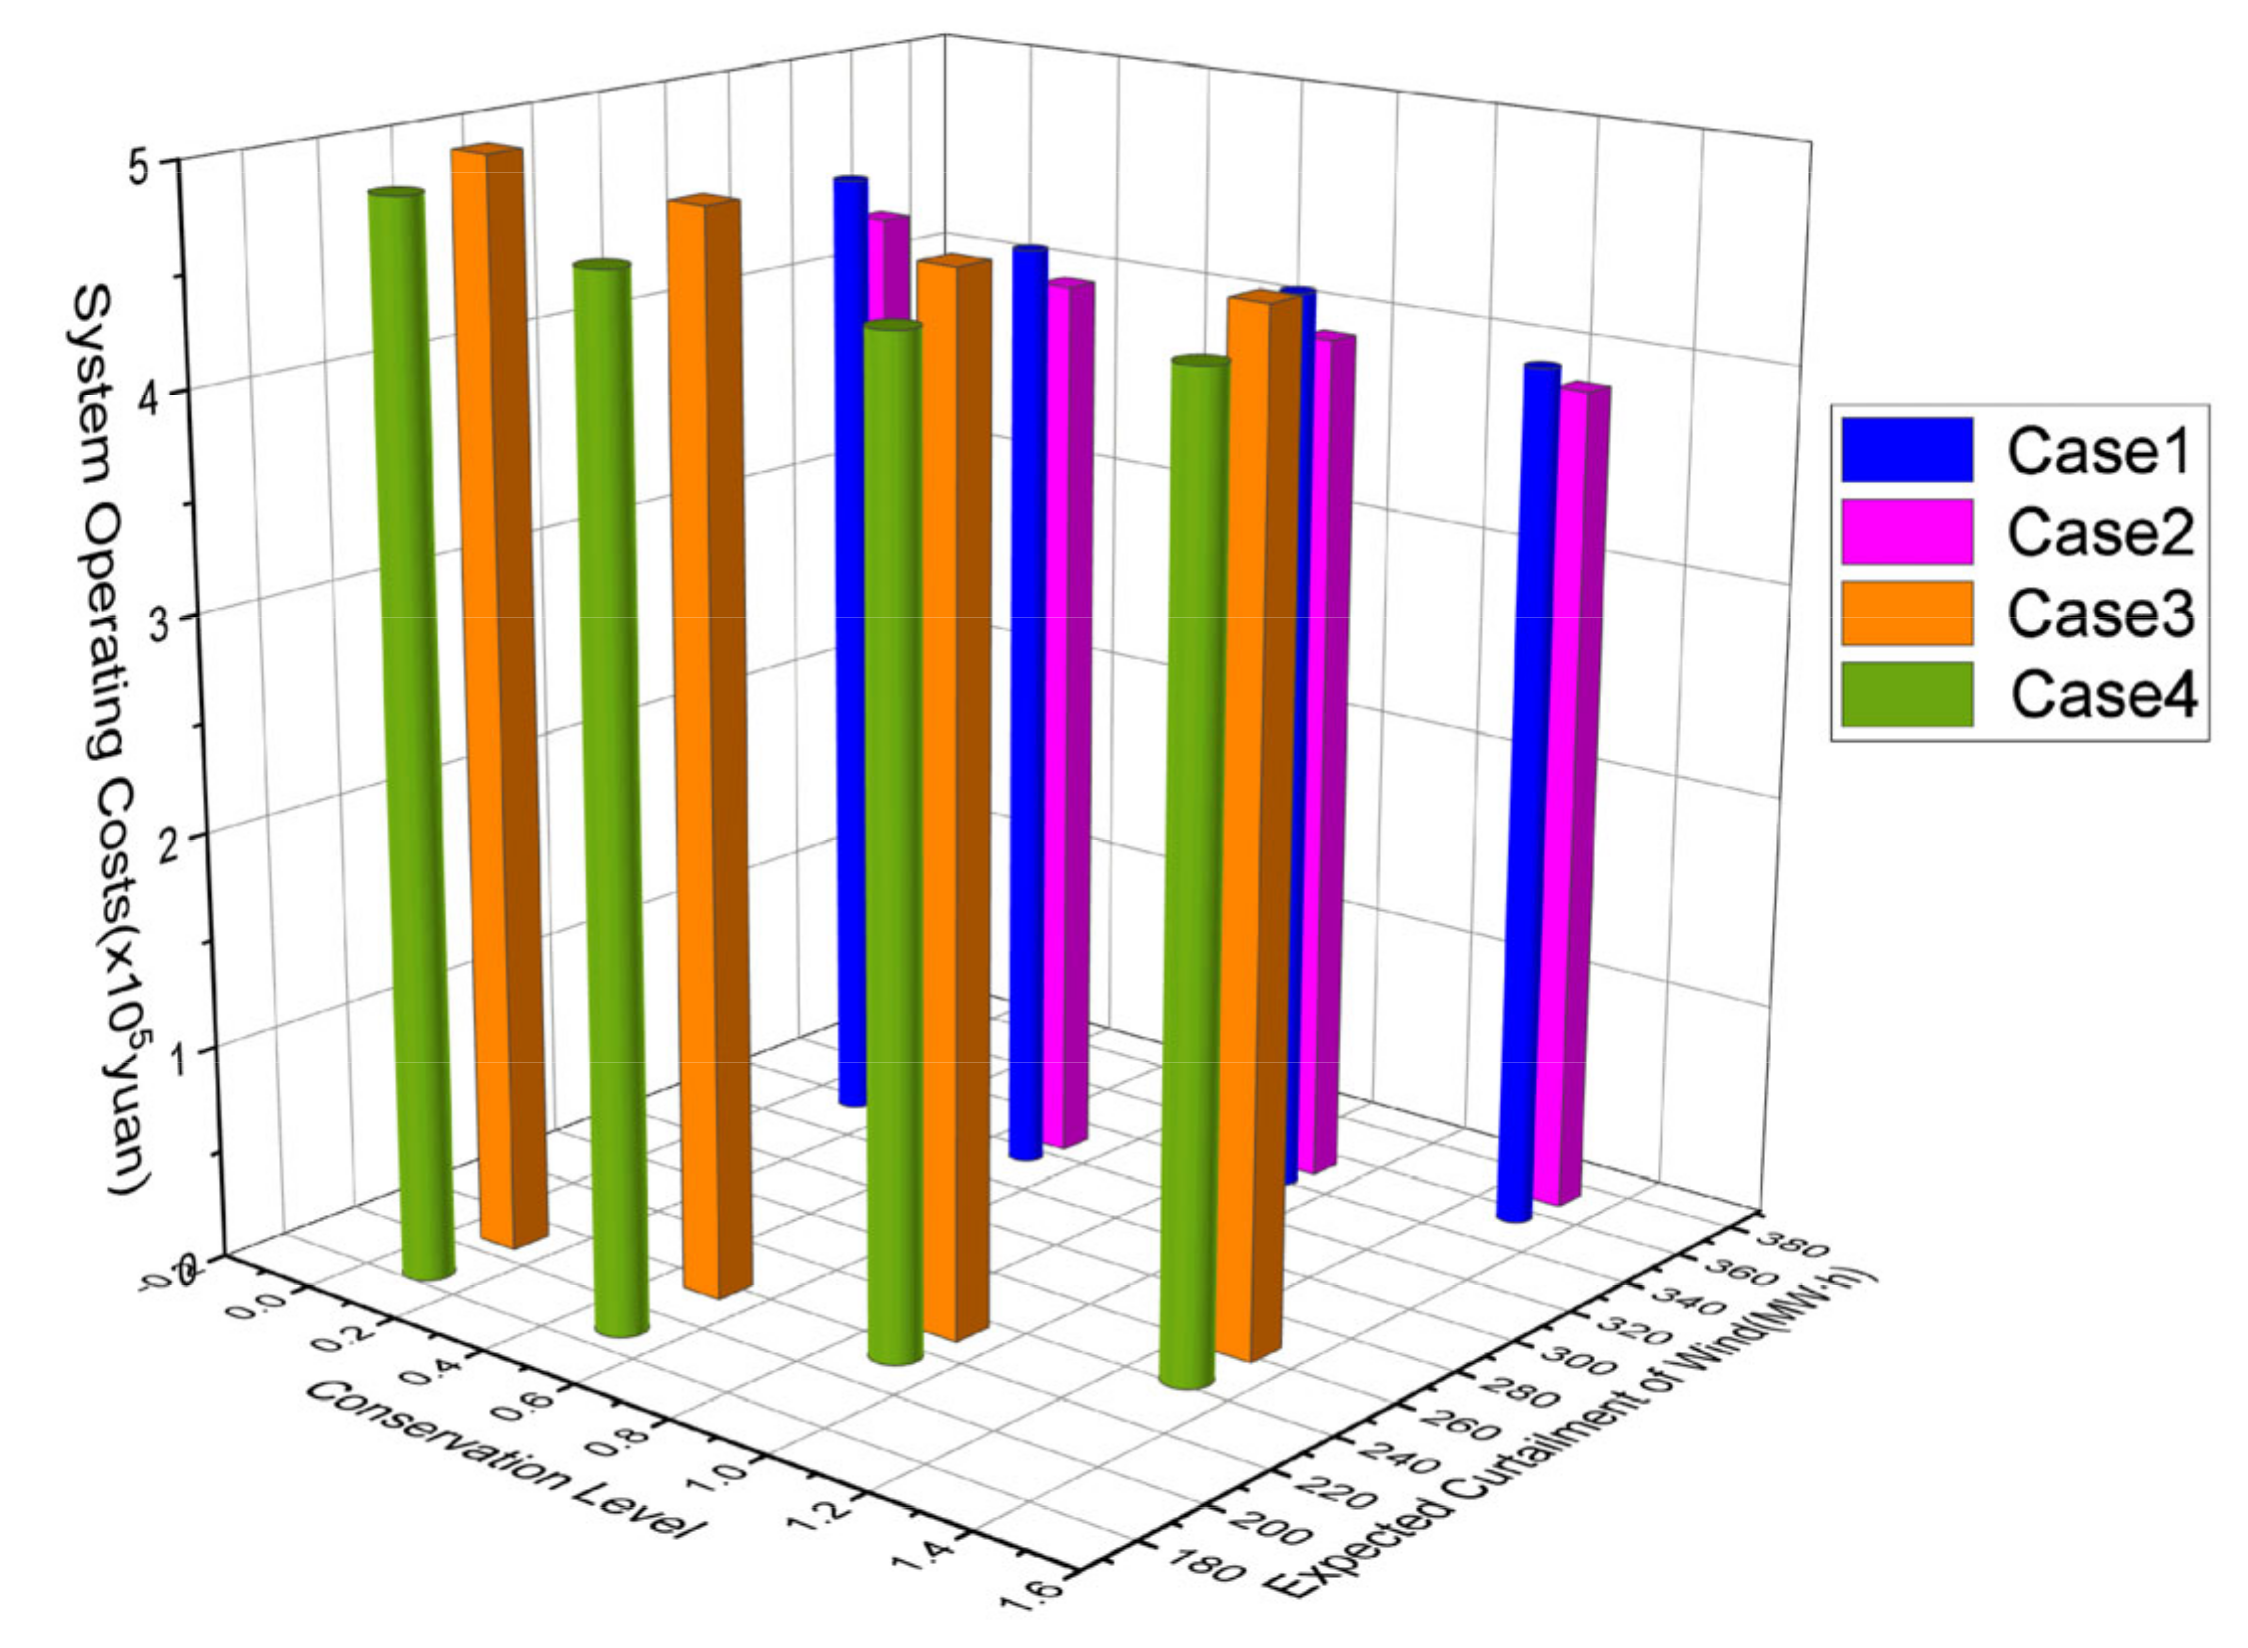
5.2.3. Influence of Conservative Degree Change of Energy-Intensive Load on Consuming Results

In this paper, the concept of conservatism is introduced to restrict the adjustment of energy-intensive load power under wind power uncertainty. The selection of conservatism parameters will affect the results of wind power consumption. Table 8 and Figure 15 show the results of energy-intensive load and energy storage system participating in wind power consumption in each case under different conservative parameters.
From the analysis of Table 8 and Figure 15, it can be seen that when the wind curtailment expectation is certain, the lower the conservative level of the load, the greater the load increment. When the conservative degree is greater than or equal to 1, the load increment is less than or equal to the expected wind curtailment before coordination; when the conservative degree is less than 1, it is understood that the load side is willing to take a certain risk during the coordination process, so the load increment is greater than the expected wind curtailment before coordination. This shows that the introduction of risk constraints can help the load side choose the amount of risk it can bear according to its own characteristics (such that the dispatching method of power grid can meet the needs of load enterprises with different operation tendencies).

6. Conclusions

In order to deal with the mismatch between the electricity plan of the load, the output caused by the uncertainty of wind power, and the fact that the discretely adjustable energy-intensive load cannot be continuously adjusted in a short time in the process of consuming congested wind power, a bi-level optimization model research for an energy-intensive load and energy storage system (considering congested wind power consumption) is proposed, and the effectiveness of this model is verified by a practical example. The specific results of his research are as follows:
(1)
On the basis of analysis of a wind power uncertainty and energy-intensive load dispatching model, this paper establishes the risk constraints of energy-intensive load, which not only fully excavates the regulation potential of energy-intensive load but also solves the problem of mismatch between the regulation increment of energy-intensive load and wind power output.
(2)
In order to maximize the consumption of congested wind power, a bi-level optimization model considering congested wind power consumption is established in this paper. The optimal configuration model of the energy storage capacity is established with the goal of minimizing the investment cost of the energy storage system, and the coordinated dispatching model of the energy-intensive load and energy storage system is established with the goal of maximizing the consumption of wind power and minimizing the comprehensive operation cost of the system (so as to achieve the purpose of maximizing the consumption of congested wind power by using an energy-intensive load and energy storage system).
(3)
According to the example results, the minimum wind curtailment expectation of the proposed method is 204.3 MW·h, which is 65% lower than that before the coordinated dispatch, and the total admissible range of wind power increased by 572.5 MW·h, which effectively improve the ability of the power grid to integrate wind power and increased the overall level of consumption of congested wind power.
(4)
This paper establishes a model of the conservative degree of energy-intensive load participating in the consumption of wind power such that the load side can adjust the load in a targeted manner to avoid the risk of excessive wind power uncertainty. It also analyzes the impact of different conservative values on the consumption of wind power. The results show that under the conditions of a certain wind curtailment expectation, the lower the conservative level of the load, the greater the load increment. energy-intensive load enterprises can choose the risks they can bear according to their own characteristics to ensure corporate benefits.

Author Contributions

Conceptualization, S.Z. and K.Z.; methodology, K.Z.; software, S.Z.; validation, S.Z., K.Z. and G.Z.; formal analysis, S.Z.; investigation, C.F. and W.B.; resources, G.Z.; data curation, J.W.; writing—original draft preparation, S.Z. and K.Z.; writing—review and editing, S.Z., K.Z. and G.Z.; visualization, T.X. and J.W.; supervision, T.X.; project administration, G.Z.; funding acquisition, G.Z. All authors have read and agreed to the published version of the manuscript.

Funding

This research was funded by Key Research and Development Plan of Shaanxi Province (2018-ZDCXL-GY-10-04), Natural Science Basic Research Program of Shaanxi (Program No.2019JLZ-15).

Institutional Review Board Statement

Not applicable.

Informed Consent Statement

Not applicable.

Data Availability Statement

Not applicable.

Conflicts of Interest

The authors declare no conflict of interest.

Abbreviations

ARWPAdmissible region of wind power
Wthe number of wind farms
Ethe number of energy-intensive load
Nthe number of thermal power units
w i , t p planned output
Δ w ^ i , t wind power output fluctuation
w i , t actual output
w i , t u the upper boundary before coordinated dispatching
w i , t l the lower boundary before coordinated dispatching
w i , t f the predicted output of wind farm
σ i the initial standard deviation of wind farm i load forecasting
Δ σ i the standard deviation increment of wind farm i load forecasting process with time scale
ρ u the penalty for wind curtailment
w i , t max the upper limit of output of wind farm i at time t
P j , t E F the total active power
P j , t E F , a d j continuous regulation
x j , t E F state variable
u j , t E F start flag of smelting furnace
P j E F , int the oven power
P j E F , o n normal production power
P j E F , d maximum down-regulated power of smelting furnace
P j E F , u maximum up-regulated power of smelting furnace
T j E F , o n the maximum smelting time of smelting furnace
T j E F , int the maximum oven time of smelting furnace
β adj the degree of conservation
P j , t E F the electricity consumption plan before the adjustment
P j , t E F the electricity consumption plan after the adjustment
w i , t u , a d d the adjusted upper boundary of ARWP
a the equal-year system coefficient
τ the annual interest rate
γ the service life of the energy storage system
C i n v the investment and construction cost of the energy storage system
C i n v the operation and maintenance cost of the energy storage system
k S the unit power cost of the energy storage system
k E the unit capacity cost of the energy storage system
k M the operation and maintenance cost rate of the energy storage system
P b the investment power of the energy storage system
E b the investment capacity of the energy storage system
E b max the upper limits of the investment capacity of the energy storage system
E b min the lower limits of the investment capacity of the energy storage system
P b max the upper limits of the investment power of the energy storage system
P b min the lower limits of the investment power of the energy storage system
C t C o n the operating cost of conventional units
C t B the charge and discharge management cost of energy storage system
C t G the dispatching cost of energy-intensive load
C t W the penalty cost of curtailment wind
a k the cost coefficient of thermal power units
b k the cost coefficient of thermal power units
c k the cost coefficient of thermal power units
p k , t the output of thermal power unit
C u , k , t the start-up cost of the thermal power unit
d k , t 0–1 variable
d o n , k , t 0–1 variable
λ b , dis the discharging cost coefficient of the energy storage system
λ b , ch the charging cost coefficient of the energy storage system
P dis , t the discharge power of the energy storage system
P c h , t the charging power of the energy storage system
π the corresponding equipment loss cost
β M I the raw material cost coefficient per unit energy consumption
β W r the equipment loss cost coefficient of unit regulated power
c L r the increased labor cost of participating in the consumption of congested wind power during the control period
p max , k the upper limits of the output of the conventional unit
p min , k the lower limits of the output of the conventional unit
p d n , k the maximum descent rate of active power output of the conventional unit
p u p , k the maximum ascent rate of active power output of the conventional unit
S o n , k , t the continuous start-up time of the conventional unit
S o n , min , k the minimum start-up time of the conventional unit
S o f f , k , t the continuous shutdown time of the conventional unit
S o f f , min , k the minimum shutdown time of the conventional unit
P b , d ( t ) the discharge power of the battery
P b , c ( t ) the charging power of the battery
P l o a d ( t ) the conventional load power
p c h , max the upper limit of the charge power of the energy storage device
p d i s , max the upper limit of the discharge power of the energy storage device
η E S S , c h the charging efficiency of the energy storage system
η E S S , d i s the discharging efficiency of the energy storage system
S O C t the state of charge

References

  1. Shahriari, M.; Cervone, G.; Clemente-Harding, L.; Delle Monache, L. Using the analog ensemble method as a proxy measurement for wind power predictability. Renew. Energy 2020, 146, 789–801. [Google Scholar] [CrossRef]
  2. Spokesperson of the National Energy Administration. Transcript of the online press conference of the National Energy Administration in the first quarter of 2021. China Electr. Power 2021, 02, 26–29. [Google Scholar]
  3. Simla, T.; Stanek, W. Reducing the impact of wind farms on the electric power system by the use of energy storage. Renew. Energy 2020, 145, 772–782. [Google Scholar] [CrossRef]
  4. Madaeni, S.H.; Sioshansi, R. Using Demand Response to Improve the Emission Benefits of Wind. IEEE Trans. Power Syst. 2013, 28, 1385–1394. [Google Scholar] [CrossRef]
  5. Lamsal, D.; Sreeram, V.; Mishra, Y.; Kumar, D. Output power smoothing control approaches for wind and photovoltaic generation systems: A review. Renew. Sustain. Energy Rev. 2019, 113, 1–22. [Google Scholar] [CrossRef]
  6. Tang, R.M. Promote the integration of power source network and load storage and multi-energy complementation—Policy interpretation of the “Guiding Opinions of the National Development and Reform Commission and the National Energy Administration on Promoting the Development of Power Source, Network, Load and Storage Integration and Multi-energy Complementation”. China Econ. Trade Her. 2021, 8, 10–11. [Google Scholar]
  7. Drovtar, I.; Uuemaa, P.; Rosin, A.; Kilter, J.; Valtin, J. Using demand side management in energy-intensive industries for providing balancing power—The Estonian case study. In Proceedings of the Power & Energy Society General Meeting, Vancouver, BC, Canada, 21–25 July 2013. [Google Scholar]
  8. Paulus, M.; Borggrefe, F. The potential of demand-side management in energy-intensive industries for electricity markets in Germany. Appl. Energy 2011, 88, 432–441. [Google Scholar] [CrossRef]
  9. Zhang, N.; Hu, Z.G.; Shen, B.; He, G.; Zheng, Y.N. An integrated source-grid-load planning model at the macro level: Case study for China’s power sector. Energy 2017, 126, 231–246. [Google Scholar] [CrossRef]
  10. Jonghe, C.D. Optimal Generation Mix with Short-Term Demand Response and Wind Penetration. IEEE Trans. Power Syst. 2012, 27, 830–839. [Google Scholar] [CrossRef]
  11. Kiran, B.; Kumari, M.S. Demand response and pumped hydro storage scheduling for balancing wind power uncertainties: A probabilistic unit commitment approach. Int. J. Electr. Power Energy Syst. 2016, 81, 114–122. [Google Scholar] [CrossRef]
  12. Daneshvar, M.; Mohammadi-Ivatloo, B.; Zare, K. Two-stage optimal robust scheduling of hybrid energy system considering the demand response programs. J. Clean. Prod. 2020, 248, 119267.1–119267.3. [Google Scholar] [CrossRef]
  13. Yang, H.; Yu, Q.; Liu, J.P.; Jia, Y.W.; Yang, G.Y.; Ackom, E.; Dong, Z.Y. Optimal Wind-Solar Capacity Allocation with Coordination of Dynamic Regulation of Hydropower and Energy Intensive Controllable Load. IEEE Access 2020, 8, 110129–110139. [Google Scholar] [CrossRef]
  14. Koohi-Fayegh, S.; Rosen, M.A. A review of energy storage types, applications and recent developments. J. Energy Storage 2020, 27, 101047. [Google Scholar] [CrossRef]
  15. Li, X.; Cao, X.; Li, C.; Yang, B.; Cong, M.; Chen, D.W. A Coordinated Peak Shaving Strategy Using Neural Network for Discretely Adjustable Energy-Intensive Load and Battery Energy Storage. IEEE Access 2019, 8, 5331–5338. [Google Scholar] [CrossRef]
  16. Khosravi, M.; Afsharnia, S.; Farhangi, S. Optimal sizing and technology selection of hybrid energy storage system with novel dispatching power for wind power integration. Int. J. Electr. Power Energy Syst. 2021, 127, 106660. [Google Scholar] [CrossRef]
  17. Sulaeman, S.; Tian, Y.; Benidris, M.; Mitra, J. Quantification of Storage Necessary to Firm Up Wind Generation. IEEE Trans. Ind. Appl. 2017, 53, 3228–3236. [Google Scholar] [CrossRef]
  18. Khalid, M.; Almuhaini, M.; Aguilera, R.P.; Savkin, A.V. Method for planning a wind–solar–battery hybrid power plant with optimal generation-demand matching. IET Renew. Power Gener. 2018, 12, 1800–1806. [Google Scholar] [CrossRef] [Green Version]
  19. Dicorato, M.; Forte, G.; Pisani, M.; Trovato, M. Planning and Operating Combined Wind-Storage System in Electricity Market. IEEE Trans. Sustain. Energy 2012, 3, 209–217. [Google Scholar] [CrossRef]
  20. He, H.; Peng, F.; Gao, Z.; Liu, X.; HU, S.; Zhou, W.; Sun, H. A Multi-Objective Risk Scheduling Model of an Electrical Power System-Containing Wind Power Station with Wind and Energy Storage Integration. Energies 2019, 12, 2153. [Google Scholar] [CrossRef] [Green Version]
  21. Sun, R.F.; Zhang, T.; Liang, J. Evaluation and application of wind power integration capacity in power grid. Autom. Electr. Power Syst. 2011, 35, 70–76. [Google Scholar]
  22. Li, P.; Yu, D.; Yang, M.; Wang, J. Flexible look-ahead dispatch realized by robust optimization considering cvar of wind power. IEEE Trans. Power Syst. 2018, 33, 5330–5340. [Google Scholar] [CrossRef]
  23. Dvorkin, Y.; Lubin, M.; Backhaus, S.; Chertkov, M. Uncertainty Sets for Wind Power Generation. IEEE Trans. Power Syst. 2016, 31, 3326–3327. [Google Scholar] [CrossRef] [Green Version]
  24. Ding, Y.; Shao, C.; Yan, J.; Song, Y.; Zhang, C.; Guo, C. Economical flexibility options for integrating fluctuating wind energy in power systems: The case of China. Appl. Energy 2018, 228, 426–436. [Google Scholar] [CrossRef]
  25. Ge, S.; Yu, K.; Chen, X.Y.; Liao, Y.C.; Huang, X.S.; Zhao, J. Research on power loss reduction method based on continuous regulating features of energy-intensive industrial loads. In Proceedings of the 2016 IEEE International Conference on Power System Technology, Wollongong, NSW, Australia, 28 September–1 October 2016. [Google Scholar]
  26. Ramlal, C.J.; Singh, A.; Rocke, S. Repetitive learning frequency control for energy intensive corporate microgrids subject to Cyclic Batch Loads. In Proceedings of the 2020 IEEE PES Innovative Smart Grid Technologies Europe (ISGT-Europe)—IEEE, Hague, The Netherlands, 26–28 October 2020. [Google Scholar]
  27. Tovarovskii, I.G.; Merkulov, A.E. Features of Temperature and Concentration Fields During Pig and Cast Iron Smelting in a Blast Furnace Workspace. Metallurgist 2016, 60, 589–593. [Google Scholar] [CrossRef]
  28. Psarros, G.N.; Dratsas, P.A.; Papathanassiou, S.A. A comparison between central- and self-dispatch storage management principles in island systems. Appl. Energy 2021, 298, 117181. [Google Scholar] [CrossRef]
  29. Mahapatra, S.; Badi, M.; Raj, S. Implementation of PSO, it’s variants and Hybrid GWO-PSO for improving Reactive Power Planning. In Proceedings of the 2019 Global Conference for Advancement in Technology (GCAT), Bangalore, India, 18–20 October 2019; pp. 1–6. [Google Scholar]
Figure 1. ARWP of a wind farm.
Processes 10 00051 g001
Figure 2. Probability density function of a wind farm.
Processes 10 00051 g002
Figure 3. Schematic diagram of congested wind power consumption.
Processes 10 00051 g003
Figure 4. Schematic diagram of risk constraints of energy-intensive load and wind power.
Processes 10 00051 g004
Figure 5. Schematic diagram of electrolytic aluminum load regulation characteristics.
Processes 10 00051 g005
Figure 6. Schematic diagram of titanium alloy load regulation characteristics.
Processes 10 00051 g006
Figure 7. Flowchart of bi-level optimization model considering congested wind power consumption.
Processes 10 00051 g007
Figure 8. Curve of system load and forecasting power of wind farms.
Processes 10 00051 g008
Figure 9. (a) Case 3 convergence result; (b) Case 4 convergence result.
Processes 10 00051 g009
Figure 10. Pareto solution set distribution in different cases.
Processes 10 00051 g010
Figure 11. (a) Curves of expected curtailment of wind; (b) Curves of electricity plan of load; (c) ARWP boundary of power grid; (d) System coordination dispatching diagram.
Processes 10 00051 g011
Figure 12. (a) Curves of expected curtailment of wind; (b) Curves of electricity plan of load; (c) ARWP boundary of power grid; (d) System coordination dispatching diagram.
Processes 10 00051 g012
Figure 13. (a) Curves of expected curtailment of wind; (b) Curves of electricity plan of load; (c) ARWP boundary of power grid; (d) Charging and discharging of energy storage system; (e) Energy storage system SOC; (f) System coordination dispatching diagram.
Processes 10 00051 g013aProcesses 10 00051 g013b
Figure 14. (a) Curves of expected curtailment of wind; (b) Curves of electricity plan of load; (c) ARWP boundary of power grid; (d) Charging and discharging of energy storage system; (e) Energy storage system SOC; (f) System coordination dispatching diagram.
Processes 10 00051 g014aProcesses 10 00051 g014b
Figure 15. Results of congested wind power consumption under different conservative degrees.
Processes 10 00051 g015
Table 1. Various types of energy-intensive load regulation characteristics.
Load TypeTypical LoadPower Stability Duration/hContinuous Regulation
discretely adjustable loadElectrolytic aluminum≥2No
continuously adjustable loadTitanium alloy0Yes
Table 2. Energy-intensive load parameters.
Parameter β adj β M I β W r c L r N f
Value0.8450 yuan/MW·h120 yuan/MW·h120 yuan/MW·h300 yuan/time
Table 3. Energy-intensive load parameters.
Parameter τ γ k S k E k M λ b , dis λ b , ch
Value0.0220100,000 yuan/MVA150,000 yuan/MW·h0.046 yuan/MW4 yuan/MW
Table 4. Conventional unit parameters.
Parameter Unit123
P max , i / M W 200300380
P min , i / M W 5080100
P up , i / M W 130140150
P d n , i / M W 130140150
a i 0.00390.00300.0027
b i 17.3316.2314.12
c i 300500700
Minimum startup time/h234
Minimum downtime/h234
Start-up cost/yuan100012501500
Table 5. Energy storage system capacity configuration results.
CaseConfiguration ParameterInvestment Cost/(Yuan·d−1)
Energy Storage Capacity/MW·HEnergy Storage Power/MW
31661187437
41921379366
Table 6. Comparison of Pareto optimal solutions in different cases.
GoalsMinimum Expected Curtailment of WindMinimum Operation CostOptimal Compromise
Case1Expected curtailment of wind/MW·h203.5418.4325.8
Operation cost/yuan502,843353,492429,543
Case2Expected curtailment of wind/MW·h236.9441.5337.4
Operation cost/yuan499,201349,363405,563
Case3Expected curtailment of wind/MW·h162.5284.7223.9
Operation cost/yuan534,292428,394478,134
Case4Expected curtailment of wind/MW·h180.4237.6204.3
Operation cost/yuan509,278409,021459,272
Table 7. Comparison of results in different cases.
Case1234
System operating cost/yuan429,543405,563478,134459,272
energy-intensive load cost/yuan281,219255,923253,842246,438
Energy storage cost/yuan00128,165122,695
Conventional unit cost/yuan50,58448,42028,95728,849
Expected curtailment of wind/MW·h325.8337.4223.9204.3
Load increment/MW·h489.61445.23441.58428.59
Table 8. Energy storage system capacity configuration results.
CaseConservation LevelSystem Operating Costs/YuanExpected Curtailment of Wind/MW·h
11.3401,638355.68
0.9425,890340.95
0.5439,105316.03
0.1458,264317.08
21.3386,633370.56
0.9401,640351.63
0.5419,271328.19
0.1437,434327.21
31.3462,743262.29
0.9472,974232.62
0.5489,671218.01
0.1501,224209.93
41.3442,729243.19
0.9451,964215.05
0.5470,691190.12
0.1489,830185.44
Publisher’s Note: MDPI stays neutral with regard to jurisdictional claims in published maps and institutional affiliations.

