
The Influencing Factors for Volume Stability of Ladle Slag


1
Department of Environmental Engineering, National Cheng Kung University, No. 1, Daxue Rd. East Dist., Tainan City 701401, Taiwan
2
Department of Resources Engineering, National Cheng Kung University, No. 1, Daxue Rd. East Dist., Tainan City 701401, Taiwan
*
Authors to whom correspondence should be addressed.
Processes 2022, 10(1), 92; https://doi.org/10.3390/pr10010092
Submission received: 1 November 2021
/
Revised: 23 December 2021
/
Accepted: 29 December 2021
/
Published: 3 January 2022
(This article belongs to the Special Issue Advances in Solid Waste Treatment and Design)
Abstract
:The purpose of this study was to investigate the mechanism causing the unsoundness of ladle slag. Calcination temperature may have an impact on the level of reactivity of f-CaO. When CaO was produced at a higher temperature, the reactivity of CaO was lower. For example, dead burnt CaO (DCaO) was produced at higher temperatures than light burnt CaO (LCaO); therefore, DCaO had less reactivity than LCaO. In a hydration test, DCaO (1500 °C) showed 62 times lower reactivity than LCaO (900 °C), which meant that DCaO would result in the delay of hydration of CaO easily. Additionally, DCaO would cause unsoundness more easily than LCaO when adding the same number of cementitious materials. For this reason, using ASTM C114-18 (Standard Test Methods for Chemical Analysis of Hydraulic Cement) to quantify DCaO content may underestimate DCaO content by up to 20%. Conversely, this method was more suitable for f-CaO since it had high reactivity. Moreover, this study demonstrated that ladle slag would cause unsoundness when added into the cementitious material because it was produced from a higher temperature process (over 1500 °C), which generates the DCaO. Therefore, when reusing ladle slag, the problem of low reactivity of DCaO should be considered.
1. Introduction
Steel slag has high potential for use as a substitute for cement in civil engineering projects such as construction and road-building engineering [1,2,3,4,5]. However, the application of steel slag, especially ladle slag, in engineering has been limited on account of the presence of free CaO (f-CaO) and free MgO (f-MgO). Presence of these results in volume expansion or unsoundness [6,7,8,9] because the water in the cement paste reacts with the f-CaO and f-MgO. After reacting, these then transform into Ca(OH)2 and Mg(OH)2, which lead to popout on the paste surface, potentially reducing the strength of the concrete and compromising the building structure [10,11,12,13,14]. (For example, the volume would expand 89% when f-CaO transforms into Ca(OH)2.) Wang et al. [10] reported free CaO as a significant contributor to the volume expansion of steel slag. At present, one of the methods of assessing unsoundness in cement paste is measuring the content of f-CaO, where f-CaO refers to the unreacted CaO existing in steel slag [15]. However, using the amount of f-CaO as a reference may make it difficult to measure the extent of the soundness in the cement paste accurately. Suito et al. [16] indicated that adding steelmaking slag with 1 wt.% of f-CaO in cement paste would cause unsoundness. On the other hand, previous studies [15,17] indicated that adding fly ash with f-CaO content 0 to 3.25 wt.% in cement would retain its soundness as well. Moreover, some studies even showed f-CaO in fly ash could enhance compressive strength [15,18]. These studies demonstrated opposite results: a higher f-CaO content maintained soundness and increased compressive strength; however, a lower content of f-CaO leads to unsoundness. Little is known about this inconsistency; therefore, it is valuable to explore.
Previous papers [19,20] have reported different perspectives on the expansion of f-CaO and f-MgO. They have indicated that only the overburnt form of f-CaO and f-MgO would lead to volumetric expansion. These types of overburnt CaO and MgO were produced under high sintering temperatures in slag refining and often enclosed within other clinker phases or metal oxide phases in slag. The crystallite size of overburnt CaO and MgO becomes significant. Their reactivity was very low, and the hydration rate was slow under ambient temperature. According to a previous paper [21], there are different grades of calcinated CaO depending on the calcining temperature of calcite (CaCO3). As suggested earlier, one may deduce that different calcination temperatures will yield different grades of CaO and cause different expansion behavior.
This research aims to investigate the effect of the calcination temperatures of CaO on the soundness of cementitious material. With different calcinating temperatures, CaO can be classified into light and dead burnt states. The study will measure the reactivity of DCaO and LCaO to explain why the different sources of f-CaO will cause different hydration behavior.
2. Materials and Methods
2.1. Materials
In this study, two types of CaO (light burnt or dead burnt) were prepared at different calcining temperatures, and the SEM results are shown in Figure 1. Analytical grade LCaO was employed, and DCaO was prepared by calcining the LCaO at 1500 °C in a calcination chamber. All types of CaO were ground beyond 150 μm (No. 100 mesh, USA standard testing sieve). The characteristics of CaO with different levels of calcination and cement paste were determined using mineralogy analysis. Figure 2 shows the XRD pattern of two types of CaO. LCaO and DCaO have the same characteristic peaks with two thetas; however, there is a difference in peak intensity. DCaO had two to three times higher intensity compared with LCaO. Additionally, the ladle slag and fly ash used in this study were from Dragon Steel, Taiwan, and Linkou Thermal Power Plant, Taiwan Power Company, respectively. The chemical compositions of ladle slag and fly ash are shown in Table 1.
2.2. Material Testing and Analyses
In the mineralogy analysis, an X-ray diffractometer (D8 Advance, Bruker, MA, USA) was used to identify the mineralogy phases of CaO and blended cement pastes. Samples were homogenized, ground until they were less than 75 μm (No. 200 mesh, USA standard testing sieve), and pressed into a flat disc. All XRD analyses were carried out with the following parameters: (1) scanning range of 10°–80° (2θ), (2) a step size of 0.03°, and (3) a data collection rate of 2 s per step.
To measure the reactivity of different types of CaO, a hydration test was conducted. The hydration test was carried out by reacting 1 g of different types of calcinated CaO with 50 mL of water at 50 °C. Thermogravimetric analysis was then conducted to measure the amount of CaO transforming into Ca(OH)2 [22].
A thermogravimetric analyzer (DSC-TGA, TA Instrument, Taipei City, Taiwan) was used to investigate the thermal characteristics of the CaO hydration products and blended cement pastes. The samples were first homogenized and ground into a fine powder, 40–50 mg of which was loaded into an alumina crucible for analysis. The furnace temperature was programmed to rise from ambient temperature to 1000 °C by the heating rate of 20 °C/min under an air flow rate of 100 mL/min. A weight loss was observed at approximately 400 °C to 500 °C. This resulted from the evolution of hydroxyl water in this temperature interval, where Ca(OH)2 dehydroxylated. Therefore, the percentage of CaO transformed into Ca(OH)2 can be calculated using the thermogravimetric analyzer and measured based on weight loss changes caused by dihydroxylation [23].
The f-CaO content analysis was determined according to ASTM C114-18 [24]. A complexometric titration method was conducted by adding 1 g of the sample to 60 mL of ethanol-glycerol solution (C5H14O4) and strontium nitrate (Sr(NO3)2) under digestion in a hot water bath for 20 min.
EN-450 [25] regulates that the amount of free lime content shall not be higher than 1% in fly ash or up to 2.5% if autoclave expansion test results are satisfactory. Therefore, in this study, the double standard amount of CaO was added to amplify the different behavior of two different types of CaO. Different types of CaO were employed separately to replace 5 wt.% of Portland cement.
An autoclave expansion test (ASTM C151/C151M [26]) was employed to determine the volumetric stability of the specimens mixed with LCaO, DCaO, and ladle slag, respectively. In this test, the hardened paste specimens were made into a mortar bar (25 × 25 × 285 mm), cured in a moist closet for 24 h, and autoclaved at 2 ± 0.07 MPa for 3 h. Changes in length were recorded afterward.
3. Results and Discussion
3.1. The Reactivity of Calcinated CaO
The reactivity of the calcinated CaO was discussed in this paper to examine the relationships among its physical characteristics, which affect its chemical reactivity. First, a hydration test was used to establish the reactivity of CaO at different calcination temperatures. LCaO and DCaO were assessed in the hydration test under 0.5, 1.5, 3, 5, 15, and 80 min; 5, 15, 30, 40, 60, and 80 min, respectively. The stoichiometric CaO contents calculated from the amount of Ca(OH)2 in the LCaO and DCaO as tested from the thermogravimetric analysis are revealed in Table 2. Figure 3 illustrates the thermogravimetric analysis results showing the percentage of the reacted CaO (wt.%) over time. As shown in Figure 3, the reactivity of LCaO was extremely fast. At 0.5 min, 39.64 wt.% of the CaO had already reacted and transformed into Ca(OH)2; after 0.5 min, the slope was gentler, indicating that the reaction rate had slowed down. The reacted CaO remained constant between 5 and 80 min, corresponding to 70 wt.% of CaO reacted. The reaction rate of DCaO was much slower than that of the LCaO, with the amount of CaO constantly increasing from 0 to 40 min. The reaction rate remained constant when the reaction time was 40 min or above. In the case of the DCaO, only 50 wt.% of the CaO was reacted. In addition, it was discovered that the fitted regression line was close to a first-order reaction. Figure 3 illustrates that the initial hydration rate of the LCaO and DCaO by fitting into the first-order reaction, and the rate constant (k) of the LCaO and DCaO was 2.49 and 0.04, respectively (The rate constant of the LCaO was approximately 62 times greater than that of the DCaO).
Moreover, the grain sizes of LCaO and DCaO are 87.19 nm and 103.93 nm, respectively. A previous study stated that the reactivity of CaO would decrease with the increase in crystallite size and the decrease in the specific surface area when the calcination temperature is increased [27]. Berent et al. [28] indicated that the crystallite size and the crystallinity of the final product would increase with the calcination temperature. Mohamad et al. [29] also reported the same result: a high calcination temperature made a bigger crystallite size. Wang et al. [10] indicated that due to the high calcining temperature, the structure of free CaO became denser and decreased the hydration reactivity for free CaO. Therefore, the calcination temperature might significantly affect the CaO reactivity required to transform into Ca(OH)2. Another paper [21] mentioned that, for CaO, the apparent density increased, and the porosity decreased with the increasing calcination temperature of CaO, hence leading to a decrease in the reaction interface area and low hydration reactivity. To summarize, DCaO has a lower reactivity than LCaO due to the high calcination temperature.
3.2. Different Types of Calcination CaO on Volume Stability
The f-CaO (unreacted CaO) content was one of the indexes used to evaluate whether the cementitious material was stable. However, past findings have concluded that f-CaO content might not be a reliable index. Based on the mentioned results, the stability might be related to the calcination temperature. To determine whether the CaO calcination temperature is also a factor of soundness, CaO was calcinated under two different temperatures, one was 900 °C (LCaO), and the other was 1500 °C (DCaO); and two kinds of CaO were added 5 wt.% to OPC (in this study, OPC-LCaO, OPC-DCaO). The f-CaO content was tested according to the standard ASTM C114-18 [24] method. The results are shown in Table 3. The average f-CaO content of OPC, LCaO, and DCaO was 1.36 wt.%, 6.33 wt.%, and 5.29 wt.%, respectively. After subtracting the background f-CaO content in control, the f-CaO content in the light and dead burnt state was 4.97 and 3.93 wt.%, respectively. As 5 wt.% of LCaO and DCaO were added, the proportion of the not-detected f-CaO in the f-CaO content test was 0.03 wt.% and 1.07 wt.%, respectively. The recovery rate of LCaO and DCaO was 101% and 80%.
Table 4 demonstrates the change in the length of the OPC-LCaO and OPC-DCaO paste bar before and after the autoclave expansion test, in which the pure cement paste bar was taken as the control. The result revealed that the pure cement paste bar and OPC-LCaO were stable (0.8%) after autoclaving, and the increased length was 0.11 and 0.07, respectively. However, OPC-DCaO was severely cracked and unmeasurable. The result disclosed that high f-CaO was detected in the OPC-LCaO, but it maintained stability. Nevertheless, lower f-CaO was detected in the OPC-DCaO, which suffered cracks. It can be seen in Table 4 that most of the LCaO were converted into Ca(OH)2, while DCaO was only partly converted. Since most of the CaO in OPC-LCaO was converted into Ca(OH)2 before the autoclave expansion test, Ca(OH)2 did not increase much after the test. Therefore, it remained stable. Additionally, CaO in the OPC-DCaO was partially converted to Ca(OH)2 before the autoclave expansion test because of its low reactivity. On that account, after the autoclave expansion test, CaO was converted into Ca(OH)2, so the amount of Ca(OH)2 increased significantly, ultimately resulting in unsoundness. The f-CaO content test only measured the amount of CaO that could quickly take part in the hydration reaction. In other words, it only revealed the CaO with relatively high reactivity. The CaO with lower reactivity that did not contribute to the reaction was the undetected CaO. This result demonstrates that the amount of f-CaO might not be the only factor in volume stability. The type of f-CaO was also one of the factors that would lead to soundness problems, which was similar to the results in the literature. A previous study [15] illustrated that fly ash, a by-product from the coal combustion process, containing around 1.98 wt.% of f-CaO could maintain its soundness. On the other hand, another study [16] on this topic indicated that if basic-oxygen-furnace slag (BOFS) contains about 1 wt.% of free lime, it disintegrates. These two studies also displayed that f-CaO content should not be the only standard of volume stability. In general, the temperature of steelmaking is higher than coal combustion. Therefore, the reactivity of f-CaO resulting from BOFS and fly ash might be different and leads to different autoclave expansion test results. These two studies’ results are similar to those in Table 4: CaO produced under high temperature quickly causes unsoundness problems, and the volumetric stability is also related to the type of f-CaO.
An analysis of the mineralogy phase and the TG-DSC analysis of OPC-LCaO and OPC-DCaO before and after the autoclave expansion test were carried out to investigate the differences that lead to unsoundness. Figure 4 shows the XRD patterns of OPC, OPC-LCaO, and OPC-DCaO before autoclaving. The main discrepancy between OPC-LCaO and OPC-DCaO in the mineralogy analysis were listed as follows: (1) Before the autoclave expansion test, the XRD pattern of OPC-DCaO revealed a prominent CaO peak, although the phenomena were only slightly observed in the OPC-LCaO and OPC phases. (2) After the autoclave expansion test, the CaO peak disappeared in the OPC-DCaO, and the intensity of the Ca(OH)2 peak increased significantly. This result was attributed to the lower reactivity of the DCaO. Only part of the DCaO in the cement paste participated in the hydration reaction and hence contributed to an increase in Ca(OH)2 before the autoclave expansion test. In the case of OPC-LCaO, the peak of CaO was hardly observed. This was because most LCaO had taken part in cement hydration due to its high reactivity before the autoclave expansion test. The autoclaving process accelerated the hydration process under high temperature and high-pressure curing. In the XRD pattern of the OPC after autoclaving, there was an increase in the intensity of the Ca(OH)2 peak. It was found that the OPC-LCaO was sound and continued to be almost the same after autoclaving, despite the slight increase in the intensity of the Ca(OH)2. The reason for the slight increase in Ca(OH)2 might be the amount of LCaO (a small portion), which did not take part in the hydration previously. As for the cement paste with DCaO, which showed the result of unsoundness, there was a significant increase in the intensity of the Ca(OH)2 peak. The phenomena were led by the delay of DCaO hydration and thus caused volumetric expansion.
Two common theories might explain the expansion mechanism of CaO as follows: (1) crystal growth pressure due to the growth of Ca(OH)2, and (2) swelling pressure due to water absorption by tiny crystals of Ca(OH)2 [30,31]. In hardened cement, the increase in volume causes internal stresses, leading to severe damage and unsoundness if they exceed the structure’s tensile strength. The increase in Ca(OH)2 was further verified by using thermogravimetric analysis. Table 4 shows the Ca(OH)2 content changes before and after the autoclave expansion test of the OPC, OPC-LCaO, and OPC-DCaO. In the case of OPC-LCaO, the change of Ca(OH)2 content before and after autoclaving was approximately 3.33 wt.%, which was similar to the OPC. This result indicated that the added LCaO was almost completely hydrated during cement hydration before autoclaving. In the case of OPC-DCaO, the change of Ca(OH)2 content was 6.87 wt.%, indicating a significant increase in Ca(OH)2. This implied that DCaO was still present before autoclaving and was hydrated during autoclaving, which may be due to the low reactivity of the DCaO and resulted in unsoundness in the hardened cement.
3.3. Stability of Using Ladle Slag and Fly Ash
The results presented that f-CaO produced from the steelmaking process may be like DCaO since the steelmaking process is undertaken at approximately 1600 °C. Therefore, the reactivity of f-CaO resulting from the steelmaking process became slower. On the other hand, f-CaO in the fly ash may be similar to LCaO. In this section, the ladle slag from an electric arc furnace and fly ash were blended into the cement, sequentially, and compared with the result from the previous one. Figure 5 reveals the XRD pattern of ladle slag and fly ash. A sharp crystal phase of Ca(OH)2 and Mg(OH)2 can be found in the ladle slag, indicating that part of the CaO and MgO had been hydrated, and some CaO could still be found. Considering that the steelmaking temperature is about 1600 °C, we deduce that CaO in the ladle slag is among DCaO. Figure 5 illustrates that the main crystalline phases in fly ash were gismondine, quartz, and mullite. Halder et al. [32] also reported a similar result. They indicated that although there were f-CaO crystalline phases in fly ash, the intensity of the f-CaO peak was hardly observed due to the small amount.
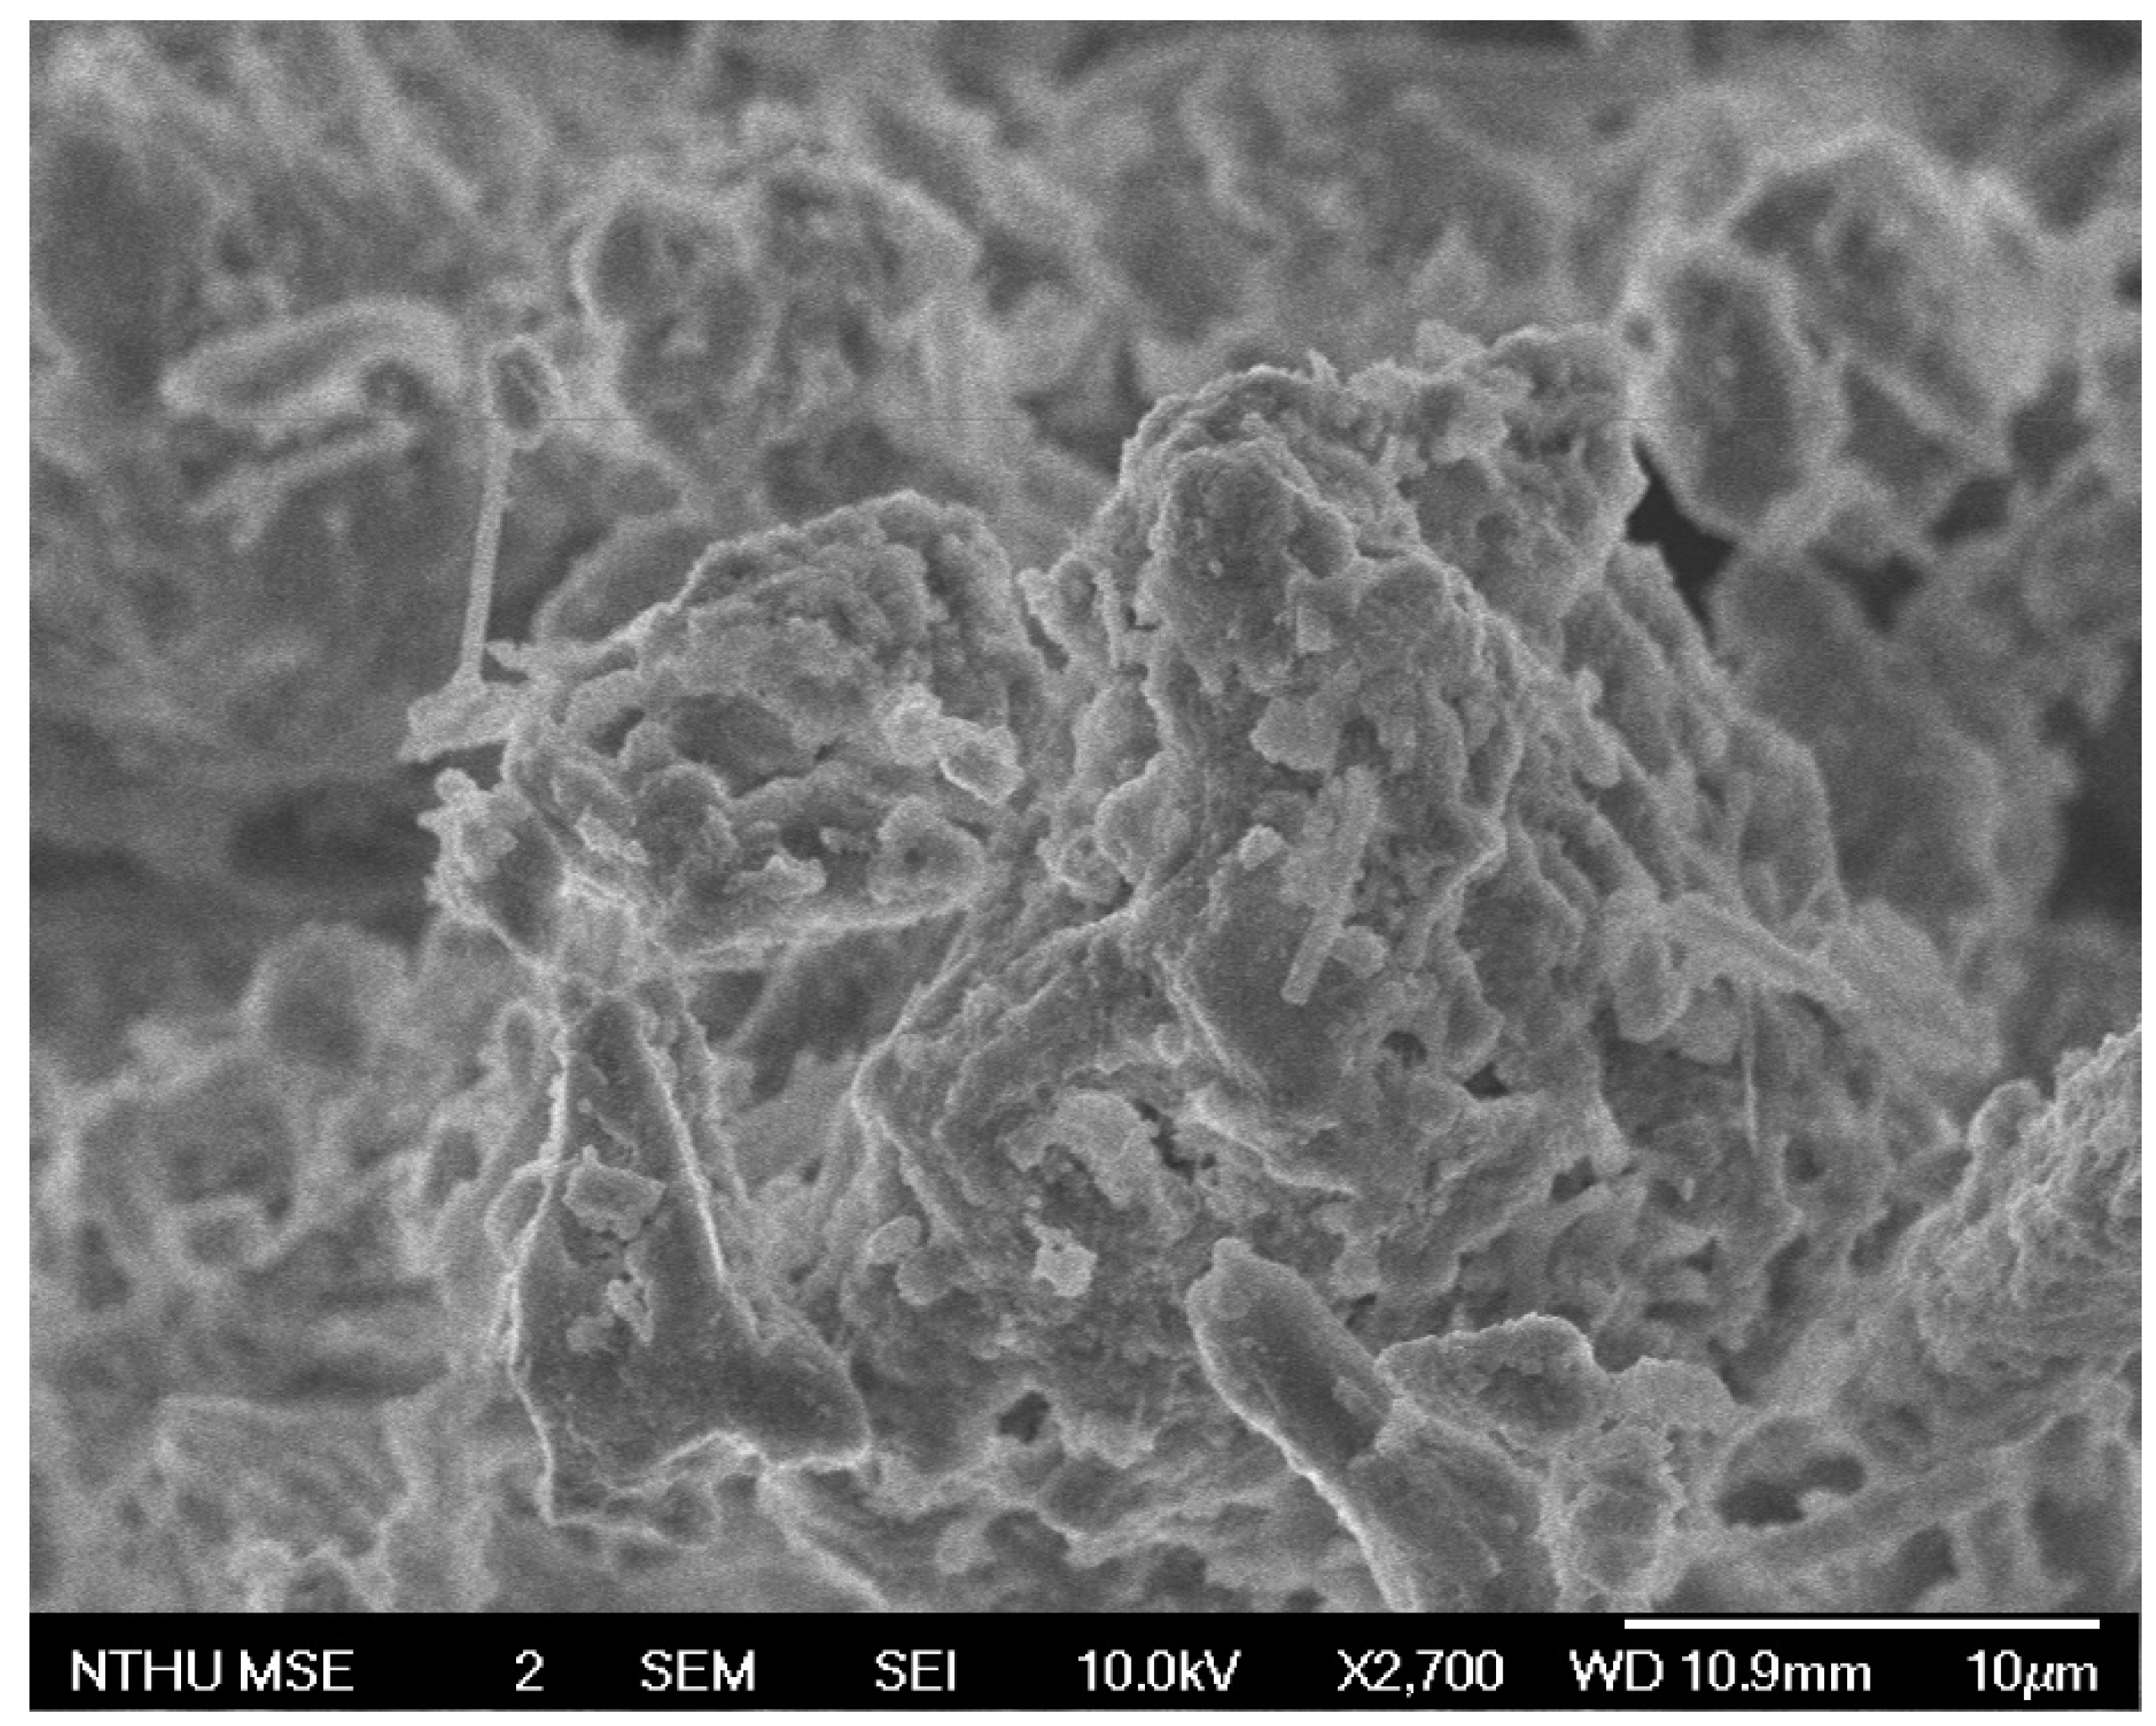
In order to compare different hydration behaviors between different sources of CaO, a paste bar was made, and the autoclave expansion test (ASTM C151/C151M) was applied. In the case of adding ladle slag, a paste bar (25 × 25 × 285 mm) was made of a cement paste with a 20 wt.% replacement of ladle slag (in this research, OPLS). In the case of adding fly ash, a paste bar was made of a cement paste with a 35 wt.% replacement of fly ash (in this research, OPFA). The f-CaO content in OPLS was 1.36 wt.%, and f-CaO content in OPFA was 1.41 wt.%. Figure 6 illustrates OPLS expanded and cracked results after the autoclave expansion test, indicating the ladle slag was an unsound cementitious material. Conversely, OPFA remained sound. The result matched with the previous studies [15,16,17,18], which revealed that ladle slag would cause unsoundness more easily than fly ash with the same f-CaO content. Figure 7 shows an XRD pattern of the paste bar before and after the autoclave expansion test, and Figure 8 illustrates an SEM of the paste with ladle slag. In the OPLS case, the CaO peak was found before the autoclave expansion test, but the CaO had vanished after the autoclave expansion test. At the same time, the intensity of the Ca(OH)2 peak increased after the autoclave expansion test. This might be caused by the f-CaO converting into Ca(OH)2 during the autoclave expansion test; therefore, Ca(OH)2 increased. When CaO converted into Ca(OH)2, the volume expanded and caused the problem of unsoundness; in the case of OPFA, there was no CaO found before or after the autoclaving test. By applying the thermogravimetric analysis, one can also observe that there was 12.58 wt.% of Ca(OH)2 before the autoclave expansion test, and the amount of Ca(OH)2 rose to 23.05 wt.% after the autoclave expansion test in the OPLS, as shown in Table 5; thus, there was a more significant amount of Ca(OH)2 produced during the autoclave expansion test which consequently caused unsoundness. The result matched the previous experiment data; that is, high calcination temperature would delay the hydration reaction of CaO and easily cause cracking.
On the other hand, in the case of OPFA, the change to the Ca(OH)2 content was unobvious. Which meant f-CaO in the fly ash had high reactivity, and it would thoroughly hydrate before the autoclave expansion test and maintain soundness. Wang et al. [33] also demonstrated the same result. Some papers showed that adding steelmaking slag with 1–2 wt.% f-CaO content would cause volume instability [16,33]. Conversely, another study demonstrated that fly ash with 1.98 wt.% of f-CaO when added to cement maintained soundness [15]. From the experiment data discussed and some previous studies, one can deduce that the content of f-CaO might not be the only factor affecting volume stability; different calcination temperatures yield different grades of CaO and cause different expansion behavior. Through the findings on the results presented, f-CaO resulting from the steelmaking process may be similar to that obtained using DCaO for the steelmaking process, as this is a high-temperature process. Therefore, the reactivity of f-CaO in ladle slag may be lower. The results indicated that ladle slag might potentially lead to volumetric expansion in cementitious materials.
4. Conclusions
It may be stated from the above results that different calcination temperatures and sources of CaO affect soundness; thus, free-CaO (f-CaO) is the major obstacle to reusing ladle slag. Therefore, understanding the hydration behavior of f-CaO in the ladle slag is the main issue with the recovery of ladle slag.
The key results can be summarized as follows:
- Ladle slag resulting from a high-temperature process might contain dead burnt CaO (DCaO). The presence of DCaO is the reason that re-using ladle slag causes unsoundness.
- Calcination temperatures may lead to different reactivity of CaO. DCaO (1500 °C) reaction rate is 62 times smaller than light burnt CaO (900 °C). In other words, DCaO would take a longer time to react and is more difficult to hydrate.
- CaO produced under high temperature quickly causes unsoundness problems, and volumetric stability is also related to the type of f-CaO.
- Using ASTM C114-18 [24] to evaluate f-CaO content might lead to underestimating up to 20% of DCaO compared to the actual quantity for its low hydration reactivity. On the other hand, evaluating LCaO content would not lead to this problem since it has high hydration reactivity. Therefore, ASTM C114-18 [24] might not be suitable for testing the DCaO content.
- The presence of f-CaO leads to the unsoundness of ladle slag. Therefore, understanding the discrepancy of f-CaO may be the key to the recovery of ladle slag.
- Since the f-CaO content in ladle slag is mainly DCaO with low reactivity, it is hard to quantify and has a high potential to delay hydration and cause expansion. On that account, there is room for further investigation on the method of detecting the quantity of DCaO and enhancing DCaO reactivity in order to reuse ladle slag as a cementitious material.
- The expansion problem could not be judged directly based on the content of ladle slag. It should be based on the content of free CaO and MgO, and the content of free CaO and MgO should be below 2.5% and 1%, respectively.
Author Contributions
Conceptualization, T.-H.L. and Y.-L.C.; methodology, T.-H.L., Y.-L.C. and J.-E.C.; validation, T.-H.L., Y.-L.C. and H.-P.W.; formal analysis, T.-H.L.; investigation, T.-H.L.; data curation, Y.-L.C. and H.-P.W.; writing—original draft preparation, T.-H.L.; writing—review and editing, T.-H.L.; visualization, T.-H.L.; supervision, J.-E.C.; project administration, T.-H.L. All authors have read and agreed to the published version of the manuscript.
Funding
This research was funded by the Ministry of Science and Technology, grant number 107-2221-E-006-010.
Institutional Review Board Statement
Not applicable.
Informed Consent Statement
Not applicable.
Data Availability Statement
Not applicable.
Acknowledgments
The authors gratefully acknowledge the help of the laboratory and the Ministry of Science and Technology, Taiwan for its financial support of this study (contract number: 107-2221-E-006-010).
Conflicts of Interest
The authors declare no conflict of interest.
References
- Neville, A.M.; Brooks, J.J. Concrete Technology; Longman Scientific & Technical: London, UK, 1987. [Google Scholar]
- Neville, A.M. Properties of Concrete; Longman: London, UK, 1995. [Google Scholar]
- Geiseler, J. Slag-approved materials for a better future. In Proceedings of the International Symposium on the Utilization of Metallurgical Slag (ISUS 99), Beijing, China, 16–19 November 1999. [Google Scholar]
- Alizadeh, R.; Chini, M.; Ghods, P.; Hoseini, M.; Montazer, S.; Shekarchi, M. Utilization of Electric Arc Furnace Slag as Aggregates in Concrete—Environmental Issue. In Proceedings of the 6th CANMET/ACI International Conference on Recent Advances in Concrete Technology, Bucharest, Romania, June 2003; Volume 1, pp. 451–464. [Google Scholar]
- Papayianni, I.; Anastasiou, E. Production of high-strength concrete using high volume of industrial by-products. Constr. Build. Mater. 2010, 24, 1412–1417. [Google Scholar] [CrossRef]
- Shi, C.; Day, R.L. Early strength development and hydration of alkali-activated blast furnace slag/fly ash blends. Adv. Cem. Res. 1999, 11, 189–196. [Google Scholar] [CrossRef]
- Sun, S. Investigations on steel slag cements. In Collections of Achievements on the Treatment and Applications of Metallurgical Industrial Wastes; Chinese Metallurgical Industry Press: Beijing, China, 1983; pp. 1–71. [Google Scholar]
- Tang, M. An Investigation on Mineral Composition of Steel Slag for Cement Production; Research Report; Nanjing Institute of Chemical Technology: Nanjing, China, 1973. [Google Scholar]
- Emery, J.J. Slag utilization in pavement construction. In Extending Aggregate Resources; ASTM International: West Conshohocken, PA, USA, 1982. [Google Scholar]
- Wang, G.; Wang, Y.; Gao, Z. Use of steel slag as a granular material: Volume expansion prediction and usability criteria. J. Hazard. Mater. 2010, 184, 555–560. [Google Scholar] [CrossRef] [PubMed]
- Mozt, H.; Geiseler, J. Products of steel slags. In Proceedings of the International Conference on the Science and Engineering of Recycling for Environmental Protection, WASCON 2000, Harrogate, UK, 31 May–2 June 2000; pp. 207–220. [Google Scholar]
- Rojas, M.F.; Sánchez De Rojas, M.I. Chemical assessment of the electric arc furnace slag as construction material: Expansive compounds. Cem. Concr. Res. 2004, 34, 1881–1888. [Google Scholar] [CrossRef]
- Pellegrino, C.; Gaddo, V. Mechanical and durability characteristics of concrete containing EAF slag as aggregate. Cem. Concr. Compos. 2009, 31, 663–671. [Google Scholar] [CrossRef]
- Gieseler, J.; Schlosser, R. Investigation concerning the structure and properties of steel slags. In Proceedings of the 3rd International Conference on Molten Slags and Fluxes, Glasgow, Scotland, 27–29 June 1988. [Google Scholar]
- Kaewmanee, K.; Krammart, P.; Sumranwanich, T.; Choktaweekarn, P.; Tangtermsirikul, S. Effect of free lime content on properties of cement-fly ash mixtures. Constr. Build. Mater. 2013, 38, 829–836. [Google Scholar] [CrossRef]
- Suito, H.; Yokomaku, T.; Hayashida, Y.; Takahashi, Y. Effect of free lime on disintegration of LD slags. Tetsu-to-Hagané 1977, 63, 2316–2325. [Google Scholar] [CrossRef] [Green Version]
- Nawaz, A.; Julnipitawong, P.; Krammart, P.; Tangtermsirikul, S. Effect and limitation of free lime content in cement-fly ash mixtures. Constr. Build. Mater. 2016, 102, 515–530. [Google Scholar] [CrossRef]
- Tsimas, S.; Moutsatsou-Tsima, A. High-calcium fly ash as the fourth constituent in concrete: Problems, solutions and perspectives. Cem. Concr. Compos. 2005, 27, 231–237. [Google Scholar] [CrossRef]
- Hassibi, M. An Overview of Lime Slaking and Factors that Affect the Process. In Proceedings of the 3rd International Sorbalit Symposium, New Orleans, LA, USA, 3–5 November 1999; pp. 2–20. [Google Scholar]
- Gao, P.W.; Xu, S.Y.; Chen, X.; Li, J.; Lu, X.L. Research on autogenous volume deformation of concrete with MgO. Constr. Build. Mater. 2013, 40, 998–1001. [Google Scholar] [CrossRef]
- Boynton, R.S. Chemistry and Technology of Lime and Limestone; Wiley: New York, NY, USA, 1980. [Google Scholar]
- Boldyrev, V.V. Reactivity of solids: Past, present and future. J. Therm. Anal. 1993, 40, 1041–1062. [Google Scholar] [CrossRef]
- Kneller, W.A.; Gupta, J.; Borkowski, M.L.; Dollimore, D. Determination of original free lime content of weathered iron and steel slags by thermogravimetric analysis. Transp. Res. Rec. 1994, 1434. Available online: https://trid.trb.org/view/409659 (accessed on 1 November 2021).
- ASTM International. C114-18 Standard Test Methods for Chemical Analysis of Hydraulic Cement; ASTM International: West Conshohocken, PA, USA, 2018. [Google Scholar]
- European Standard. EN 450 Fly Ash for Concrete—Definitions, Requirement and Quality Control; European Standard: Brussels, Belgium, 1994. [Google Scholar]
- ASTM International. C151/C151M-18 Standard Test Method for Autoclave Expansion of Hydraulic Cement; ASTM International: West Conshohocken, PA, USA, 2018. [Google Scholar]
- Wang, X.Y.; Xue, Z.L.; Li, J.L. Investigation of the reactivity and grain size of lime calcined at extra-high temperatures by flash heating. J. South. African Inst. Min. Metall. 2016, 116, 1159–1164. [Google Scholar] [CrossRef] [Green Version]
- Berent, K.; Komarek, S.; Lach, R.; Pyda, W. The Effect of Calcination Temperature on the Structure and Performance of Nanocrystalline Mayenite Powders. Materials 2019, 12, 3476. [Google Scholar] [CrossRef] [PubMed] [Green Version]
- Mohamad, S.F.S.; Mohamad, S.; Jemaat, Z. Study of calcination condition on decomposition of calcium carbonate in waste cockle shell to calcium oxide using thermal gravimetric analysis. ARPN J. Eng. Appl. Sci. 2016, 11, 9917–9921. [Google Scholar]
- Mu, S.B.; Sun, Z.Y.; Su, X.P. A study on the microstructure and expanding mechanism of highly free-calcium oxide cements. J Wuhan Univ. Technol. 2001, 23, 27–30. [Google Scholar]
- Deng, M.; Hong, D.; Lan, X.; Tang, M. Mechanism of expansion in hardened cement pastes with hard-burnt free lime. Cem. Concr. Res. 1995, 25, 440–448. [Google Scholar] [CrossRef]
- Halder, B.; Tandon, V.; Tarquin, A.; Ramana, C. Influence of coal fly ash on mechanical properties of mortar consisting of total dissolved solids. In Proceedings of the World of Coal Ash Conference, Lexington, KY, USA, 21–24 October 2009; pp. 22–25. [Google Scholar]
- Wang, Q.; Wang, D.; Zhuang, S. The soundness of steel slag with different free CaO and MgO contents. Constr. Build. Mater. 2017, 151, 138–146. [Google Scholar] [CrossRef]
Figure 1.
SEM results of light-burnt CaO and dead-brunt CaO.

Figure 2.
XRD pattern of light-burnt CaO and dead-burnt CaO.
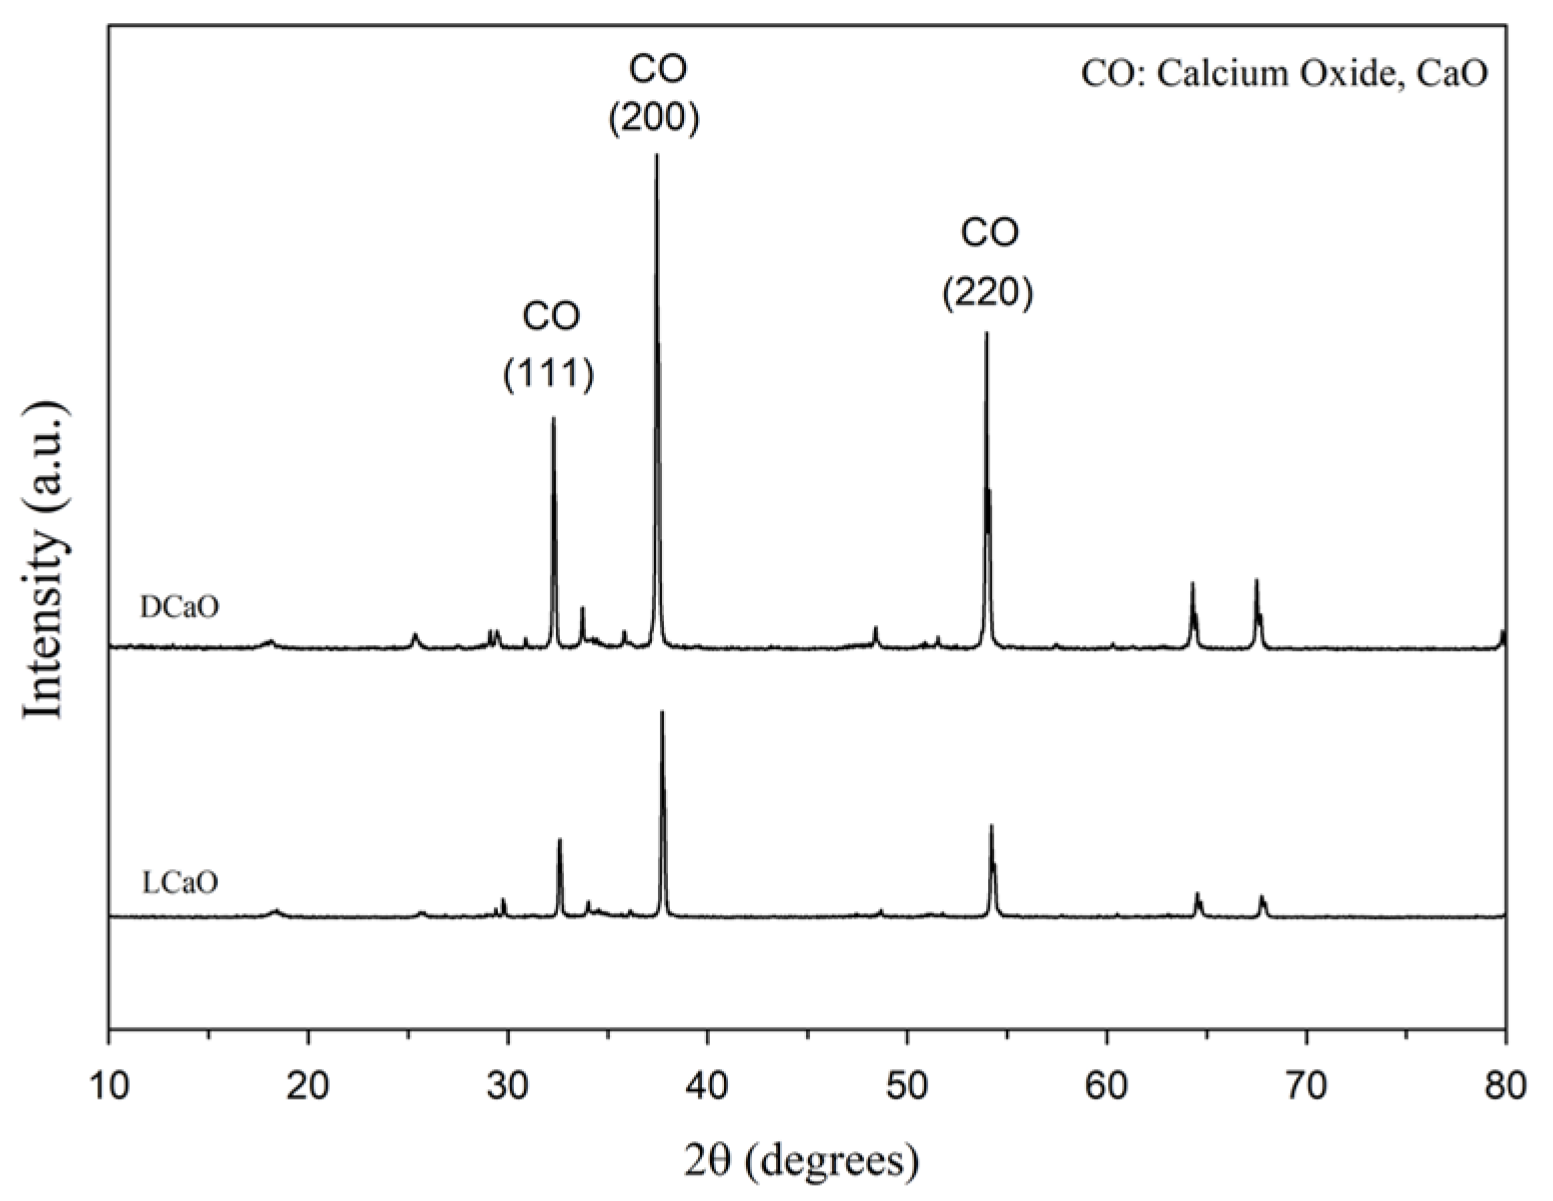
Figure 3.
Effect of different calcinated temperature CaO on the hydration reaction curve.
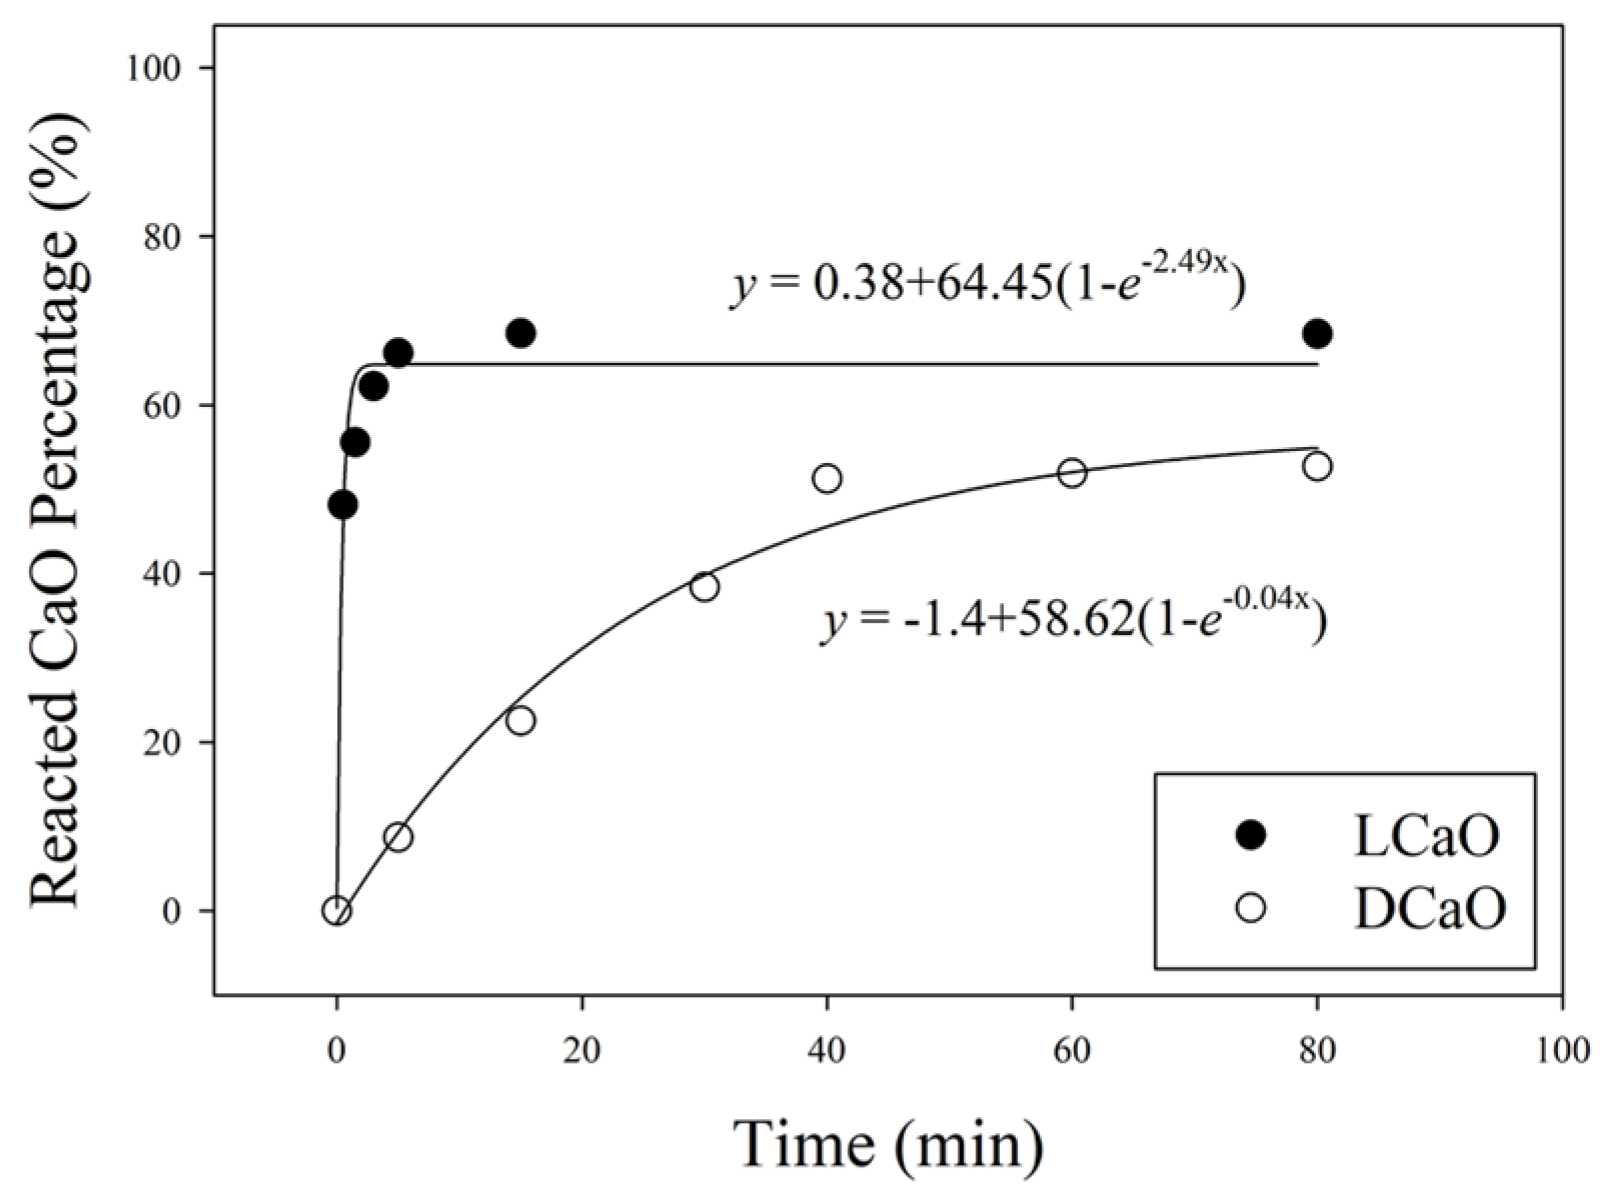
Figure 4.
XRD patterns of OPC, OPC-LCaO and OPC-DCaO (a) before and (b) after the autoclave expansion test.
Figure 4.
XRD patterns of OPC, OPC-LCaO and OPC-DCaO (a) before and (b) after the autoclave expansion test.
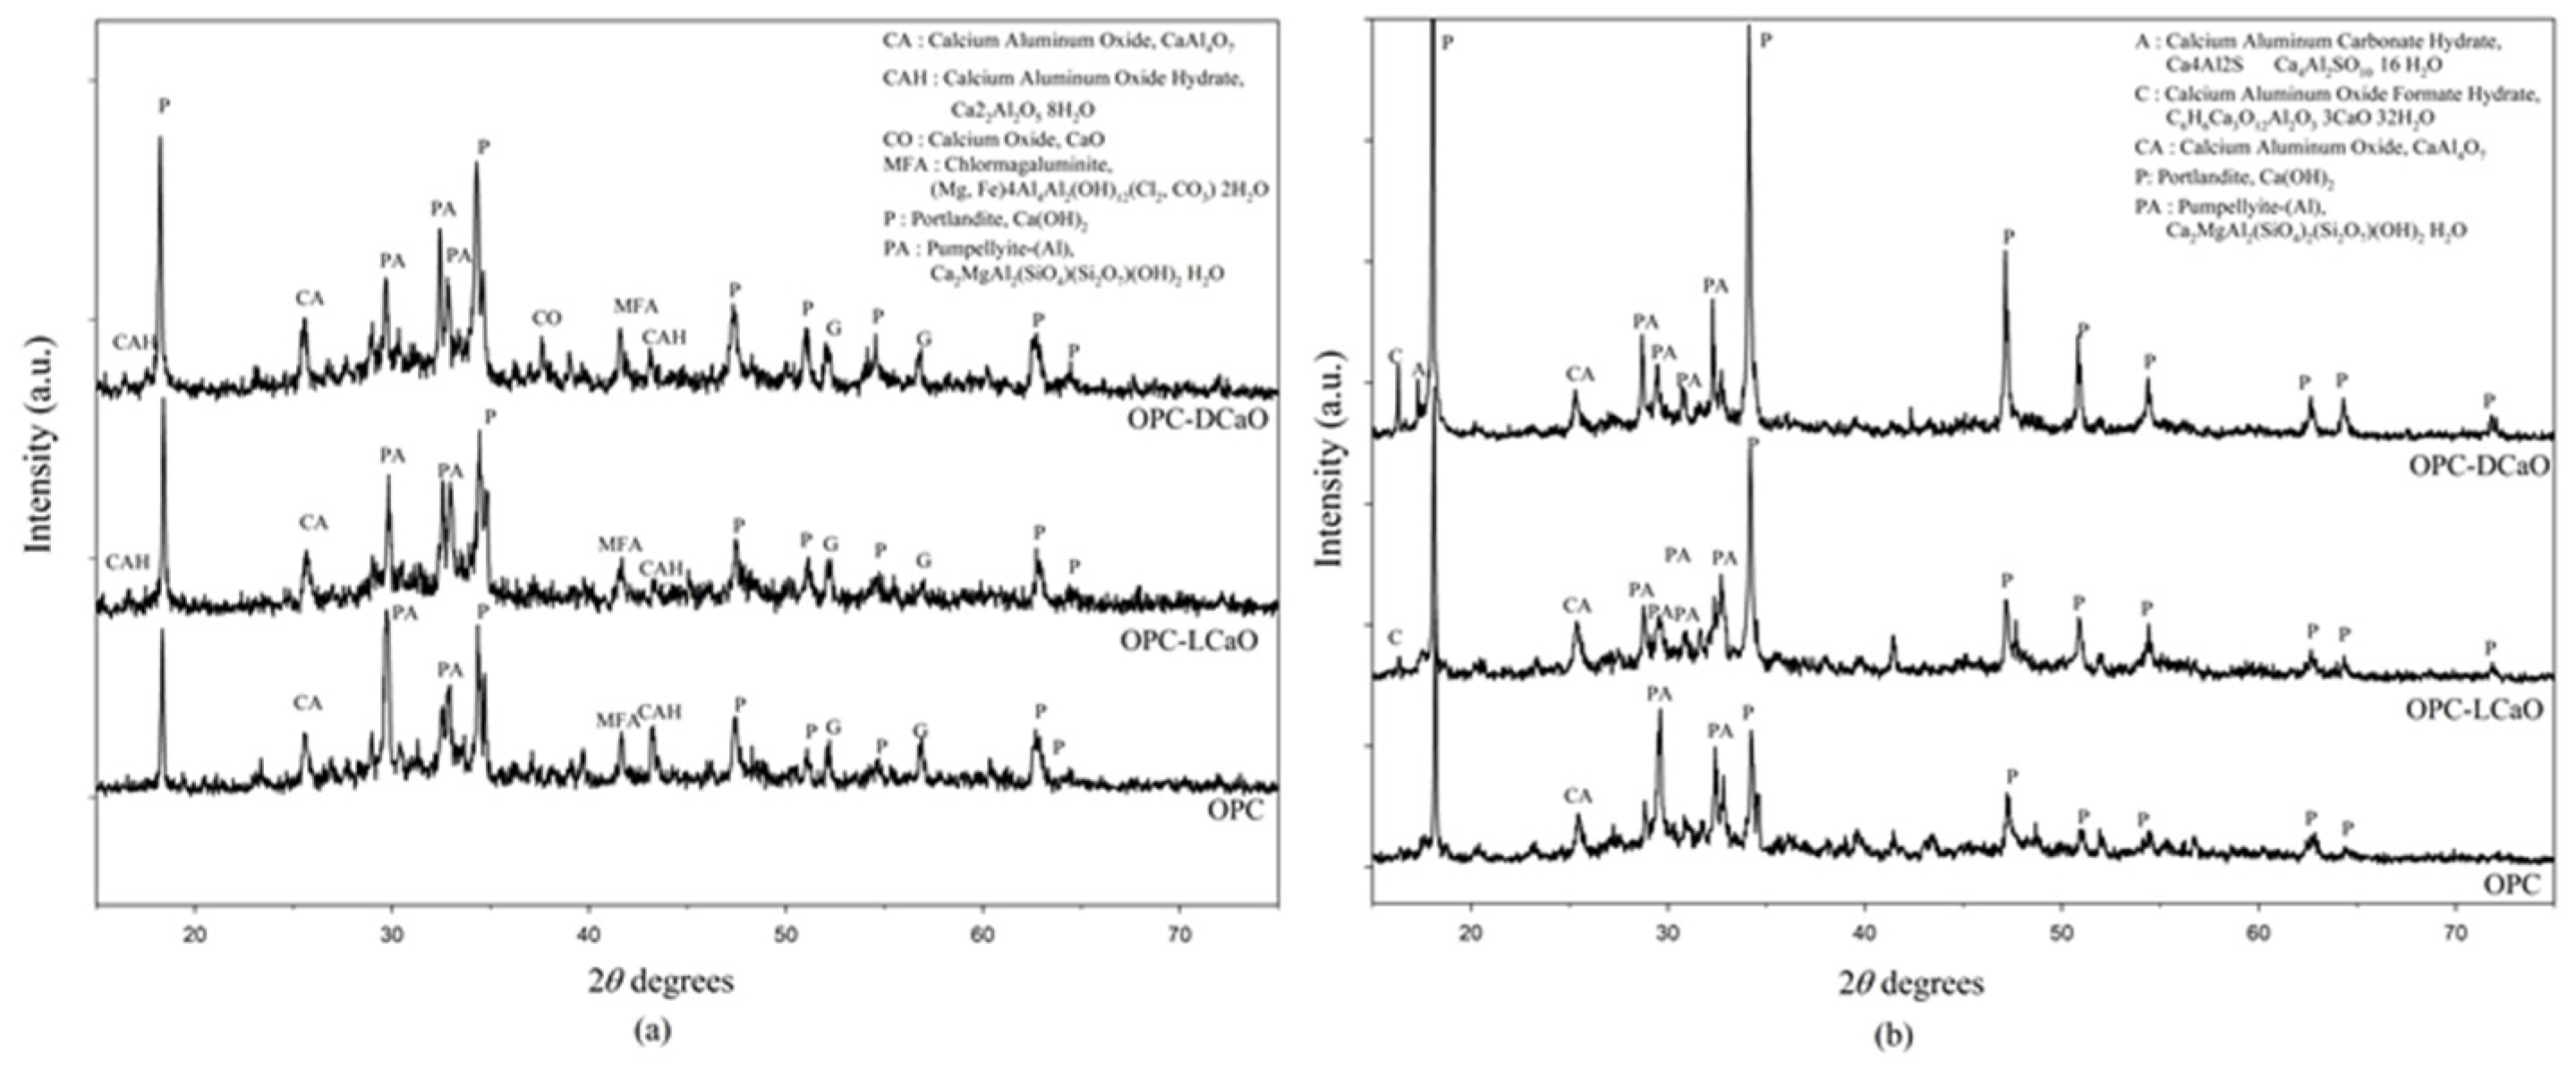
Figure 5.
XRD pattern of (a) ladle slag and (b) fly ash.

Figure 6.
Cement pastes with ladle slag and with fly ash before and after the autoclave expansion test.
Figure 6.
Cement pastes with ladle slag and with fly ash before and after the autoclave expansion test.
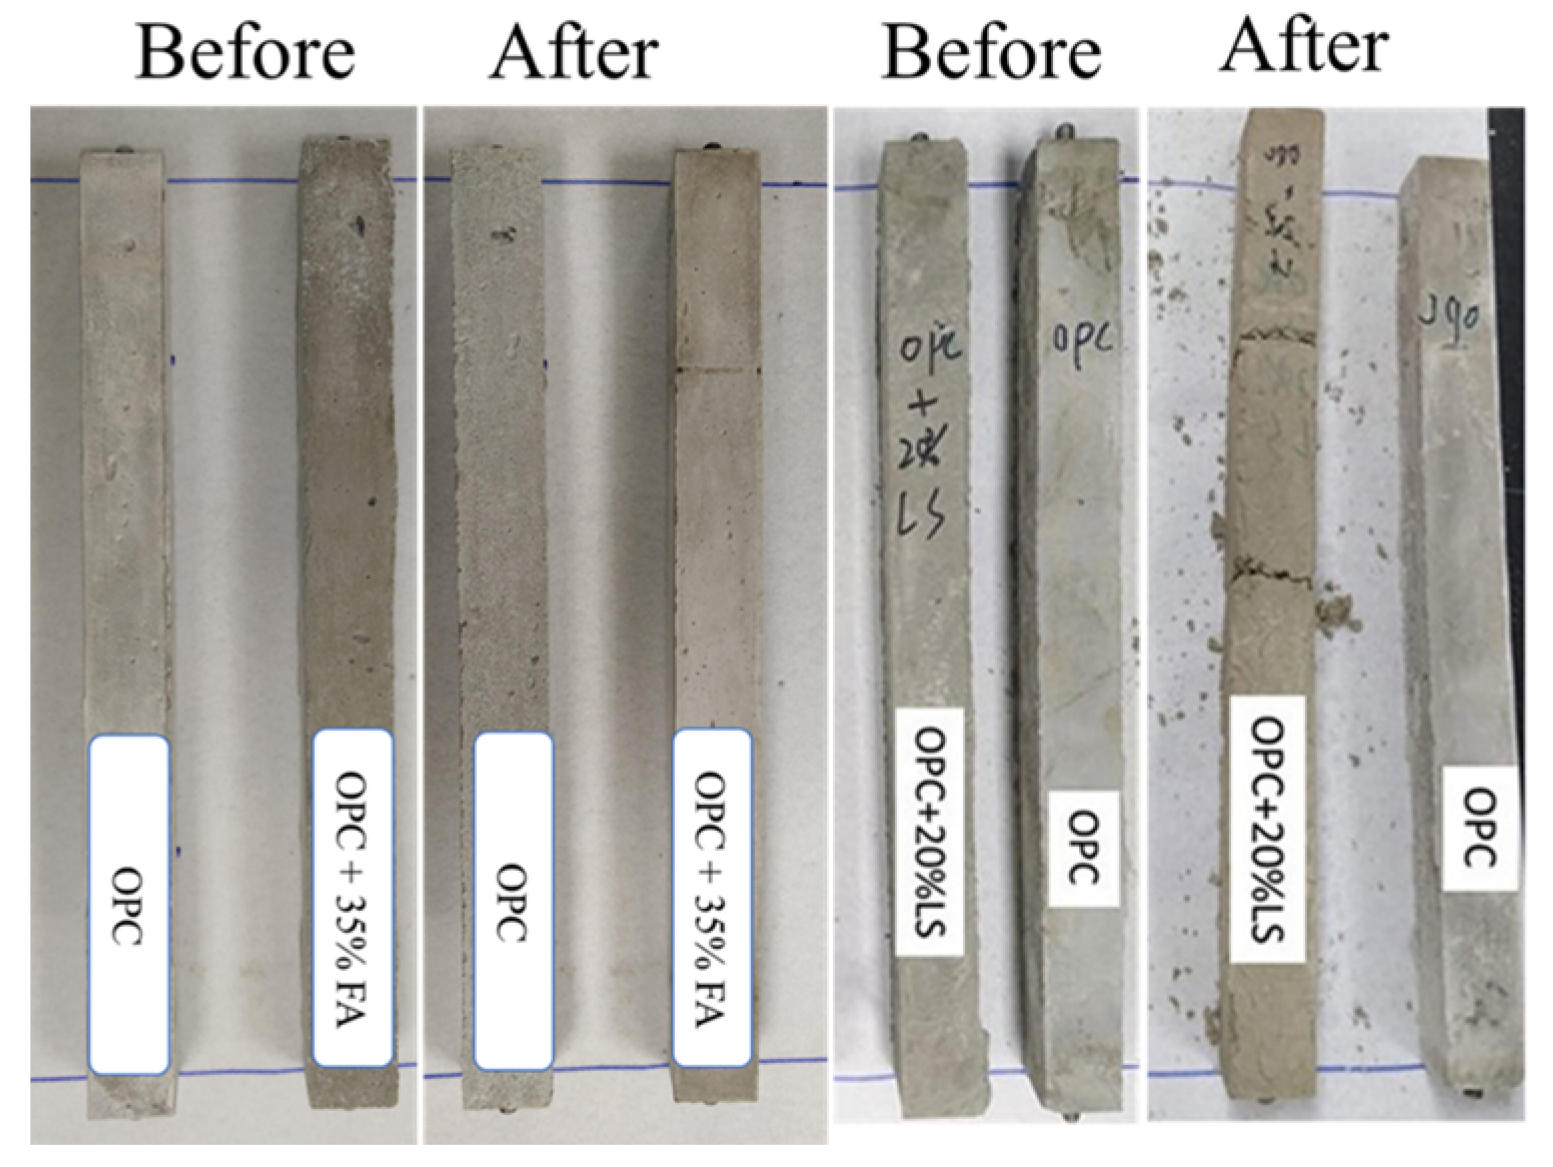
Figure 7.
XRD patterns of cement paste with (a) ladle slag and (b) fly ash before and after the autoclave expansion test.
Figure 7.
XRD patterns of cement paste with (a) ladle slag and (b) fly ash before and after the autoclave expansion test.

Figure 8.
SEM of paste with ladle slag.

Table 1.
Chemical compositions of ladle slag and fly ash.
| Ladle Slag | Fly Ash | ||||
|---|---|---|---|---|---|
| Elements (wt.%) | Ca | 29.25 | Elements (wt.%) | Ca | 14.94 |
| Al | 2.24 | Si | 17.82 | ||
| Mg | 9.93 | Al | 8.11 | ||
| Fe | 2.83 | Mg | 1.38 | ||
| Si | 4.77 | Fe | 4.23 | ||
| Heavy Metals (mg/kg) | Mn | 7435 | Na | 0.52 | |
| K | 0.62 | ||||
| Heavy Metals (mg/kg) | Mn | 406 | |||
| Pb | 123 | ||||
| Cu | 56 | ||||
| As | 500 | ||||
| Ti | 3633 | ||||
| Ba | 673 | ||||
Table 2.
Hydration test of different calcinated temperature CaO.
| LCaO | DCaO | ||||
|---|---|---|---|---|---|
| Time (min) | Ca(OH)2 (wt.%) | CaO (wt.%) | Time (min) | Ca(OH)2 (wt.%) | CaO (wt.%) |
| 0.5 | 52.38 | 39.64 | 5 | 10.44 | 7.90 |
| 1.5 | 59.04 | 44.68 | 15 | 25.94 | 19.63 |
| 3 | 64.63 | 48.91 | 30 | 41.65 | 31.51 |
| 5 | 68.00 | 51.46 | 40 | 53.24 | 40.29 |
| 15 | 70.09 | 53.04 | 60 | 53.61 | 40.57 |
| 80 | 70.34 | 53.23 | 80 | 54.5 | 41.13 |
Table 3.
Effect of different types of calcination CaO on measured f-CaO content (under ASTM C114-18).
Table 3.
Effect of different types of calcination CaO on measured f-CaO content (under ASTM C114-18).
| Type of Calcination CaO | f-CaO in OPC(wt.%) | Measured f-CaO(wt.%) | Recovery Percentage |
|---|---|---|---|
| OPC-LCaO | 1.63 ± 0.03 | 6.63 ± 0.02 | 101% |
| OPC-DCaO | 1.63 ± 0.03 | 5.29 ± 0.02 | 80% |
OPC: ordinary Portland cement; Recovery rate: (f-CaOMeasured − 0.95*f-CaOOPC)/CaO added quantity; CaO added quantity = 5%.
Table 4.
Ca(OH)2 content (%) before and after autoclaving related to volume stability with different types of calcination CaO.
Table 4.
Ca(OH)2 content (%) before and after autoclaving related to volume stability with different types of calcination CaO.
| Specimen | Length Change (%) | Volume Stability 1 | Ca(OH)2 Content (%) | |
|---|---|---|---|---|
| Before Autoclaving | After Autoclaving | |||
| OPC | 0.10 ± 0.003 | Sound | 10.77 ± 1.03 | 14.06 ± 2.1 |
| OPC-LCaO | 0.17 ± 0.005 | Sound | 14.1 ± 1.33 | 18.43 ± 1.88 |
| OPC-DCaO | Crack | Unsound | 13.36 ± 1.27 | 20.23 ± 2.03 |
1 Sound: ≤0.80%; unsound: >0.80%.
Table 5.
Ca(OH)2 content (%) before and after autoclaving related to volume stability with ladle slag and fly ash.
Table 5.
Ca(OH)2 content (%) before and after autoclaving related to volume stability with ladle slag and fly ash.
| Specimen | Length Change (%) | Volume Stability 1 | Ca(OH)2 Content (%) | |
|---|---|---|---|---|
| Before Autoclaving | After Autoclaving | |||
| OPC | 0.10 ± 0.003 | Sound | 10.77 ± 0.52 | 14.06 ± 1.1 |
| OPLS | Crack | Unsound | 12.58 ± 1.33 | 23.05 ± 1.88 |
| OPFA | 0.02 ± 0.005 | Sound | 7.75 ± 0.04 | 7.99 ± 0.07 |
1 Sound: ≤0.80%; unsound: >0.80%.
Publisher’s Note: MDPI stays neutral with regard to jurisdictional claims in published maps and institutional affiliations. |
© 2022 by the authors. Licensee MDPI, Basel, Switzerland. This article is an open access article distributed under the terms and conditions of the Creative Commons Attribution (CC BY) license (https://creativecommons.org/licenses/by/4.0/).
Share and Cite
MDPI and ACS Style
Lu, T.-H.; Chen, Y.-L.; Wang, H.-P.; Chang, J.-E. The Influencing Factors for Volume Stability of Ladle Slag. Processes 2022, 10, 92. https://doi.org/10.3390/pr10010092
AMA Style
Lu T-H, Chen Y-L, Wang H-P, Chang J-E. The Influencing Factors for Volume Stability of Ladle Slag. Processes. 2022; 10(1):92. https://doi.org/10.3390/pr10010092
Chicago/Turabian StyleLu, Tung-Hsuan, Ying-Liang Chen, Hong-Paul Wang, and Juu-En Chang. 2022. "The Influencing Factors for Volume Stability of Ladle Slag" Processes 10, no. 1: 92. https://doi.org/10.3390/pr10010092
Note that from the first issue of 2016, this journal uses article numbers instead of page numbers. See further details here.