
A Lean Manufacturing Progress Model and Implementation for SMEs in the Metal Products Industry

1
Department of Industrial Engineering and Management, National Taipei University of Technology, Taipei 10608, Taiwan
2
Department of Energy and Refrigerating Air-Conditioning Engineering, National Taipei University of Technology, Taipei 10608, Taiwan
3
College of Management, National Taipei University of Technology, Taipei 10608, Taiwan
*
Author to whom correspondence should be addressed.
Processes 2022, 10(5), 835; https://doi.org/10.3390/pr10050835
Submission received: 6 April 2022
/
Revised: 20 April 2022
/
Accepted: 21 April 2022
/
Published: 24 April 2022
(This article belongs to the Special Issue Sustainable Production Scheduling and Supply Chain Management under Resource Constraints and Factory Eligibility)
Abstract
:The manufacturing industry faces the challenge of small and diversified customer orders. To meet this challenge, strong internal production capabilities are required. A lean manufacturing process that uses fewer resources and offers greater process improvement will help SMEs to continue to contribute to the global economy. Though SMEs provide most employment opportunities, previous studies have focused on large companies in auto-manufacturing-related industries. With the commitment and support of the management, and the application of a value stream map (VSM) and related improvement tools, we produced a practical process improvement model for a lean manufacturing system in an SME. With the commitment and support of the management and the joint efforts of the project improvement staff, the 10 improvement projects over a six-month period all achieved their goals: reduction in lead time from 26 days to 19.5 days, improvement of welding per people per hour (PPH) efficiency by 28.3%, improvement of packaging PPH efficiency by 64.1%, improvement of working in process (WIP) efficiency at the production site by 83.84%, and improvement of raw material storage by 83.84%. The efficiency of the raw material warehouse inventory was improved by 58.63%, and the efficiency of the shipment completion rate was improved by 14.5%.
1. Introduction
Six pillars of smart manufacturing support enterprises in the move towards full-scale smart manufacturing: (1) manufacturing technology and processes; (2) materials; (3) data; (4) predictive engineering; (5) sustainability and resource sharing; and (6) networking. However, these six pillars exist in the enterprise as noun modifications [1]. The essence of manufacturing remains the same: it must offer low-cost, high-quality, and short-lead-time manufacturing capabilities to deliver maximum value to customers, obtain orders, and increase the company’s sustainable competitiveness.
Current trends challenge small manufacturers to produce greater quantity in less time, with fewer resources and reduced inventories and capital. Lean manufacturing aids in handling these demands [2]. Manufacturers seek to maximize output and minimize waste. Delivering higher quality products at affordable prices will drive higher customer satisfaction [3]. Lean manufacturing focuses primarily on reducing waste through reductions in overproduction, product defects, misallocation of labor and materials, inventory, product reworking or scrapping, and production delays [4].
In the last few decades, manufacturing processes have made revolutionary improvements through the use of lean methods [5]. However, lean manufacturing techniques have become widespread in many industries, since they drive greater competitiveness [6]. With limited resources, it is more difficult for SMEs to hire the talent needed for the application of advanced manufacturing techniques. Thus, techniques that require deep academic knowledge cannot be applied. Lean manufacturing is a practical methodology that is more useful for SMEs in eliminating waste in order to improve the profitability of the enterprise. One of the core tools of lean manufacturing is continuous improvement. For SMEs, which cannot afford large investments, creating a company culture incorporating all employees, to foster continuous improvement to reduce waste, is often possible [7].
Studies of lean manufacturing have focused primarily on specific products and larger companies—particularly in the auto industry [8]. However, SMEs are under intense pressure from customers and suppliers in a fully competitive business environment, with increasing demands from customers and constant price reductions. This issue is an important focus of this study.
Management conservatism remains a major issue for the implementation of lean thinking concepts in most businesses [9]. The implementation of lean manufacturing enables SMEs to continuously strengthen themselves in the face of operational difficulties and against competition from large corporations. Thus, the objectives of this study were as follows: (1) to determine which lean manufacturing models can be used by SMEs to reduce costs and increase efficiency, and (2) to provide examples of lean manufacturing tools and improvement projects for SMEs to learn from.
The remainder of this paper is organized as follows: First, it offers a literature review on the three key terms lean manufacturing, value stream mapping, and continuous improvement process. The third section introduces the research and methodology of this study, while the fourth section presents the results and discussions of the before and after improvements and the implementation of the lean manufacturing model by the SMEs. The final section concludes this research by highlighting limitations and identifying areas for future research.
2. Literature Review
2.1. Lean Manufacturing
The origins of lean production lie in the 1970s during the Second Oil Crisis, when Japanese automobiles accounted for more than one-third of the North American market. The nation was shocked, and the Massachusetts Institute of Technology (MIT) led a five-year research group on “The Future of the Automobile”, which produced the “Paradox of Productivity” study. This was followed by a five-year International Motor Vehicle Program (IMVP) at the Massachusetts Institute of Technology (MIT), which published the book “The Machine That Changed the World” in 1990 [10]. Lean thinking [11] has spread from the automotive industry to the electronics industry, and across the manufacturing and service industries. For example, lean thinking was extended to a large supermarket with a green improvement program aimed at improving the operational and sustainability performance of the cold meat department. The improvement process used traditional lean methods and tools, such as problem-solving analysis reports, to optimize the roadmap and document the steps involved in each improvement phase [12].
Lean thinking is “a way to do more with less and less human effort, less equipment, less time, and less space while coming closer to providing customers with what they want” [10]. It defines all non-value-adding activities as waste, and stamps out such activities in all company processes, defining seven types of waste: transport, inventory, motion, waiting, overproduction, overprocessing, and defects [13,14,15,16,17]. Ultimately, the principle of flow in lean manufacturing seeks to establish manufacturing and distribution processes that are free of delays, interruptions, or bottlenecks [11,18].
In practice, depending on the scale, strategy, and level of development of the organization and of the culture where it is applied, lean thinking can be a management system, a philosophy, or a toolset [19,20]. A wide range of tools can be used to establish lean manufacturing, including Kanban management, just-in-time (JIT), production line balance design, cellular manufacturing, total productive maintenance (TPM), and 5S (Seiri, Seiton, Seiso, Seiketsu, Shitsuke) [9].
2.2. Value Stream Mapping (VSM)
First appearing in 1995, VSM is a lean manufacturing approach popularized by Rother and Shook in 1999 [21]. With VSM, the current state of a process is analyzed, and a future situation for the product or service is mapped out as series of events that take place from the arrival of the raw materials at the manufacturer to the delivery of the product to the customer [22]. VSM works with many different manufacturing processes via reductions in errors, losses, and lead time, along with value-added activity improvement [23]. VSM—a tool for visualization—may be used to evaluate all production activities [24,25].
VSM, as a vital lean manufacturing tool [26], is one of the most commonly used methods in lean manufacturing [27]. VSM is also used to identify waste and design processes to achieve substantial strategies [18]. Using VSM to identify VAs (value-added activities) and NVAs (non-value-added activities), along with other lean management techniques, reduced total production time in the motor industry by approximately 13%, and improved the assembly line by 97% [2]. VSM can also be integrated with other management tools to perform lean manufacturing. In order to deal with long manufacturing lead times and unbalanced production lines in the wooden furniture industry, the implementation of VSM and TOC (the theory of constraints) were combined to present manufacturing process improvements [9].
Previous studies show that value chain implementation and management is critical [28]. VSM enables a constant flow of products and services to the customer [29]. For example, firms have used VSM to identify waste and inefficiency in new product development [30], healthcare services [31,32], sales processes [33], and environmental sustainability [34,35]. The use of VSM, as shown in Figure 1, can be divided into five steps: (1) selection of a part family; (2) current state map (including the collection of data); (3) define ideal state; (4) future state map; and (5) action plan [36].
2.3. Continuous Process Improvement
Today, numerous firms employ continuous improvement to manage change and make themselves more competitive [37]. The continuous improvement process is often divided into five items for improvement: (1) operation improvement—elimination of worthless operations, simplification and consolidation of operations, change of operational methods; (2) transportation improvement—removal of transportation, improvement of tools and methods of transportation, pull-back production, the lowest amounts of remanufactured products and parts; (3) improvement of inspection—promotion of independent inspection and sequential inspection, built-in quality systems, improvement of inspection equipment and methods; (4) waste of waiting—complete elimination of waiting, leveling of processes or procedures; and (5) improvement of storage—promotion of 5S activities, implementation of three determinations (positioning, quantity, and capacity), elimination of unnecessary storage [38]. Using the case of thalassotherapy centers as an example, managers should focus on continuous improvement to improve their customers’ results. Furthermore, if managers look to improve other outcomes, they need to focus on process management [39]. Organizational culture is essential for continuous improvement [5,40,41]. Thus, creating a supportive organizational culture is essential for implementing lean manufacturing. The culture of sustainable improvement is one of the most critical factors in the success of companies. Therefore, communication skills, long-term focus, and strategic teams can be essential in implementing initiatives.
A survey of the implementation of continuous improvement in the Irish pharmaceutical industry shows that after participating manufacturers reached 97% of all firms, benefits included improved quality and productivity, as well as significant cost savings. A variety of tools were used by the firms, including cause and effect, as well as process mapping [42].
The most common continuous improvement process models are the four-step quality assurance method, and the plan–do–check–act (PDCA) cycle. This consists of the following four stages: (1) Plan—planning for change after identifying an opportunity. (2) Do—pilot implementation of change. (3) Check—based on data analysis of the results, determine whether the change was effective. (4) Act—Implement a successful change on a broader scale, while constantly evaluating its effects. If the change fails, the cycle is begun anew [43,44]. Numerous industries use PDCA. For example, it has been used to explore the resilience and responsiveness of disaster relief operations (DROs) [45]. To protect user privacy, PDCA was used to design smart connected toys (SCTs) [46]. Researchers applied PDCA to VSM in a pharmaceutical firm in Pakistan [47].
3. Research and Methodology
Global industry still suffers from the impact of COVID-19. SMEs have been hit especially hard, with rising costs for raw materials and labor, and unstable international exchange rates. This appears to be a good time for such enterprises to introduce lean production. To explore this possibility, we performed a case study on a small–medium-sized metal processing manufacturer in China (Company S) with about 350 employees, mainly producing metal parts such as bicycle racks, water bottle racks, and parking racks; it is now an ISO-9001- and ISO-14001-certified manufacturing company. In China, an SME is defined as having less than 1000 employees in the manufacturing industry or less than RMB 400 million in revenue, meaning that the subject of this study is a small–medium-sized enterprise.
Company S has also begun activities related to precision manufacturing. Before promoting lean manufacturing, the president of Company S made the plan himself, held a pledge kick-off meeting, communicated clearly with the people involved in promoting lean manufacturing, and selected project staff for training to bring lean manufacturing into the organizational culture of daily work.
While facing the external challenges mentioned above, Company S also faces internal challenges such as (1) a small number of orders, (2) unstable scheduling, and (3) a rigid production model.
3.1. VSM Application
In the case study, VSM was used. VSM illuminates the connections between operations and activities, providing the foundation of the analysis that will lead to improvement [48,49]. For the application of VSM, this study defines this improvement based on the water bottle holder product category of Company S. The steps in the VSM are to (1) collect production-related data, (2) draw a flowchart of the current status of VSM, (3) explode the improvement points of VSM, and (4) draw the future VSM.
- 1.
- Collect production-related data:
To eliminate waste, the value stream must be comprehensively understood [17,50]. Parameters such as WIP (work-in-process), cycle time, rejects, and defective products are recorded. This supports planning for fulfilling customer demands [51,52]. Thus, before drawing the VSM, we should collect as much information as possible about the production process, including the respective shipment status of each process, production type, number of production orders, production quantity, tack/time, cycle time, the total number of personnel to be employed in each process and the actual number of personnel, the number of production shifts, production input time, overtime hours, availability, daily mold change and line change, and per people per hour (PPH). Table 1 shows the 15 items investigated, including production input time, overtime hours, availability, number and duration of daily mold and line changes, and per people per hour (PPH).
- 2.
- Draw the current VSM flowchart:
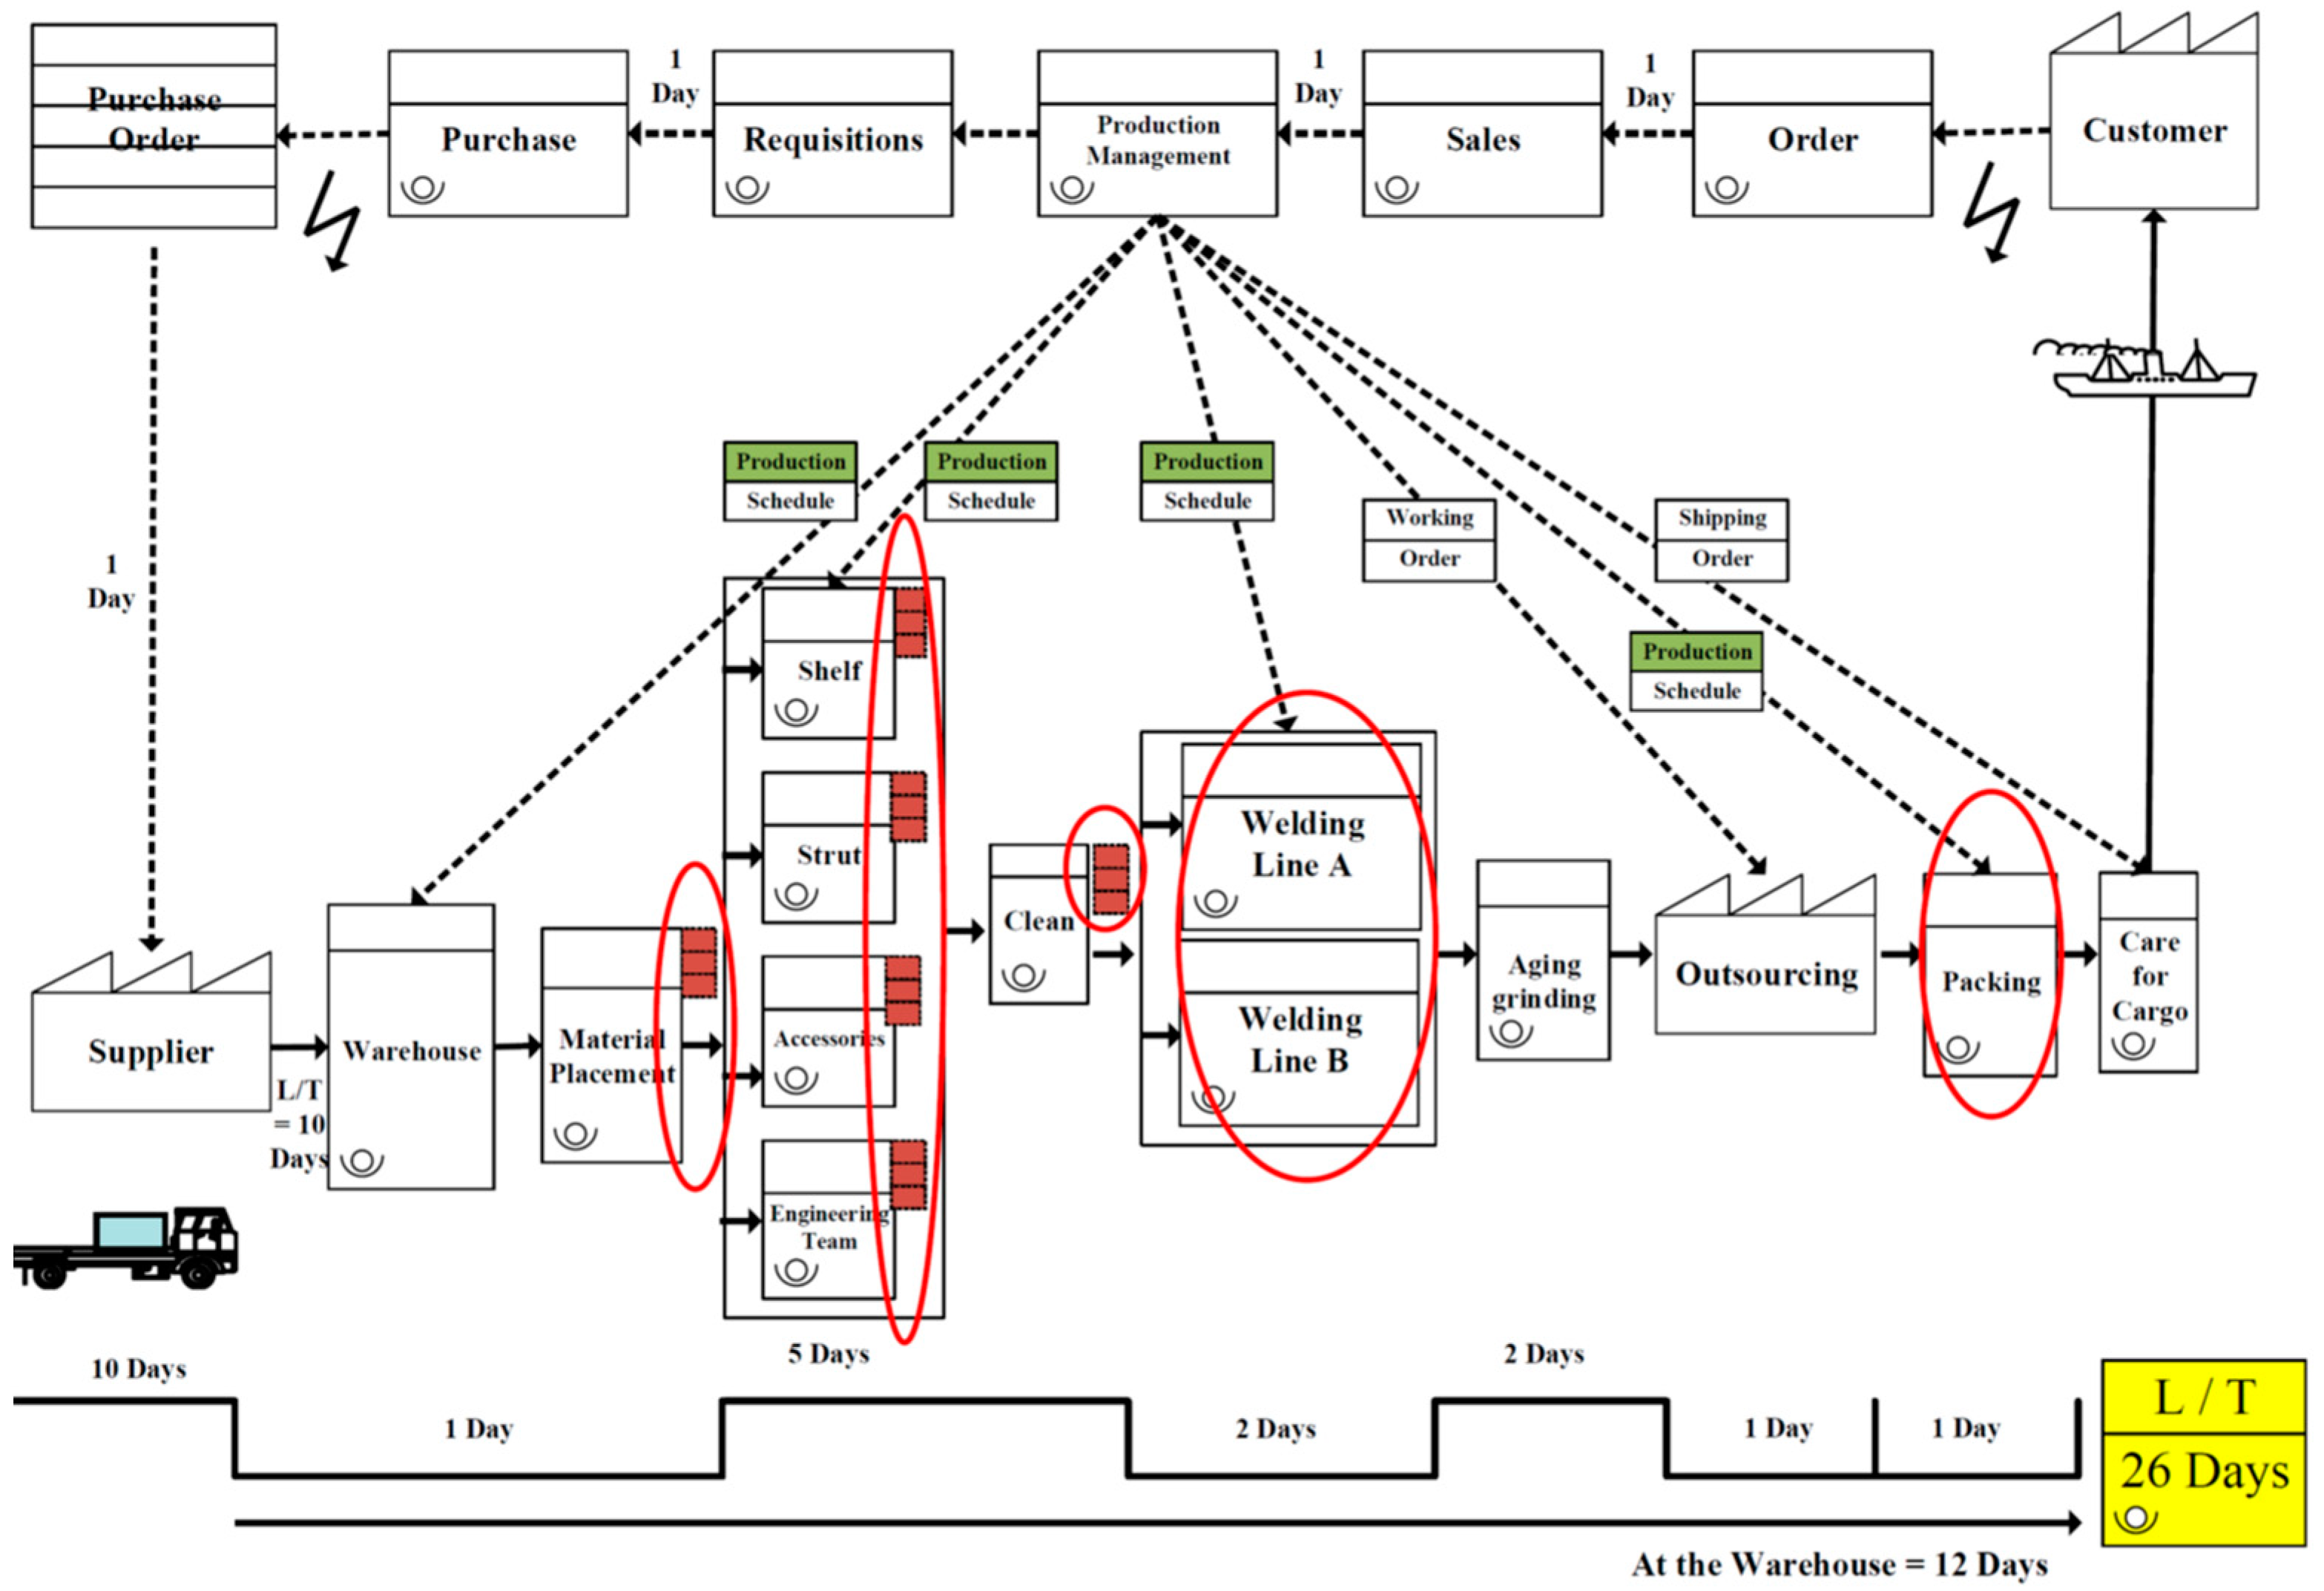
VSM begins with the customer requirements, and follows the procedures of the production process [53]. It highlights each workflow stage in reducing various forms of waste [8]. VSM is simple, and all stakeholders—from suppliers to operators to management to the customer—can easily grasp it. Because of this, important issues and their solutions can be identified and addressed by the production team [54,55,56]. Using the abovementioned mapping tips, we drew the current flowchart of Company S, as shown in Figure 2. We then identified the production bottlenecks in Figure 3 through brainstorming with the improvement team of Company S.
- 3.
- VSM explosion improvement points:
After finding the bottlenecks in production, the process analysis was used to identify the seven improvement explosion points in the future process diagram shown in Table 2. These improvement points were derived from the brainstorming and feasibility analysis of the improvement project team of Company S, and offer the opportunity to achieve successful improvement in the future.
- 4.
- Drawing the future VSM:
By accelerating the “flow of things”, shortening the lead time (L/T), and eliminating waste such as stagnation and transportation of goods, firms can increase the value of operations and improve their competitiveness. After mapping the desired future value streams, the current period (6 months) was compiled to refine the improvement items and their objectives (Table 3). The future VSM of Company S is shown in Figure 4.
As a result of teamwork, the improvement categories were divided into three major categories using the lean improvement tool—(1) material supply system improvement, (2) synchronized production, and (3) welding/packaging production mode change—corresponding to the improvement explosion points in Table 4. This resulted in 10 improvement projects with the desired improvement goals of Company S. The 10 improvement projects were each broken down into 10 smaller goals whose achievement was necessary to reach the larger goal. In other words, a large goal can be achieved by breaking it down into 10 smaller goals. Table 4 summarizes the 10 practical improvement projects and their improvement effects.
3.2. Improvement of 10 Items of Lean Manufacturing
Lean methodologies focus on reducing defects, unnecessary transport and motion, setup time, and other waste issues [57]. Thus, tool selection is an important component of their success [8]. Studies have shown that by implementing continuous flow and Kanban tools, lead times may be shortened [58,59,60]. SMEs should choose lean tools to address their issues and improvement needs [61,62].
Before the improvement, the production line of Company S was designed with mass production in mind. After the introduction of lean production thinking and the combination of internal and external environmental considerations, the production line was transformed into the CELL production method, as follows:
- Poor efficiency of the original line—change operation:
Since the current production type is premised on handling mass production, the production lines are set up on a larger scale, and the balance rate of production staffing decreases under the distribution of operating combinations, resulting in staff waiting during line changeover time (waste).
- A high turnover rate of original employees:
Employees are the main resource of a company [63]. A high turnover rate among employees leads to frequent recruitment of new employees, but education and training are time-sensitive and cannot be performed promptly.
The solution to the above two problems is to minimize the combination of operations through cell production, which will improve efficiency. The following explains the 10 improvement projects before and after the improvement, the tools applied for the improvement, and their improvement effects (Table 5, Table 6, Table 7, Table 8, Table 9, Table 10, Table 11, Table 12, Table 13 and Table 14).
- C1: Collaborative factory delivery design;
- C2: Assist suppliers in order-taking to achieve scheduling optimization;
- C3: Setting and management of delivery process control points;
- C4: Establishment of supply store;
- C5: Different areas of the main products and accessories can be produced simultaneously, along with mobile production;
- C6: Improvement of mold and line change;
- C7: Weld line clearing to avoid improvement;
- C8: Improvement of welding, inspection, and calibration;
- C9: Soldering cell line improvement (for example, X products);
- C10: Packaging cell line improvement (for example, Y products).
4. Discussion
4.1. Lean Production Improvement Model of SMEs
Before the lean manufacturing kick-off meeting, the commitment of the management to promote lean production at Company S was obtained—a necessary commitment to ensure the implementation of lean manufacturing. However, this study sets the period during which Company S performs lean production improvement as “half a year”, and takes the management cycle of PDCA as the core concept of implementation improvement, showing how SMEs can implement lean production. The empirical evidence presented herein validates the concept of continuous improvement over a six-month cycle for SMEs, despite their limited resources.
Based on the premise that a project working group has been formed, this study developed a set of promotion models suitable for small and medium-sized enterprises to improve lean production.
- Use VSM to map the current production flow;
- Identify the explosion points of production and operation bottlenecks;
- Identify improvement items for the explosion points;
- Set improvement targets for the explosion points;
- Use the PDCA management cycle to implement the improvement concept. A five-part improvement process is used to develop a six-month improvement plan (i.e., theme selection, status quo grasp, cause analysis, improvement strategy and implementation, and effect confirmation). A map for promoting lean manufacturing mode in an SME is shown in Figure 5.
4.2. Lean Process after Improvement
In order to achieve the overall goal of promoting lean manufacturing, Company S constructed six improvement plans. These are primarily aimed at reducing L/T as the improvement goal and increasing the per capita output, reducing WIP, reducing inventory, and increasing shipment completion rate, in line with customer demand and production line balance. Among the six projects, the efficiency of reducing WIP was 83.84% higher than the target, and the efficiency of reducing L/T days was 25% higher than the target. The efficiency improvement statistics are shown in Table 15.
In the 6 improvement plans mentioned above, there are 10 improvement items, and the successful implementation of these 10 improvement items enabled the 6 improvement plans to achieve their targets. Company S implemented cellular production in the packaging process, and the improvement of SMED adopted to save work time achieved the expected improvement benefits. The VSM after the improvement of Company S is shown in Figure 6.
5. Conclusions and Suggestions
Facing shrinking lead times, greater demand for products in terms of quantity, and more stringent customer expectations for costs and quality, manufacturers must upgrade their product development, production, and shipping [64].
Even though the idea of applying lean manufacturing has not yet been firmly adopted by many SMEs [41], this study provides a successful demonstration for SMEs to promote lean manufacturing. In this regard, we also demonstrate VSM and lean manufacturing tools to improve the organization through a continuous process. Waste and cost reduction can enhance the competitiveness of SMEs. Thus, the promotion of lean production is a beneficial choice. The following are the conclusions, limitations, and recommendations for future research of this study.
5.1. Conclusions
- Contribution:
- This study addresses research gaps in the implementation of lean manufacturing in SMEs, and is supplemented by empirical studies to validate the benefits of lean manufacturing in practicing process improvement and improving business performance.
- This study provides a complete analysis of 10 implementation solutions for lean improvement in SMEs, and compiles relevant improvement cases.
- This study develops a five-step implementation model for lean manufacturing—especially in process improvement—that is suitable for SMEs. It also identifies the commitment of senior executives, the formation of project improvement teams, and the training of relevant personnel as the success factors for the implementation of lean manufacturing in SMEs.
- Management Implications:
SMEs have fewer resources than large enterprises. Thus, it is necessary to complete a specific analysis of improvement plans and countermeasures before implementing lean manufacturing. This study applies VSM as the core tool of lean manufacturing to examine the problem areas of enterprises, showing that both SMEs and large enterprises can apply VSM to implement process improvements related to lean manufacturing.
In addition to increasing sales, an important method for improving profitability is to reduce waste. The tools used to implement lean manufacturing in project process improvement will depend on the needs of the company. SMEs can select non-high-level statistical applications and other tools based on the purpose of improvement, which will increase the confidence and success rate of SME project improvement staff in implementing lean manufacturing.
5.2. Research Limitations and Suggestions for Future Research
The target population of this study is SMEs in the metal products industry in China. The metal product type is a traditional industry. Medium and large enterprises were not included in the study because most previous studies used medium and large enterprises as the target population. Finally, this study uses six months as the study period for the implementation of lean manufacturing in SMEs. It is thus a longitudinal research project.
In a future study, it would be reasonable to perform a cross-sectional analysis with a more extended follow-up period, such as six months to one year. A comparative study between two or more companies can also be considered as another suggested item.
Author Contributions
Conceptualization, C.-Y.H. and S.-C.C.; methodology, S.-C.C.; formal analysis, S.-C.C.; resources, C.-Y.H. and D.L.; writing—original draft preparation, S.-C.C.; writing—review and editing, W.T. and C.-Y.H.; supervision, C.-Y.H. and D.L. All authors have read and agreed to the published version of the manuscript.
Funding
This research received no external funding.
Data Availability Statement
The data are not publicly available due to its use on future research activities.
Conflicts of Interest
The authors declare no conflict of interest.
References
- Kusiak, A. Smart manufacturing. Int. J. Prod. Res. 2018, 56, 508–517. [Google Scholar] [CrossRef]
- Nallusamy, S. Execution of lean and industrial techniques for productivity enhancement in a manufacturing industry. Mater. Today Proc. 2021, 37, 568–575. [Google Scholar] [CrossRef]
- Singh, M.; Rathi, R.; Garza-Reyes, J.A. Analysis and prioritization of lean six sigma enablers with environmental facets using best worst method: A case of Indian MSMEs. J. Clean. Prod. 2021, 279, 123592. [Google Scholar] [CrossRef]
- Rathi, R.; Prakash, C.; Singh, S.; Krolczyk, G.; Pruncu, C.I. Measurement and analysis of wind energy potential using fuzzy-based hybrid MADM approach. Energy Rep. 2020, 6, 228–237. [Google Scholar] [CrossRef]
- Antony, J.; Snee, R.; Hoerl, R. Lean Six Sigma: Yesterday, today and tomorrow. Int. J. Qual. Reliab. Manag. 2017, 34, 1073–1093. [Google Scholar] [CrossRef]
- Kaswan, M.S.; Rathi, R. Green lean six sigma for sustainable development: Integration and framework. Environ. Impact Assess. 2020, 83, 106396. [Google Scholar] [CrossRef]
- Gonzalez, R.V.D.; Martins, M.F. Capability for Continuous Improvement: Analysis of Companies from Automotive and Capital Goods Industries. TQM J. 2016, 28, 250–274. [Google Scholar] [CrossRef]
- Trubetskaya, A.; Manto, D.; McDermott, O. A Review of Lean Adoption in the Irish MedTech Industry. Processes 2022, 10, 391. [Google Scholar] [CrossRef]
- Alzubi, E.; Atieh, A.M.; Shgair, K.A.; Damiani, J.; Sunna, S.; Madi, A. Hybrid Integrations of Value Stream Mapping, Theory of Constraints and Simulation: Application to Wooden Furniture Industry. Processes 2019, 7, 816. [Google Scholar] [CrossRef] [Green Version]
- Womack, J.P.; Jones, D.T.; Roos, D. The Machine That Changed the World; Simon and Schuster: New York, NY, USA, 1990. [Google Scholar]
- Womack, J.P.; Jones, D.T. Lean Thinking—Banish Waste and Create Wealth in Your Corporation, 3rd ed.; Simon and Schuster: London, UK, 1996. [Google Scholar]
- Marques, P.A.; Carvalho, A.M.; Santos, J.O. Improving Operational and Sustainability Performance in a Retail Fresh Food Market Using Lean: A Portuguese Case Study. Sustainability 2022, 14, 403. [Google Scholar] [CrossRef]
- Baysan, S.; Kabadurmus, O.; Cevikcan, E.; Satoglu, S.I.; Durmusoglu, M.B. A Simulation-based methodology for the analysis of the effect of lean tools on energy efficiency: An application in power distribution industry. J. Clean. Prod. 2019, 211, 895–908. [Google Scholar] [CrossRef]
- Knoll, D.; Reinhart, G.; Prüglmeier, M. Enabling value stream mapping for internal logistics using multidimensional process mining. Expert Syst. Appl. 2019, 124, 130–142. [Google Scholar] [CrossRef]
- Goh, M.; Goh, Y.M. Lean production theory-based simulation of modular construction processes. Autom. Constr. 2019, 101, 227–244. [Google Scholar] [CrossRef]
- Stadnicka, D.; Litwin, P. Value stream mapping and system dynamics integration for manufacturing line modelling and analysis. Int. J. Prod. Econ. 2019, 208, 400–411. [Google Scholar] [CrossRef]
- Wilson, L. How to Implement Lean Manufacturing; McGraw Hill Professional: New York, NY, USA, 2009. [Google Scholar]
- Byrne, B.; McDermott, O.; Noonan, J. Applying Lean Six Sigma Methodology to a Pharmaceutical Manufacturing Facility: A Case Study. Processes 2021, 9, 550. [Google Scholar] [CrossRef]
- Bhasin, S. Lean Management beyond Manufacturing; Springer International Publishing AG: Cham, Switzerland, 2015. [Google Scholar]
- Seth, D.; Seth, N.; Dhariwal, P. Application of value stream mapping (VSM) for lean and cycle time reduction in complex production environments: A case study. Prod. Plan. Control 2017, 28, 398. [Google Scholar] [CrossRef]
- Rother, M.; Shook, J. Learning to See: Value-Stream Mapping to Create Value and Eliminate Muda; Version 1.4; Lean Enterprise Institute: Boston, MA, USA, 1999. [Google Scholar]
- Braglia, M.; Carmignani, G.; Zammori, F. A new value stream mapping approach for complex production systems. Int. J. Prod. Res. 2006, 44, 3929. [Google Scholar] [CrossRef] [Green Version]
- Qin, Y.; Hongrui, L. Application of Value Stream Mapping in E-Commerce: A Case Study on an Amazon Retailer. Sustainability 2022, 14, 713. [Google Scholar] [CrossRef]
- Forno, A.J.D.; Pereira, F.A.; Forcellini, F.A.; Kipper, L.M. Value stream mapping: A study about the problems and challenges found in the literature from the past 15 years about application of Lean tools. Int. J. Adv. Manuf. Syst. 2014, 72, 779–790. [Google Scholar] [CrossRef]
- Goti, A.; De la Calle, A.; Gil, M.J.; Errasti, A.; Bom, P.R.D.; García-Bringas, P. Development and application of an assessment complement for production system audits based on data quality, IT infrastructure, and sustainability. Sustainability 2018, 10, 4679. [Google Scholar] [CrossRef] [Green Version]
- Rathi, R.; Jagadeeswaran, M.; Imran, G.M.; Kumar, K.V.; Eswar, K.V.R.; Sameerpasha, S. Investigation and implementation of VSM in water distillation plant. Mater. Today Proc. 2022, 50, 751–758. [Google Scholar] [CrossRef]
- Gavriluţă, A.C.; Niţu, E.L.; Gavriluţă, C.A. Algorithm to Use Some Specific Lean Manufacturing Methods: Application in an Industrial Production Process. Processes 2021, 9, 641. [Google Scholar] [CrossRef]
- Andreadis, E.; Garza-Reyes, J.A.; Kumar, V. Towards a conceptual framework for value stream mapping (VSM) implementation: An investigation of managerial factors. Int. J. Prod. Res. 2017, 28, 7073–7095. [Google Scholar] [CrossRef]
- Hadid, W. Lean service, business strategy and ABC and their impact on firm performance. Prod. Plan. Control. 2019, 30, 1203–1217. [Google Scholar] [CrossRef]
- Tyagi, S.; Choudhary, A.; Cai, X.; Yang, K. Value stream mapping to reduce the lead-time of a product development process. Int. J. Prod. Econ. 2015, 160, 202–212. [Google Scholar] [CrossRef] [Green Version]
- Santos, A.C.S.G.D.; Reis, A.D.C.; Souza, C.G.; Santos, C.; Ferreria, I.L.; Figueiredo, L.A. The first evidence about conceptual vs analytical lean healthcare research studies. J. Health Organ. Manag. 2020, 34, 789–806. [Google Scholar] [CrossRef] [PubMed]
- Marin-Garcia, J.A.; Vidal-Carreras, P.I.; Garcia-Sabater, J.J. The role of value stream mapping in healthcare services: A scoping review. Int. J. Environ. Res. Public Health 2021, 18, 951. [Google Scholar] [CrossRef]
- Barber, C.S.; Tietje, B.C. A Research Agenda for Value Stream Mapping the Sales Process. J. Pers. Sell. Sales Manag. 2008, 28, 155–165. [Google Scholar] [CrossRef]
- Muñoz-Villamizar, A.; Santos, J.; Garcia-Sabater, J.J.; Lleo, A.; Grau, P. Green value stream mapping approach to improving productivity and environmental performance. Int. J. Product. Perform. Manag. 2019, 68, 608–625. [Google Scholar] [CrossRef]
- Schoeman, Y.; Oberholster, P.; Somerset, V. Value stream mapping as a supporting management tool to identify the flow of industrial waste: A case study. Sustainability 2021, 13, 91. [Google Scholar] [CrossRef]
- Kundgol, S.; Petkar, P.; Gaitonde, V.N. Implementation of value stream mapping (VSM) upgrading process and productivity in aerospace manufacturing industry. Mater. Today Proc. 2021, 46, 4640–4646. [Google Scholar] [CrossRef]
- Berggren, C. Lean Production-the End of History? Work. Empl. Soc. 1993, 7, 163–188. [Google Scholar]
- Yang, C.C. Management Tools Manual; Chinese Society for Quality: Taipei, Taiwan, 2009; ISBN 9578914709. [Google Scholar]
- Álvarez-García, J.; Del Río-Rama, M.D.l.C.; Miras-Rodríguez, M.D.M. How Do Quality Practices Affect the Results?: The Experience of Thalassotherapy Centres in Spain. Sustainability 2017, 9, 671. [Google Scholar] [CrossRef] [Green Version]
- Barclay, R.C.; Cudney, E.A.; Shetty, S.; Antony, J. Determining Critical Success Factors for Lean Implementation. Total Qual. Manag. Bus. Excell. 2021, 1–15. [Google Scholar] [CrossRef]
- Achanga, P.; Shehab, E.; Roy, R.; Nelder, G. Critical success factors for lean implementation within SMEs. J. Manuf. Technol. Manag. 2006, 17, 460–471. [Google Scholar] [CrossRef]
- McDermott, O.; Antony, J.; Sony, M.; Daly, S. Barriers and Enablers for Continuous Improvement Methodologies within the Irish Pharmaceutical Industry. Processes 2022, 10, 73. [Google Scholar] [CrossRef]
- Antony, J.; Krishan, N.; Cullen, D.; Kumar, M. Lean Six Sigma for Higher Education Institutions (HEIs): Challenges, Barriers, Success Factors, Tools/Techniques. Int. J. Product. Perform. Manag. 2012, 61, 940–948. [Google Scholar] [CrossRef]
- Shararah, M.A. A value stream map in motion. Ind. Engi. 2013, 45, 46–50. [Google Scholar]
- Dadashnejad, A.-A.; Valmohammadi, C. Investigating the effect of value stream mapping on operational losses: A case study. J. Eng. Des. Technol. 2018, 16, 478–500. [Google Scholar] [CrossRef]
- Martin, K.; Osterling, M. Value Stream Mapping: How to Visualize Work and Align Leadership for Organizational Transformation, 1st ed.; McGraw-Hill Education: New York, NY, USA, 2013. [Google Scholar]
- Linhares, A. Theory of constraints and the combinatorial complexity of the product-mix decision. Int. J. Prod. Econ. 2009, 121, 121–129. [Google Scholar] [CrossRef]
- Parv, L.; Deaky, B.; Nasulea, M.D.; Oancea, G. Agent-Based Simulation of Value Flow in an Industrial Production Process. Processes 2019, 7, 82. [Google Scholar] [CrossRef] [Green Version]
- Kumar, S.S.; Kumar, M.P. Cycle time reduction of a truck body assembly in an automobile industry by lean principles. Procedia Mater. Sci. 2014, 5, 1853–1862. [Google Scholar] [CrossRef] [Green Version]
- Arunagiri, P.; Gnanavelbabu, A. Identification of high impact lean production tools in automobile industries using weighted average method. Procedia Eng. 2014, 97, 2072–2080. [Google Scholar] [CrossRef] [Green Version]
- Chaudhari, K.; Shah, S.C. A literature review on lead time reduction using the value stream mapping. J. Emerg. Technol. Innov. Res. 2015, 60, 3056. [Google Scholar]
- Marodin, G.A.; Saurin, T.A.; Tortorella, G.L.; Denicol, J. How context factors influence lean production practices in manufacturing cells. Int. J. Adv. Manuf. Technol. 2015, 79, 1389. [Google Scholar] [CrossRef]
- Morales, J.D.; Rodriguez, R.S. Total productive maintenance as a tool for improving productivity: A case study of application in the bottleneck of an auto-parts machining line. Int. J. Adv. Manuf. Technol. 2017, 92, 1013–1026. [Google Scholar] [CrossRef]
- Sutharsan, S.M.; Manickam, C.; Mohan Prasad, M. Production and quality improvement using through lean technique in a monoblock—SWJ1HP pump assembly line. Int. J. Innov. Res. Sci. Eng. Technol. 2015, 4, 201–206. [Google Scholar]
- Vinodh, S.; Arvind, K.R.; Somanaathan, M. Application of value stream mapping in an Indian camshaft manufacturing organisation. J. Manuf. Technol. Manage. 2017, 21, 888–900. [Google Scholar] [CrossRef]
- Brown, A.; Eatock, J.; Dixon, D.; Meenan, B.J.; Anderson, J. Quality and continuous improvement in medical device manufacturing. TQM J. 2008, 20, 541–555. [Google Scholar] [CrossRef]
- Dombrowski, U.; Crespo, I.; Zahn, T. Adaptive Configuration of a Lean Production System in Small and Medium-sized Enterprises. Prod. Eng. 2010, 4, 341–348. [Google Scholar] [CrossRef]
- Wasim, A.; Shehab, E.; Abdalla, H. An innovative cost modelling system to support lean product and process development. Int. J. Adv. Manuf. Technol. 2013, 65, 165–181. [Google Scholar] [CrossRef] [Green Version]
- Hussain, A.; Masood, T.; Munir, H.; Habib, M.S.; Farooq, M.U. Developing resilience in disaster relief operations management through lean transformation. Prod. Plan. Control 2022, 1–22. [Google Scholar] [CrossRef]
- Yankson, B. Continuous improvement process (CIP)-based privacy-preserving framework for smart connected toys. Int. J. Inf. Secur. 2021, 20, 849–869. [Google Scholar] [CrossRef]
- Quality Glossary, American Society for Quality ASQ. Available online: https://asq.org/quality-resources/continuous-improvement (accessed on 11 March 2022).
- Rosa, A.; Marolla, G.; Lega, F.; Manfredi1, F. Lean adoption in hospitals: The role of contextual factors and introduction strategy. BMC Health Serv. Res. 2021, 21, 889. [Google Scholar] [CrossRef] [PubMed]
- Chen, S.C.; Lee, D.S.; Huang, C.Y. Evaluating the Sustainable Operating Performance of Electronics Industry Groups: Taiwanese Firms in Mainland China. Sustainability 2021, 13, 12030. [Google Scholar] [CrossRef]
- Fannon, S.R.; Munive-Hernandez, J.E.; Campean, F. Mastering continuous improvement (CI): The roles and competences of mid-level management and their impact on the organisation’s CI capability. TQM J. 2022, 34, 102–124. [Google Scholar] [CrossRef]
Figure 1.
Steps involved in VSM.

Figure 2.
Current VSM.

Figure 3.
Production bottleneck.

Figure 4.
Future VSM.

Figure 5.
Map for the promotion of lean manufacturing mode in an SME.

Figure 6.
VSM after improvement.


Table 1.
Production site survey statistics.
| Work Sequence Measuring Items | Warehouse | Manufacturing | Welding | Timing | Polishing | Outsourcing | Packaging |
|---|---|---|---|---|---|---|---|
| Number of outgoing containers including bulk cargo (pcs/month) | / | / | / | / | / | / | 54 |
| Number of species produced (species/month) | 287 | 287 | 287 | 287 | 287 | 287 | 353 |
| Number of work orders produced (pcs/month) | 99 | 99 | 99 | 99 | 99 | 99 | 99 |
| Production quantity (pcs/month) | 133,424 | 133,424 | 74,667 | 56,485 | 44,485 | 109,230 | 110,128 |
| T/Time (sec) | / | 3.37 | 2.59 | / | 1.24 | / | 3.06 |
| ΣCT (sec) | / | 26,972,672 | 10,066,263 | / | 439,759 | / | 842,2345 |
| Headcount needed | / | 60 | 52 | / | 8 | / | 25 |
| Actual headcount | 3 | 68 | 60 | / | 12 | 1 | 28 |
| Number of production shifts | 1 | 1 | 2 | 1 | 1 | / | 1 |
| Production time/shift (hours) | 8 | 8 | 8 | 8 | 8 | 8 | 8 |
| Overtime hours/day (hours) | 1 | 3 | 0 | 2 | 2 | 1 | 2 |
| Movability | / | 78% | 73% | / | 71% | / | 72% |
| Number of mold and production line changes (times/day) | / | 6 | 4 | / | 4 | / | 8 |
| Mold change time (min/bout) | / | 30 | 20 | / | 10 | / | 10 |
| PPH (per people per hour) | / | 6.86 | 5.98 | / | 14.26 | / | 15.13 |
Note: The production quantity statistics are based on the total number of products (e.g., kettle rack, parking rack, shelf), which has some influence on the PPH calculation.
Table 2.
VSM explosion improvement points.
| Code | Explosion Point | Policy Direction |
|---|---|---|
| B1 | Uncertainty in business orders | Business order normalization. |
| B2 | Supplier delivery chaos | Establish vendor delivery schedules. |
| B3 | Supply is not in real time | Establish the supply sequence store: (1) Kanban introduction, clear sequence; (2) The supply of materials in one cart. |
| B4 | Poor production | (1) Establishing synchronous production; (2) Group operation and resource adaptation; (3) Quick mold change enhancement. |
| B5 | High WIP for cleaning process | Establishment of the sequence of storage before and after cleaning: (1) Clear sequential order; (2) Line correspondence. |
| B6 | Low efficiency of welding | Welding cell line creation. |
| B7 | Low efficiency of packaging | Packaging cell line creation. |
Table 3.
Lean improvement plan and its objectives.
| Improvement Plan | Before Improvement | Objective | Efficiency Gains |
|---|---|---|---|
| L/time reduction (days) | 26 days | 20 days | 6 days curtailment |
| Welded PPH lift (A-type rack) | 10.6 pcs | 13 pcs | 23% improvement in PPH |
| Package PPH lift (B-type bottle cage) | 195 pcs | 300 pcs | 54% improvement in PPH |
| Production site work-in-progress (sets) | 38,763 sets | 7000 sets | 80% reduction |
| Raw material storage weight (KG) | 111,258 KG | 78,000 KG | 30% reduction |
| Shipment achievement rate | 80% | Target 100% | Raised 25% |
Table 4.
Summary of the 10 improvement items and their improvement effects.
| Improvements Category | Explosion Point Improvement Correspondence | Improvement Projects | Expected Improvement Results |
|---|---|---|---|
| Feeding system improvement | B1, B2, B3 | (C1) Collaboration with manufacturers on delivery design. | (1) Suppliers are able to deliver materials according to the schedule set. |
| (C2) Business master scheduling balance. | (2) Easy to access the current production load of Company S. | ||
| (C3) Feeding store establishment. | (3) The warehouse is able to issue materials in an orderly manner. | ||
| (C4) Internal feeding and mixing of multifrequency small-batch dispensing. | (4) Combine the company’s current order status to meet customer needs. | ||
| Synchronization of production | B4, B5, B6 | (C5) SMED (single-minute exchange of die) capability enhancement. | (5) Reduce on-site mold and wire change time to cope with small quantities and diversity. |
| (C6) Production scheduling synchronization + synchronized production in different areas. | (6) Simultaneous set production, shorten L/time by 3.5 days. | ||
| (C7) Same-region mobile production. | (7) The equipment is configured to roughly match the machining process of the workpiece. | ||
| (C8) Welding work line clearing to avoid improvement. | (8) Eliminate waiting time and overtime. | ||
| (C9) Improvement of welding, inspection, and calibration process integration. | (9) To enable the orderly transfer of the complete set of accessories according to the production plan. | ||
| Welding/packaging production model change | B6, B7 | (C10) Welding/packaging cellularization. | (10-1) Improve line balance and productivity per person through small line improvement; (10-2) Accumulate successful experience through successful trial production. |
Table 5.
C1 improvement project and its improvement effects (before and after).
| C1 | Before | After |
|
| |
| Improvement tool | Heijunka and color control. | |
| Improvement effect |
| |


* N-28 means the order will be shipped within 28 days of receipt.
Table 6.
C2 improvement project and its improvement effects (before and after).
| C2 | Before | After |
|
| |
| Improvement tool | VSM; production scheduling. | |
| Improvement effect |
| |
Table 7.
C3 improvement project and its improvement effects (before and after).
| C3 | Before | After |
| The supplier’s delivery is not controlled, and the goods sent are not matched and will pile up in the company’s warehouse, mainly because the control point is not clear. |
| |
| Improvement tool | Supplier management practices. | |
| Improvement effect |
| |
* N-13: delivery to Company S within 13 days after the representative receives the order.
Table 8.
C4 improvement project and its improvement effects (before and after).
| C4 | Before | After |
| Not in accordance with the needs of the site, but the same specifications of the material on the schedule; the recent production to be sent to the site at once—whether it matches or not—often resulting in the accumulation of materials on site. |
| |
| Improvement tool | Material management; material store setup. | |
| Improvement effect | Based on the needs of the store, the production unit’s daily production of materials is set as required to lay the foundations for production. | |
Table 9.
C5 improvement project and its improvement effects (before and after).
| C5 | Before | After |
| Improvement: weekly plan with a weighted average number of people calculated, used in each part of the synchronized production implementation:
| |
| Improvement tool | Production scheduling; SMED (single-minute exchange of die). | |
| Improvement effect | Simultaneous production; shorten L/time by 3.5 days. | |
Table 10.
C6 improvement project and its improvement effect (before and after).
| C6 | Before | After |
| A product mold change time is calculated based on the existing 10 stations; each set of molds takes about 8 min, for a total of 80 min, accounting for 20% of the production time. | After changing the mold base to quick mold change, it takes about 4 min for each set of molds, and only 40 min for 10 stations to change the molds for the same product. | |
| Improvement tool | SMED. | |
| Improvement effect | The mold change time was reduced by 50%, benefitting the current production status of small quantities and diversity. | |
Table 11.
C7 improvement project and its improvement effects (before and after).
| C7 | Before | After |
| Clear the line at the end of each shift. It takes about 20 min to clear and rearrange the line (for example, 10 work stations). | If the product is not fully welded, 3–5 products are reserved for welding on the next shift, which saves about 20 min each time. | |
| Improvement tool | Production scheduling; 5S. | |
| Improvement effect | A line based on 10 people, in turn, saves 20, 18, 16,…, 2 min; two shifts a day can save about 220 min. | |
Table 12.
C8 improvement project and its improvement effects (before and after).
| C8 | Before | After |
| The welded products from the three lines are all moved to the calibration table for calibration and packing. |
| |
| Improvement tool | Industrial Engineering 7 tools (IE 7 tools). | |
| Improvement effect |
| |
Table 13.
C9 improvement project and its improvement effects (before and after).
| C9 | Before | After |
| The use of large assembly line welding easily leads to product pile-up and waiting, while the company’s current staff is more stable, and most of the orders are of small quantity and are diverse. | The welding molds are controlled within 3–4 sets, and the welding time of each station is adjusted to the best balance. | |
| Improvement tool | Industrial Engineering 7 tools (IE 7 tools). | |
| Improvement effect |
| |
Table 14.
C10 improvement project and its improvement effects (before and after).
| C10 | Before | After |
All products are packaged on large assembly lines, and frequent line changes (usually 30–40 products in a cabinet) and low production line balance have become a problem for managers.
| Depending on the customer’s order and the structure of the product, different packaging methods can be defined.
| |
| Improvement tool | IE 7 tools; bath production. | |
| Improvement effect | The PPH of product Y’s packaging is 195 pcs before improvement, and 320 pcs after improvement, which is an increase of 125 pcs. | |
Table 15.
Efficiency improvement statistics: before and after the improvement plan.
| Improvement Plan | Before | Goal | After | Efficiency Gains |
|---|---|---|---|---|
| L/time curtailment (days) | 26 days | 20 days | 19.5 days | 25.00% |
| Welded PPH improvement (A-type rack) | 10.6 PCS | 13 PCS | 13.6 PCS | 28.3% |
| Package PPH improvement (B-type bottle cage) | 195 PCS | 300 PCS | 320 PCS | 64.1% |
| Work in progress (sets) | 38,763 sets | 7000 sets | 6263 sets | 83.84% |
| Raw material storage weight (KG) | 111,258 KG | 78,000 KG | 46,022 KG | 58.63% |
| Shipment achievement rate | 80% | 100% | 91.60% * | 14.5% |
| Remark: | * 6-month average of Shipment Achievement Rate: improvement of 1st month: 84.87%, 2nd month: 90.11%, 3rd month: 89.18%, 4th month: 92.81%, 5th month: 93.46%, 6th month: 99.14% respectively. | |||
Publisher’s Note: MDPI stays neutral with regard to jurisdictional claims in published maps and institutional affiliations. |
© 2022 by the authors. Licensee MDPI, Basel, Switzerland. This article is an open access article distributed under the terms and conditions of the Creative Commons Attribution (CC BY) license (https://creativecommons.org/licenses/by/4.0/).
Share and Cite
MDPI and ACS Style
Huang, C.-Y.; Lee, D.; Chen, S.-C.; Tang, W. A Lean Manufacturing Progress Model and Implementation for SMEs in the Metal Products Industry. Processes 2022, 10, 835. https://doi.org/10.3390/pr10050835
AMA Style
Huang C-Y, Lee D, Chen S-C, Tang W. A Lean Manufacturing Progress Model and Implementation for SMEs in the Metal Products Industry. Processes. 2022; 10(5):835. https://doi.org/10.3390/pr10050835
Chicago/Turabian StyleHuang, Chien-Yi, Dasheng Lee, Shu-Chuan Chen, and William Tang. 2022. "A Lean Manufacturing Progress Model and Implementation for SMEs in the Metal Products Industry" Processes 10, no. 5: 835. https://doi.org/10.3390/pr10050835
Note that from the first issue of 2016, this journal uses article numbers instead of page numbers. See further details here.