Article

Multiscale Fractal Characterization of Pore–Fracture Structure of Tectonically Deformed Coal Compared to Primary Undeformed Coal: Implications for CO2 Geological Sequestration in Coal Seams

1
State Key Laboratory of Mining Response and Disaster Prevention and Control in Deep Coal Mines, Anhui University of Science & Technology, Huainan 232001, China
2
Institute of Energy, Hefei Comprehensive National Science Center, Hefei 230031, China
3
School of Earth and Environment, Anhui University of Science & Technology, Huainan 232001, China
4
Joint National-Local Engineering Research Centre for Safe and Precise Coal Mining, Anhui University of Science & Technology, Huainan 232001, China
*
Author to whom correspondence should be addressed.
Processes 2023, 11(10), 2934; https://doi.org/10.3390/pr11102934
Submission received: 21 August 2023 / Revised: 18 September 2023 / Accepted: 27 September 2023 / Published: 9 October 2023
(This article belongs to the Section Energy Systems)

Abstract

:
The tectonically deformed coal (TDC) reservoirs with abundant gas resources and low permeability are expected to become one of the target coal seams for carbon dioxide geological storage-enhanced coalbed methane recovery (CO2-ECBM). The pore–fracture structure plays a crucial role in determining the effectiveness of CO2 storage. Fractal analysis provides a valuable approach to quantitatively describe the complex and heterogeneous pore–fracture structures across various scales in coal matrixes. Accordingly, the TDC samples in the Huainan–Huaibei coalfield and primary-undeformed coal (PUC) samples in the Qinshui Basin were selected for pore–fracture structure parameter tests using the mercury intrusion porosimetry (MIP) and low–temperature nitrogen adsorption (LNA) methods. Their multiscale pore–fracture parameters were analyzed using different fractal methods based on pore diameter. According to the fractal results, a multiscale classification standard for pore–fracture structures was devised in this study that is suitable for the controlling gas migration process. A parameter of 8 nm is set as the separating pore diameter for gas migration and storage. It was observed that the connectivity of migration pores (>8 nm) in TDC samples was stronger compared to PUC samples, reflected in larger pore volumes and smaller fractal dimensions. However, its complex development of seepage pores (150–300 nm) may hinder the flow of CO2 injection. As for the storage pores (<8 nm), the fractal dimension of the 2–8 nm pores in TDC was found to be similar to that of PUC but with larger pore volumes. The fractal dimension of the filling pores (<2 nm) in TDC samples was relatively lower, which facilitates efficient gas volume filling. Therefore, the pore–fracture structure of the TDC samples is found to be more advantages for CO2 injection and storage compared to the PUC. This suggests that TDC reservoirs holds promising geological potential for CO2-ECBM implementation.

1. Introduction

Carbon dioxide geological-storage-enhanced coalbed methane recovery (CO2-ECBM) holds bright prospects as it combines greenhouse gas emission reduction with the development of clean fossil energy [1,2,3]. CO2 has a stronger ability to be adsorbed in coal matrixes compared to methane (CH4) [4], which can promote CH4 desorption and production and be adsorbed by coal matrixes [5], with a ratio of approximately 2:1 or greater [6]. The competitive adsorption principle of CO2-CH4 in a coal seam serves as the theoretical foundation for this technology [7,8].
Coal reservoirs are generally characterized by a ternary pore–fracture structure consisting of micropores, mesopores, and macropores, which plays a crucial role in validating the feasibility of CO2-ECBM [9,10,11,12]. When injected, CO2 moves through the coal seam along the natural fractures and macropores and diffuses from the mesopores to the micropores where more than 90% of CH4 adsorbed. Then, the CO2 displaces CH4 from the adsorption sites; the replaced and desorbed CH4 will flow to the production wellbore through the migration channel in the coal [3,13], involving complex aerodynamic processes in coal mines [14,15]. As much as another 20% coalbed methane could potentially be recovered through the application of CO2-ECBM [1]. Larger pore volumes help enhance the capacity for CO2 storage and well-connected pore-structure ensures CO2 injection. Therefore, the coal seam with intact coal structure and developed fractures is the target reservoir for CO2-ECBM implement [7,16]. However, the well-developed fracture networks in highly permeable coal seams may result in the rapid migration and loss of free CO2 along with CH4, once the gas pressure is reduced.
Tectonically deformed coal (TDC) reservoirs, characterized by abundant gas resources and low permeability [17], may have the potential for long-term CO2 storage. The severe tectonic stress experienced alters the macromolecular structure of TDC, leading to the formation of sub-micropores and ultra-micropores and increasing the surface area available for gas adsorption [18]. In the in-situ state, most of the fractures within the TDC reservoir are typically closed due to the existing stress conditions. However, when high-pressure CO2 is injected, the stress disturbance can break the coal matrix and generate a large number of fractures [19,20]. This rapid increase in permeability facilitates the migration of CO2 within the coal reservoir. Subsequently, the adsorption swelling of the coal matrix compresses the pores and fractures under the pressure limitations imposed by reservoir stress [21], which is beneficial for preserving the gas in the reservoir. Therefore, the TDC seam has the geological potential to enable effective storage of CO2. Understanding the pore–fracture structural properties within the TDC seam is crucial in determining its suitability as a target coal seam for CO2-ECBM technology.
However, the pore fracture structure of TDC is more complex and heterogeneous due to tectonic effects. The traditional Euclidean geometry theory is inadequate in accurately describing the complexity and irregularity of pore structure [22,23]. Fortunately, as a typical porous medium, the pore structure of coal exhibits self-similarity in a certain range of pore scales, which means that coal has fractal characteristics like many natural rocks [24,25]. The fractal theory has been widely used to study complicated pore geometries and pore size distribution of porous materials [25,26,27]. The fractal pore structure of the coal matrix is essentially formed by the incomplete filling of the entire internal space with numerous irregular tiny pores. If the pore network completely occupies the internal space, the pore structure transforms into a three-dimensional structure, while it can be reduced to a two-dimensional structure when the pore network is relatively flat and smooth [28].
Several test methods have been employed to investigate the fractal characteristics of the pore structure in coal, including mercury intrusion porosimetry, gas adsorption–desorption, nuclear magnetic resonance, and scattering methods [26,29]. And, some calculation methods are commonly used to determine the fractal dimension of pore–fracture, such as the particle size method, the FHH (Frenkel–Halsey–Hill) model based on the gas adsorption isothermal curve, the Menger sponge model, and thermodynamic methods [30,31]. The pore size distribution in coal exhibits significant variability, ranging from millimeters to nanometers. Pores of different sizes play a crucial role in processes such as gas adsorption–desorption (on the pore surface), diffusion (through nanometer-sized pores), and percolation (through micron-millimeter-sized pores), corresponding to the various calculation methods of fractal dimensions. It is worth noting that a single fractal calculation is insufficient to fully characterize the pores features across all scales in coal.
Accordingly, the typical low permeability TDC samples in the Huainan–Huaibei mining area in Anhui Province and the PUC samples in the Qinshui Basin of Shanxi Province were selected as the research objects in this study. The pore structure parameters of these coal samples were measured using the mercury intrusion porosimetry (MIP) and low-temperature nitrogen adsorption methods (LNA), and their multiscale pore fractal characteristics were analyzed according to different pore diameter classifications, in order to further discuss the controlling effect of pore–fracture structure on the gas migration process during CO2-ECBM and the geological potential of CO2 geological sealing in TDC reservoirs.

2. Experiments and Methods

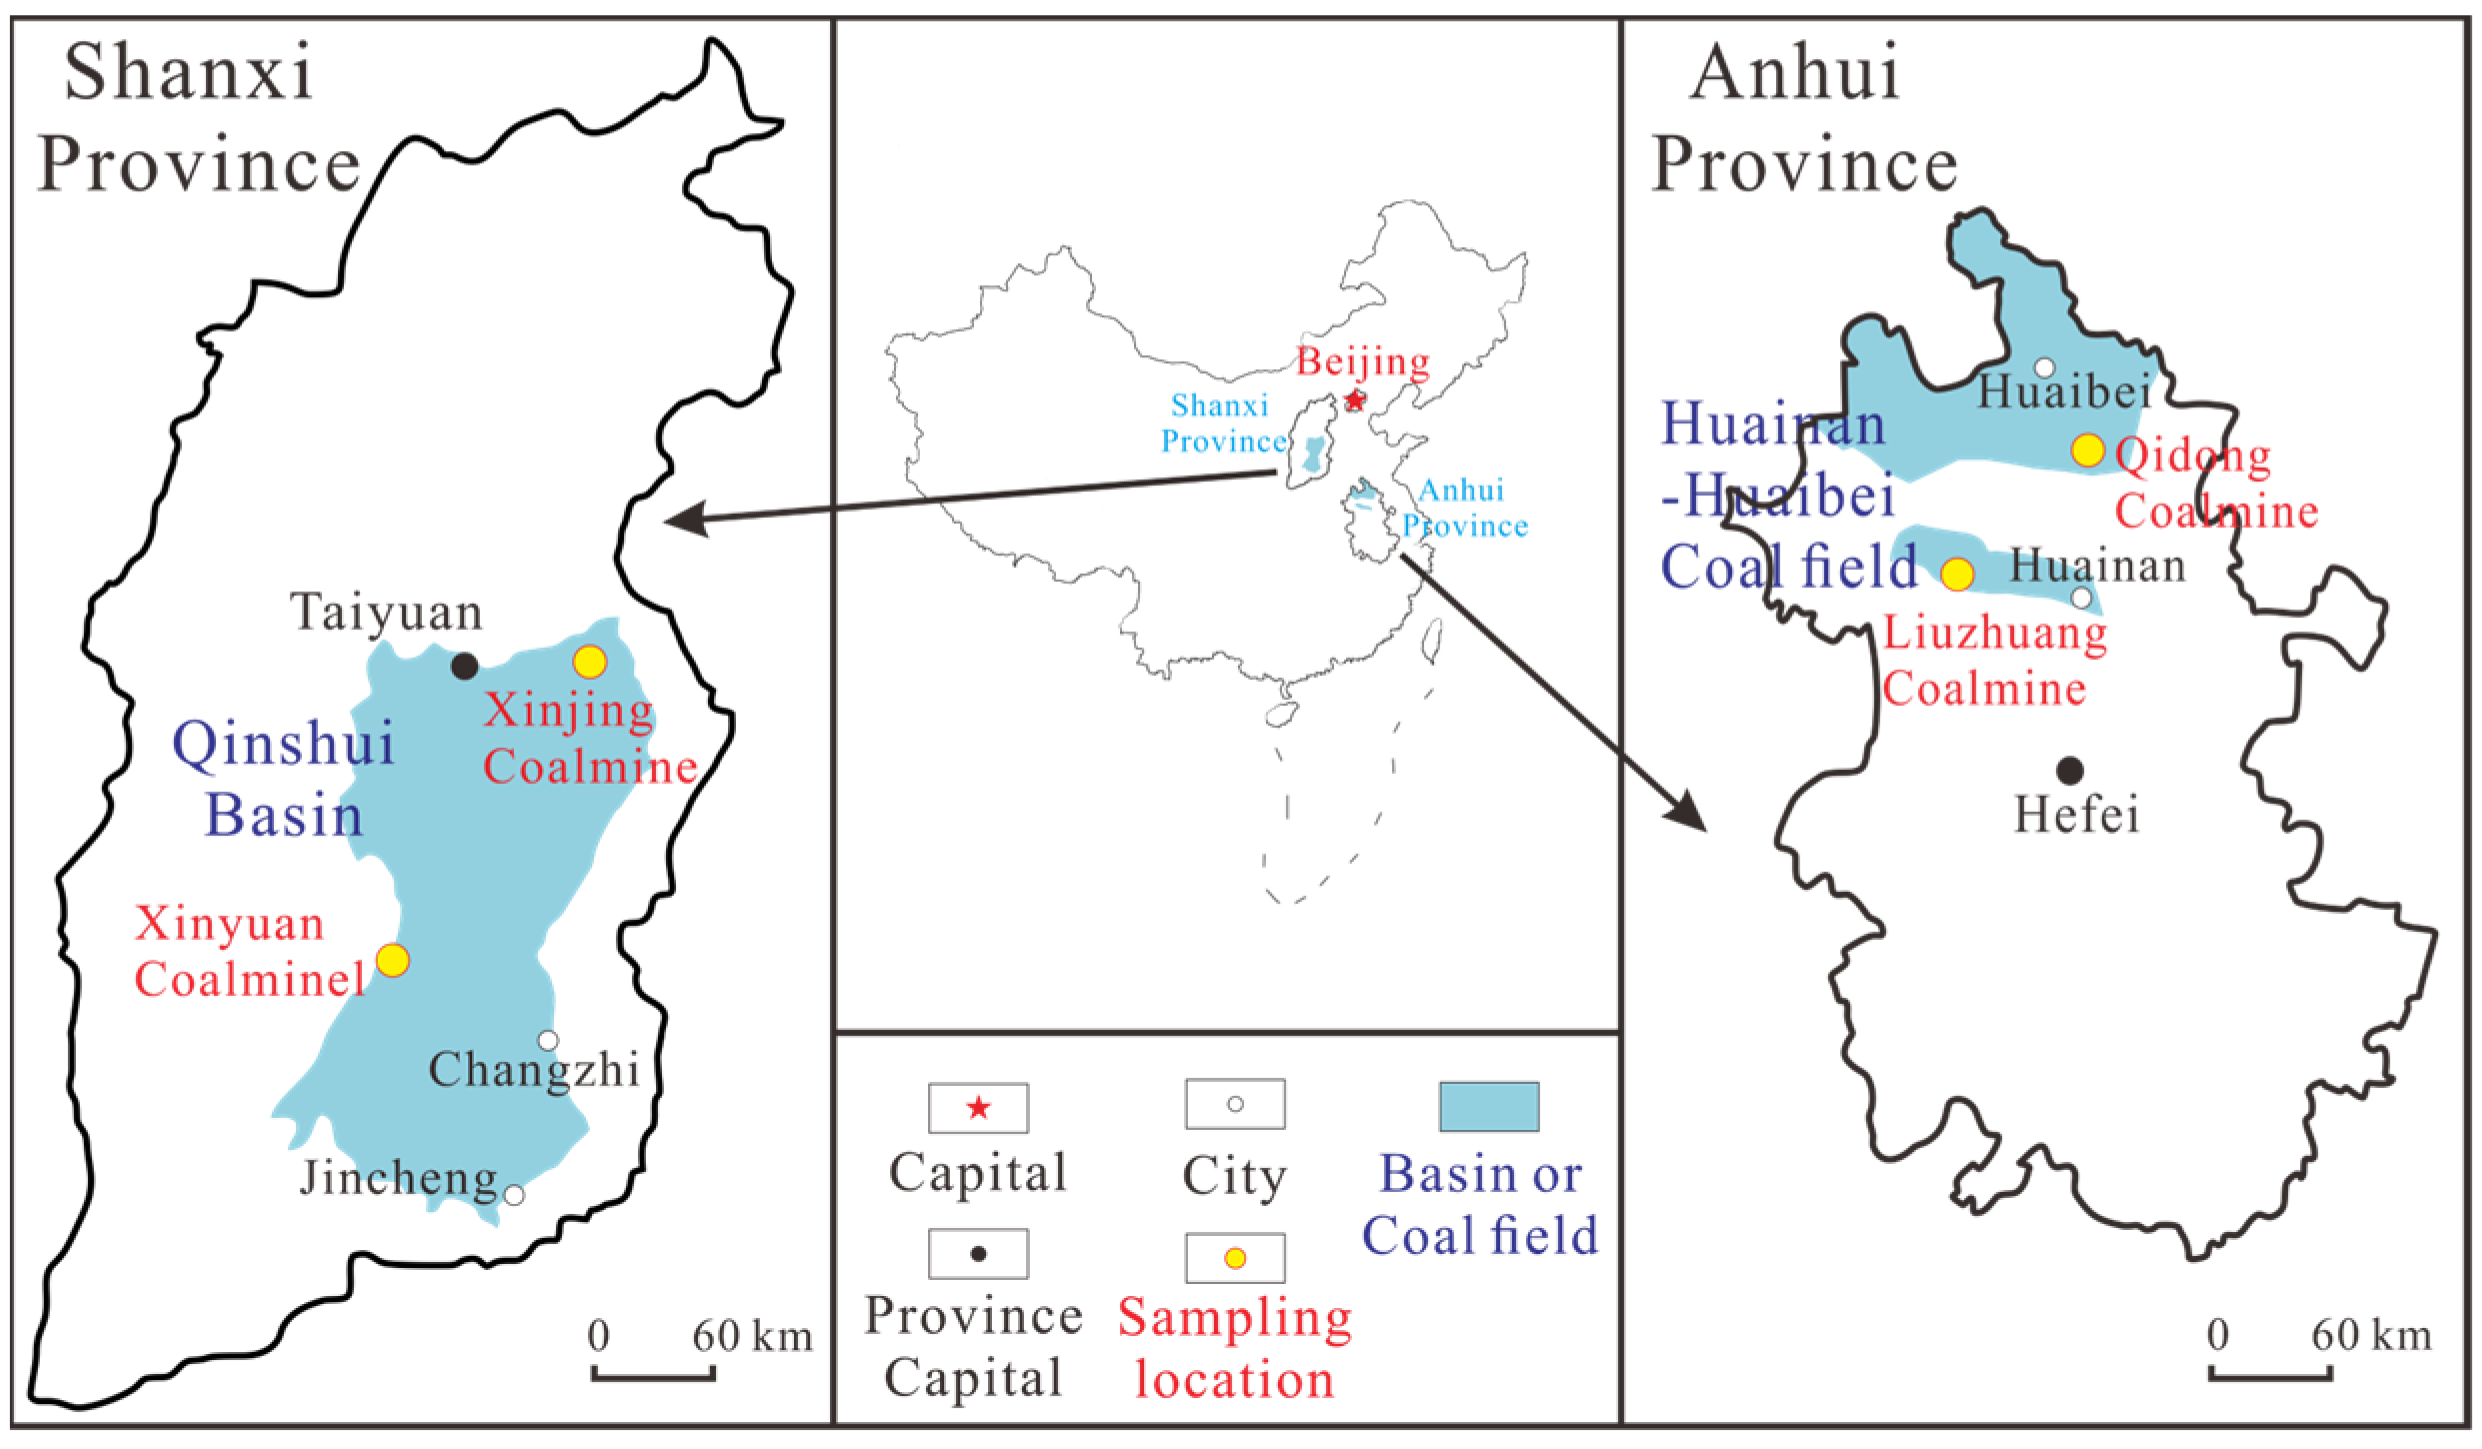
2.1. Samples Information

The Huainan–Huaibei coalfield is considered to be one of the primary coalfields of TDC in China. The TDC samples were taken from coal seam 13-1# at the Liuzhuang Coal Mine in Huainan Coalfield and coal seam 7# at the Qidong Coal Mine in Huaibei Coalfield in Anhui Province. These TDC samples are classified as high-volatile bituminous. On the other hand, the PUC samples were obtained from the Qinshui basin, Shanxi Province, which serves as the first pilot test site for CO2-ECBM engineering in China. The coal samples from the coal seam 3# in the Xinjing mine are classified as high-volatile anthracite coal, and those from the coal seam 2# in Xinyuan mine are classified as low-volatile bituminous coal. The sample locations and information are shown in Figure 1 and Table 1.
The collected PUC samples demonstrate a relatively intact coal matrix, whereas the TDC samples exhibit a fractured coal matrix due to tectonic stress damage. Under overburden conditions, the TDC samples generally display lower porosity and lower permeability compared to the PUC samples. Porosity testing in coal is based on interconnected pores. Compared to the TDC sample, the porosity and permeability of the PUC sample are significantly higher.

2.2. Test Method

The coal matrix contains pore fractures of varying sizes, requiring the utilization of multiscale pore–fracture characterization techniques [32,33], such as low-temperature nitrogen adsorption (LNA), mercury intrusion porosimetry (MIP), and scanning electron microscope (SEM). The pore classification adopts the scheme of the International Union of Pure and Applied Chemistry (IUPAC). Additionally, the fracture is set to more than 1 μm based on outcrop studies and/or microscopic examination of coal samples [34], as shown in Figure 2.
  • Mercury intrusion porosimetry
The mercury intrusion porosimetry (MIP) was performed using an AutoPore IV 9500, manufactured by Micromeritics Instrument, USA, following International Standardization Organization (ISO 15901-1:2005) [32]. Mercury was injected into a bulk coal body of 3 cm3, at pressures ranging from 0.0065 to 271.89 MPa. This allowed for the analysis of pore sizes ranging from 4.33 nm to 226.41 µm judged using the Washburn equation (Equation (1)) [35].
P = 2 σ cos θ r
where r is the pore radius, μm; P is the applied mercury pressure, MPa; σ is the surface tension of mercury, 0.48 N/m; and θ is the contact angle between the coal and mercury, 130°;
  • Low-temperature nitrogen adsorption
The low-temperature nitrogen adsorption (LNA) test can analyze the pore sizes ranging from 0.85 to 150 nm [32,36], covering part of micropores and macropores and all mesopores. The LNA experiment platform uses an automated surface area and pore size analyzer (TriStar II 3020), manufactured by Micromeritics Instrument, USA. The analyses were conducted according to the ISO standards (ISO 15901-2:2006 and ISO 15901-3:2007) [32]. Nitrogen gas was used as the adsorbate at a bath temperature of −195.85 °C. The coal samples were pulverized to a particle size of 45- to 60-mesh (0.25–0.40 mm). The pore distribution was determined using the Barrett–Joyner–Halenda (BJH) equation [37].
Additionally, the morphologies of the pore–fracture structure in the coal samples were examined using an FEI Quanta 250 environmental scanning electron microscopy (ESEM), with a high magnification of 1 million times.

2.3. Calculation Method of Pore Fractal Dimension

Due to the complex processes of sedimentation and diagenesis, the coal matrix typically exhibits an irregular and complex multiscale pore structure [25,38]. Different models for calculating the fractal dimensions were chosen based on the testing method and pore diameter, as shown in Table 2.

2.3.1. Micropore

  • Volume-Specific Surface Area model
The primary adsorption mechanism for microporous adsorbates is micropore filling rather than surface adsorption. Capillary condensation, commonly observed in mesoporous materials, does not occur in microporous materials [39]. Consequently, traditional multilayer adsorption models such as the Frenkel–Halsey–Hill (FHH) model or thermodynamic models are not suitable for describing microporous adsorption behavior. The pore can be approximately assumed to be spherical when its diameter is less than 2 nm. In such cases, the volume-specific surface area model (V-S model) correlates the pore volume and specific surface area of solid porous media and can be employed to calculate the fractal dimension of micropores [38]. Set VMi and SMi as the cumulative pore volume and the cumulative specific surface area of micropores, which are related as follows:
V Mi 1 / 3 S Mi 1 / D mi .
The expression transformed into an equation:
V Mi 1 / 3 = α S Mi 1 / D mi .
Taking natural logarithms on both sides of the equation at the same time:
Ln V Mi = 3 D mi Ln S Mi + k
where k is a constant term and Dmi is a fractal dimension of micropores.
Plotting the gas adsorption isotherm data in terms of ln(SMi) versus ln(VMi), the fractal dimension value can be obtained using the line slope.
  • Polanyi adsorption potential theory
Polanyi adsorption potential theory and pore distribution density function are also common methods to describe the relationship between relative pressure and adsorption capacity of micropore filling [40]. When interpreted thermodynamically, the Polanyi adsorption potential can be expressed as the negative differential free energy of the adsorption:
A = Δ G = R T ln P 0 P
where A is the adsorption potential, kJ/mol; G is the adsorption free energy, kJ/mol; R is the gas constant, 8.314 J/(mol·K); T is the Kelvin temperature, K; and P and P0 are gas adsorption pressure and saturated vapor pressure, MPa.
Since the adsorption process in micropores is internal filling, the pore filling degree (θ) can be used to characterize the adsorption capacity:
θ = V 1 / V 0
where V 1 is the pores filled volume under the balance pressure of p, cm3/g, and V0 is the total volume of micropores, that is, the ultimate adsorption volume when micropores are filled.
Meanwhile, the pore-filling degree (θ) is also a function of adsorption potential (A).
θ = φ A / β
where φ is the porosity of coal, %, and β is the scale factor (similarity constant), which is related to the adsorbent.
Assuming that the pore distribution of coal micropores follows a Gaussian (normal) distribution, the above formula can be rewritten as
θ = V 1 V 0 = e K A β 2 .
Combined with the expression of adsorption potential (Equation (5)), the Dubinin–Radushkevich (D-R) equation can be obtained.
V 1 = V 0 e K R T β 2 ln P 0 P 2
K is a pore characteristic parameter, which can characterize the development of micropores in coal.
Taking natural logarithms on both sides of the equation:
ln V 1 = ln V 0 D ln P 0 P 2
where D = K R T β 2 is the parameters describing the relative pressure to the gas volume of micropore filling. Plot the gas adsorption isotherm data in terms of ln P 0 P vs. ln V 1 . The parameter D can be obtained as it represents the line slope. It can characterize the development of micropores under the same adsorbent and temperature.

2.3.2. Mesopore

During the LNA test, the adsorption volume of nitrogen on the coal matrix surface is a function of relative pressure (P/P0) on the adsorption equilibrium [12]. Meanwhile, the pore size corresponding to the P/P0 can be calculated by using the Kelvin equation [32,41]:
r = 2 γ M ρ R T ln P 0 / P
where γ is the surface tension; M is the molar mass; ρ is the density; R is the universal gas constant; and T is the thermodynamic temperature.
The FHH model is a widely used method based on capillary condensation theory to analyze the adsorption process of gas molecules on the surface of adsorbents. It is particularly suitable for characterizing the gas adsorption behavior of at the mesoporous scale [30,32,42] and commonly employed as a fractal dimension calculation method based on LNA data [43,44]. The relationship between the adsorption capacity and the relative pressure can be expressed as follows:
V Me V m = N N m R T ln P 0 P 1 s
where VMe is the adsorbed gas volume at the equilibrium pressure P; Vm is the volume of a monolayer cover of gas; N is the number of molecules adsorbed at the equilibrium pressure P; Nm is the number of gas molecules in the monolayer; and S is a parameter characterizing pore structure.
Taking natural logarithms on both sides of the equation:
ln V Me = α ln ln P 0 P + C .
In the late stage of N2 adsorption, the interface is controlled by the capillary condensation forces; the fractal dimension D me can be calculated using α = (Dme − 3) [25]. That is,
ln V Me = ( D me 3 ) ln ln P 0 / P + C
where D me can be calculated based on the slope K of lnVMe vs. ln ln P 0 / P . The value of D me in the coal matrix ranges from 2 to 3; the closer to 3, the rougher the inner surface of pores.

2.3.3. Macropore

The MIP method is used to evaluate the part of mesopores and nearly all macropores [30,41]. The Menger sponge model is a common method for calculating the pore’s fractal dimension in porous media [30,45]. The pore size distribution, dVM/dr, is related to the surface fractal dimension Dm:
ln d V M d r ( 2 D m ) ln ( r ) .
Combined with Equation (1), this equation can be used to obtain the surface fractal dimension from the slope of the ln(dV/dP) vs. ln(P), where Dm = 4 + Slope. That is,
ln d V M d r D m 4 ln P
where VM is the cumulative intrusion volume of mercury, cm3/g; Dm represents the fractal dimension based on MIP.

2.3.4. Average Tortuosity

As a typical porous medium, numerous pores in the coal matrix form complex fluid migration channels [46]. The pore space of the coal matrix is assumed to be composed of capillary bundles, and the complexity of capillary bundles can be quantitatively characterized using the capillary average tortuosity fractal dimension (DT) [47,48]:
D T = 1 + ln T a v / ln L m 2 r a v
where Tav is the average tortuosity of capillaries; rav is the average capillary radius, μm; and Lm is the characteristic length of capillary in two-dimensional space.
T a v = 1 2 1 + 1 2 1 φ + 1 φ 1 1 φ 1 1 φ 1 2 + 1 4 ,
L m = 1 φ φ π D f r max 2 2 D f
where φ is the porosity, %, and rmax is the maximum pore throat radius, μm; D f is the pore fractal dimension based on the MIP and it can be determined using the logarithmic curve between the cumulative pore volume fraction (Vc) and mercury entry pressure (P). A larger value of D f means a more complex pore structure and worse connectivity.
ln V c = D f 3 ln P D f 3 ln P min
where Vc = V/Vmax; V is the cumulative pore volume at the mercury pressure of P, Vmax is the maximum cumulative pore volume, and Pmin is the minimum mercury intrusion pressure.

3. Experimental Results and Analyses

3.1. Experimental Results

3.1.1. Test Results of LNA

The pore volume distribution in these coal samples based on the LNA test is shown in Figure 3. These coal samples exhibit similar ratios of pore volumes for each type of pore smaller than 100 nm. Transition pores have the highest proportion, followed by macropores and micropores. Except for the micropores in the QD sample, the total pore volume and each type of pore volume in the TDC samples are larger than in the PUC samples, indicating that the tectonic modification promotes the formation of pores in the coal matrix.
During the process of nitrogen adsorption and desorption, it is common to observe the formation of adsorption–desorption loops [12]. These loops can be the result of overlapping or dissociation phenomena and are often observed in cylindrical pores with openings at both ends, ink bottle-shaped pores, and slit-plate-shaped pores, according to the IUPAC classification standard. As shown in Figure 4, the curves for the XY and QD samples appear relatively smooth, with a high degree of coincidence indicating better pore connectivity. In contrast, the XJ and LZ samples exhibit relatively poor pore connectivity. It is worth noted that the LZ sample demonstrates an inflection point in the adsorption–desorption loop at a relative pressure region of approximately 0.5 (corresponding to a pore size of 4 nm). This inflection point means a sharp decrease in adsorption capacity after significantly reducing the gas pressure due to the weak pore connectivity in the coal sample [49].

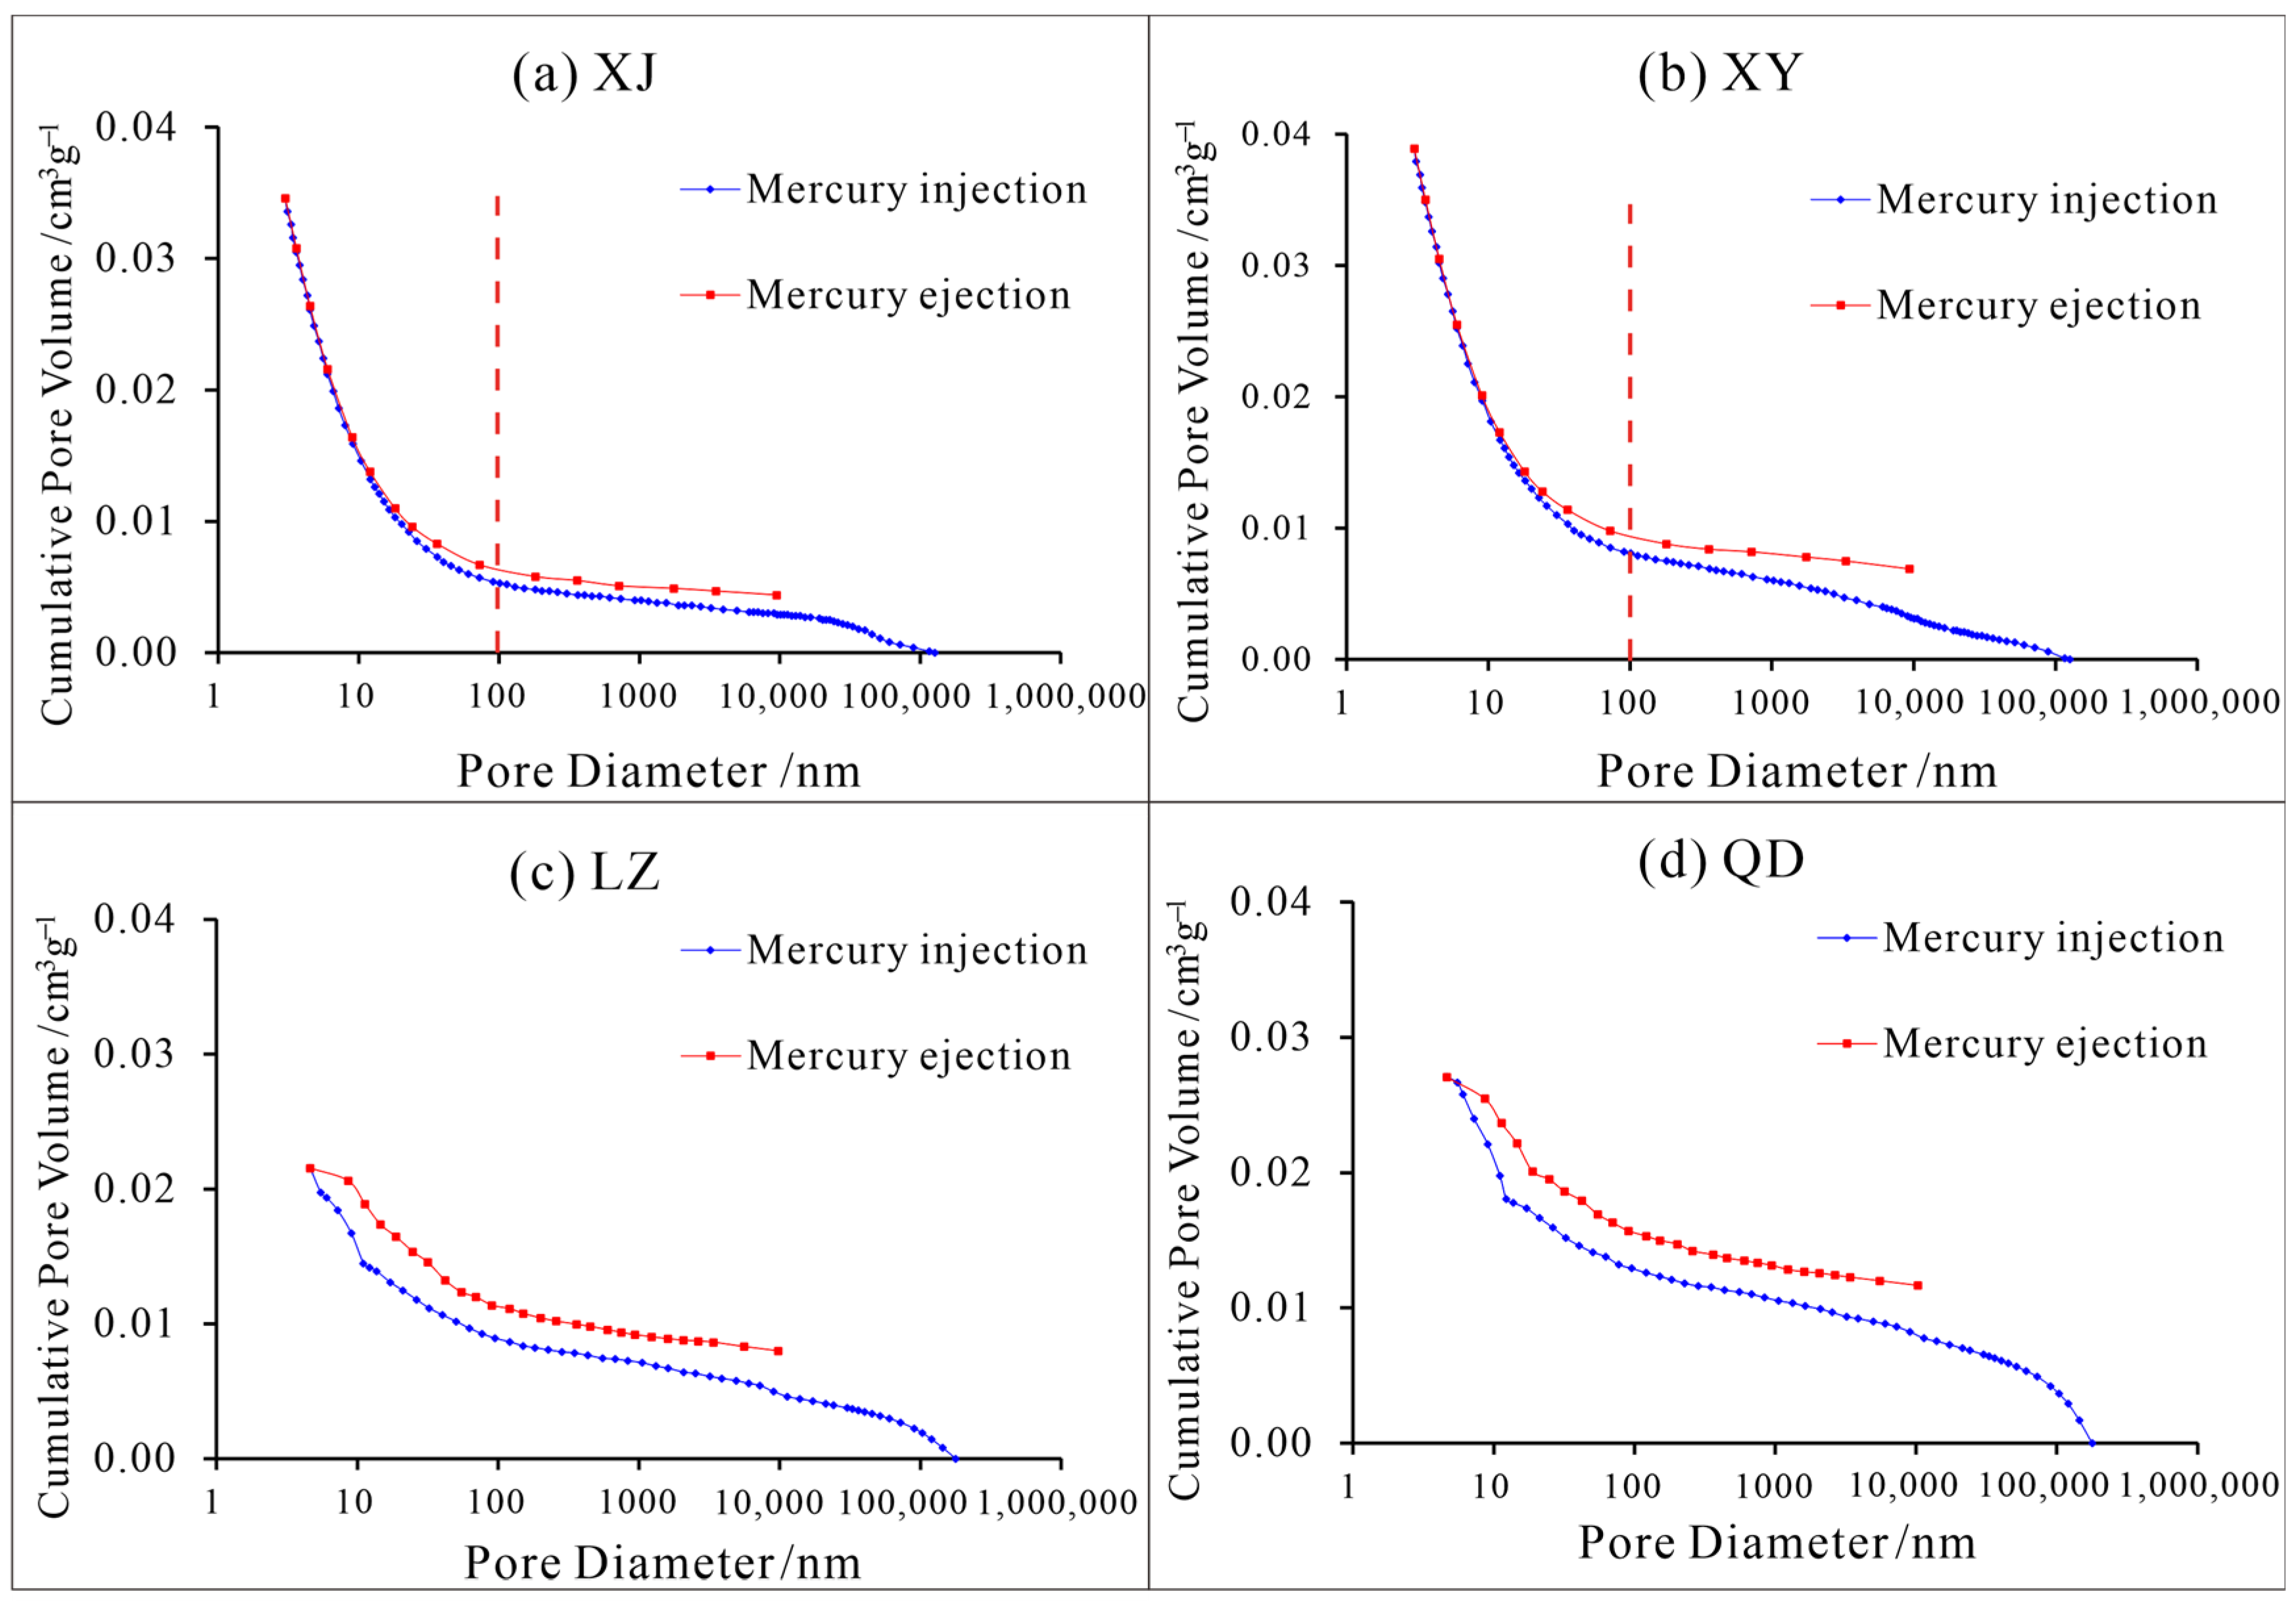
3.1.2. Test Results of MIP

The results obtained from MIP are shown in Figure 5. The total pore volumes of the PUC samples are larger than that of the TDC samples for pore diameters larger than 4.5 nm. The major difference in the pore volume of PUC and TDC lies in the transition pore region, while the volume of large pores (50–1000 nm) remains similar. This finding contrasts with the results obtained from LNA, which can be attributed to the different sample specifications used in the two methods. The bulk coal samples were used in MIP test, which measures the mercury volumes that enter the coal samples. Since the test focuses on connected pores, this results in a higher measured volume of transitional pores in the PUC samples. However, powdered coal samples are used in the LNA test. During the sample preparation, the originally closed micropores and transition pores formed by tectonic action in TDC were opened up to increase the pore volumes.
Similarly, in the coal samples containing semi-connected ink-bottle pores or narrow-necked bottle pores, it becomes difficult for the mercury to exit after invading these narrow pores, resulting in the hysteresis loop of the mercury injection–ejection curves. The hysteresis loop represents pore connectivity, where a higher curve fit degree indicates better pore connectivity [19,45]. The mercury injection–ejection curves for the coal samples are shown in Figure 6. It can be observed that the PUC samples generally exhibit good pore connectivity, especially with a high fit degree within the pore diameters smaller than 100 nm. In contrast, the TDC samples show lower pore connectivity compared to the PUC, as indicated by the mercury ejection curve lagging behind the injection curve.

3.2. Calculation Results of Multiscale Pore Fractal Dimensions

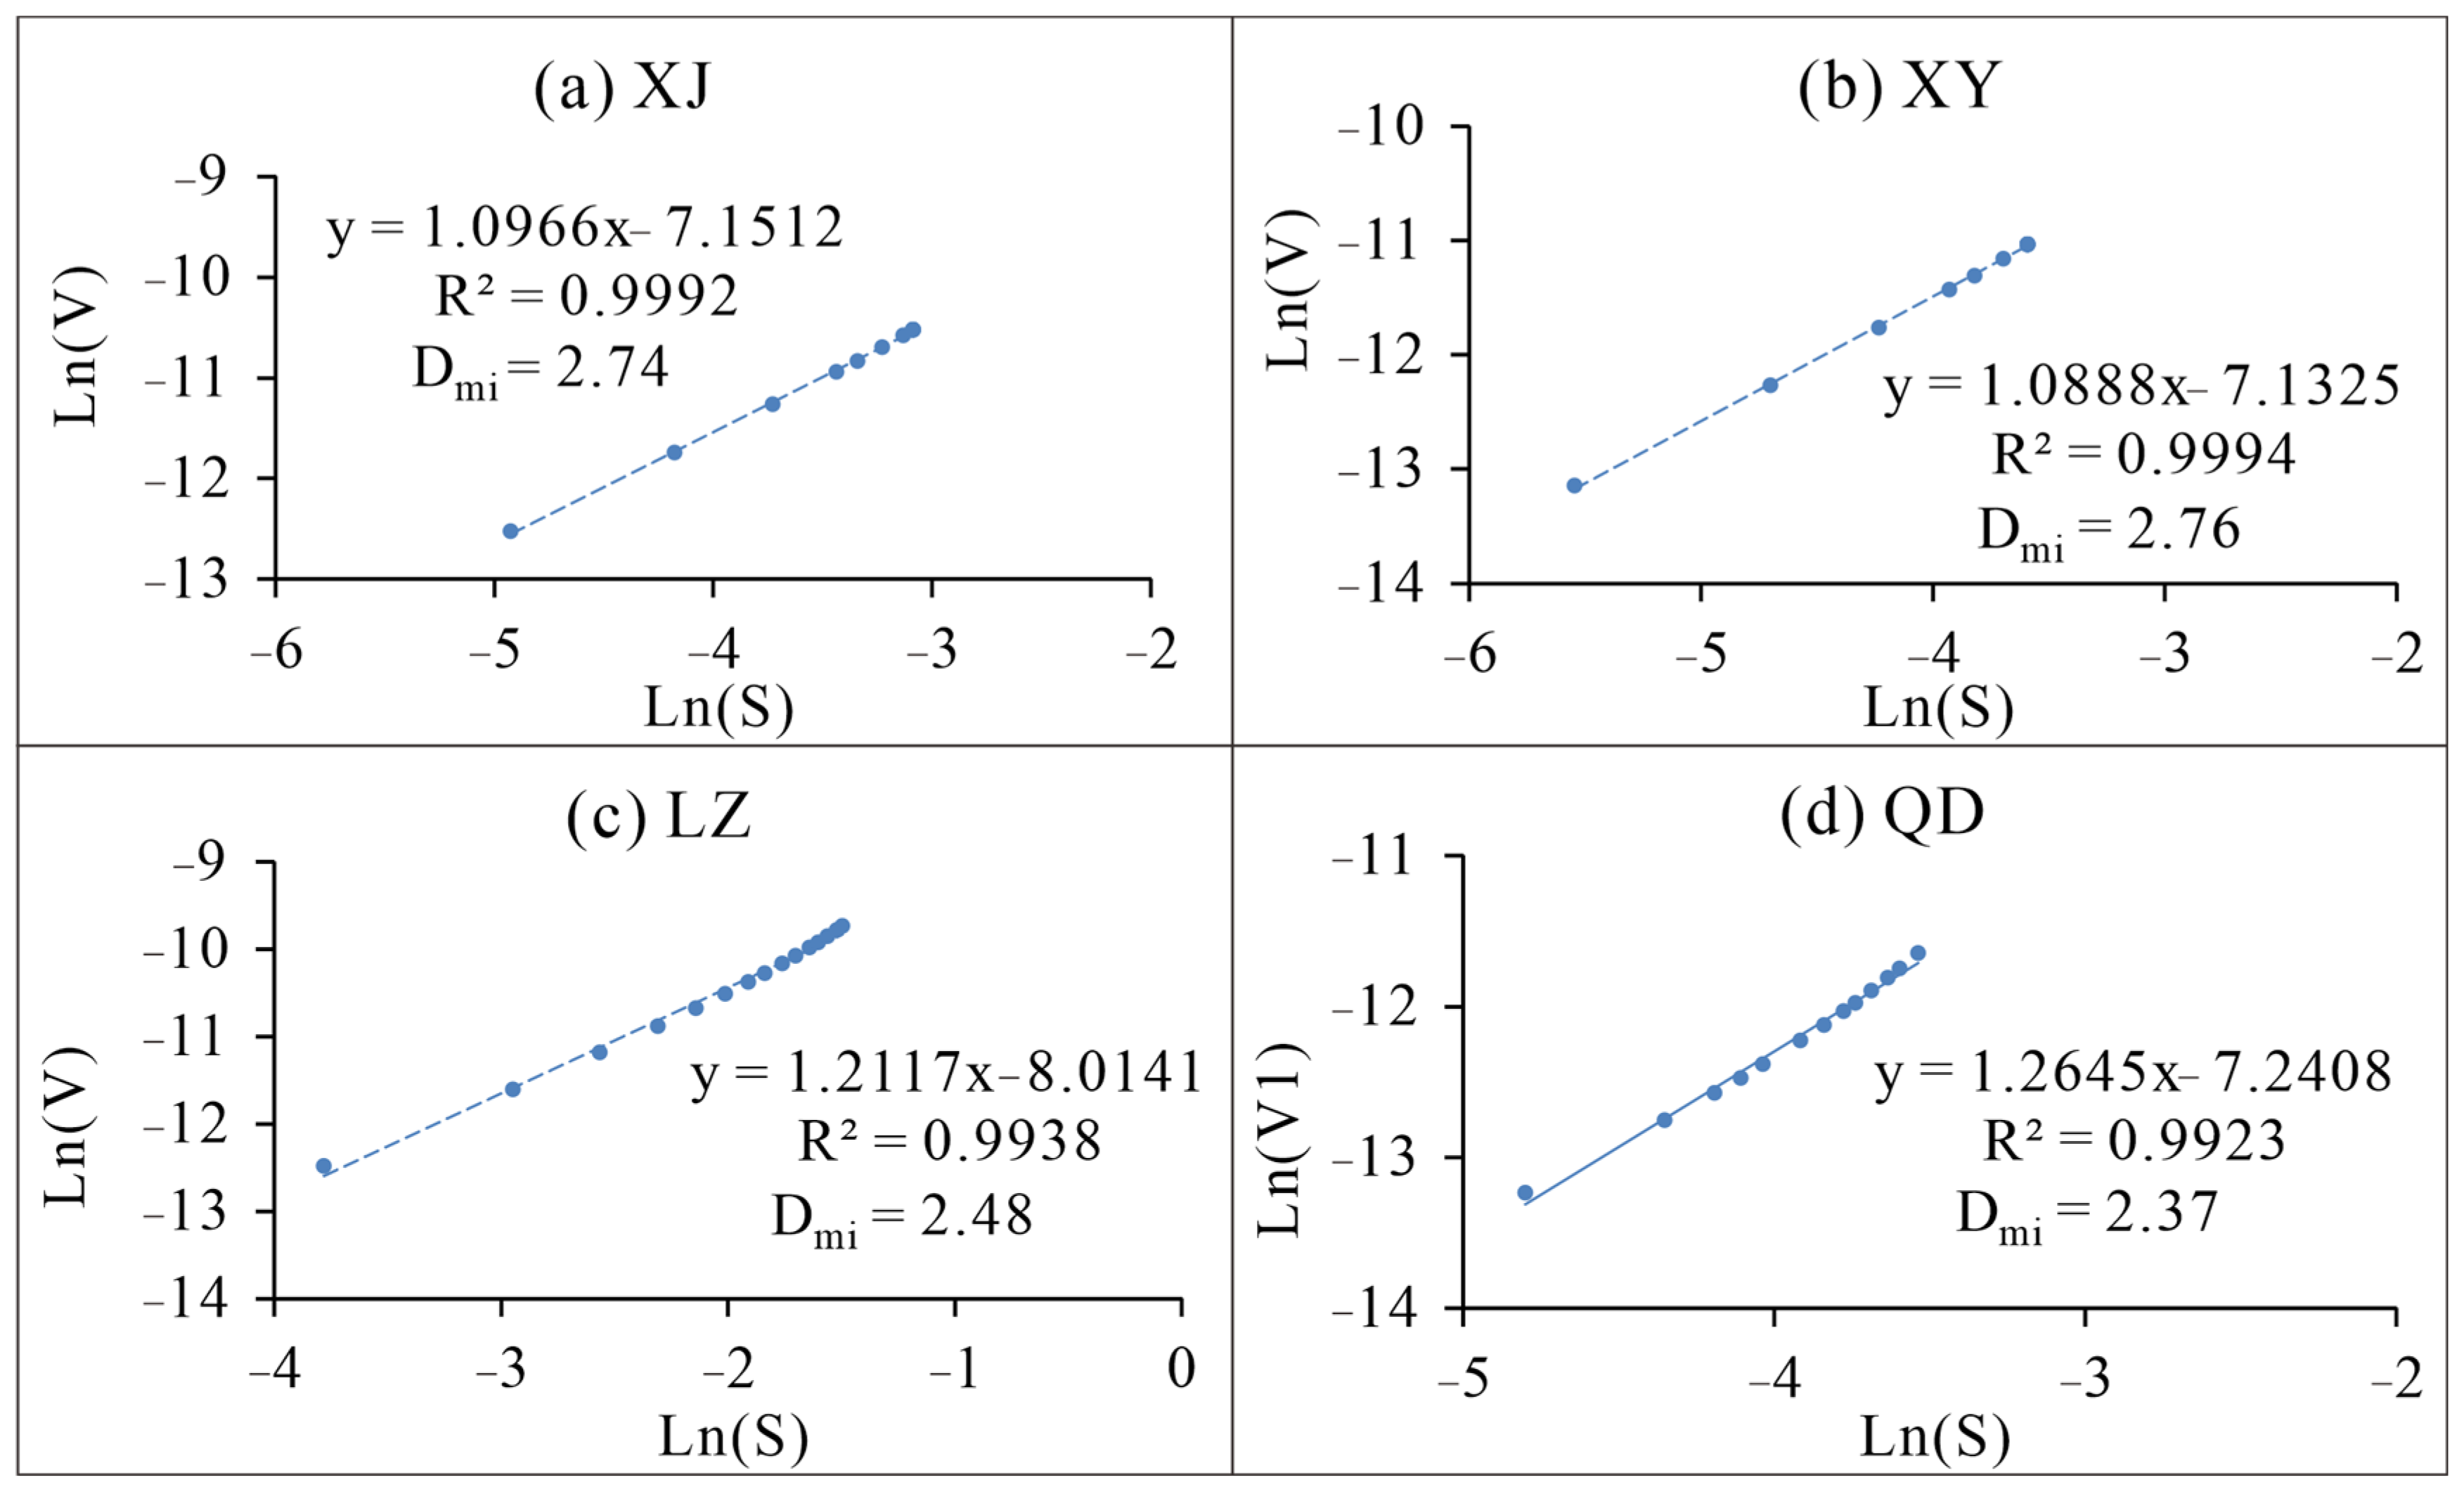
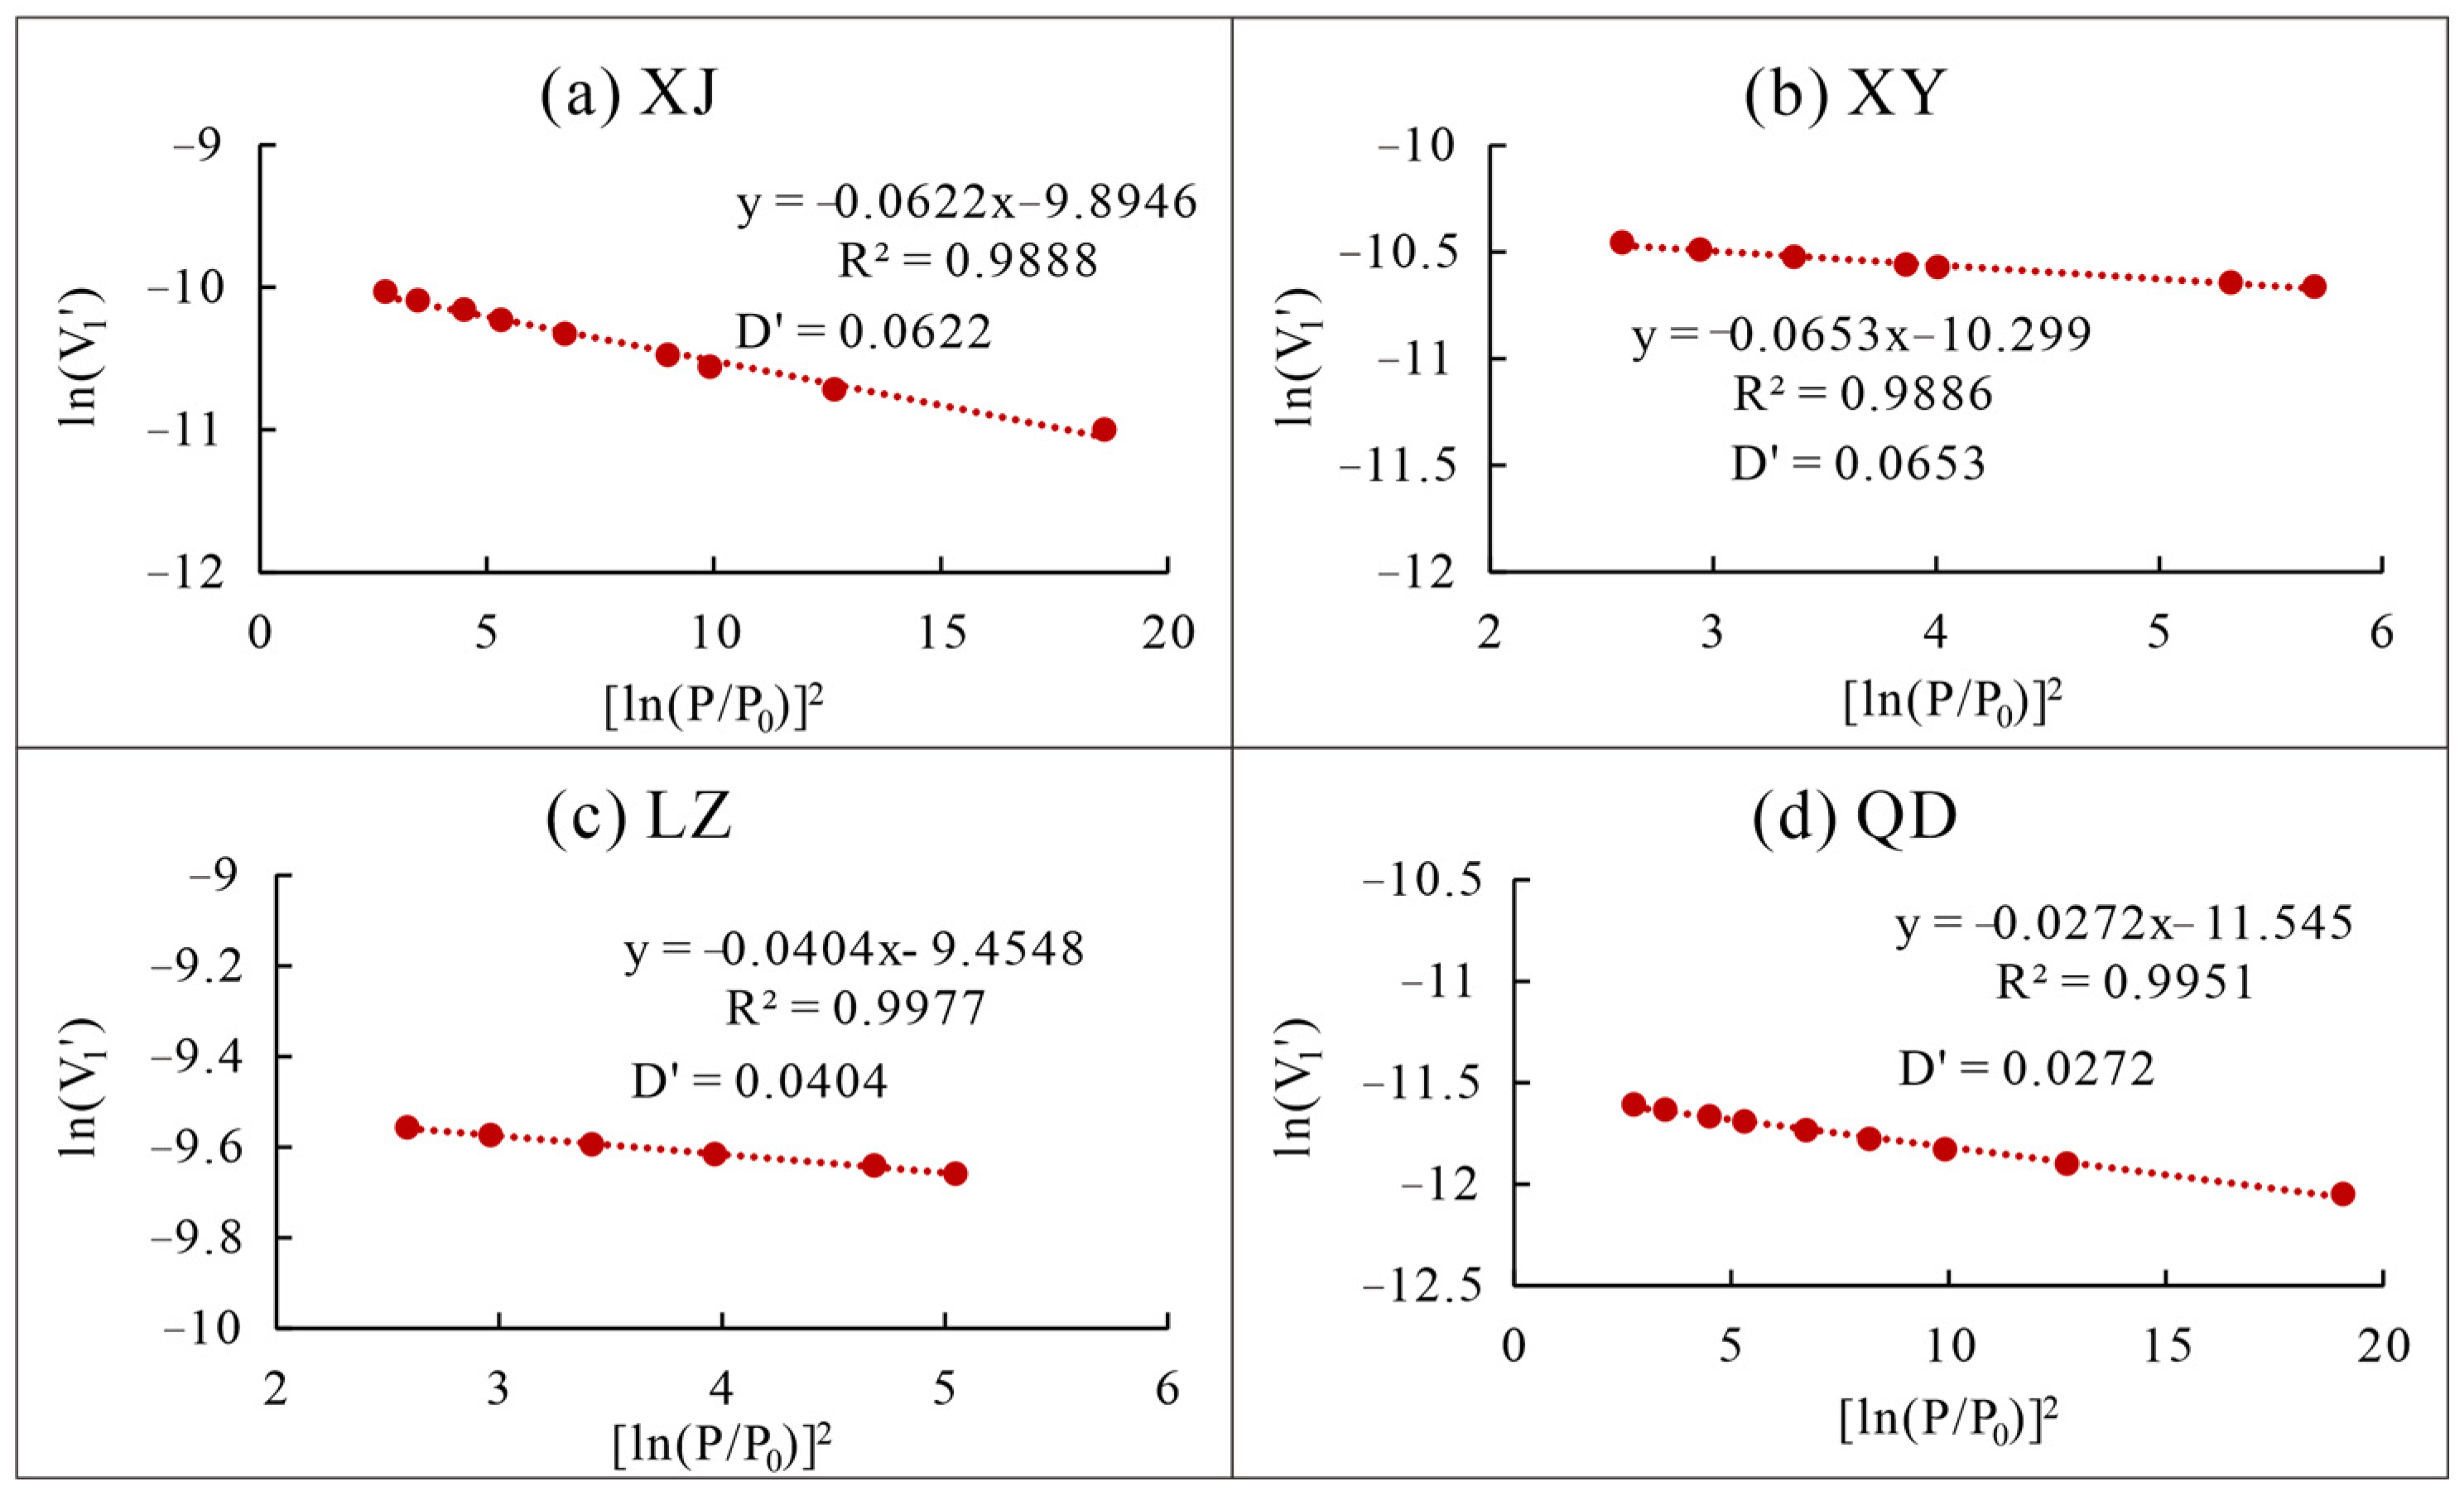
3.2.1. Fractal Results of Micropore

The fractal analysis was performed on the micropores of the coal samples using the V-S model based on the LNA data, as shown in Figure 7. The micropore fractal dimensions of both the PUC and TDC samples range from 2.37 to 2.76. The coefficient of determination (R2) is above 0.99, indicating the distinct fractal characteristics within the micropores and a good fit degree of the fractal model. The PUC samples exhibited relatively high fractal dimensions of 2.76 and 2.74, implying a relatively complex pore structure within the micropore scale. Although the TDC samples have a large micropore volume (Figure 3), their pore complexity is relatively lower, with fractal dimensions of 2.48 and 2.37, respectively.
Based on the D-R equation, a clear linear relationship is observed between the logarithm of the micropore adsorption gas volume ( P 0 P ) and the relative pressure ( V 1 ). This relationship was plotted in Figure 8 and the resulting slope ( D ) and maximum adsorption volume (V0) were calculated. It is evident that the PUC samples exhibit higher slope values of D , measured at 0.0622 and 0.0653, compared to the values of 0.0404 and 0.0272 for the TDC samples.
As shown in Figure 9, the fractal dimension (Dmi) has a linear relationship with the pore parameter (D′). That is, when the fractal dimension (Dmi) of the micropores increases, the pore structure becomes more complex, increasing pore parameters (D′). This finding suggests that the V-S model provides a similar description of micropores compared to the analysis method based on the adsorption potential theory.
Furthermore, the maximum adsorption volume (V0) was calculated based on the D-R equation and, thus, the corresponding pore-filling degree (θ) was also determined. As shown in Figure 10, the coal sample with a larger micropore volume (Figure 3) has a greater maximum pore-filling volume. The θ values of the XJ, XY are smaller than that of LZ and QD samples, which can be attributed to the complex microporous structure of PUC that hinders the gas filling.

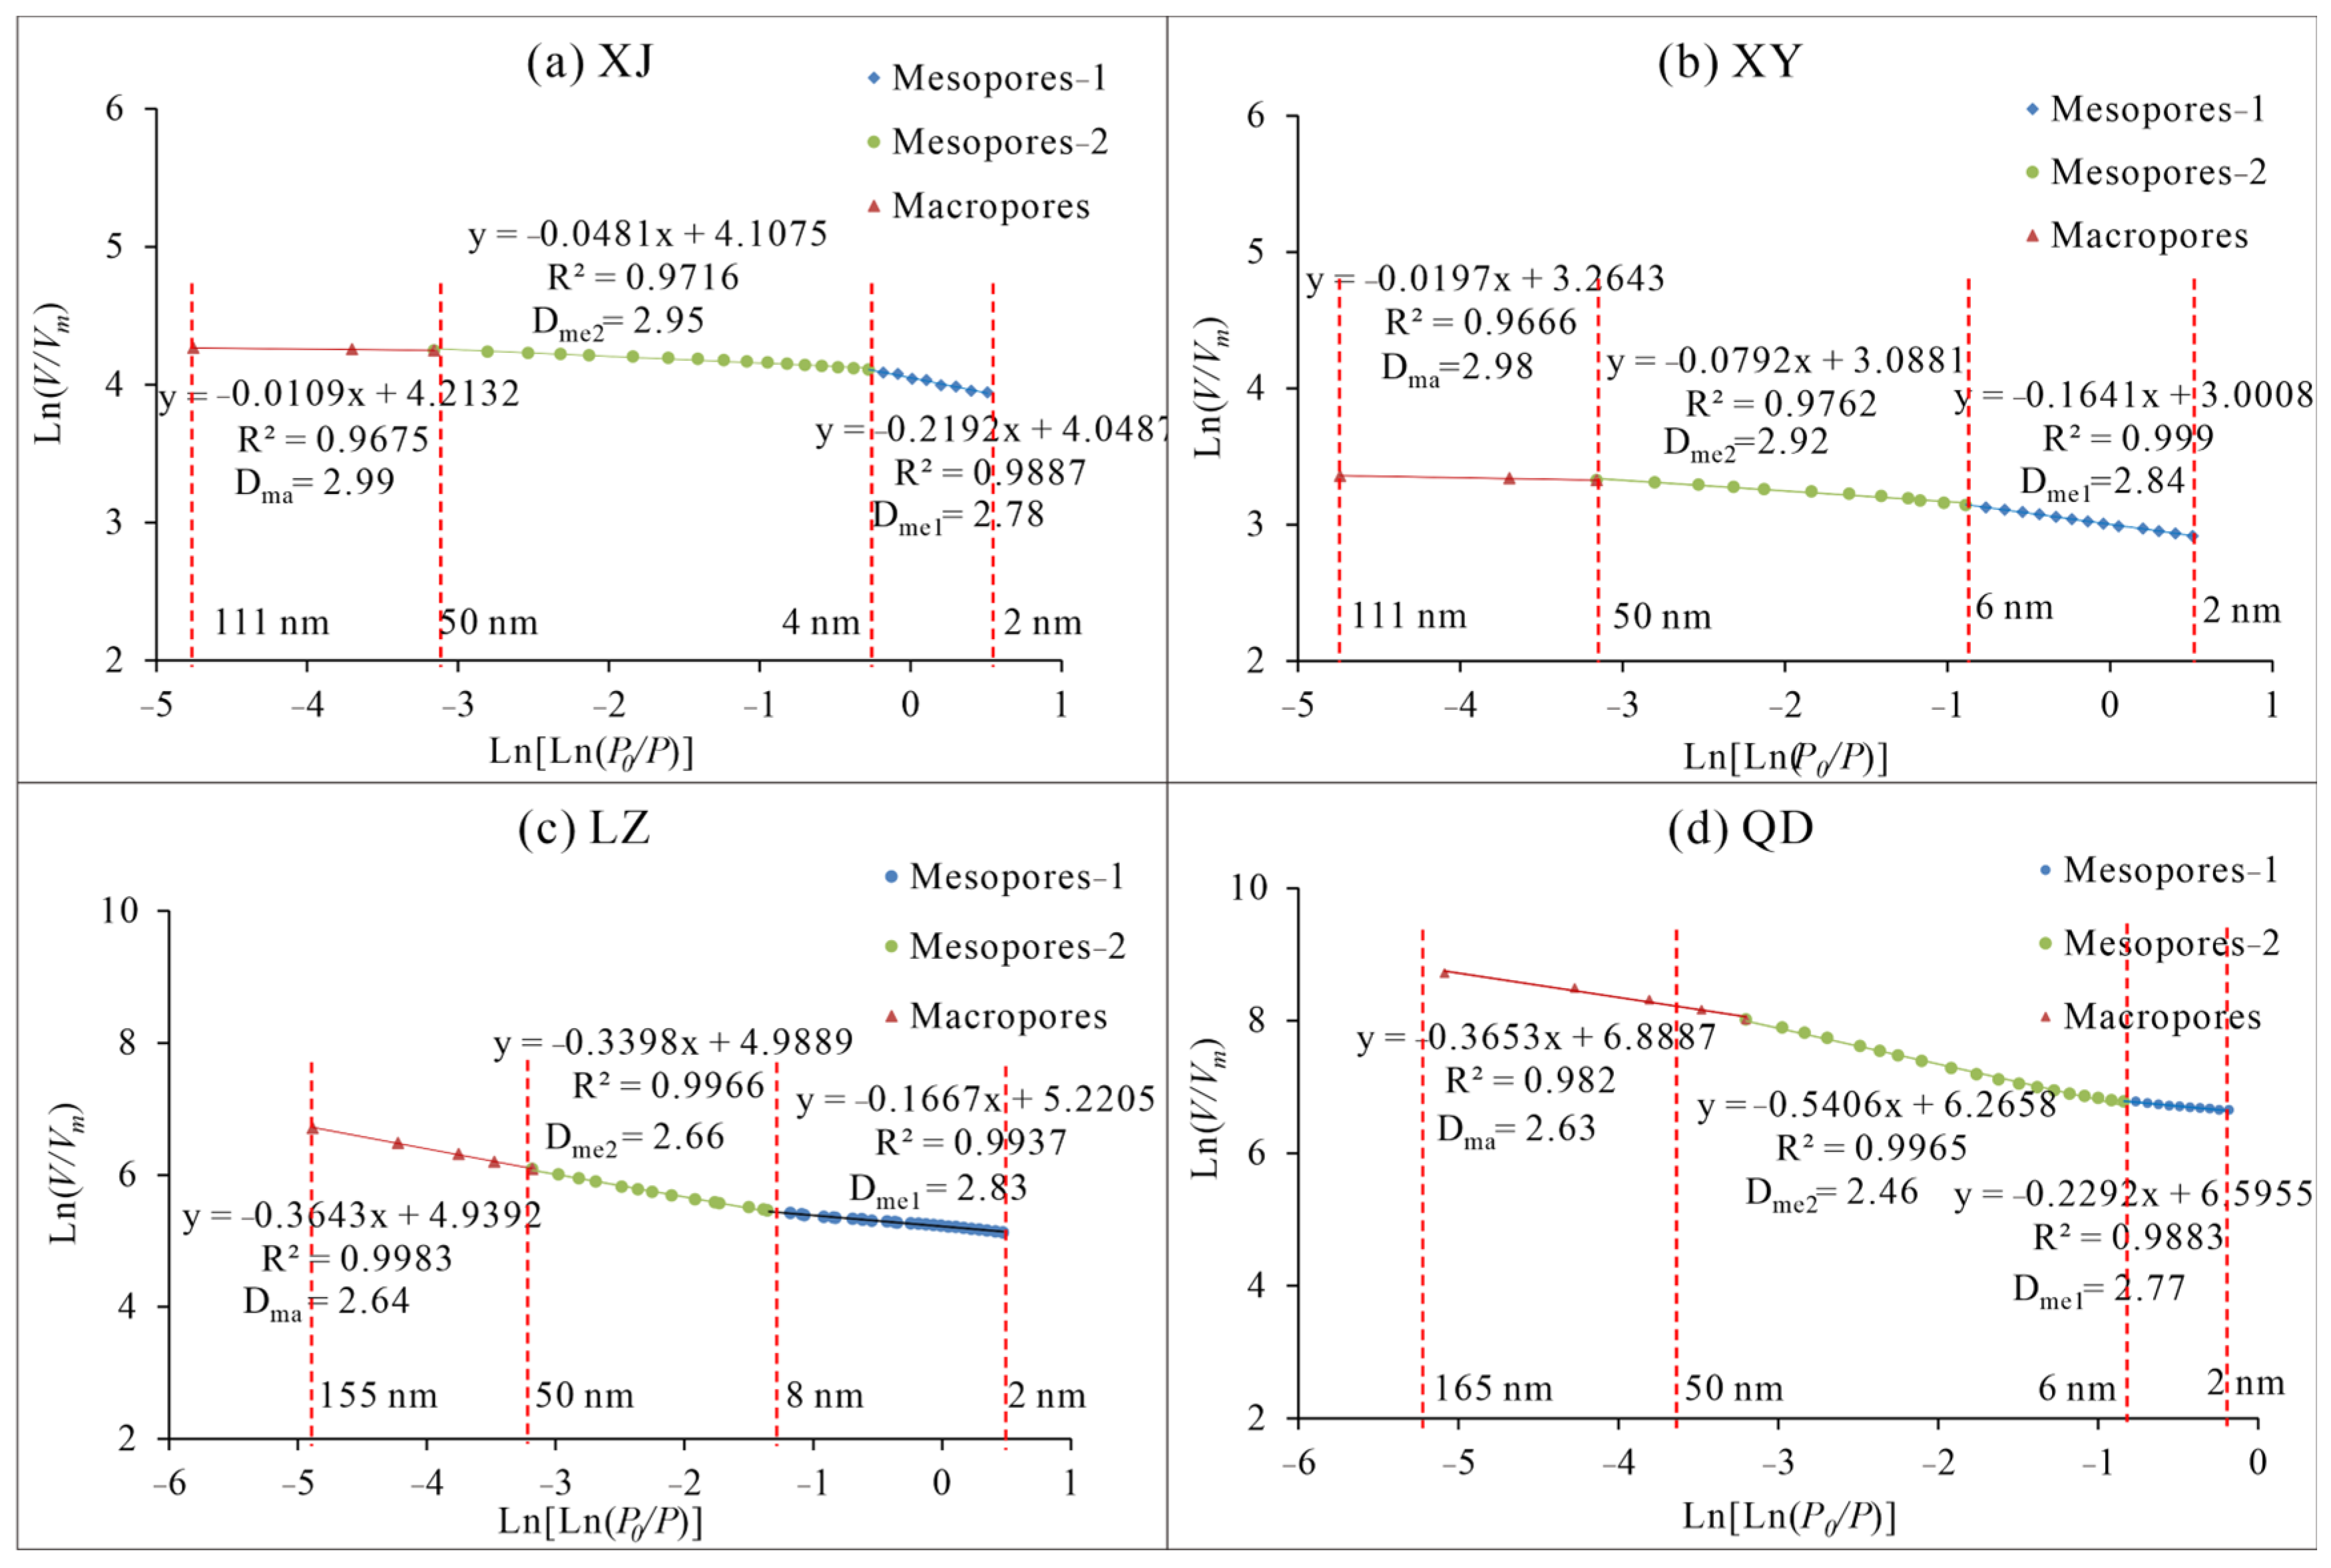
3.2.2. Mesopores and Part of Macropores

The fractal dimensions of pores larger than 2 nm were calculated using the Frenkel–Halsey–Hill (FHH) model based on the data of LNA, as shown in Figure 11. The regression graph shows a segmented trend in the distribution of data points, which were fitted separately to determine the slopes and fractal dimensions. In the meanwhile, the Kelvin equation (Equation (11)) was used to calculate the separation pore diameters range from 4 to 8 nm.
As shown in Table 3, the fractal dimension of all types of pores in different coal samples falls within the range of 2 to 3, with a high R2 exceeding 0.96. This indicates that the FHH model can accurately describe the development characteristics of mesopores and some macropores. According to the fractional fractal results of mesopores, the fractal dimensions of the small mesopore diameter range of 2–8 nm in all samples are relative high, ranging from 2.78 to 2.85. This suggests that the pores possess a high degree of complexity. Moreover, in the mesopore range of 8–50 nm, the fractal dimensions of the XJ and XY samples increase to 2.95 and 2.92, respectively. These values are significantly higher than the LZ and QD samples, which are 2.66 and 2.46, respectively. The complex pore structure of the PUC samples in 8–50 nm may potentially hinder gas migration.
In addition, the FHH fractal method also exhibits a good fit degree for characterizing the pore structure in the macropore stage of 50–165 nm, with a R2 above 0.96. The fractal dimension of the macropores at this stage is similar to that of the mesopores within 8–50 nm, remaining high in the PUC samples and larger than TDC samples.

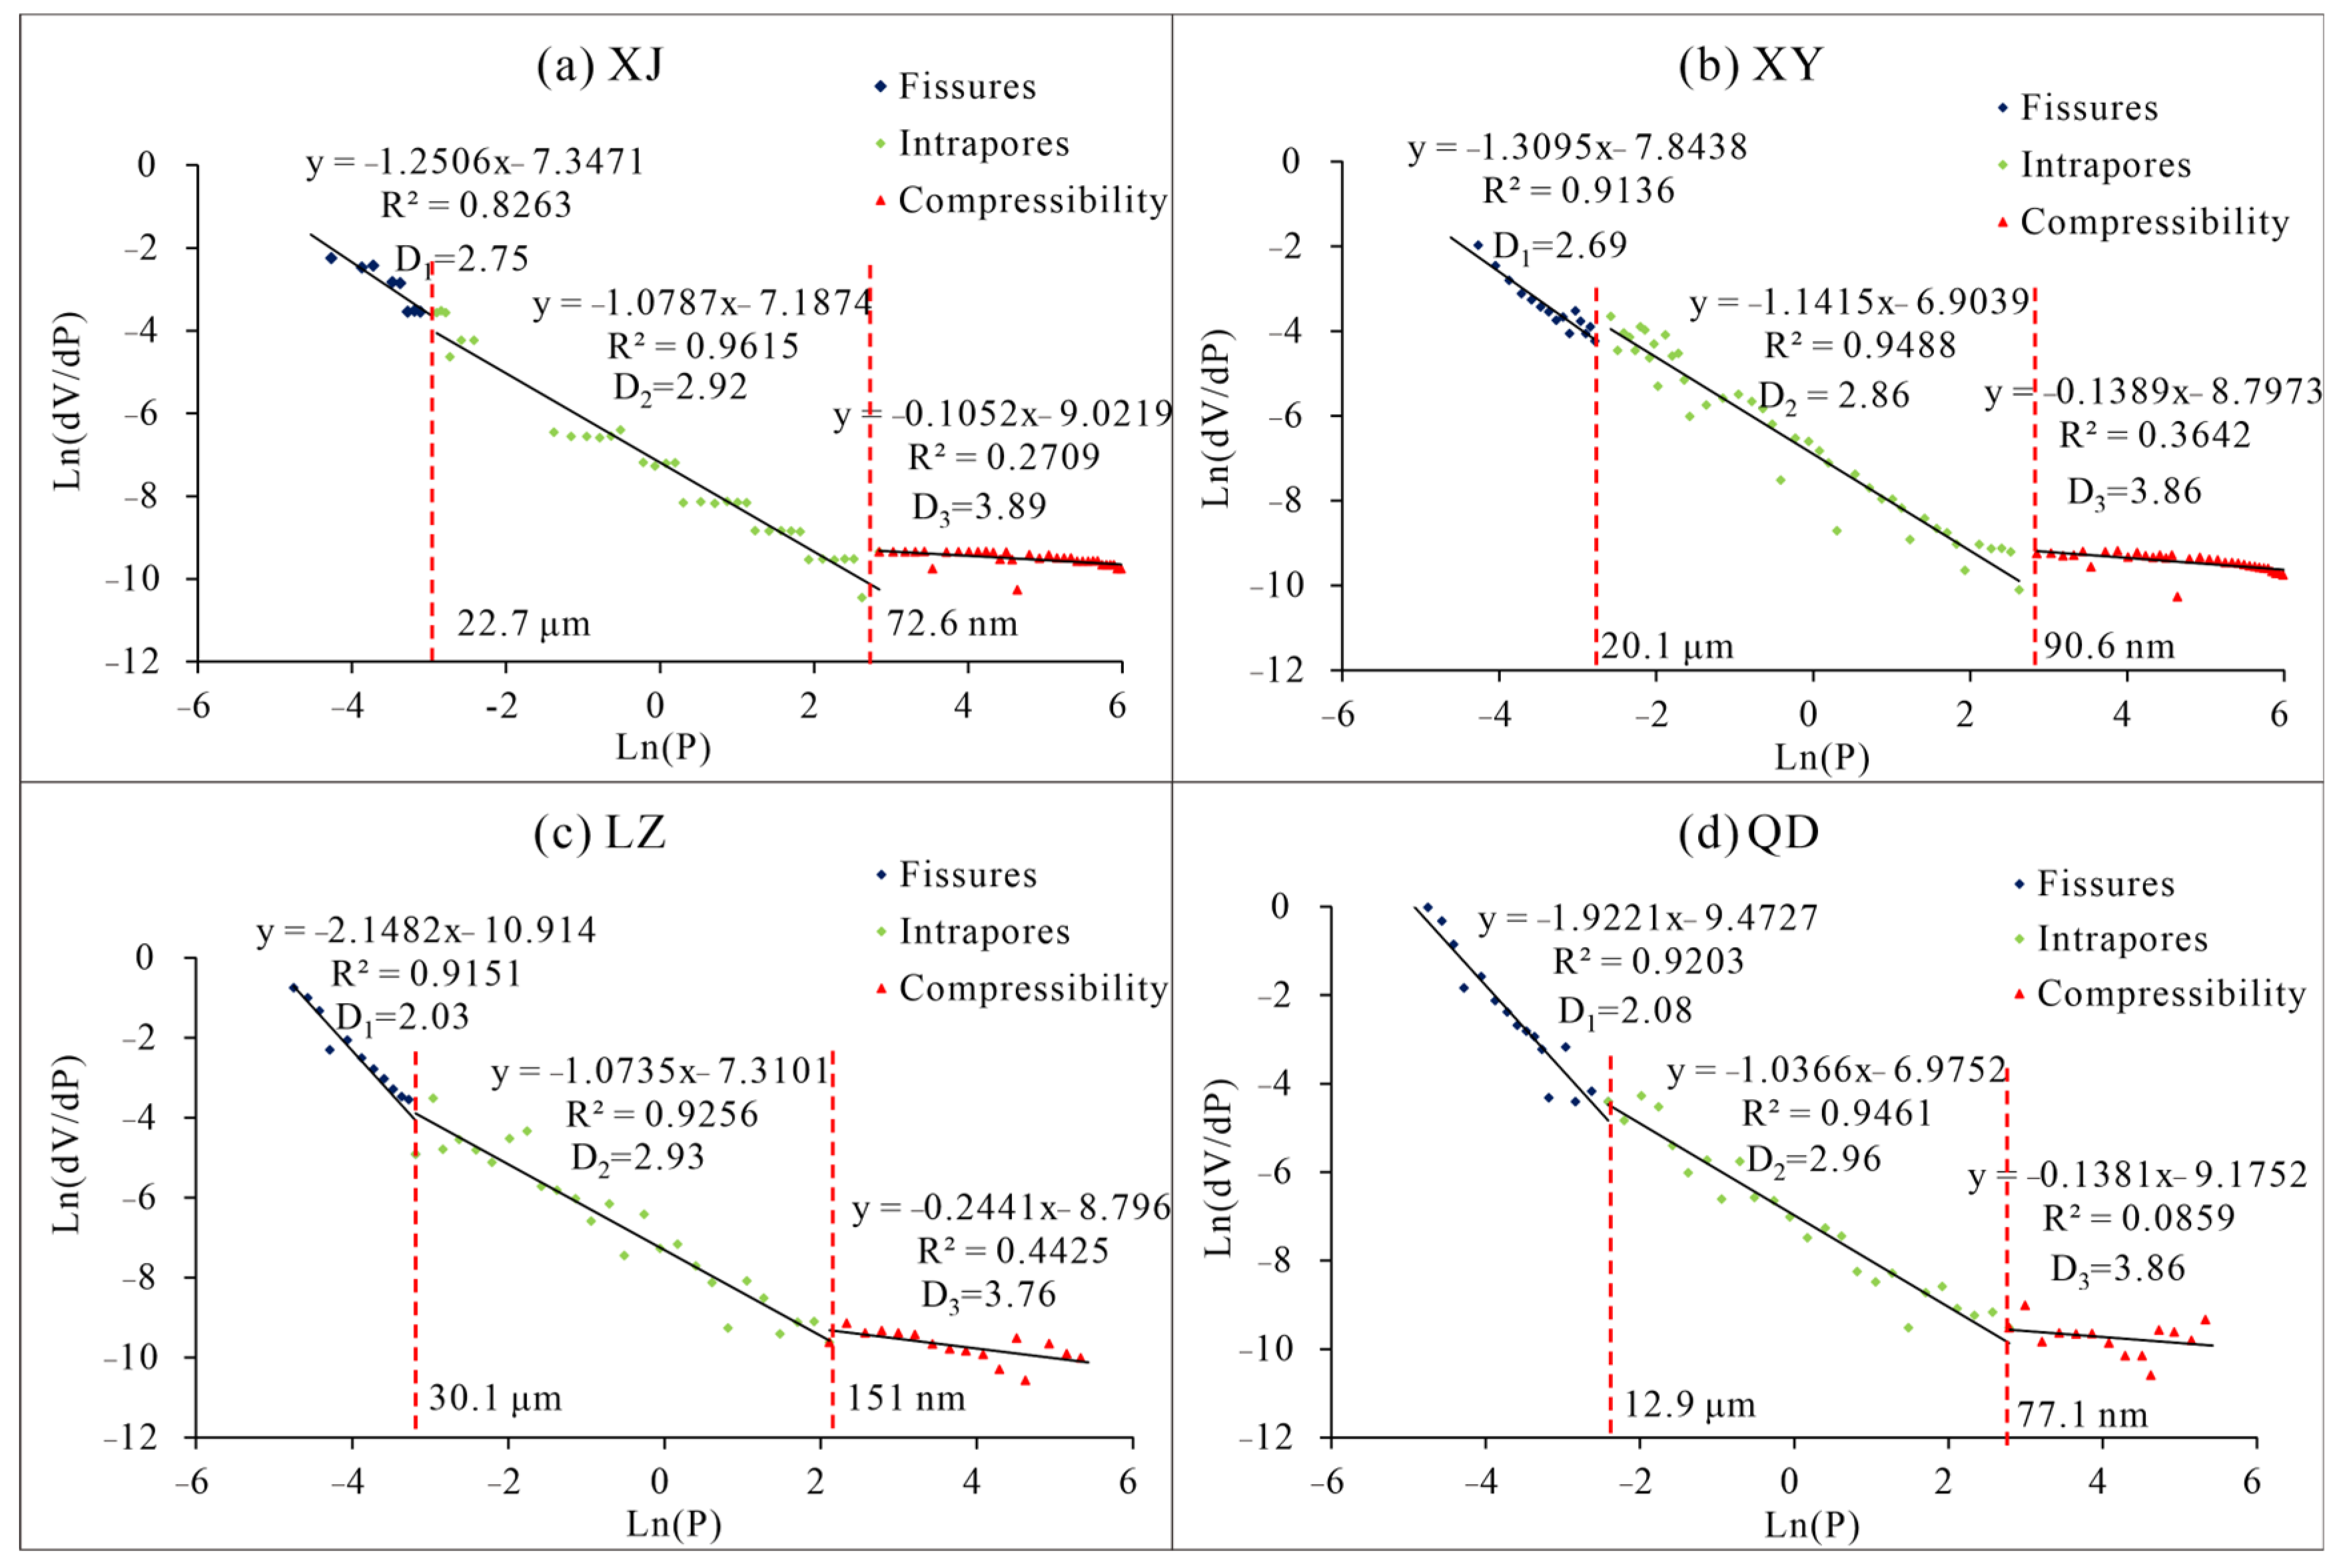
3.2.3. Macropores and Fractures

During the MIP test, the injection process of mercury into coal samples can be divided into three stages based on pressure conditions [30,41]. Firstly, at low mercury pressure, the mercury enters the open large pores or microfractures. The fractal dimension for this stage is denoted D1. Secondly, when the pressure reaches the threshold pressure, the mercury begins to enter through the small pores in the coal matrix. The fractal dimension is denoted D2 and is generally less than 3. Finally, as the pressure continues to increase, high-pressure mercury begins to compress the coal samples, showing an additional mercury entry volumes. The fractal dimension is denoted D3, which is generally greater than 3 [30]. The fractal calculation results for the coal samples based on the MIP are shown in Figure 12 and Table 4.
In the first stage of mercury intrusion, the fractal dimension (D1) indicates that mercury enters the spaces between coal particles or large fractures under low pressure. There is a relatively high degree of fractal fitting in the MIP data, with the coefficient of determinations exceeding 0.82. The corresponding pore or fracture diameter is greater than 30 μm, and the mercury pressure is less than 0.04 MPa. In the TDC samples, the fractal dimension (D1) is close to 2.0, indicating that the fractures in TDC have an approximately two-dimensional structure. Meanwhile, the D1 of the PUC samples is relatively larger at nearly 2.7.
In the second stage, the fractal dimension (D2) represents the actual entry characteristics of mercury into the coal pores. At this stage, there is a clear presence of a fractal relationship, as indicated by a R2 exceeding 0.92. The mercury pressure ranges from 0.041 to 17.19 MPa, and the corresponding pore or fracture diameter ranges from 30.1 μm to 72.6 nm. Compared to the D1 stage, the fractal dimensions of the coal samples in the D2 stage are higher. The D2 of the TDC samples is particularly high, approaching 3, indicating a very complex pore structure that may significantly hinder fluid migration.
In the third stage, the fractal dimension (D3) represents the compression of the coal matrix by high mercury pressure. The mercury injected volume is controlled by the compressibility of the coal matrix, resulting in a very small coefficient of determination (R2). Despite this, the D3 can provide insight into the mechanical strength of coal samples, where larger values indicate stronger compressibility of the coal samples. The D3 value of the TDC sample is slightly lower than that of the PUC, indicating a slightly weaker compressibility. Additionally, the low critical mercury pressure of D3 for the TDC suggests a low mechanical strength, as it undergoes compression even at a low mercury pressure.
Based on a comprehensive comparison of the fractal results, the fractal fit degree in the D1 and D2 sections is relatively high. This suggests that the MIP can effectively characterize the development of most macropores/fractures above 150 nm. However, the D3 stage represents the mercury compression of the coal matrix, corresponding to the pores below 150 nm. To minimize errors and obtain more accurate results, the results of the LNA were used to analyze the macropore structure within 50–150 nm later.

3.2.4. Fractal Characteristics of Average Tortuosity of Capillary

The capillary mean tortuosity fractal dimension (DT) analysis provides insights into the complexity of capillary bundles. Table 5 presents the calculated results of DT based on the MIP. The pore fractal dimensions (Df) observed in the coal samples are similar, ranging from 2.77 to 2.89. The XJ and LZ samples exhibit higher fractal dimensions compared to the XY and QD samples. A higher capillary mean tortuosity value (Tav) suggests more convoluted fluid pathways, which in turn results in poorer permeability. The Tav of the XY, XJ, LZ, and QD coal samples gradually increases. The capillary mean tortuosity fractal dimension (DT) characterizes the complexity of the capillary bundles within the rock sample and reflects the microstructure of the average tortuosity. The higher DT in the TDC samples compared to the PUC samples means that the pore distribution is more narrow and tortuous.
The surface morphology of the fractures in the coal matrix was observed using the SEM method as shown in Figure 13. The PUC samples possess a relatively complete coal matrix with locally occurring hydrostatic fractures. They are short, dense, and feature rough surfaces. The XY sample exhibits stepped shear fractures, which are relatively smooth and do not contain any filling material. The coal matrix of the TDC samples is more broken, showing both shear and tension fractures. The tension fractures in the LZ samples exhibit a rough and tortuous nature, accompanied by a relatively broken coal matrix. The shear fractures in QD samples present a common Yoke cross.
The coal matrix of the TDC samples demonstrates a higher degree of fragmentation and fracture development compared to PUC. The results of MIP suggest that fractures larger than 30 μm exhibit a higher level of planarity, resembling a two-dimensional structure. However, the values of Df and DT in TDC are greater than those in PUC. It could be attributed to the presence of narrow and tortuous paths in the pores and fractures ranging from 150 nm to 30 μm, or some impurities filling or blocking these cracks. Furthermore, fractures in the broken matrix of TDC can be compacted under in situ stress, decreasing the fracture connectivity. Analyzing the fracture morphology and the fractal characteristics of average tortuosity, a schematic diagram illustrating the fracture arrangement in both PUC and TDC was created and shown in Figure 13e,f.

4. Discussion

4.1. Classification of Pore–Fractures Based on Fractal Results

4.1.1. The Accuracy of Fractal Results

The pore structure of the coal matrix exhibits significant heterogeneity, making it challenging to accurately characterize the structure using a single testing method. For example, due to the difference in the test sample’s specifications, the transition pore volume of the TDC in the MIP is higher than that of the PUC, but the LNA data show the opposite situation (Figure 3 and Figure 5). Moreover, pore parameters obtained from different testing methods are indeed difficult to compare directly due to various test principles. By employing different fractal methods based on pore diameters and test methods, it becomes possible to quantitatively and uniformly compare the development degrees of pores with different diameters using the fractal dimension [30,41,50]. In this study, the adopted fractal model has demonstrated high accuracy in characterizing the pore structure of the coal matrix with a high coefficient of determinations above 0.9. This supports the efficacy of fractal models in accurately characterizing the pore structures.

4.1.2. Classification of Pore–Fractures

The fractal calculation of pore structure serves the purpose of accurately exploring the pore–fractures characteristics in the coal matrix, to further explore the control of different types of pores on the gas migration. Except for the IUPAC standard adopted in this paper, scholars have classified pore structures based on shape, size, and connectivity, as shown in Table 6.
Based on the previous classification standards and taking into account the fractal nature of pore structures and the influence of different pores on gas migration, this study re-categorized the different types of pore structures. The division criteria and the fractal parameters have been presented in Table 7.
Generally, coal pores with diameters below 10 nm are considered to be the main sites for gas adsorption and storage [39,56]. Within the micropore smaller than 2 nm, the gas is stored through filling mechanisms. In this stage, the pore volume of the LZ sample exhibits relative prominence, while the QD sample has the smallest pore volume (Figure 3). The PUCs of XJ and XY show larger fractal values and relatively complex pore development (Figure 7), but their pore filling degrees (θ) are lower compared to the TDC samples (Figure 10). In the meanwhile, the fractal analysis of mesopores (2–50 nm) reveals a distinct segmentation phenomenon (Figure 11), within the critical pore diameter of 4–8 nm. Therefore, the pores below 8 nm are defined as gas adsorption pores in this study. In the pore diameter range of 2–8 nm, these coal samples show similar fractal dimensions. But, the pore volumes of the TDC samples are significantly higher than those of PUC.
Many scholars consider 100 nm as the critical dimension for gas diffusion and laminar flow (Table 5), which is crucial in determining pore connectivity [57,58]. Based on the LNA test results, the fractal dimensions of pores between 8–50 nm and 50–150 nm are very similar (Figure 11 and Table 3). Therefore, the range of 8–150 nm is considered as the diffusion pore in this study, and their average fractal dimension is taken as the representative value. During this stage, the pore volume of the PUC samples is smaller than TDC samples. But, the fractal dimension value of the PUC is very high, close to a three-dimensional structure, suggesting that the PUC has a narrow and winding diffusion pore.
With diameters of 0.38 nm and 0.33 nm respectively, CH4 and CO2 migrate through laminar or even turbulent flow in the macropores larger than 100 nm [39,56]. Based on the fractal results of MIP (Figure 12), the pores/fracture in the range of 150 nm–30 μm are identified as gas seepage channels in coal. In this range, the LZ and QD samples have smaller pore volumes compared to the XY sample. These samples also exhibit higher fractal dimension values, indicating a complex pore structure. However, when the fracture diameter is larger than 30 μm, the fracture volume of TDC samples significantly increases, and the fractal dimension decreases to 2. These fractures serve as efficient pathways for gas migration.

4.2. Implications for the CO2–ECBM

CO2–ECBM in coal seams is a continuous process involving various mechanisms such as competitive adsorption, diffusion, seepage, and displacement production. Once injected into the coal seam, CO2 undergoes continuous migration through a combination of Fick diffusion and Darcy flow, and replaces the adsorbed CH4 along the macropores and microfractures in the coal seam, forming a CO2 monolayer adsorption. Subsequently, CO2 continues to migrate toward the micropores through mechanisms such as Fick diffusion, slip flow, and surface diffusion. In the micropores, CO2 displaces the adsorbed CH4 through volume filling or multilayer adsorption, forming multilayer molecular adsorption. Concurrently, the displaced CH4 moves to the meso- and macropores through Fick diffusion, slip flow, and surface diffusion. Finally, the produced CH4, along with a portion of the injected CO2, continuously migrates through the microcracks and large fractures to the production well.
Therefore, different types of pores have different effects on the various stages of gas migration during CO2-ECBM. Based on the gas migration process and the fractal results of the pore–fracture structure in the PUC and TDC samples, a model diagram of the control of pore–fracture structure on the gas migration during the CO2-ECBM was drawn and shown in Figure 14. The pores with different diameters in coal matrix control the fluid migration mode in CO2-ECBM. The microfissures larger than 150 nm are the main channels for CO2 injection and seepage. Then, CO2 enters the storage pores (<8 nm) through diffusion, where multilayer displacement (2–8 nm) and filling displacement (<2 nm) occurred for the geological storage of CO2 in the coal seam. The displaced and desorbed CH4 and partial residual CO2 are transferred to the CH4 production wellbore through gas diffusion and seepage to complete the enhanced CH4 recovery. Based on the calculation results of pore fractal dimension in PUC and TDC samples, the difference in pore development complexity is qualitatively expressed by the curvature degree and width of pore cracks.

4.2.1. Injectivity of CO2 into Coal Seams

The migration of CO2 into micropores through the pore–fracture system of coal matrixes is a prerequisite for large-scale competitive adsorption of CO2 and CH4. The well-developed migration pores, that is strong coal connectivity, are crucial for enabling the contact between CO2 and CH4. Permeability is a common parameter used to describe connectivity. However, it mainly depends on large fractures in the coal matrix [56] and cannot fully reflect the key role of small pores for CO2 injection. In the study, pores with diameters larger than 8 nm were considered gas migration pores, including for seepage and diffusion. The fractal calculations reveal that the migration pore connectivity of TDC samples is stronger compared to PUC samples, based on the larger pore volumes and smaller pore fractal dimensions.
Additionally, the complex pore structures in coal seams can hinder gas migration. For example, seepage pores in TDC samples ranging from 150–30 μm have a high fractal dimension near to 3, indicating that these pores possess complex characteristics and also contribute to the high DT. The fractal dimension of diffusion pores (8–150 nm) in PUC is also quite high (D = 2.96). These complex pore fractures may play a crucial role in controlling pore connectivity and directly affect the effectiveness of CO2 injection and migration.

4.2.2. CO2 Storage Potential

Adsorption storage is the primary mechanism for CO2 geological storage in coal and micropores/adsorption pores are the major sites where CO2 and CH4 compete for adsorption and displacement. The total volume of storage pores (including adsorption pores and filling pores) in TDC samples is higher compared to PUC samples. The fractal dimension of adsorption pores (2–8 nm) in TDC samples is similar to that of PUC. A complex adsorbed pore structure is beneficial for ensuring the thorough contact between CO2 and CH4 and the long-term storage of CO2. But, the relatively low fractal dimension of the filling pores (<2 nm) in TDC samples facilitates the gas entry into filling pores, with a relatively higher pore filling degree (θ) in adsorption experiments. Therefore, it can be concluded that the CO2 storage potential of the TDC reservoir is higher compared to that of PUC.
However, it is worth noting that the pores/fractures with different diameters have complex controlling effects on the whole CO2-ECBM process. For example, although the relatively complex diffusion pore in PUC may hinder CO2 entry into the adsorption pores, it prolongs the competitive adsorption time of CO2 and CH4 once CO2 enters into the adsorption pores. In the meanwhile, the relatively simple seepage pore structure in the TDC samples may lead to a rapid migration of CO2 and CH4 after contact in the adsorption pores and a reduced displacement efficiency. Furthermore, TDC samples have lower mechanical strength (smaller D3 value) and are more susceptible to be compressed and lead to fracture closure. In addition, the factors such as temperature, pressure, water content, structural conditions, and long-term interactions between CO2 and coal will inevitably change the pore–fracture structures and mechanical properties of the coal matrix during the CO2-ECBM [21,30,32,59]. These changes can potentially affect the storage potential and efficiency of CO2 geological storage. Therefore, to fully evaluate the feasibility and validity of CO2-ECBM in TDC reservoirs, it is essential to comprehensively investigate and understand the impacts of other factors.

5. Conclusions

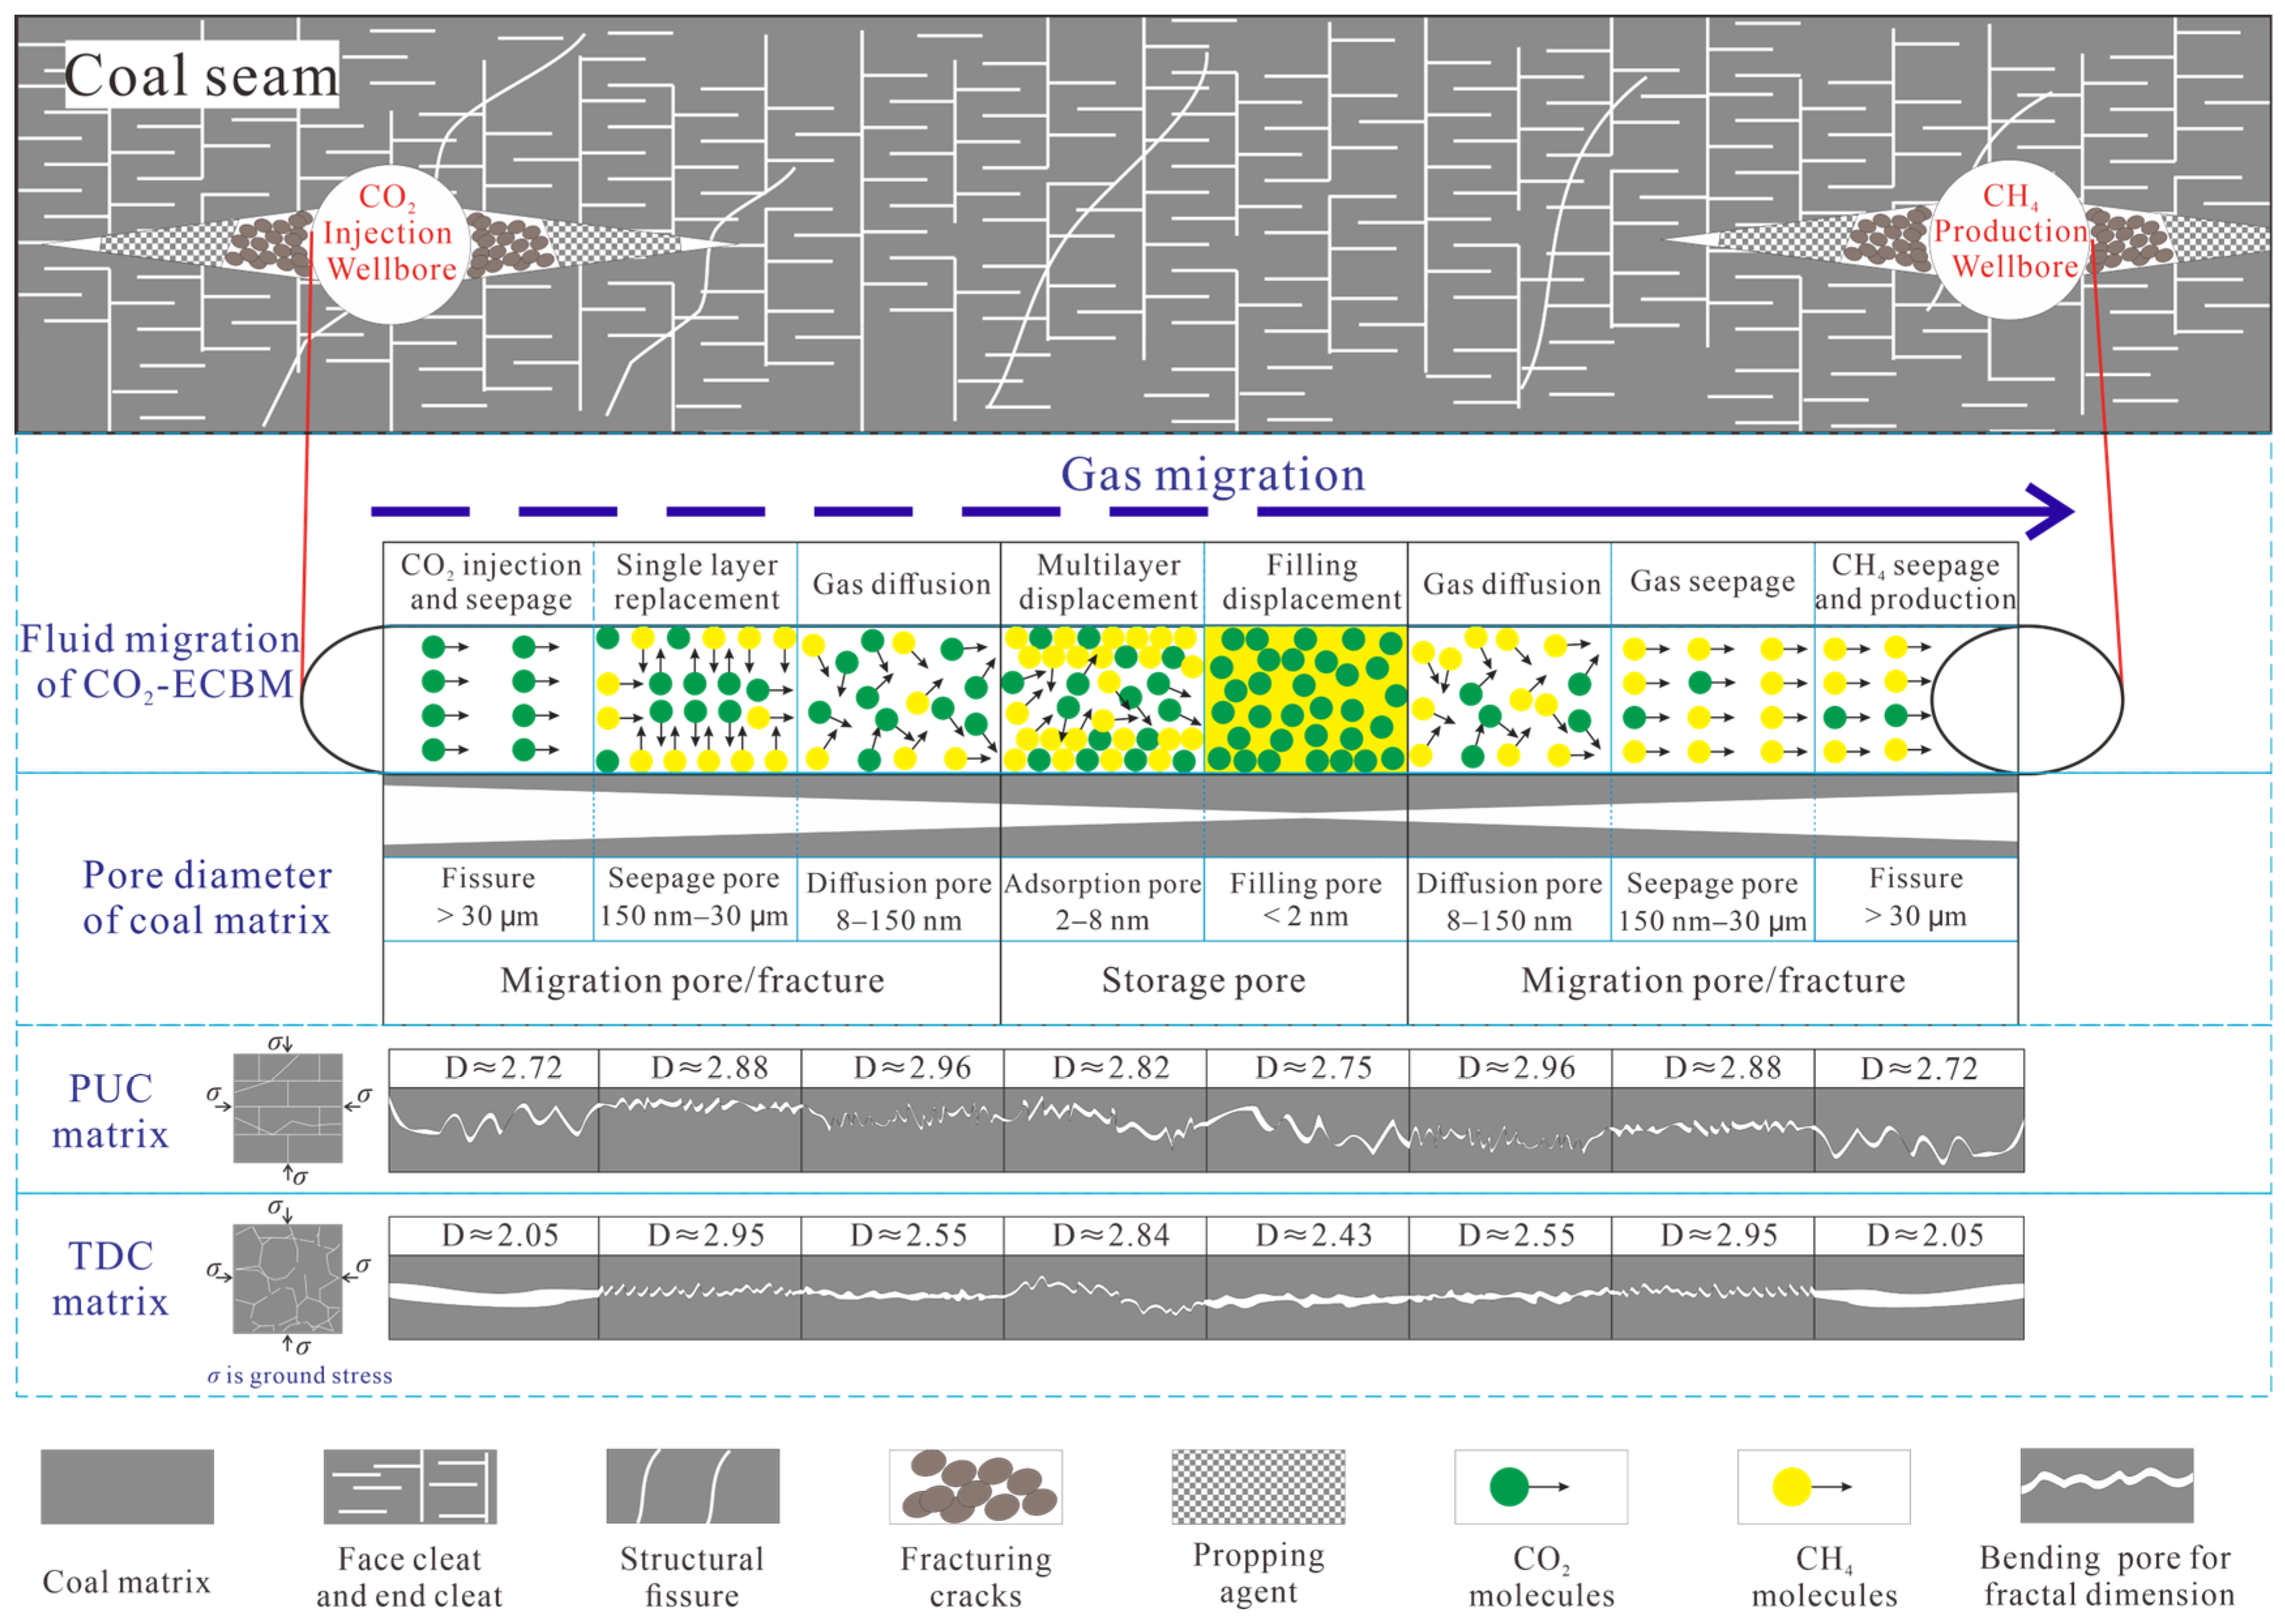
  • Based on the principles of different pore–fracture structure tests (MIP and LNA), different fractal methods were selected to quantitatively and uniformly characterize the development of multiscale pore–fracture structures in coal matrix. According to the fractal characteristics of the pore structure, a multiscale pore structure classification standard suitable for controlling the fluid migration process was formed, that is, filling pores (<2 nm), adsorption pores (2–8 nm), diffusion pores (8–150 nm), seepage pores (150 nm–30 μm), and fractures (>30 μm).
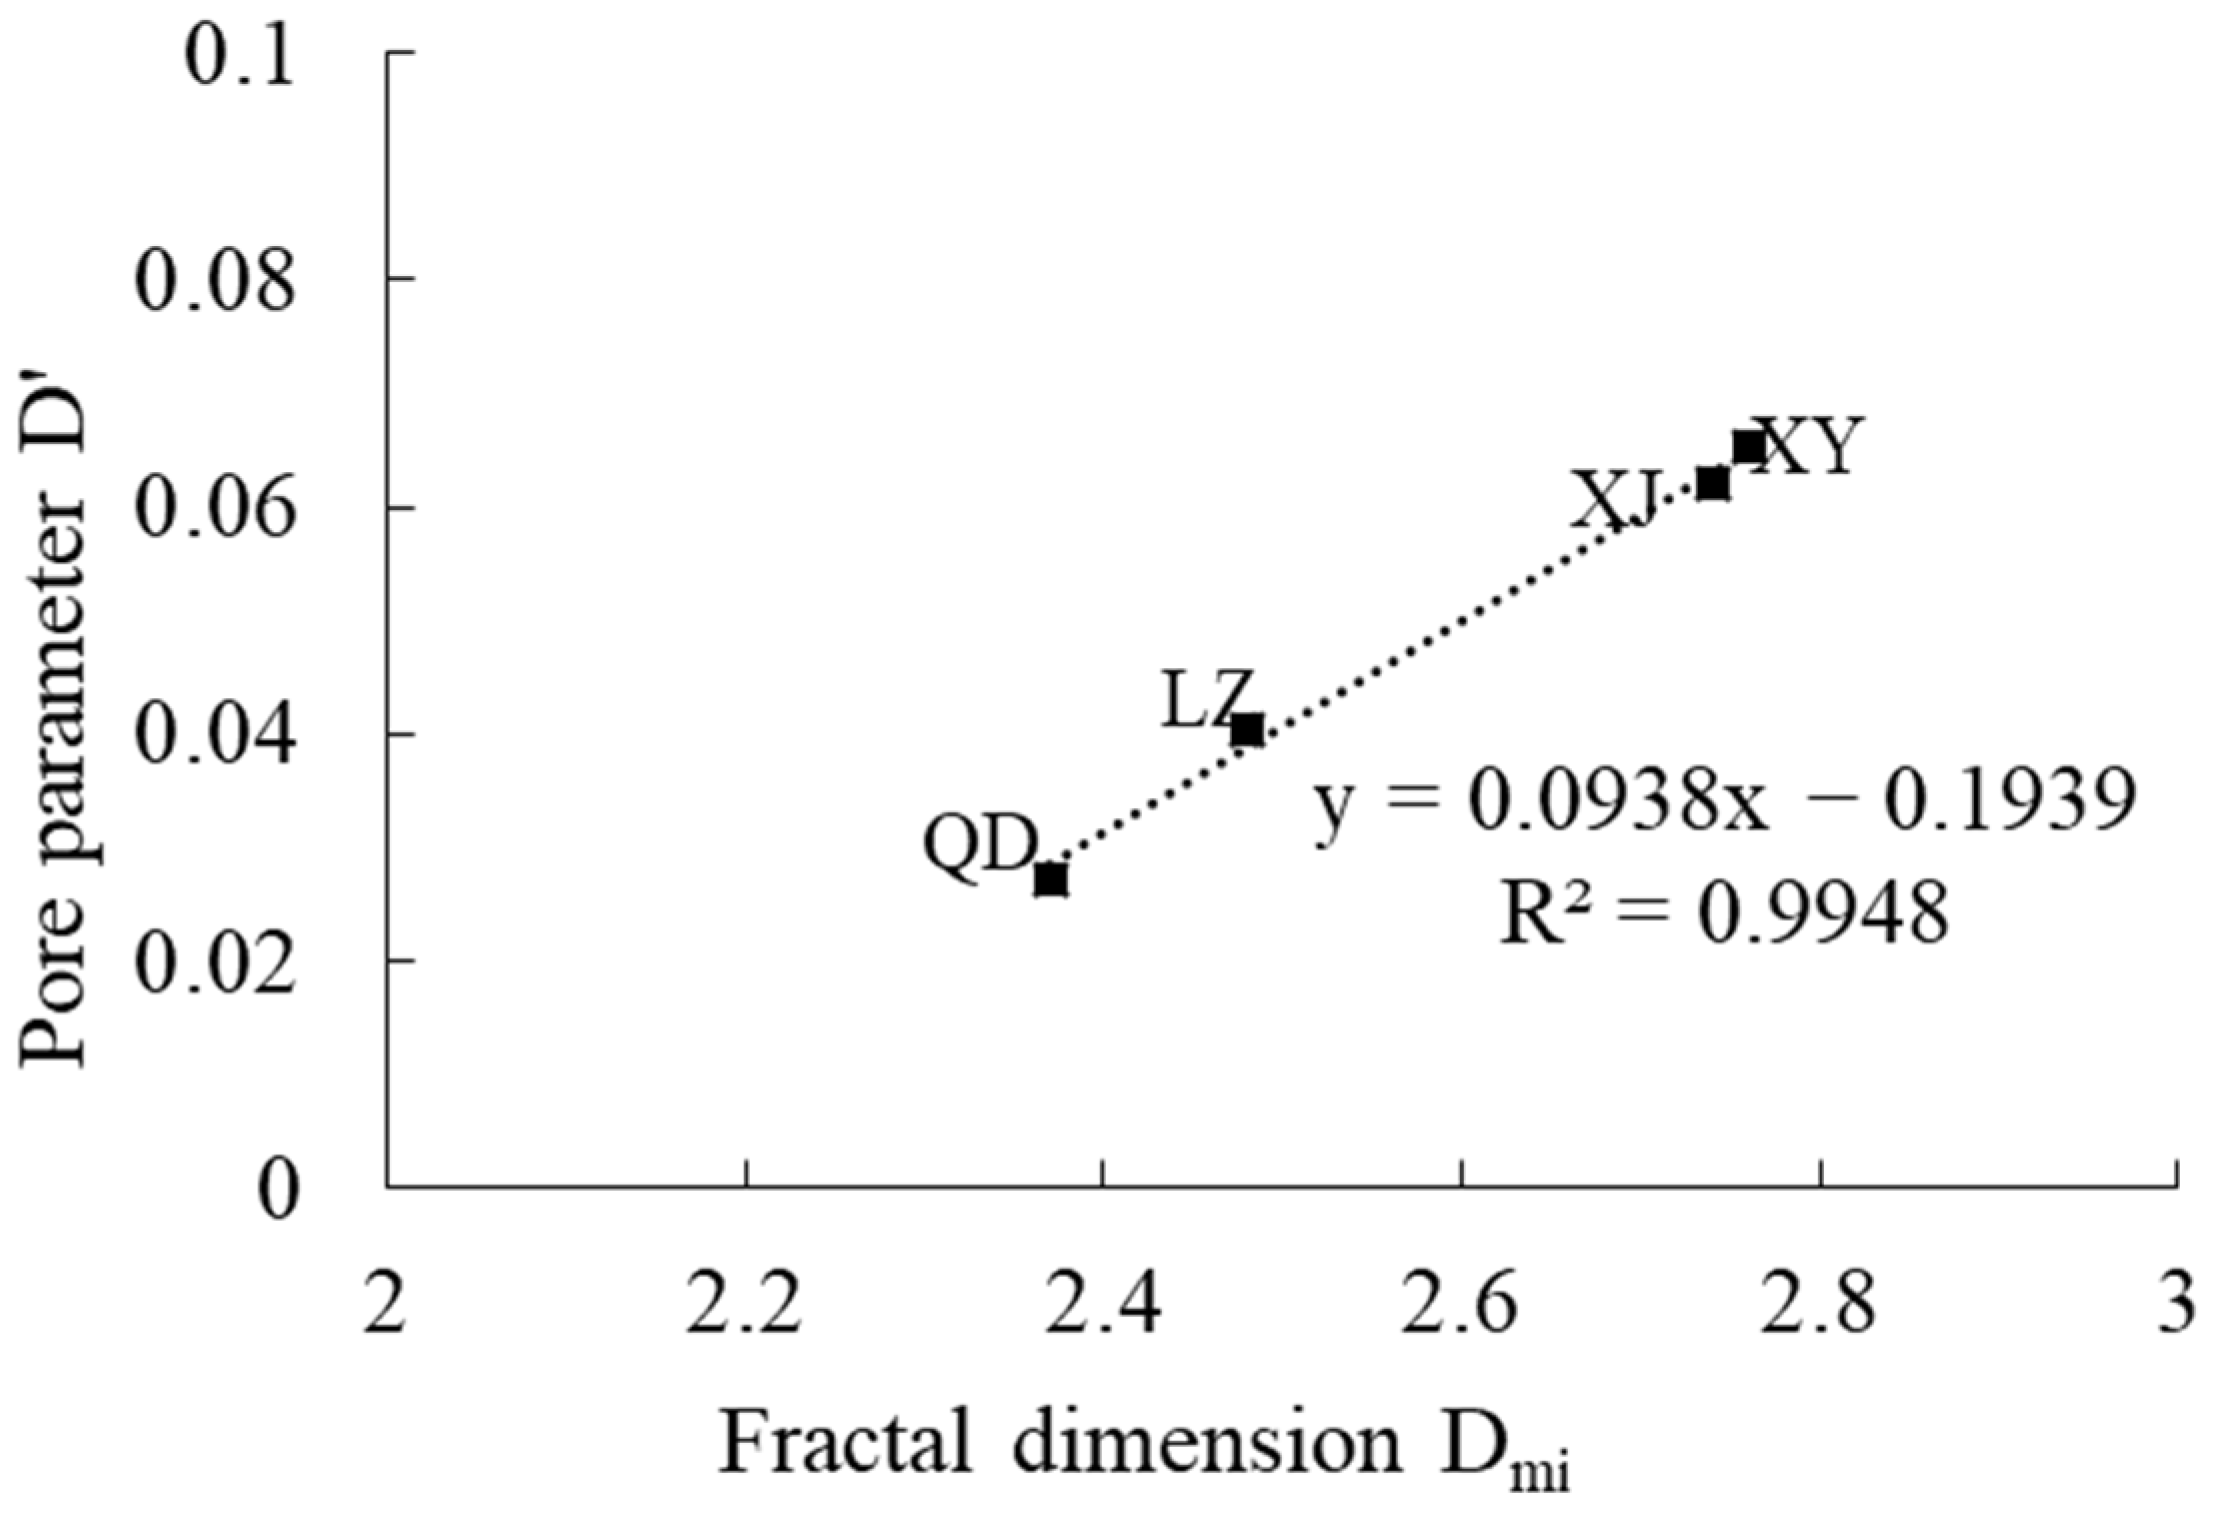
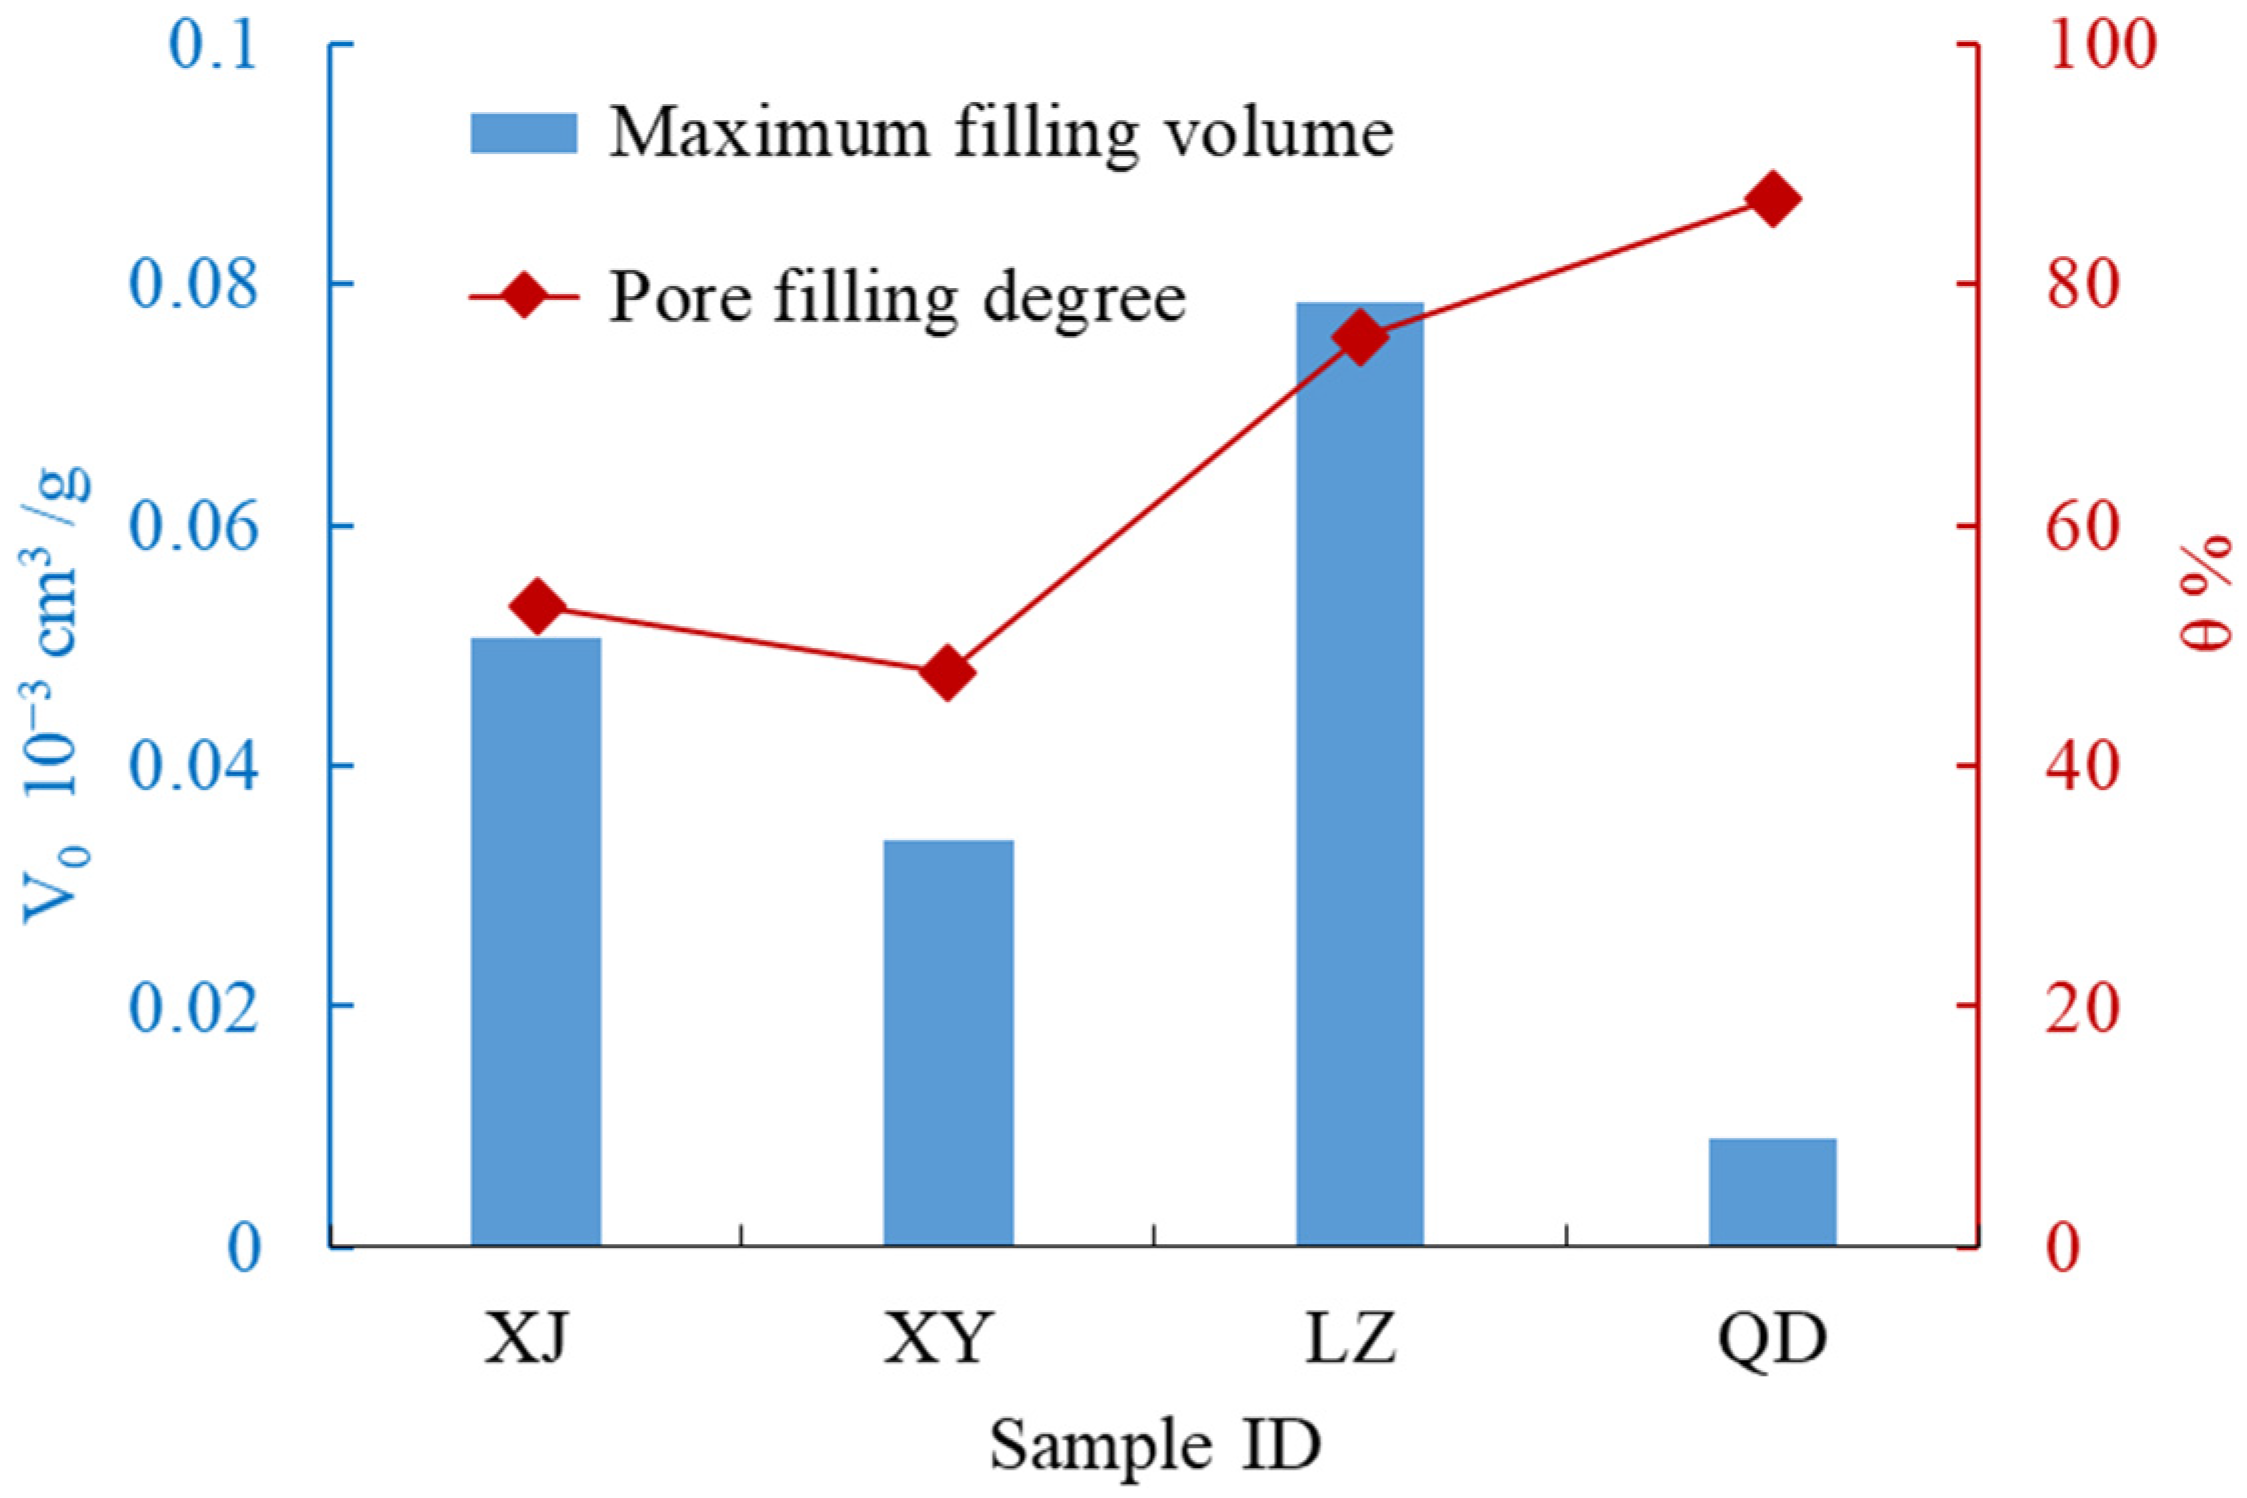
  • The fractal analysis provides insights into the complexity and connectivity of the pore network, which is valuable in understanding the gas adsorption–diffusion–seepage process during CO2-ECBM. The larger pore volumes and smaller fractal dimensions of the migration pores (>8 nm) in TDC samples make it easier for CO2 to enter the micropores and displaces the adsorbed methane. As for the storage pores (<8 nm), TDC samples have the similar fractal dimension of the pores in 2–8 nm with PUC samples, while the fractal dimension of the filling pores (<2 nm) in TDC samples was relatively lower, nearly 2.4, which facilitates efficient gas volume filling and increases the pore-filling degree (θ).
  • The pore–fracture structure of the TDC samples has more advantages for the CO2 injection and storage compared to PUC, meaning that TDC has the geological potential for CO2-ECBM. However, the engineering practice of CO2-ECBM in the coal seam is a complex process controlled by multi-factors except for pore–fracture structure; comprehensive investigations are essential to fully evaluate the feasibility and validity of CO2-ECBM in TDC reservoirs.

Author Contributions

Data curation, M.M.; Formal analysis, M.M.; Methodology, K.Z., H.X. and H.F.; Resources, H.L. and H.X.; Software, H.F.; Writing—original draft, K.Z.; Writing—review and editing, K.Z. and H.L. All authors have read and agreed to the published version of the manuscript.

Funding

This work was funded by the National Natural Science Foundation of China (Nos. 42202200, 42277483, 42102217), the Open Foundation of State Key Laboratory of Mining Response and Disaster Prevention and Control in Deep Coal Mines (SKLMRDPC22KF08), the Natural Science Foundation of Anhui Province (Nos. 2108085MD134, 2308085Y30), the Key Research and Development Project of Anhui Province (2023z04020001), and the Startup Foundation for Advanced Talents of Anhui University of Science and Technology (No. 13210657). The APC was funded by the Institute of Energy, Hefei Comprehensive National Science Center (No. 21KZS218), and the Major Special Projects of Science and Technology of Anhui Province (No. 202203a07020010).

Data Availability Statement

The study did not report any data.

Acknowledgments

Additional thanks go to anonymous reviewers for their constructive review and detailed comments.

Conflicts of Interest

The authors declare no conflict of interest.

References

  1. Godec, M.; Koperna, G.; Gale, J. CO2-ECBM: A review of its status and global potential. Energy Procedia 2014, 63, 5858–5869. [Google Scholar] [CrossRef]
  2. Jafari, M.; Cao, S.C.; Jung, J. Geological CO2 sequestration in saline aquifers: Implication on potential solutions of China’s power sector. Resour. Conserv. Recycl. 2017, 121, 137–155. [Google Scholar] [CrossRef]
  3. Ross, H.E.; Hagin, P.; Zoback, M.D. CO2 storage and enhanced coalbed methane recovery: Reservoir characterization and fluid flow simulations of the Big George coal, Powder River Basin, Wyoming, USA. Int. J. Greenh. Gas. Con 2009, 3, 773–786. [Google Scholar] [CrossRef]
  4. Fitzgerald, J.E.; Pan, Z.; Sudibandriyo, M.; Robinson, J.R.L.; Gasem, K.A.M.; Reeves, S. Adsorption of methane, nitrogen, carbon dioxide and their mixtures on wet Tiffany coal. Fuel 2005, 84, 2351–2363. [Google Scholar] [CrossRef]
  5. Pini, R.; Marx, D.; Burlini, L.; Storti, G.; Mazzotti, M. Coal characterization for ECBM recovery: Gas sorption under dry and humid conditions, and its effect on displacement dynamics. Energy Procedia 2011, 4, 2157–2161. [Google Scholar] [CrossRef]
  6. Zhang, K.; Sang, S.; Zhou, X.; Liu, C.; Ma, M.; Niu, Q. Influence of supercritical CO2-H2O-caprock interactions on the sealing capability of deep coal seam caprocks related to CO2 geological storage: A case study of the silty mudstone caprock of coal seam no. 3 in the Qinshui Basin, China. Int. J. Greenh. Gas. Con 2021, 106, 103282. [Google Scholar] [CrossRef]
  7. Busch, A.; Gensterblum, Y. CBM and CO2-ECBM related sorption processes in coal: A review. Int. J. Coal Geol. 2011, 87, 49–71. [Google Scholar] [CrossRef]
  8. Jia, J.; Wang, D.; Li, B.; Wu, Y.; Zhao, D. Molecular simulation study on the effect of coal metamorphism on the competitive adsorption of CO2/CH4 in binary system. Fuel 2023, 335, 127046. [Google Scholar] [CrossRef]
  9. Rodosta, T.; Litynski, J.; Plasynski, S.; Spangler, L.; Finley, R.; Steadman, E.; Ball, D.; Hill, G.; McPherson, B.; Burton, E.; et al. US Department of Energy’s regional carbon sequestration partnership initiative: Update on validation and development phases. Energy Procedia 2011, 4, 3457–3464. [Google Scholar] [CrossRef]
  10. Wen, D.G.; Guo, J.Q.; Zhang, S.Q.; Xu, T.F.; Hu, Q.Y. The progress in the research on carbon dioxide geological storage in China. Geol. China 2014, 41, 1716–1723. [Google Scholar]
  11. Zhang, K.; Cheng, Y.; Li, W.; Wu, D.; Liu, Z. Influence of supercritical CO2 on pore structure and functional groups of coal: Implications for CO2 sequestration. J. Nat. Gas. Sci. Eng. 2017, 40, 288–298. [Google Scholar] [CrossRef]
  12. Zhang, K.; Sang, S.; Liu, C.; Ma, M.; Zhou, X. Experimental study the influences of geochemical reaction on coal structure during the CO2 geological storage in deep coal seam. J. Pet. Sci. Eng. 2019, 178, 1006–1017. [Google Scholar] [CrossRef]
  13. Malozyomov, B.V.; Golik, V.I.; Brigida, V.; Kukartsev, V.V.; Tynchenko, Y.A.; Boyko, A.A.; Tynchenko, S.V. Substantiation of drilling parameters for undermined drainage boreholes for increasing methane production from unconventional coal-gas collectors. Energies 2023, 16, 4276. [Google Scholar] [CrossRef]
  14. Bosikov, I.I.; Klyuev, R.V.; Mayer, A.V.; Stas, G.V. Development of a method for analyzing and evaluating the optimal state of aerogasodynamic processes in coal mines. Sustain. Dev. Mt. Territ. 2022, 14, 97–106. [Google Scholar] [CrossRef]
  15. Balovtsev, S.V.; Skopintseva, O.V.; Kulikova, E.Y. Hierarchical structure of aerological risks in coal mines. Sustain. Dev. Mt. Territ. 2022, 14, 276–285. [Google Scholar] [CrossRef]
  16. Pan, Z.; Ye, J.; Zhou, F.; Tan, Y.; Connell, L.D.; Fan, J. CO2 storage in coal to enhance coalbed methane recovery: A review of field experiments in China. Int. Geol. Rev. 2018, 60, 754–776. [Google Scholar] [CrossRef]
  17. Zhang, K.; Sang, S.X.; Ma, M.Y.; Zhou, X.Z.; Liu, C.J. Experimental Study on the Influence of Effective Stress on the Adsorption-Desorption Behavior of Tectonically Deformed Coal Compared with Primary Undeformed Coal in Huainan Coalfield, China. Energies 2022, 15, 6501. [Google Scholar] [CrossRef]
  18. Song, Y.; Jiang, B.; Qu, M. Macromolecular evolution and structural defects in tectonically deformed coals. Fuel 2019, 236, 1432–1445. [Google Scholar] [CrossRef]
  19. Xue, Y.; Ranjith, P.G.; Gao, F.; Zhang, D.; Cheng, H.; Chong, Z.; Hou, P. Mechanical behaviour and permeability evolution of gas-containing coal from unloading confining pressure tests. J. Nat. Gas. Sci. Eng. 2017, 40, 336–346. [Google Scholar] [CrossRef]
  20. Zhang, K.; Sang, S.X.; Ma, M.Y.; Zhou, X.Z.; Liu, C.J.; Shen, G.D. Permeability Response Characteristics of Primary Undeformed Coal and Tectonically Deformed Coal under Loading-Unloading Conditions in Huainan Coalfield, China. Acs Omega 2022, 7, 37485–37498. [Google Scholar] [CrossRef]
  21. Niu, Q.; Cao, L.; Sang, S.; Zhou, X.; Wang, Z. Anisotropic Adsorption Swelling and Permeability Characteristics with Injecting CO2 in Coal. Energy Fuel 2018, 32, 1979–1991. [Google Scholar] [CrossRef]
  22. Alexeev, A.D.; Vasilenko, T.A.; Ulyanova, E.V. Closed porosity in fossil coals. Fuel 1999, 78, 635–638. [Google Scholar] [CrossRef]
  23. Ju, Y.; Jiang, B.; Hou, Q.; Tan, Y.; Wang, G.; Xiao, W. Behavior and mechanism of the adsorption/desorption of tectonically deformed coals. Chin. Sci. Bull. 2009, 54, 88–94. [Google Scholar] [CrossRef]
  24. Cai, Y.; Liu, D.; Pan, Z.; Yao, Y.; Li, J.; Qiu, Y. Pore structure and its impact on CH4 adsorption capacity and flow capability of bituminous and subbituminous coals from Northeast China. Fuel 2013, 103, 258–268. [Google Scholar] [CrossRef]
  25. Yao, Y.; Liu, D.; Tang, D.; Tang, S.; Huang, W. Fractal characterization of adsorption-pores of coals from North China: An investigation on CH4 adsorption capacity of coals. Int. J. Coal Geol. 2008, 73, 27–42. [Google Scholar] [CrossRef]
  26. Shao, X.; Pang, X.; Li, Q.; Wang, P.; Chen, D.; Shen, W.; Zhao, Z. Pore structure and fractal characteristics of organic-rich shales: A case study of the lower Silurian Longmaxi shales in the Sichuan Basin, SW China. Mar. Pet. Geol. 2017, 80, 192–202. [Google Scholar] [CrossRef]
  27. Yuan, W.; Pan, Z.; Li, X.; Yang, Y.; Zhao, C.; Connell, L.D.; Li, S.; He, J. Experimental study and modelling of methane adsorption and diffusion in shale. Fuel 2014, 117, 509–519. [Google Scholar] [CrossRef]
  28. Huang, T.; Du, P.; Peng, X.; Wang, P.; Zou, G. Pressure drop and fractal non-Darcy coefficient model for fluid flow through porous media. J. Pet. Sci. Eng. 2020, 184, 106579. [Google Scholar] [CrossRef]
  29. Yang, R.; He, S.; Yi, J.; Hu, Q. Nano-scale pore structure and fractal dimension of organic-rich Wufeng-Longmaxi shale from Jiaoshiba area, Sichuan Basin: Investigations using FE-SEM, gas adsorption and helium pycnometry. Mar. Pet. Geol. 2016, 70, 27–45. [Google Scholar] [CrossRef]
  30. Liu, C.J.; Wang, G.X.; Sang, S.X.; Gilani, W.; Rudolph, V. Fractal analysis in pore structure of coal under conditions of CO2 sequestration process. Fuel 2015, 139, 125–132. [Google Scholar] [CrossRef]
  31. Wu, J.; Yu, B. A fractal resistance model for flow through porous media. Int. J. Heat. Mass. Tran. 2007, 50, 3925–3932. [Google Scholar] [CrossRef]
  32. Liu, S.; Ma, J.; Sang, S.; Wang, T.; Du, Y.; Fang, H. The effects of supercritical CO2 on mesopore and macropore structure in bituminous and anthracite coal. Fuel 2018, 223, 32–43. [Google Scholar] [CrossRef]
  33. Zhang, G.; Ranjith, P.G.; Fu, X.; Li, X. Pore-fracture alteration of different rank coals: Implications for CO2 sequestration in coal. Fuel 2021, 289, 119801. [Google Scholar] [CrossRef]
  34. Meng, L.D.; Tao, L.Z.; Dong, C.Y. Study progress on pore-crack heterogeneity and geological influence factors of coal reservoir. Coal Sci. Technol. 2015, 43, 10–15. [Google Scholar] [CrossRef]
  35. Washburn, E.W. The Dynamics of Capillary Flow. Phys. Rev. 1921, 17, 273–283. [Google Scholar] [CrossRef]
  36. Zhang, J. Experimental study and modeling for co2 diffusion in coals with different particle sizes: Based on gas absorption (imbibition) and pore structure. Energy Fuel 2016, 30, 531–543. [Google Scholar] [CrossRef]
  37. Qi, L.; Tang, X.; Wang, Z.; Peng, X. Pore characterization of different types of coal from coal and gas outburst disaster sites using low temperature nitrogen adsorption approach. Int. J. Min. Sci. Technol. 2017, 27, 371–377. [Google Scholar] [CrossRef]
  38. Xie, W.; Wang, M.; Wang, X.; Wang, Y.; Hu, C. Nano-Pore structure and fractal characteristics of shale gas reservoirs: A case study of longmaxi formation in Southeastern Chongqing, China. J. Nanosci. Nanotechnol. 2021, 21, 343–353. [Google Scholar] [CrossRef]
  39. Hu, B.; Cheng, Y.; Pan, Z. Classification methods of pore structures in coal: A review and new insight. Gas. Sci. Eng. 2023, 110, 204876. [Google Scholar] [CrossRef]
  40. Dubinin, M.M.; Stoeckli, H.F. Homogeneous and heterogeneous micropore structures in carbonaceous adsorbents. J. Colloid. Interf. Sci. 1980, 75, 34–42. [Google Scholar] [CrossRef]
  41. Friesen, W.I.; Mikula, R.J. Mercury porosimetry of coals: Pore volume distribution and compressibility. Fuel 1988, 67, 1516–1520. [Google Scholar] [CrossRef]
  42. Krohn, C.E. Fractal measurements of sandstones, shales, and carbonates. J. Geophys. Res. Solid. Earth 1988, 93, 3297–3305. [Google Scholar] [CrossRef]
  43. Feng, Y.; Ning, Z.; Liu, H. Fractal characteristics of shales from a shale gas reservoir in the Sichuan Basin, China. Fuel 2014, 115, 378–384. [Google Scholar]
  44. Jaroniec, M. Evaluation of the fractal dimension from a single adsorption isotherm. Langmuir 1995, 11, 2316–2317. [Google Scholar] [CrossRef]
  45. Xie, H.P.; GAO, F.; Zhou, H.W.; Cheng, G.M.; Zhou, F.B. On theoretical and modeling approach to mining-enhanced permeability for simultaneous exploitation of coal and gas. J. China Coal Soc. 2013, 38, 1101–1108. [Google Scholar]
  46. Jaroniec, M.; Gilpin, R.K.; Choma, J. Correlation between microporosity and fractal dimension of active carbons. Carbon 1993, 31, 325–331. [Google Scholar] [CrossRef]
  47. Beekman, J.W.; Froment, G.F. Average lengthscale for tortuosity calculations. Ind. Eng. Chem. Fundam. 1982, 21, 243. [Google Scholar]
  48. Xu, P.; Yu, B. Developing a new form of permeability and Kozeny–Carman constant for homogeneous porous media by means of fractal geometry. Adv. Water Resour. 2008, 31, 74–81. [Google Scholar] [CrossRef]
  49. Wang, C.; Yang, S.; Li, X.; Li, J.; Jiang, C. Comparison of the initial gas desorption and gas-release energy characteristics from tectonically-deformed and primary-undeformed coal. Fuel 2019, 238, 66–74. [Google Scholar] [CrossRef]
  50. Dou, W.; Liu, L.; Jia, L.; Xu, Z.; Wang, M.; Du, C. Pore structure, fractal characteristics and permeability prediction of tight sandstones: A case study from Yanchang Formation, Ordos Basin, China. Mar. Pet. Geol. 2021, 123, 104737. [Google Scholar] [CrossRef]
  51. Hodot, B.B. Coal and Gas Outburst; China Industry Press: Beijing, China, 1966; (Chinese Translation). [Google Scholar]
  52. Gan, H.; Nandi, S.P.; Walker, P.L. Nature of the porosity in American coals. Fuel 1972, 51, 272–277. [Google Scholar] [CrossRef]
  53. Dubinin, M.M. On physical feasibility of Brunauer’s micropore analysis method. J. Colloid. Interf. Sci. 1974, 46, 351–356. [Google Scholar] [CrossRef]
  54. Wu, J.; Jin, K.; Tong, Y. Theory of coal pores and its application in evaluation of gas outburst proneness and gas drainage. J. China Coal Soc. 1991, 16, 86–95. [Google Scholar]
  55. Qin, Y.; Xu, Z.; Zhang, J. Natural classification of the high-rank coal pore structure and its application. J. China Coal Soc. 1995, 20, 266–271. [Google Scholar]
  56. Sang, S.; Zhu, Y.; Zhang, S.; Zhang, J.; Tang, J. Solid-gas interaction mechanism of coal-adsorbed gas (I)—Coal pore structure and solid-gas interaction. Nat. Gas. Ind. 2005, 25, 13–15. [Google Scholar]
  57. Dong, J.; Cheng, Y.; Liu, Q.; Zhang, H.; Zhang, K.; Hu, B. Apparent and True Diffusion Coefficients of Methane in Coal and Their Relationships with Methane Desorption Capacity. Energy Fuel 2017, 31, 2643–2651. [Google Scholar] [CrossRef]
  58. Smith, D.M.; Williams, F.L. Diffusion models for gas production from coal: Determination of diffusion parameters. Fuel 1984, 63, 256–261. [Google Scholar] [CrossRef]
  59. Niu, Q.; Cao, L.; Sang, S.; Wang, W.; Zhou, X.; Yuan, W.; Ji, Z.; Chang, J.; Li, M. Experimental study on the softening effect and mechanism of anthracite with CO2 injection. Int. J. Rock. Mech. Min. 2021, 138, 104614. [Google Scholar] [CrossRef]
Figure 1. Sample locations.
Processes 11 02934 g001
Figure 2. Multiscale pore–fracture characterization methods and pore classification based on IUPAC.
Processes 11 02934 g002
Figure 3. The pore volume distribution in coal based on the LNA test: (a) The Xinjing sample; (b) The Xinyuan sample; (c) The Liuzhuang sample; (d) The Qidong sample. VT, VMi, VMe, and VMa are the pore volumes of total pores, micropores, mesopores, and macropores.
Processes 11 02934 g003
Figure 4. Adsorption–desorption loop based on the LNA method: (a) The Xinjing sample, (b) The Xinyuan sample; (c) The Liuzhuang sample; (d) The Qidong sample.
Processes 11 02934 g004
Figure 5. The pore volume distribution in coal is based on the MIP test: (a) The Xinjing sample; (b) The Xinyuan sample; (c) The Liuzhuang sample; (d) The Qidong sample. VT, VMi, VMe, and VMa are the pore volumes of total pores, micropores, mesopores, and macropores.
Processes 11 02934 g005
Figure 6. The mercury injection–ejection curves based on MIP: (a) The Xinjing sample; (b) The Xinyuan sample; (c) The Liuzhuang sample; (d) The Qidong sample.
Processes 11 02934 g006
Figure 7. Micropore fractal results using the V-S model: (a) The Xinjing sample; (b) The Xinyuan sample; (c) The Liuzhuang sample; (d) The Qidong sample.
Processes 11 02934 g007
Figure 8. Calculation results of coal body pore parameter D based on the D-R equation: (a) The Xinjing sample; (b) The Xinyuan sample; (c) The Liuzhuang sample; (d) The Qidong sample.
Processes 11 02934 g008
Figure 9. Relationship between fractal dimension (Dmi) and pore parameters (D′).
Processes 11 02934 g009
Figure 10. The maximum adsorption volume (V0) and pore filling degree (θ).
Processes 11 02934 g010
Figure 11. The fractal characteristics of mesopores and part of macropores based on the FHH model: (a) The Xinjing sample; (b) The Xinyuan sample; (c) The Liuzhuang sample; (d) The Qidong sample.
Processes 11 02934 g011
Figure 12. The fractal calculation results of the coal samples based on MIP: (a) The Xinjing sample; (b) The Xinyuan sample; (c) The Liuzhuang sample; (d) The Qidong sample.
Processes 11 02934 g012
Figure 13. Microfracture morphology of coal samples based on SEM: (a) The Xinjing sample; (b) The Xinyuan sample; (c) The Liuzhuang sample; (d) The Qidong sample; (e,f) The schematic diagrams showing the fracture arrangements of PUC and TDC.
Processes 11 02934 g013
Figure 14. CO2-ECBM fluid migration path in coal seam and the pore–fracture structure control mode.
Processes 11 02934 g014
Table 1. Basic information on coal samples.
Sample
ID
Sampling
Location
Depth
/m
Coal Matrix StructureRo,max/%Vdaf/
wt.%
Coal RankPorosity
(%)
P (mD)
Xinjing
(XJ)
Qinshui Basin585PUC2.6310.02Semi-anthracite4.290.219
Xinyuan (XY)833PUC1.8115.26Low-volatile bituminous4.650.0537
Liuzhuang (LZ)Huainan Coalfield820TDC0.9339.34High-volatile bituminous2.800.0011
Qidong (QD)Huaibei Coalfield437TDC0.9338.59High-volatile bituminous3.580.0093
Note: Ro,max is the maximum reflectance of vitrinite and Vdaf is volatile of dry ash-free basis. The coal rank was determined according to the American Society for Testing and Materials (ASTM) standards. P is the Klinkenberg permeability, which was tested at an effective stress of 8 MPa based on a formation pressure gradient of 0.01 MPa/m and a unified coal seam depth of 800 m in this study.
Table 2. Fractal methods of pore–fracture structure.
Pore StructureMicroporeMesoporeMacroporeFracture
Pore diameter<2 nm2–50 nm50 nm–1 μm>1 μm
Testing methods-MIP (4.33 nm–226.41 μm)
LNA (0.85–150 nm)-
Fractal methodsV-S modelFHH modelMenger sponge model
Average tortuosity
Table 3. Fractal calculation parameters of mesopores and some macropores.
Sample IDMesopore-1Mesopore-2Macropore
d/nmDme1R2d/nmDme2R2d/nmDma1R2
XJ2~42.780.9894~502.950.97250~1112.990.968
XY2~62.840.9996~502.920.97650~1112.980.967
LZ2~82.830.9948~502.660.99750~1552.640.998
QD2~62.850.9636~502.460.99750~1652.460.982
Here, d is the pore diameter; Dme1, Dme2, and Dma1 are the fractal dimension of mesopore-1, mesopore-2, and macropores, respectively; and R2 is the coefficient of determination.
Table 4. Fractal parameters in different stages of MIP.
Sample
ID
Fractal DimensionPressure Classifications
D1D2D3P1
/MPa
d1P2
/MPa
d2P3
/MPa
d3
XJ2.752.923.89<0.055>22.7 μm0.055–17.1972.6 nm–22.7 μm>17.19<72.6 nm
XY2.692.863.86<0.062>20.1 μm0.062–13.7690.6 nm–20.1 μm>13.76<90.6 nm
LZ2.032.933.76<0.041>30.1 μm0.041–8.26151.0 nm–30.1 μm>8.26<151.0 nm
QD2.082.963.86<0.089>13.9 μm0.089–6.8177.1 nm–13.9 μm>6.81<77.1 nm
Note: P1, P2, and P3, respectively, represent the mercury pressure corresponding to D1, D2, and D3; d1, d2, and d3, respectively, represent the pore/fracture diameter corresponding to D1, D2, and D3.
Table 5. Calculation results of fractal parameters of average tortuosity.
Sample IDPorosity/%DfTavLm/μmRav/μmDT
XJ4.302.8612.0047.530.00751.31
XY4.652.7711.1325.960.00811.32
LZ2.802.8518.2325.940.02261.45
QD3.582.8914.359.030.02171.50
Note: Df is the pore fractal dimension; Tav is the capillary mean tortuosity; Lm is the capillary characteristic length; rav is the average pore diameter; and DT is the capillary mean tortuosity fractal dimension.
Table 6. Wield used pore classification standards.
ScholarsTimeClassification Standard of PoreData From
Hodot1966Micropore (<10 nm); Transitional pore (10–100 nm); Mesopore (100–1000 nm); Macropore (>1000 nm)[51]
Gan et al.1972Micropore (0.4–1.2 nm); Transitional pore (1.2–30 nm); Macropore (>30 nm)[52]
Dubinin1974Micropore (<1.3 nm); Sup-micropore (1.3–3.1 nm); Mesopore (3.1–300 nm); Macropore (>300 nm)[53]
Wu et al.1991Micropore (<10 nm); Transitional pore (10–100 nm); Mesopore (100–1000 nm); Macropore (>1000 nm)[54]
Qin et al.1995Micropore (<15 nm); Transitional pore (15–50 nm); Mesopore (50–400 nm); Macropore (>400 nm)[55]
Sang et al.2005Absorption pore (<2 nm); adsorption pore (2–10 nm); Coagulation-adsorption pore (10–100 nm); Seepage pore (>100 nm)[56]
Hu et al.2023Unreachable pore (<0.38 nm); Filling pore (0.38–1.50 nm); Diffusion pore (1.5–100 nm); Seepage pore (>100 nm)[39]
Table 7. Pore structure classification ranges and parameters based on fractal results and previous classification standards.
Pore ClassificationFilling Pore
(<2 nm)
Adsorption Pores
(2–8 nm)
Diffusion Pore
(8–150 nm)
Seepage Pore
(150 nm–30 μm)
Fracture
(>30 μm)
Sample IDVDθVDVDVDVD
XJ0.0272.7453.30.0322.780.452.973.12.9222.75
XY0.0162.7647.80.0122.840.422.955.92.861.72.69
LZ0.0592.4875.50.122.831.262.654.682.933.692.03
QD0.00792.3787.20.0522.850.722.465.762.966.562.08
Note: V is the pore volume, 10−3 cm−3/g; D is the fractal dimension; and θ is the pore-filling degree, %.
Disclaimer/Publisher’s Note: The statements, opinions and data contained in all publications are solely those of the individual author(s) and contributor(s) and not of MDPI and/or the editor(s). MDPI and/or the editor(s) disclaim responsibility for any injury to people or property resulting from any ideas, methods, instructions or products referred to in the content.

