
Fast Tracking of Maximum Power in a Shaded Photovoltaic System Using Ali Baba and the Forty Thieves (AFT) Algorithm

 ,
,  , , , , and
Abstract
:1. Introduction
- Tracking Range and Perception Potential: AFT utilizes the tracking range and perception potential as crucial parameters. This suggests that it has a dynamic approach to exploring the search space and adapting to changing environmental conditions, potentially making it more robust and adaptable than traditional MPPT algorithms.
- Clever Deception Techniques: AFT incorporates deception techniques inspired by Marjaneh, which encourage the thieves (representing the algorithm) to investigate other locations and directions. This implies that AFT can actively explore alternative solutions, potentially leading to better MPPT results, even in challenging conditions.
- Balanced Exploration and Exploitation: AFT employs a random search strategy for the thieves, striking a balance between exploration (diversifying the population) and exploitation (converging toward optimal solutions). This balance can result in quicker convergence while maintaining diversity, which is crucial for robust MPPT.
- Minimal Parameter Set: AFT uses a minimal set of parameters, indicating simplicity in implementation and tuning. This simplicity can make it more accessible and easier to deploy in practical PV systems.
2. Modeling of the PV Cell
3. Metaheuristic Optimization Algorithm Based MPPT
- Low failure rate: There should be very little chance of early convergence or failure for the MPPT algorithm.
- Fast convergence: To reduce the number of computing iterations necessary for an economical MPP tracker, the MPPT algorithm should reach the MPP quickly.
- Stable fluctuations: The MPPT algorithm needs to be capable of trustworthy exploration and exploitation in order to avoid needless search space traversal, which minimizes power fluctuations and related losses.
4. Ali Baba and the Forty Thieves (AFT) Algorithm-Based MPPT
- The 40 thieves work together in a bevy and receive directions from someone, or from one of the thieves, to locate Ali Baba’s house. These directions may or may not be accurate.
- The 40 thieves travel a certain distance from their starting point until they locate Ali Baba’s house.
- Marjaneh can deceive the thieves several times with clever tactics to protect Ali Baba by a certain percentage.
4.1. Ali Baba and the Forty Thieves (AFT) Algorithm
- Tracking distance parameter (): As the iterations progress, the emphasis on exploration diminishes while exploitation becomes more important. Lower values of focus on localized searches in propitious regions of search space. Consequently, in the later iterations, facilitates local search around the finest solution, resulting in exploitation. This specification regulates the amount of exploration in AFT by determining how far the new locations of thieves are from Ali Baba’s house. is defined using Equation (5) as:
- Perception potential parameter (): The degree of exploitation is regulated by , which quantifies the amount of comprehensive search around the finest solution. As iterations progress, the exploitation phase intensifies with comparatively larger values of this parameter. This specification emphasizes the exploration capability of AFT, particularly when it has comparatively small values. It is constantly increased during the iterative operation of AFT to avert getting stuck in local optima and approach the global optima. is defined using Equation (6) as:
- : This specification determines the direction of exploitation and exploration in AFT. As follows a uniform distribution between 0 and 1, the likelihood of obtaining positive and negative signs becomes equal.
- Marjaneh intelligence plans: This specification can directly enhance AFT exploration ability. The searching behavior of AFT can be represented mathematically as given below:
4.2. MPPT Using AFT Algorithm
- 1.
- Duty Ratio Initialization: The duty ratios within the AFT algorithm serve as control signals to regulate the converter, drawing an analogy to the position of the thieves. To initiate the optimization process, the duty ratios must be initialized within a predefined search space, constrained by two critical values: a maximum value ( = 0.9) and a minimum value ( = 0.1). These restrictions are imposed to confine the optimization within a secure and operationally feasible range of duty ratios.
- 2.
- Iterative Optimization Process: The AFT algorithm unfolds through an iterative optimization process inspired by the tale of Ali Baba and the 40 thieves. The search for Ali Baba by the thieves can lead to three fundamental scenarios. In each scenario, the thieves conduct an efficient search of their surroundings while considering the influence of Marjaneh’s intelligence, which compels them to explore unexpected locations. By modeling the behaviors of both the thieves and Marjaneh, these behaviors can be linked to an objective function that is amenable to optimization.
- 3.
- Obtaining the Optimum Duty Ratio: Through the iterative process, the AFT algorithm continually updates the duty ratio positions until it converges to a point where the optimal duty ratio, representing the global maximum power point (GMPP), is determined. Subsequently, this optimal duty ratio is transmitted to the converter, facilitating the adjustment of power conversion to operate at the peak power output of the PV system ().
5. Simulation and Analysis
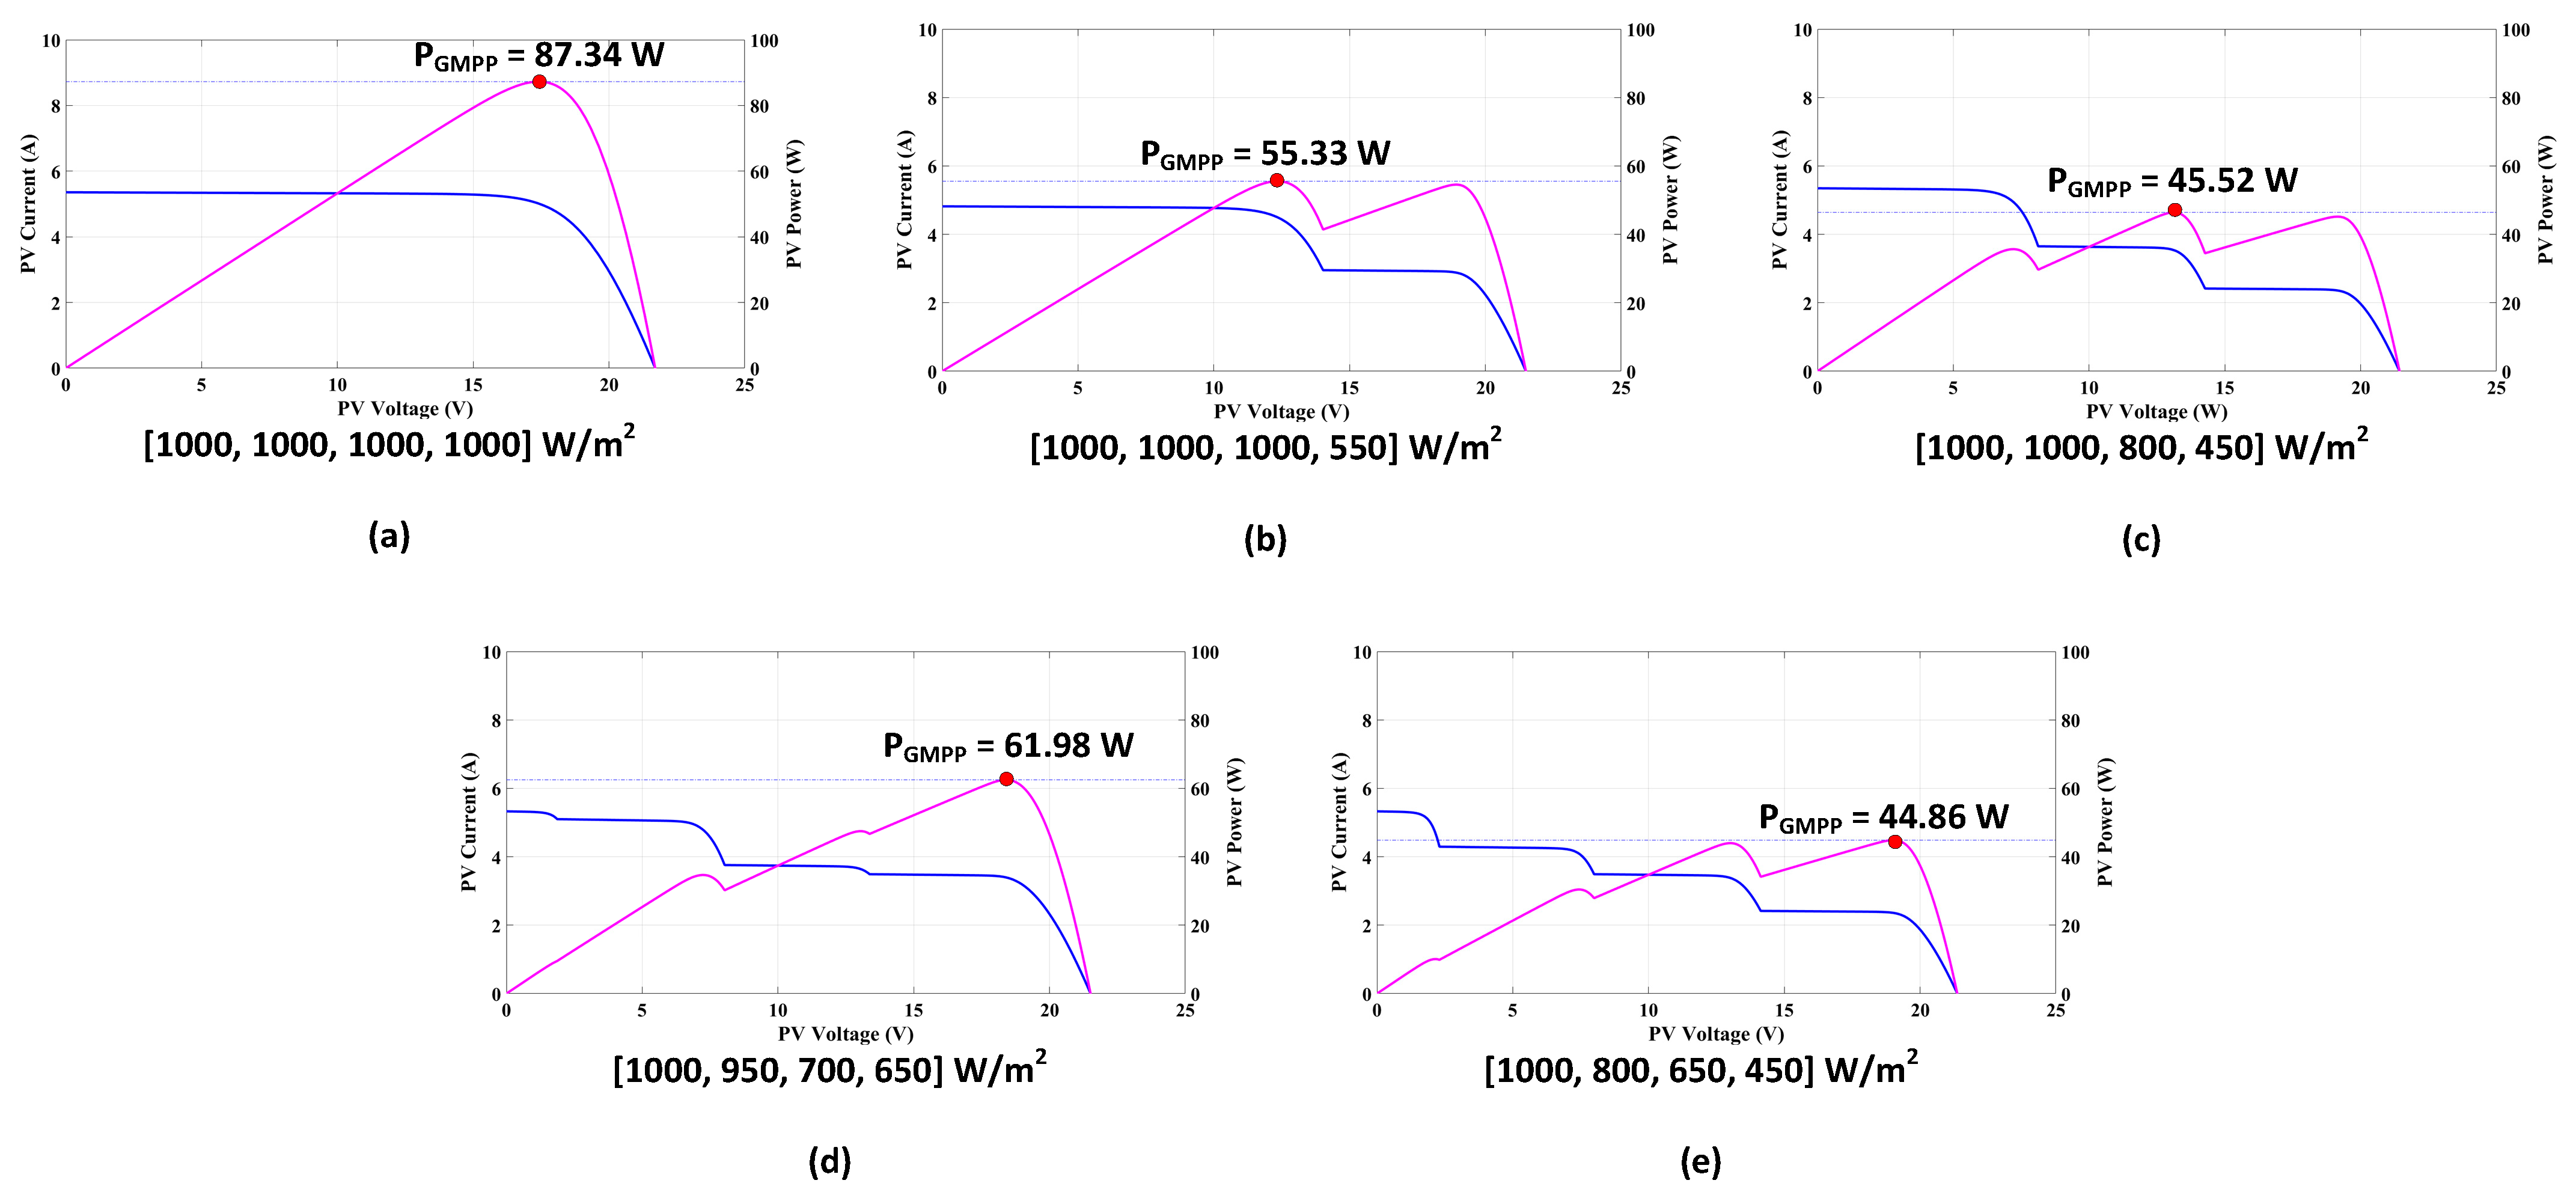
5.1. Static Shading Conditions
5.1.1. Condition 1
5.1.2. Condition 2
5.1.3. Condition 3
5.1.4. Condition 4
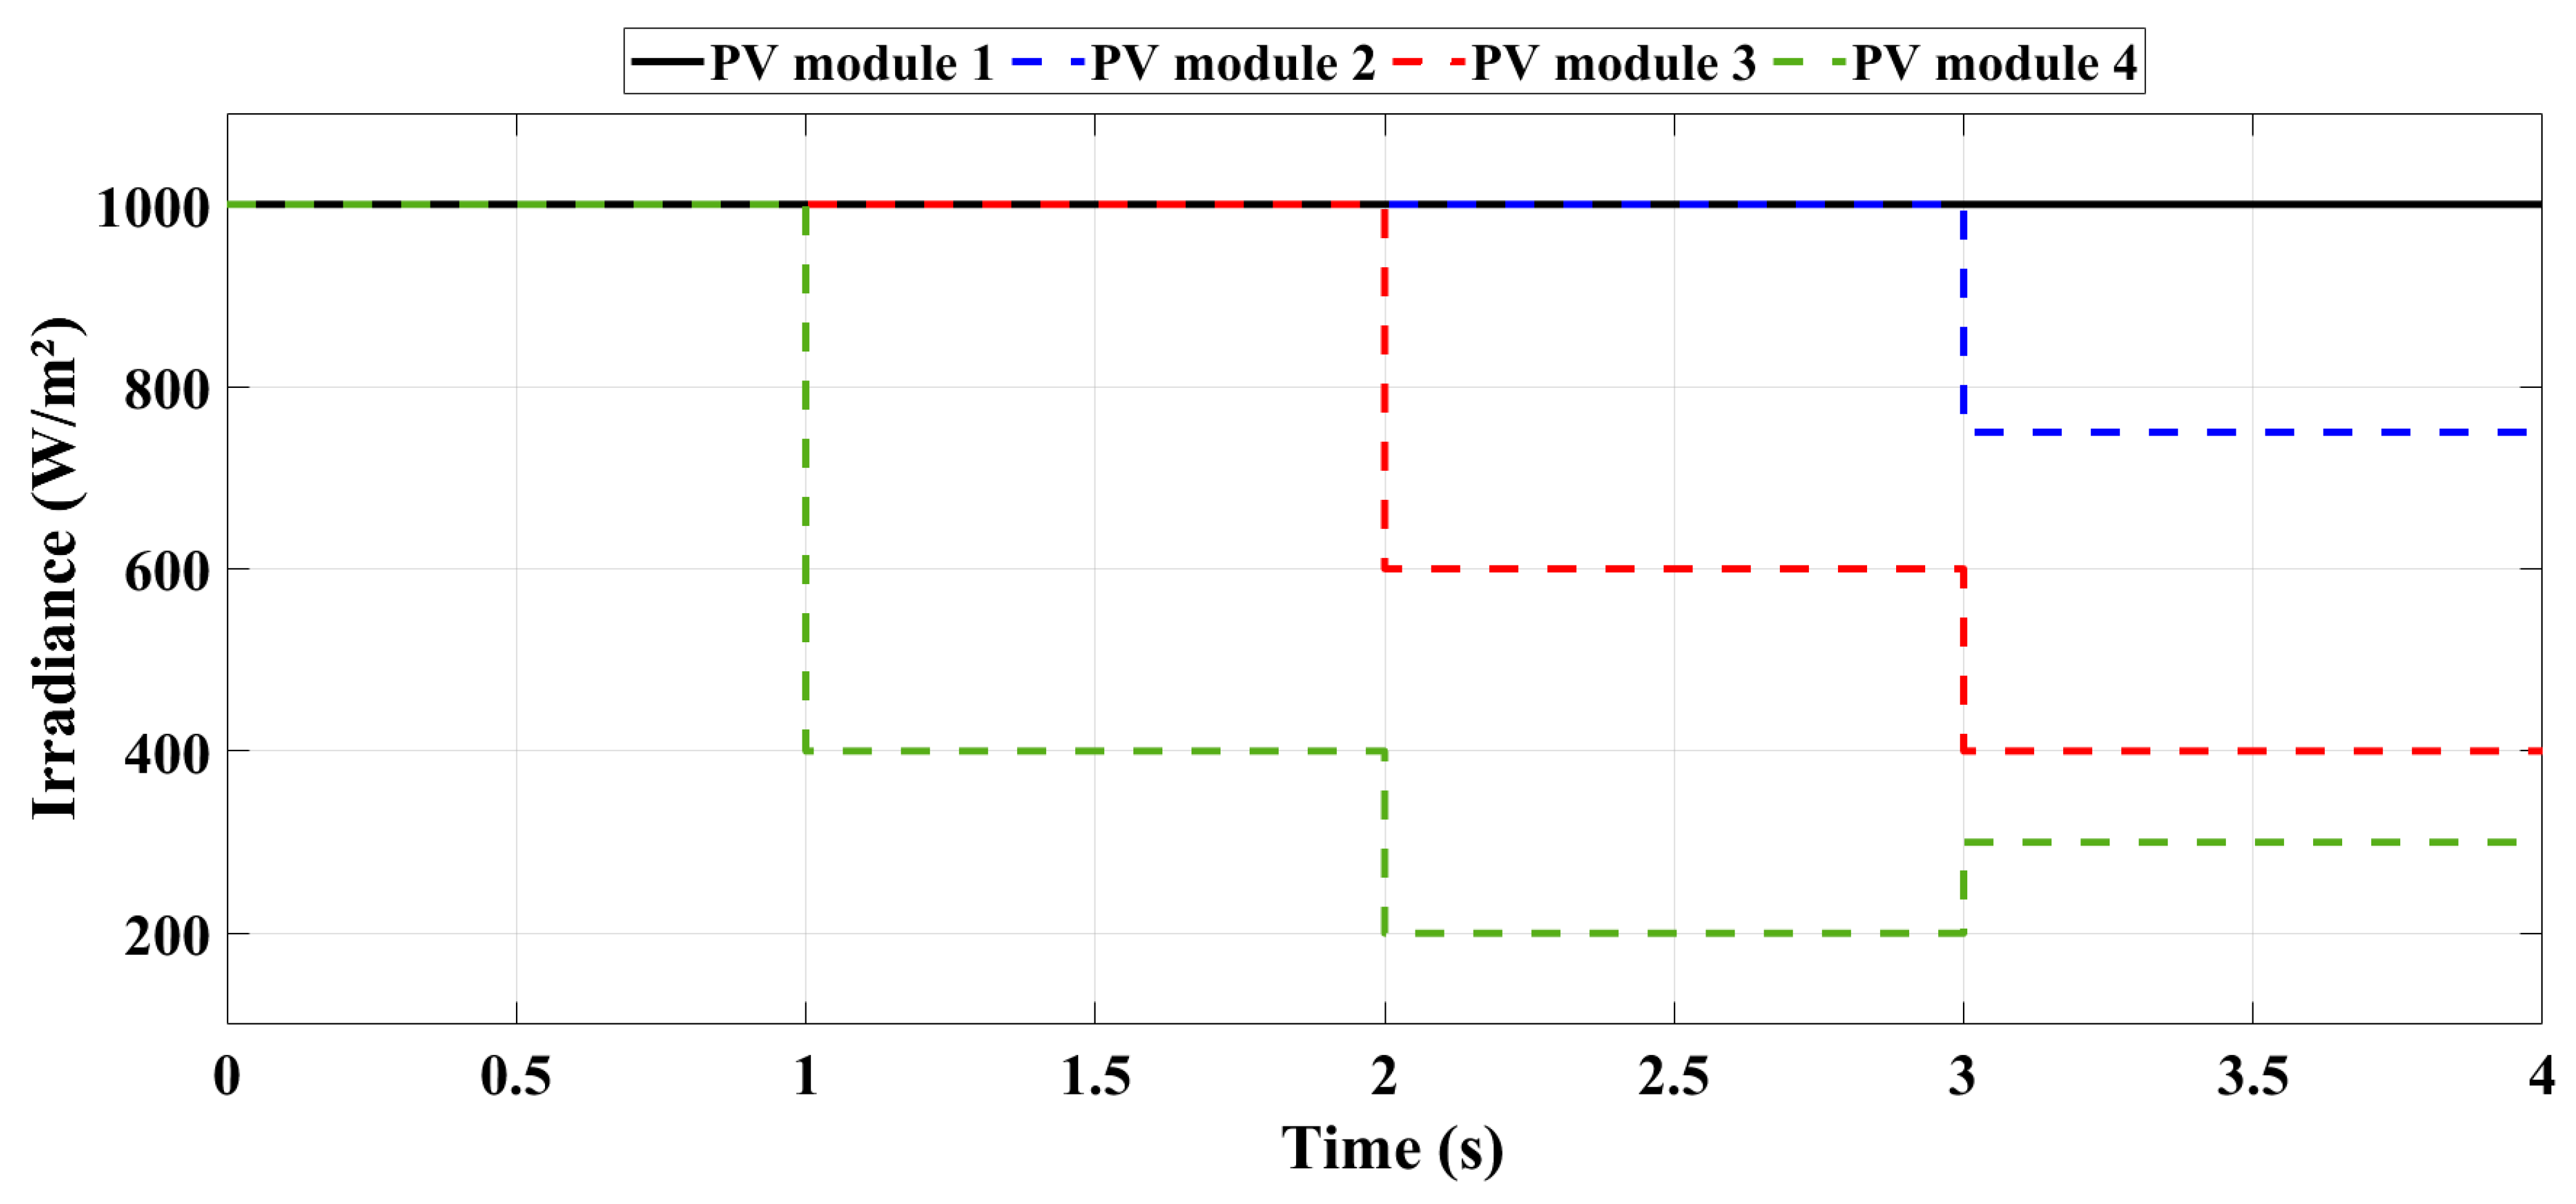
5.2. Dynamic Shading Conditions
5.3. Impact of Search Agent Count on AFT Algorithm Performance
6. Comparative Analysis of Algorithm Convergence
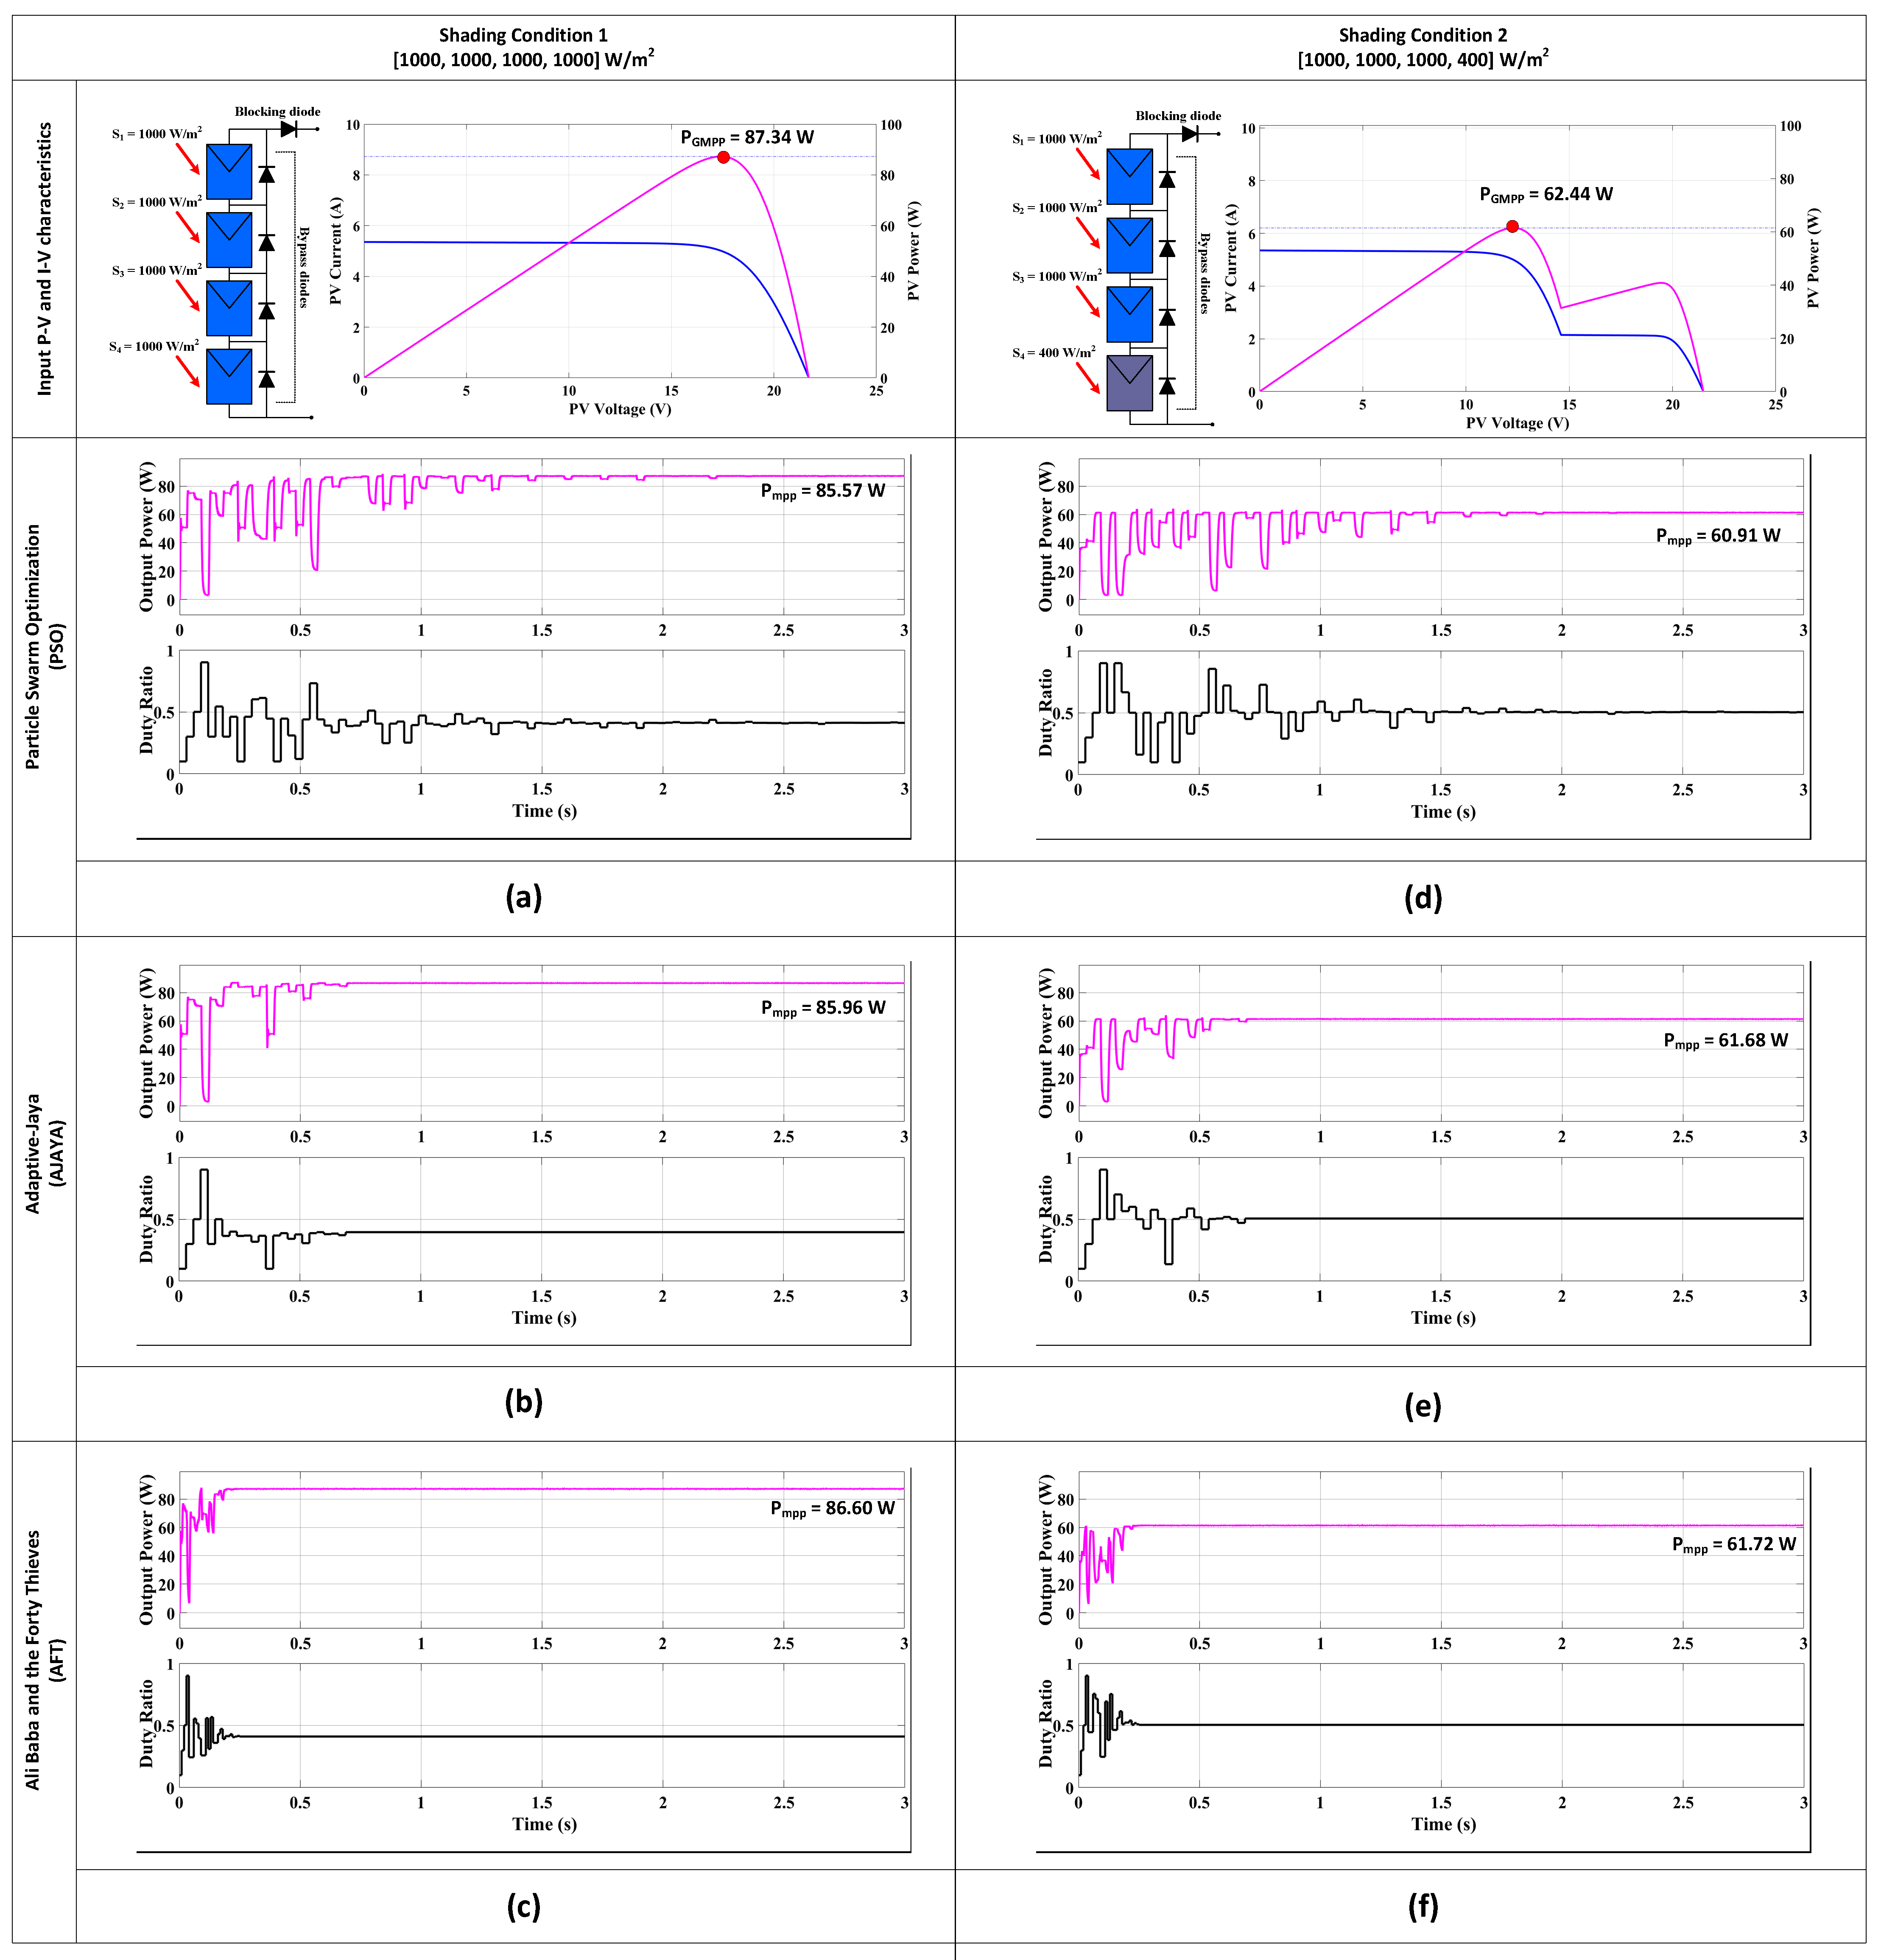
7. Implementation of the Proposed AFT Algorithm Using Real-Time HIL
7.1. Static Shading Conditions
7.1.1. Shading Condition 1
7.1.2. Shading Condition 2
7.1.3. Shading Condition 3
7.1.4. Shading Condition 4
7.1.5. Shading Condition 5


| Shading Condition (SC) | ) | Method | (W) | (W) | (%) | (s) | |||
|---|---|---|---|---|---|---|---|---|---|
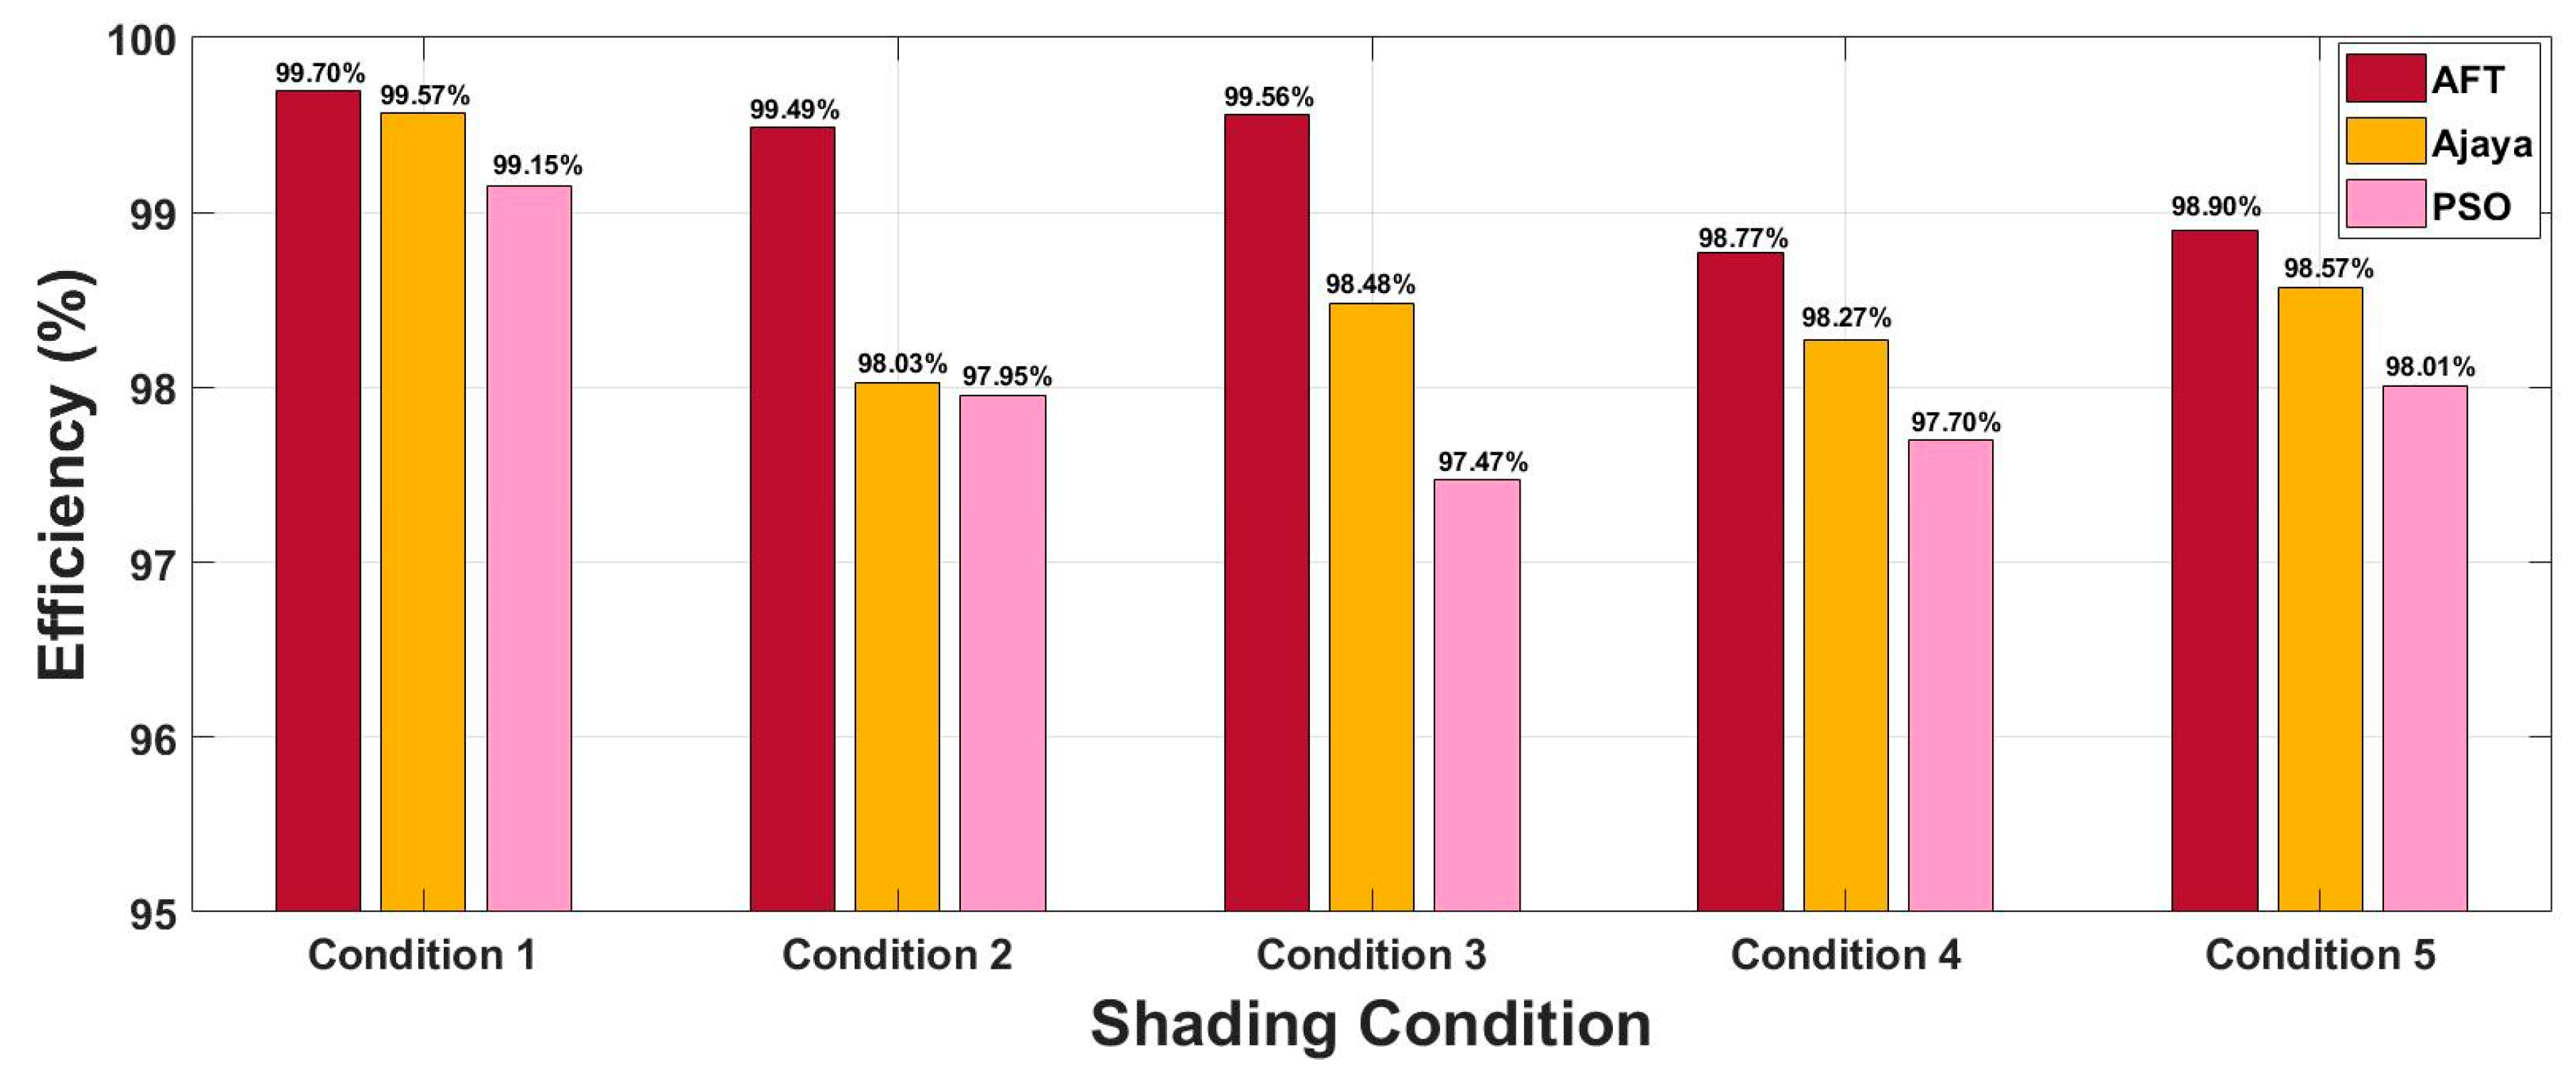
| 1 | 1000 | 1000 | 1000 | 1000 | AFT | 87.34 | 87.08 | 99.70 | 0.9 |
| A-JAYA | 86.97 | 99.57 | 1.4 | ||||||
| PSO | 86.60 | 99.15 | 4.8 | ||||||
| 2 | 1000 | 1000 | 1000 | 550 | AFT | 55.33 | 55.05 | 99.49 | 0.9 |
| A-JAYA | 54.24 | 98.03 | 1.4 | ||||||
| PSO | 54.20 | 97.95 | 4.0 | ||||||
| 3 | 1000 | 1000 | 800 | 450 | AFT | 45.52 | 45.32 | 99.56 | 0.6 |
| A-JAYA | 44.83 | 98.48 | 1.4 | ||||||
| PSO | 44.37 | 97.47 | 2.8 | ||||||
| 4 | 1000 | 950 | 700 | 650 | AFT | 61.98 | 61.22 | 98.77 | 0.8 |
| A-JATA | 60.91 | 98.27 | 1.8 | ||||||
| PSO | 60.56 | 97.70 | 4.6 | ||||||
| 5 | 1000 | 800 | 650 | 450 | AFT | 44.86 | 44.37 | 98.90 | 0.8 |
| A-JAYA | 44.22 | 98.57 | 2.4 | ||||||
| PSO | 43.97 | 98.01 | 3.6 | ||||||


7.2. Dynamic Shading Conditions
8. Conclusions
Author Contributions
Funding
Data Availability Statement
Acknowledgments
Conflicts of Interest
References
- Mahto, R.; John, R. Modeling of Photovoltaic Module. In Solar Cells—Theory, Materials and Recent Advances; IntechOpen: London, UK, 2021. [Google Scholar] [CrossRef]
- Shubbak, M.H. Advances in solar photovoltaics: Technology review and patent trends. Renew. Sustain. Energy Rev. 2019, 115, 109383. [Google Scholar] [CrossRef]
- Garnett, E.C.; Ehrler, B.; Polman, A.; Alarcon-Llado, E. Photonics for Photovoltaics: Advances and Opportunities. ACS Photonics 2021, 8, 61–70. [Google Scholar] [CrossRef] [PubMed]
- Green, M.A. How Did Solar Cells Get So Cheap? Joule 2019, 3, 631–633. [Google Scholar] [CrossRef]
- Ding, H.; Zhou, D.Q.; Liu, G.Q.; Zhou, P. Cost reduction or electricity penetration: Government R&D-induced PV development and future policy schemes. Renew. Sustain. Energy Rev. 2020, 124, 109752. [Google Scholar]
- Singh, R.; Tripathi, P.; Yatendra, K. Impact of Solar Photovoltaic Penetration in Distribution Network. In Proceedings of the 2019 3rd International Conference on Recent Developments in Control, Automation Power Engineering (RDCAPE), Noida, India, 10–11 October 2019; pp. 551–556. [Google Scholar] [CrossRef]
- Zhu, W.; Shang, L.; Li, P.; Guo, H. Modified hill climbing MPPT algorithm with reduced steady—State oscillation and improved tracking efficiency. J. Eng. 2018, 2018, 1878–1883. [Google Scholar] [CrossRef]
- Srishti, D.; Samajdar, P.; Padhy, P.K. Incremental Conductance Based Model Predictive Control Algorithm for Solar PV Module for Tracking of MPP. In Proceedings of the 2023 IEEE Region 10 Symposium (TENSYMP), Canberra, Australia, 6–8 September 2023; pp. 1–6. [Google Scholar] [CrossRef]
- Ali, A.I.; Mousa, H.H.; Mohamed, H.R.; Kamel, S.; Hassan, A.S.; Alaas, Z.M.; Mohamed, E.E.; Youssef, A.R. An Enhanced P&O MPPT Algorithm with Concise Search Area for Grid-Tied PV Systems. IEEE Access 2023, 11, 79408–79421. [Google Scholar] [CrossRef]
- El-sharawy, L.A.; El-helw, H.M.; Hasanien, H.M. Enhanced Grey Wolf optimization for GMPP Tracking of PV Systems under Partial Shading Condition. In Proceedings of the 2019 21st International Middle East Power Systems Conference (MEPCON), Cairo, Egypt, 17–19 December 2019; pp. 858–865. [Google Scholar] [CrossRef]
- Chaudhary, S.; Singh, A. Analysis of AI Techniques for Maximum Power Point Tracking under Partial Shading Conditions. In Proceedings of the 2020 IEEE 17th India Council International Conference (INDICON), New Delhi, India, 10–13 December 2020; pp. 1–6. [Google Scholar] [CrossRef]
- Chaudhary, S.; Singh, A. Simplified Optimized Fuzzy Logic Controller for Maximum Power Point Tracking in PV Array under Partial Shading Conditions. In Proceedings of the 2021 IEEE Mysore Sub Section International Conference (MysuruCon), Hassan, India, 24–25 October 2021; pp. 279–284. [Google Scholar] [CrossRef]
- Rehman, U.U.; Faria, P.; Gomes, L.; Vale, Z. Artificial Neural Network Based Efficient Maximum Power Point Tracking for Photovoltaic Systems. In Proceedings of the 2022 IEEE International Conference on Environment and Electrical Engineering and 2022 IEEE Industrial and Commercial Power Systems Europe (EEEIC/I&CPS Europe), Prague, Czech Republic, 28 June–1 July 2022; pp. 1–6. [Google Scholar] [CrossRef]
- Kumar, N.; Hussain, I.; Singh, B.; Panigrahi, B.K. Rapid MPPT for uniformly and partial shaded PV system by using JayaDE algorithm in highly fluctuating atmospheric conditions. IEEE Trans. Ind. Inform. 2017, 13, 2406–2416. [Google Scholar] [CrossRef]
- Anand, R.; Swaroop, D.; Kumar, B. Global Maximum Power Point Tracking for PV Array under Partial Shading using Cuckoo Search. In Proceedings of the 2020 IEEE 9th Power India International Conference (PIICON), Sonepat, India, 28 February–1 March 2020; pp. 1–6. [Google Scholar] [CrossRef]
- Mohanty, S.; Subudhi, B.; Ray, P.K. A new MPPT design using grey Wolf optimization technique for photovoltaic system under partial shading conditions. IEEE Trans. Sustain. Energy 2016, 7, 181–188. [Google Scholar] [CrossRef]
- Ram, J.P.; Rajasekar, N. A Novel Flower Pollination Based Global Maximum Power Point Method for Solar Maximum Power Point Tracking. IEEE Trans. Power Electron. 2017, 32, 8486–8499. [Google Scholar]
- Fapi, C.B.N.; Tchakounté, H.; Hamida, M.A.; Wira, P.; Kamta, M. Experimental Implementation of Improved P&O MPPT Algorithm based on Fuzzy Logic for Solar Photovoltaic Applications. In Proceedings of the 2023 11th International Conference on Smart Grid (icSmartGrid), Paris, France, 4–7 July 2023; pp. 1–6. [Google Scholar] [CrossRef]
- Li, W.; Zhang, G.; Pan, T.; Zhang, Z.; Geng, Y.; Wang, J. A Lipschitz Optimization-Based MPPT Algorithm for Photovoltaic System under Partial Shading Condition. IEEE Access 2019, 7, 126323–126333. [Google Scholar] [CrossRef]
- Obukhov, S.; Ibrahim, A.; Diab, A.A.Z.; Al-Sumaiti, A.S.; Aboelsaud, R. Optimal Performance of Dynamic Particle Swarm Optimization Based Maximum Power Trackers for Stand-Alone PV System under Partial Shading Conditions. IEEE Access 2020, 8, 20770–20785. [Google Scholar] [CrossRef]
- Teshome, D.F.; Lee, C.H.; Lin, Y.W.; Lian, K.L. A modified firefly algorithm for photovoltaic maximum power point tracking control under partial shading. IEEE J. Emerg. Sel. Top. Power Electron. 2017, 5, 661–671. [Google Scholar] [CrossRef]
- Kumar, B.; Kumar, R.; Kumar, P.; Kumar, R.; Singh, P.; Kumar, A. Analysis and Performance Evolution of Novel Global Modified Flower Pollination Algorithm for Photovoltaic System under Partial Shading Condition. In Proceedings of the 2022 2nd International Conference on Emerging Frontiers in Electrical and Electronic Technologies (ICEFEET), Patna, India, 24–25 June 2022; pp. 1–6. [Google Scholar] [CrossRef]
- Nisa, M.; Andleeb, M.; Ilahi, B.F. Effect of Partial Shading on a PV Array and Its Maximum Power Point Tracking Using Particle Swarm Optimization. J. Phys. Conf. Ser. 2021, 1817, 12025. [Google Scholar] [CrossRef]
- Liu, Y.; Huang, S.; Huang, J.; Liang, W. A Particle Swarm Optimization-Based Maximum Power Point Tracking Algorithm for PV Systems operating under partially shaded conditions. IEEE Trans. Energy Convers. 2021, 27, 1027–1035. [Google Scholar] [CrossRef]
- Sangrody, R.; Taheri, S.; Cretu, A.-M.; Pouresmaeil, E. An Improved PSO-based MPPT Technique Using Stability and Steady State Analyses under Partial Shading Conditions. IEEE Trans. Sustain. Energy 2023, 1–10. [Google Scholar] [CrossRef]
- Lv, X.; Wang, Y.; Deng, J.; Zhang, G.; Zhang, L. Improved Particle Swarm Optimization Algorithm Based on Last-Eliminated Principle and Enhanced Information Sharing. Comput. Intell. Neurosci. 2018, 2018, 5025672. [Google Scholar] [CrossRef] [PubMed]
- Eltamaly, A.M.; Al-Saud, M.S.; Abokhalil, A.G.; Farh, H.M.H. Simulation and experimental validation of fast adaptive particle swarm optimization strategy for photovoltaic global peak tracker under dynamic partial shading. Renew. Sustain. Energy Rev. 2020, 124, 109719. [Google Scholar] [CrossRef]
- Huang, C.; Zhang, Z.; Wang, L.; Song, Z.; Long, H. A novel global maximum power point tracking method for PV system using jaya algorithm. In Proceedings of the 2017 IEEE Conference on Energy Internet and Energy System Integration (EI2), Beijing, China, 26–28 November 2017; pp. 1–5. [Google Scholar] [CrossRef]
- Padmanaban, S.; Priyadarshi, N.; Bhaskar, M.S.; Holm-Nielsen, J.B.; Hossain, E.; Azam, F. A hybrid photovoltaic-fuel cell for grid integration with jaya-based maximum power point tracking: Experimental performance evaluation. IEEE Access 2019, 7, 82978–82990. [Google Scholar] [CrossRef]
- Ali, M.E. A novel musical chairs algorithm applied for MPPT of PV systems. Renew. Sustain. Energy Rev. 2021, 146, 111135. [Google Scholar] [CrossRef]
- Braik, M.; Ryalat, M.H.; Al-Zoubi, H. A novel meta-heuristic algorithm for solving numerical optimization problems: Ali Baba and the forty thieves. Neural Comput. Appl. 2022, 34, 409–455. [Google Scholar] [CrossRef]
- Eltamaly, A.M.; Farh, H.M.H.; Al Saud, M.S. Impact of PSO Reinitialization on the Accuracy of Dynamic Global Maximum Power Detection of Variant Partially Shaded PV Systems. Sustainability 2019, 11, 2091. [Google Scholar] [CrossRef]
- Rehman, H.; Sajid, I.; Sarwar, A.; Tariq, M.; Bakhsh, F.I.; Ahmad, S.; Mahmoud, H.A.; Aziz, A. Driving training-based optimization (DTBO) for global maximum power point tracking for a photovoltaic system under partial shading condition. IET Renew. Power Gener. 2023, 17, 2542–2562. [Google Scholar] [CrossRef]
- Sajid, I.; Gautam, A.; Sarwar, A.; Tariq, M.; Liu, H.-D.; Ahmad, S.; Lin, C.-H.; Sayed, A.E. Optimizing Photovoltaic Power Production in Partial Shading Conditions Using Dandelion Optimizer (DO)-Based MPPT Method. Processes 2023, 11, 2493. [Google Scholar] [CrossRef]
- Pervez, I.; Pervez, A.; Tariq, M.; Sarwar, A.; Chakrabortty, R.K.; Ryan, M.J. Rapid and Robust Adaptive Jaya (Ajaya) Based Maximum Power Point Tracking of a PV-Based Generation System. IEEE Access 2021, 9, 48679–48703. [Google Scholar] [CrossRef]


| Parameters | Values |
|---|---|
| Number of PV modules in series | 4 |
| Number of series connected cells per module | 72 |
| The power rating of PV module | 21.837 W |
| Maximum operating power | 87.348 |
| Maximum operating current | 5.02 |
| Maximum operating voltage | 17.4 |
| Short circuit current | 5.34 |
| Open circuit voltage | 21.7 |
| Temperature coefficient of | 0.075%/°C |
| Temperature coefficient of | −0.37501%/°C |
| Photo-generated current | 5.3624 |
| Diode saturation current | 3.052 10−10 |
| Diode ideality factor | 0.12439 |
| Series resistance | 79.3172 |
| Shunt resistance | 0.081018 |
| Components | Values |
|---|---|
| Input capacitance | 47 |
| Output capacitance | 470 |
| Inductor | 1.478 |
| Switching frequency | 20 |
| Load | 10 |
| Parameters | PSO | A-JAYA | AFT |
|---|---|---|---|
| Number of particles | 4 | 4 | 4 |
| Maximum number of iterations () | 100 | 100 | 100 |
| Social parameter (c1) | 1.2 | – | – |
| Cognitive parameter (c2) | 1.6 | – | – |
| Inertia weight | 0.4 | – | – |
| Initial value of adaptive coefficient 1 | – | 1 | – |
| Final value of adaptive coefficient 1 | – | 0.5 | – |
| Initial value of adaptive coefficient 2 | – | 1 | – |
| Final value of adaptive coefficient 2 | – | 0 | – |
| Initial estimate | – | – | 1 |
| Final estimate | – | – | 1 |
| Shading Condition (SC) | ) | Method | (W) | (W) | (%) | (s) | |||
|---|---|---|---|---|---|---|---|---|---|
| 1 | 1000 | 1000 | 1000 | 1000 | AFT | 87.34 | 86.60 | 99.15 | 0.23 |
| A-JAYA | 85.96 | 98.41 | 0.70 | ||||||
| PSO | 85.57 | 97.97 | 2.23 | ||||||
| 2 | 1000 | 1000 | 1000 | 400 | AFT | 62.44 | 61.72 | 98.84 | 0.25 |
| A-JAYA | 61.68 | 98.78 | 0.70 | ||||||
| PSO | 60.91 | 97.54 | 1.92 | ||||||
| 3 | 1000 | 1000 | 600 | 200 | AFT | 41.61 | 41.50 | 99.73 | 0.21 |
| A-JAYA | 41.09 | 98.75 | 0.94 | ||||||
| PSO | 40.97 | 98.46 | 1.33 | ||||||
| 4 | 1000 | 750 | 400 | 300 | AFT | 30.09 | 29.83 | 99.13 | 0.25 |
| A-JAYA | 29.01 | 96.41 | 1.18 | ||||||
| PSO | 28.91 | 96.07 | 2.29 | ||||||
| Algorithm | (W) | (W) | (%) | (s) | Duty Ratio (D) | Number of Iterations (t) |
|---|---|---|---|---|---|---|
| AFT | 50.75 | 50.26 | 99.03 | 0.25 | 0.4277 | 4 |
| A-JAYA | 50.08 | 98.67 | 0.76 | 0.4205 | 6 | |
| PSO | 49.82 | 98.16 | 2.24 | 0.4259 | 17 |
Disclaimer/Publisher’s Note: The statements, opinions and data contained in all publications are solely those of the individual author(s) and contributor(s) and not of MDPI and/or the editor(s). MDPI and/or the editor(s) disclaim responsibility for any injury to people or property resulting from any ideas, methods, instructions or products referred to in the content. |
© 2023 by the authors. Licensee MDPI, Basel, Switzerland. This article is an open access article distributed under the terms and conditions of the Creative Commons Attribution (CC BY) license (https://creativecommons.org/licenses/by/4.0/).
Share and Cite
Rehman, K.U.; Sajid, I.; Lu, S.-D.; Ahmad, S.; Liu, H.-D.; Bakhsh, F.I.; Tariq, M.; Sarwar, A.; Lin, C.-H. Fast Tracking of Maximum Power in a Shaded Photovoltaic System Using Ali Baba and the Forty Thieves (AFT) Algorithm. Processes 2023, 11, 2946. https://doi.org/10.3390/pr11102946
Rehman KU, Sajid I, Lu S-D, Ahmad S, Liu H-D, Bakhsh FI, Tariq M, Sarwar A, Lin C-H. Fast Tracking of Maximum Power in a Shaded Photovoltaic System Using Ali Baba and the Forty Thieves (AFT) Algorithm. Processes. 2023; 11(10):2946. https://doi.org/10.3390/pr11102946
Chicago/Turabian StyleRehman, Khalil Ur, Injila Sajid, Shiue-Der Lu, Shafiq Ahmad, Hwa-Dong Liu, Farhad Ilahi Bakhsh, Mohd Tariq, Adil Sarwar, and Chang-Hua Lin. 2023. "Fast Tracking of Maximum Power in a Shaded Photovoltaic System Using Ali Baba and the Forty Thieves (AFT) Algorithm" Processes 11, no. 10: 2946. https://doi.org/10.3390/pr11102946