
Study on the Countermeasures and Mechanism of Balanced Utilization in Multilayer Reservoirs at Ultra-High Water Cut Period

1
State Key Laboratory of Petroleum Resource and Prospecting, China University of Petroleum, Beijing 102249, China
2
School of Petroleum Engineering, China University of Petroleum, Beijing 102249, China
3
Engineering Technology Research Institute, PetroChina Southwest Oil & Gas Field Company, Chengdu 610017, China
4
College of Science, China University of Petroleum, Beijing 102249, China
*
Author to whom correspondence should be addressed.
Processes 2023, 11(11), 3111; https://doi.org/10.3390/pr11113111
Submission received: 15 October 2023
/
Revised: 23 October 2023
/
Accepted: 25 October 2023
/
Published: 30 October 2023
(This article belongs to the Special Issue Flow in Porous Media and CO2 Storage in Enhanced Oil Recovery)
Abstract
:After entering the ultra-high water cut stage of multilayer oil reservoirs, the remaining oil is highly dispersed. Due to the continuous development of general water injection, the generation of advantageous channels makes interlayer contradictions more prominent, and the differences in the utilization between different layers are even greater. After the water drive development of multilayer oil reservoirs enters the ultra-high water cut stage, the development effect deteriorates year by year. Layer restructuring is an effective method of improving the water injection development effect and increasing the degree of utilization. In essence, its goal is to achieve balanced utilization for multiple development layers to increase the degree of recovery. This article mainly employs physical simulation experiments combined with reservoir numerical simulation technology to jointly study the effects of different equilibrium production strategies in the ultra-high water cut period of multilayer oil reservoirs and their mechanism of action based on the remaining oil distribution field and streamline field. As a specific implementation, we use large-plate physical simulation to demonstrate the effectiveness of the rotational injection and production strategy, and to supplement the physical simulation experiment with a reservoir numerical simulation model, we analyze the mechanism of different balanced production strategies. The research results for the combination of physical simulation experiments and numerical simulation experiments show that the combined strategy of rotary injection and rotary production is the most effective method for use in multilayer and ultra-high water cut oil reservoirs. The displacement effect of the high-permeability layer is better, and the increase in the recovery degree is relatively large, while the displacement effect of the low-permeability layer is relatively weak. After conventional water drive oil recovery, the remaining oil mainly exists in the edge area of the research area. However, the use of three-dimensional well network injection wheel recovery changes the streamline field, produces the effect of fluid flow diversion, expands the water drive sweep coefficient, and improves the recovery rate. Chemical plugging can effectively replace water drive oil recovery and will become the main method for improving the recovery rate of such reservoirs in the lower part.
1. Introduction
As water injection methods continue to evolve, oilfields are entering periods of high water cut or even ultra-high water cut stages [1,2,3,4,5,6]. This leads to highly dispersed remaining oil, presenting significant challenges for oilfield development [7,8,9,10]. In reservoirs with multiple vertical layers, the interlayer contradiction becomes more prominent when using a development approach that combines water injection and production. This intensified contradiction results in uneven distribution of remaining oil across different layers, making it difficult to enhance recovery [9,10,11]. However, oilfields in the extra-high water cut stage still offer untapped development potential [12,13].
Development practices have demonstrated that layer recombination is an effective strategy for mitigating interlayer conflicts [14,15]. Layer recombination aims to balance the utilization of multiple oil layers to enhance recovery in multilayer reservoirs. However, the choice of balanced development strategies in the presence of varying distribution patterns of remaining oil in different layers requires further investigation. The mechanisms applicable to different balanced development strategies are not yet well-defined but are crucial for understanding the development of such reservoirs and improving recovery rates.
In light of these challenges, both domestic and international scholars have conducted extensive research on technical and numerical simulation methods for layer division, layer recombination, and chemical profile control [16,17,18,19,20,21,22,23]. Subdivision-based stratigraphic recombination plays a vital role in reducing differences between reservoir layers and achieving balanced development in multilayer reservoirs. It is one of the technical approaches used in secondary oil development projects. However, current research faces two primary issues: firstly, it needs to focus more on technology and methods and incorporate experimental research, and secondly, it lacks clarity on the applicable conditions and mechanisms associated with different development strategies following formation recombination.
Therefore, there is a pressing need for an experimental method that can visually depict the reorganization of multilayer reservoirs at the ultra-high water cut stage to facilitate in-depth research on balanced production.
In this paper, a set of three-dimensional visual physical cementation models are designed and combined with numerical simulation technology. The paper quantitatively characterizes the recovery performance of different development strategies after the reorganization of a multilayer reservoir in the ultra-high water cut stage. It explores the applicable conditions for various balanced utilization strategies and studies their utilization effects, distribution patterns, and the distribution of remaining oil under different development modes. The paper aims to clarify the mechanism of balanced utilization in multilayer reservoirs at the ultra-high water cut stage, providing valuable insights for stable production and increased oilfield output.
2. Balanced Utilization Measures for Water Injection Development in Multilayer Reservoirs during the Ultra-High Water Cut Stage
With the widespread adoption of water injection in major oilfields, they are progressively transitioning into high or ultra-high water cut stages, where the remaining oil becomes highly dispersed and challenging to extract. In reservoirs with multiple vertical layers, the heterogeneity between layers becomes more pronounced under the water injection combined production approach, leading to severe interlayer interference and resulting in highly uneven distribution of remaining oil. Consequently, enhancing the recovery rate becomes a formidable task. Mitigating interlayer conflicts through layer restructuring has proven to be an effective solution. However, choosing the right injection and production methods to enhance the recovery rate after restructuring the natural layer system remains a primary challenge.
Currently, there are four commonly used injection and production methods in major oilfields:
- (1)
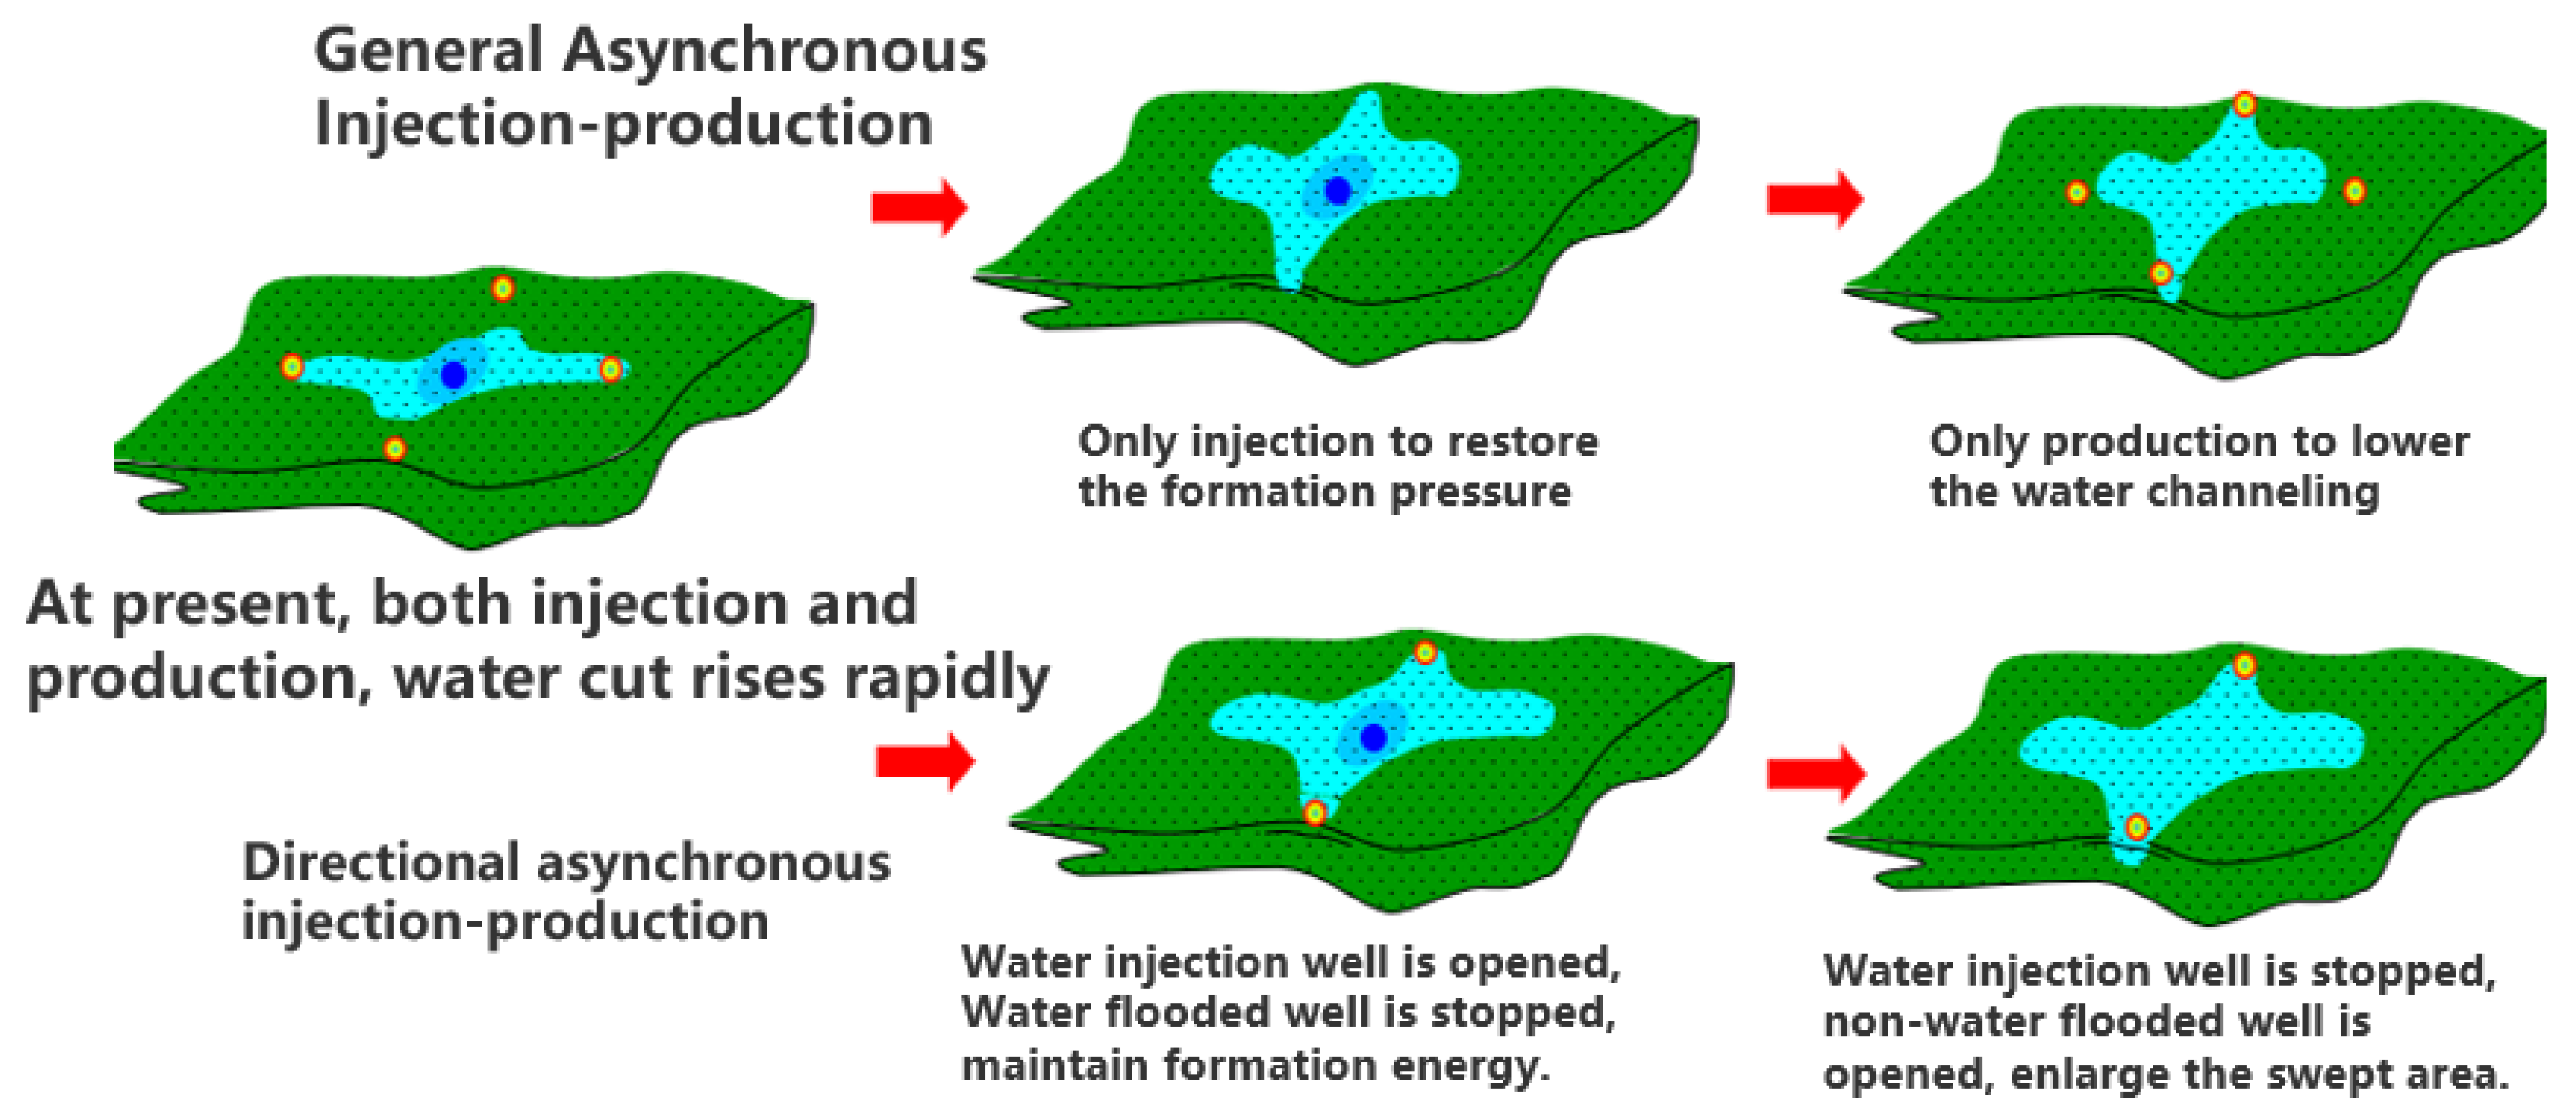
- Asynchronous injection production
This approach involves periodic water injection, where no production occurs during injection. It includes three stages: water injection, shut-in, and production. During the water injection stage, oil wells are shut down while injection wells receive water. In the shut-in stage, both injection and production wells are closed. During the production stage, water injection wells are shut down and production wells are opened.
For the rapid rise of water cut in oil wells, the plane injection water distribution is uneven; the formation pressure is restored while shutting in the oil well and injecting the water. When the oil well is opened, the water injection is stopped to reduce water channeling (as shown in Figure 1).
- (2)
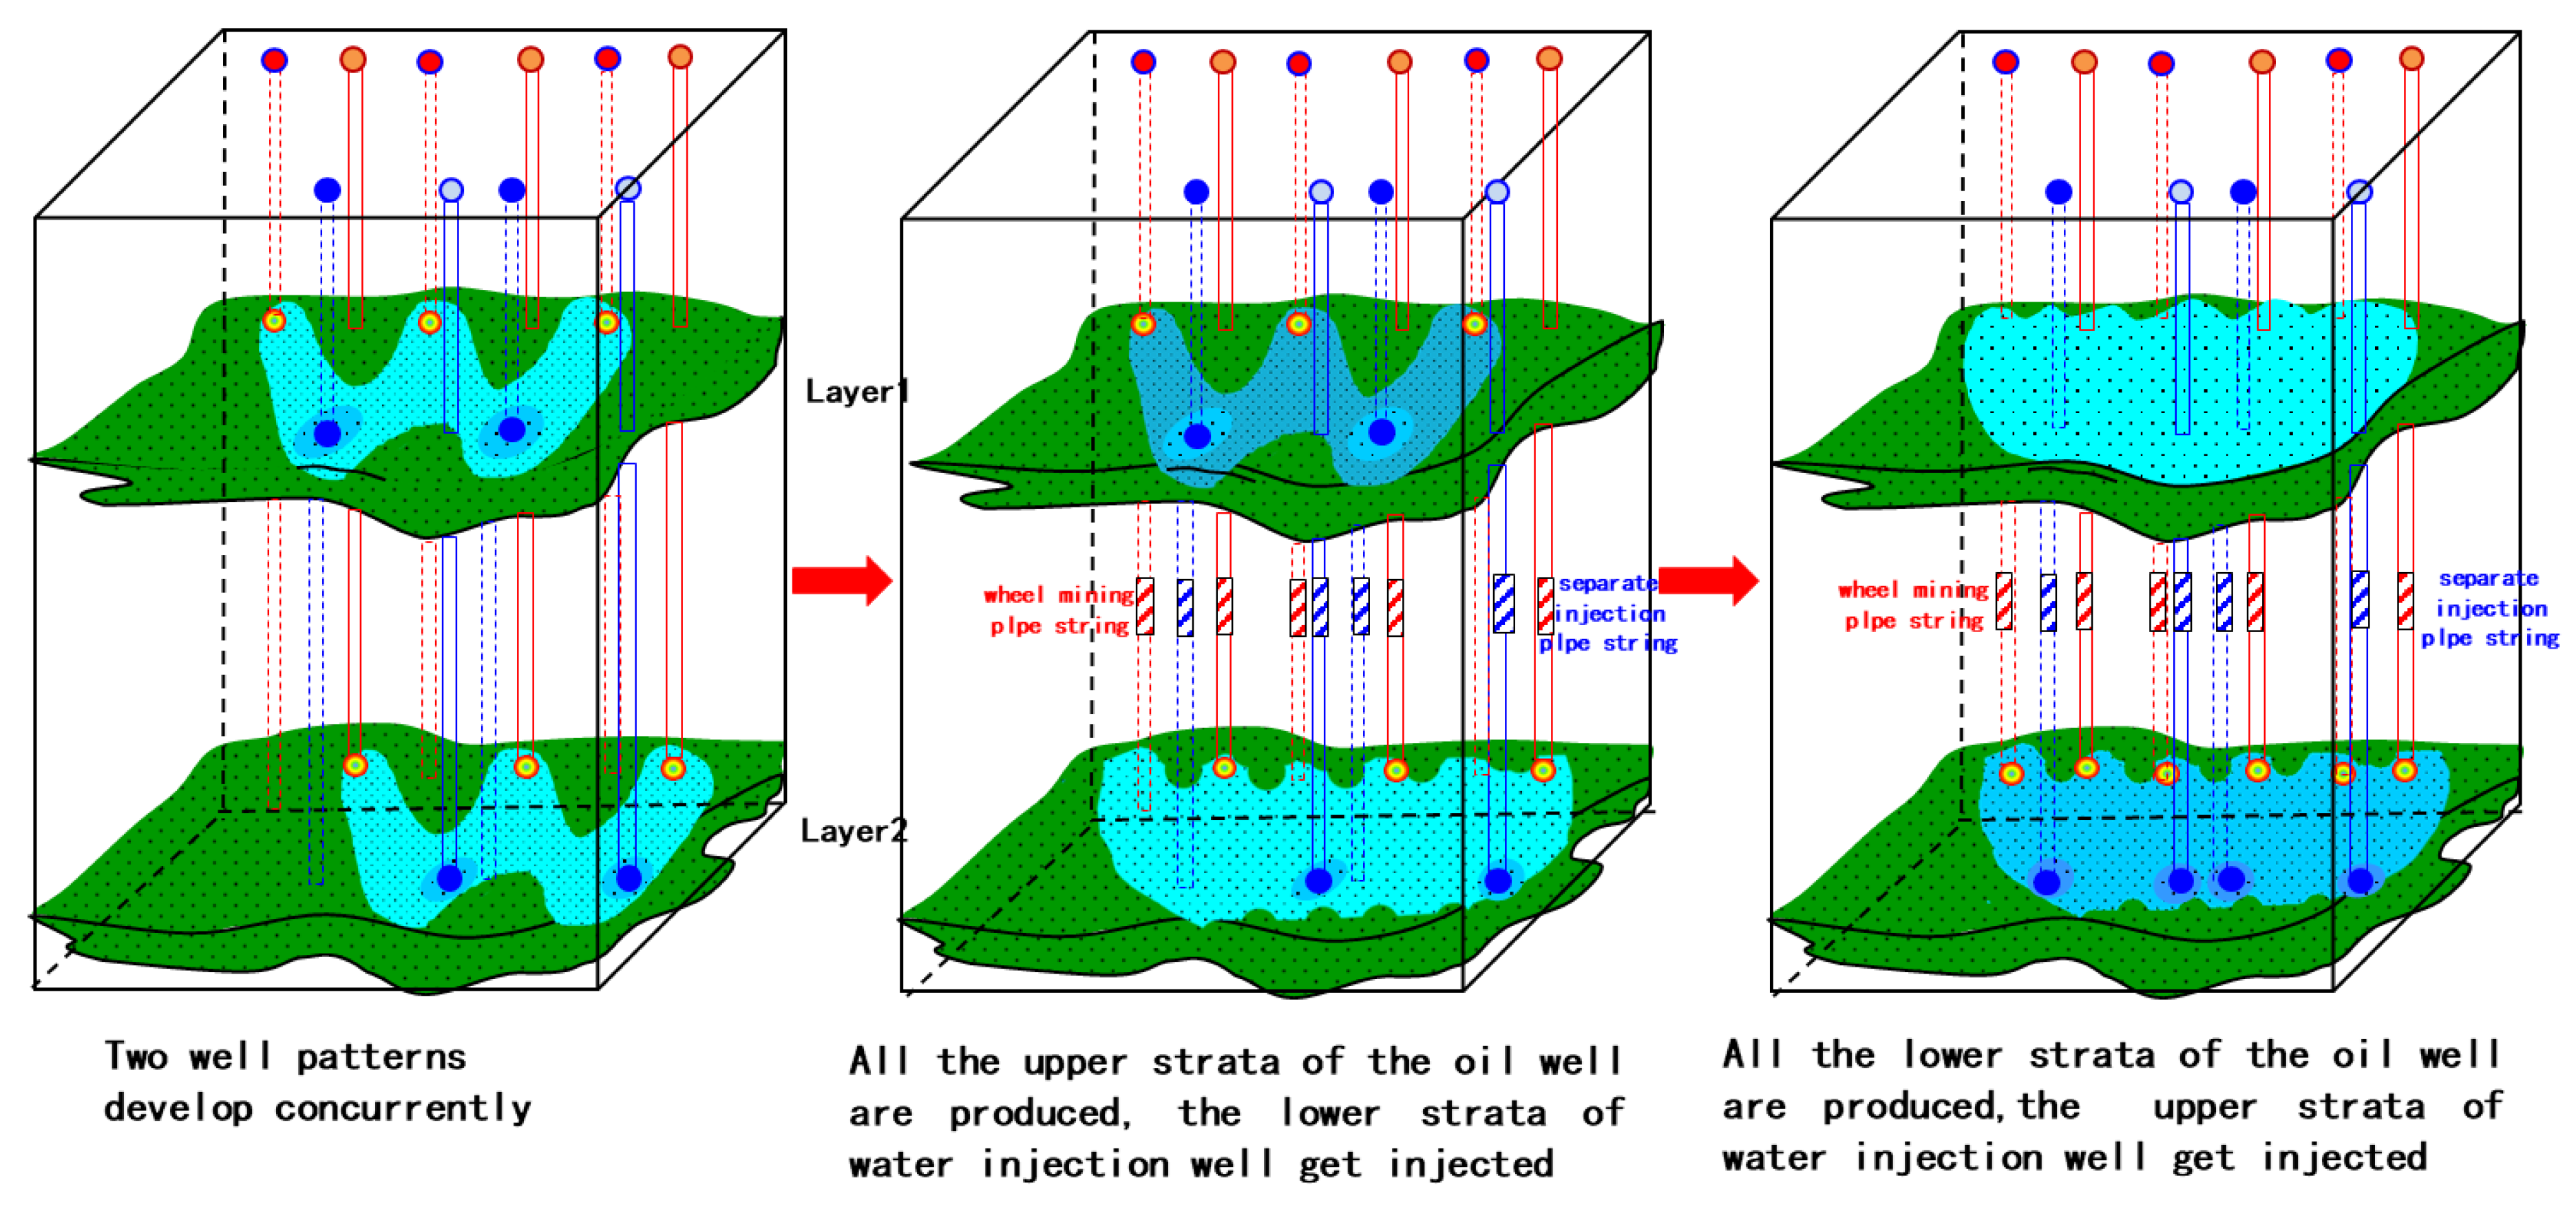
- Combined production by round injection
To address widespread water flooding and low oil production, this method involves joint production of upper and lower layers. It balances periodic water injection for a single layer with separate injection for upper and lower layers, reducing interlayer conflicts. The specific process is shown in Figure 2 below:
- (3)
- Cyclic injection and production
In response to the problem of insufficient energy in oil wells, combined production of upper and lower layers results in uneven utilization. The upper and lower layers are subjected to rotational injection and extraction, while the lower layer is injected and the upper layer is produced to restore the pressure of the lower layer: injecting the upper layer to produce the lower layer, restoring the pressure of the upper layer, achieving the effect of supplementing layered energy and improving the degree of recovery. The specific process is shown in Figure 3 below:
- (4)
- Separate injection and alternate mining
In response to the serious interlayer interference and obvious injection water channeling in oil wells, there is a significant difference in utilization due to the combined production of upper and lower layers. The upper and lower layers receive separate injection and rotational production to achieve the adjustment goals of periodic water injection, layered water injection, and subdivision of layer series, slowing down the pressure drop and water content increase and improving the vertical utilization degree. The specific process is shown in Figure 4 below:
By exploring these methods and their specific conditions, the paper aims to provide valuable insights into the development of multilayer reservoirs during the ultra-high water cut stage.
3. Study on Quantitative Physical Simulation of Interlayer Utilization Status
In order to clarify the interlayer utilization status of multilayer reservoirs during the ultra-high water cut period, a three-dimensional physical model was designed based on similarity criteria for a fault block reservoir in Shengli Oilfield. The saturation field distribution in the model is calculated by using the saturation measuring point method. Based on this, a large plate physical simulation experiment was designed. The specific experimental parameters are as follows:
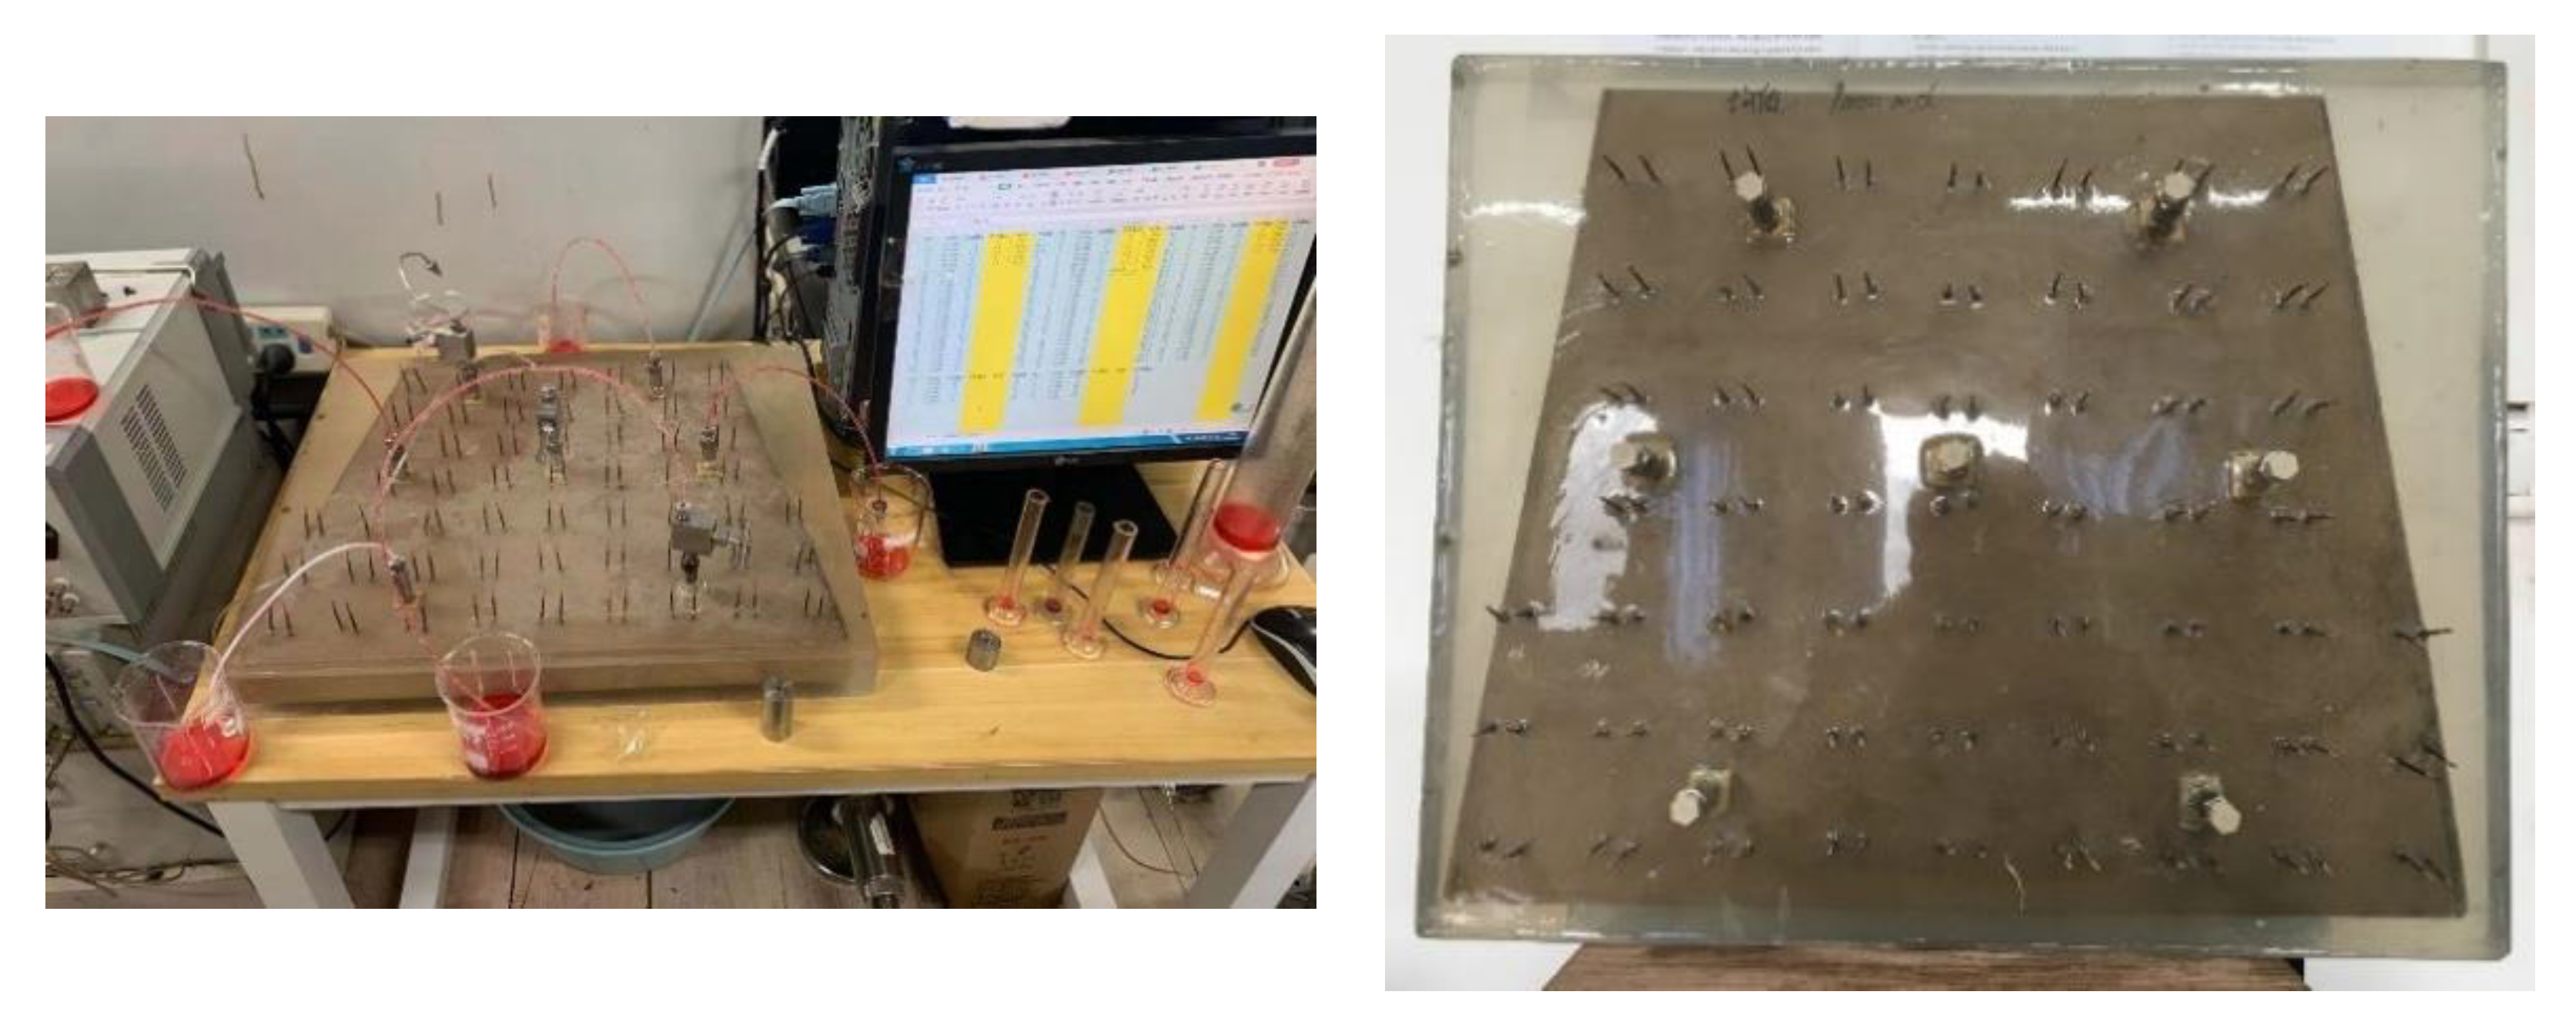
Design scale: 1:2000; according to the minimum well spacing and row spacing of 300 m, combined with the physical model process constraints, the design model and well location are shown in Figure 1; physical properties: the upper porosity is 0.3, the permeability is 1000 mD, and the thickness is 3 cm; the porosity of the lower layer is 0.2, the permeability is 300 mD, and the thickness is 2 cm. The middle is the interlayer, with no permeability, thickness of 1 cm; electrode setting: 5 cm × 5 cm, evenly distributed on the model (as shown in Figure 5).
Reference test (as shown in Figure 6):
- (1)
- Saturated oil after saturated water of rock sample;
- (2)
- Well 4 is injected with water, and the oil production of the surrounding wells reaches 80~85% of the water content;
- (3)
- Well 4 is shut in, wells 3, 6, and 7 are converted to water injection, other wells are opened for production until the water content reaches 92~93%.
After the benchmark experiment, the rotation injection and rotation production experiment of the three-dimensional well pattern is carried out, as shown in Figure 7:
The resistance is directly measured by an LCR digital bridge, and the saturation value can only be obtained by conversion.
- (1)
- The relationship between measured resistance value and resistivity is obtained from the calibration curve of the resistivity and resistance relationship:where: Rt—oil-bearing resistivity of rock, Ω·m;Rt = AR − B
- R—resistance, kΩ;
- A, B—coefficient, dimensionless.
- (2)
- The resistivity of the formation is calculated, and the water saturation is calculated by the Archie formula:In the formula: R0—rock complete water resistivity, Ω·m;
- Sw—water saturation, %;
- So—oil saturation, %;
- b—coefficient, dimensionless;
- n—saturation index, dimensionless.
The coefficient b and saturation index n are only related to the lithology of the rock, and they represent the influence of the distribution of oil and water in the pores on the resistivity of the oil-bearing rock. There are two methods to determine the coefficients b and n: core displacement experiment method and empirical coefficient method. Generally, b = 1 and n = 2 are used for pure sand.
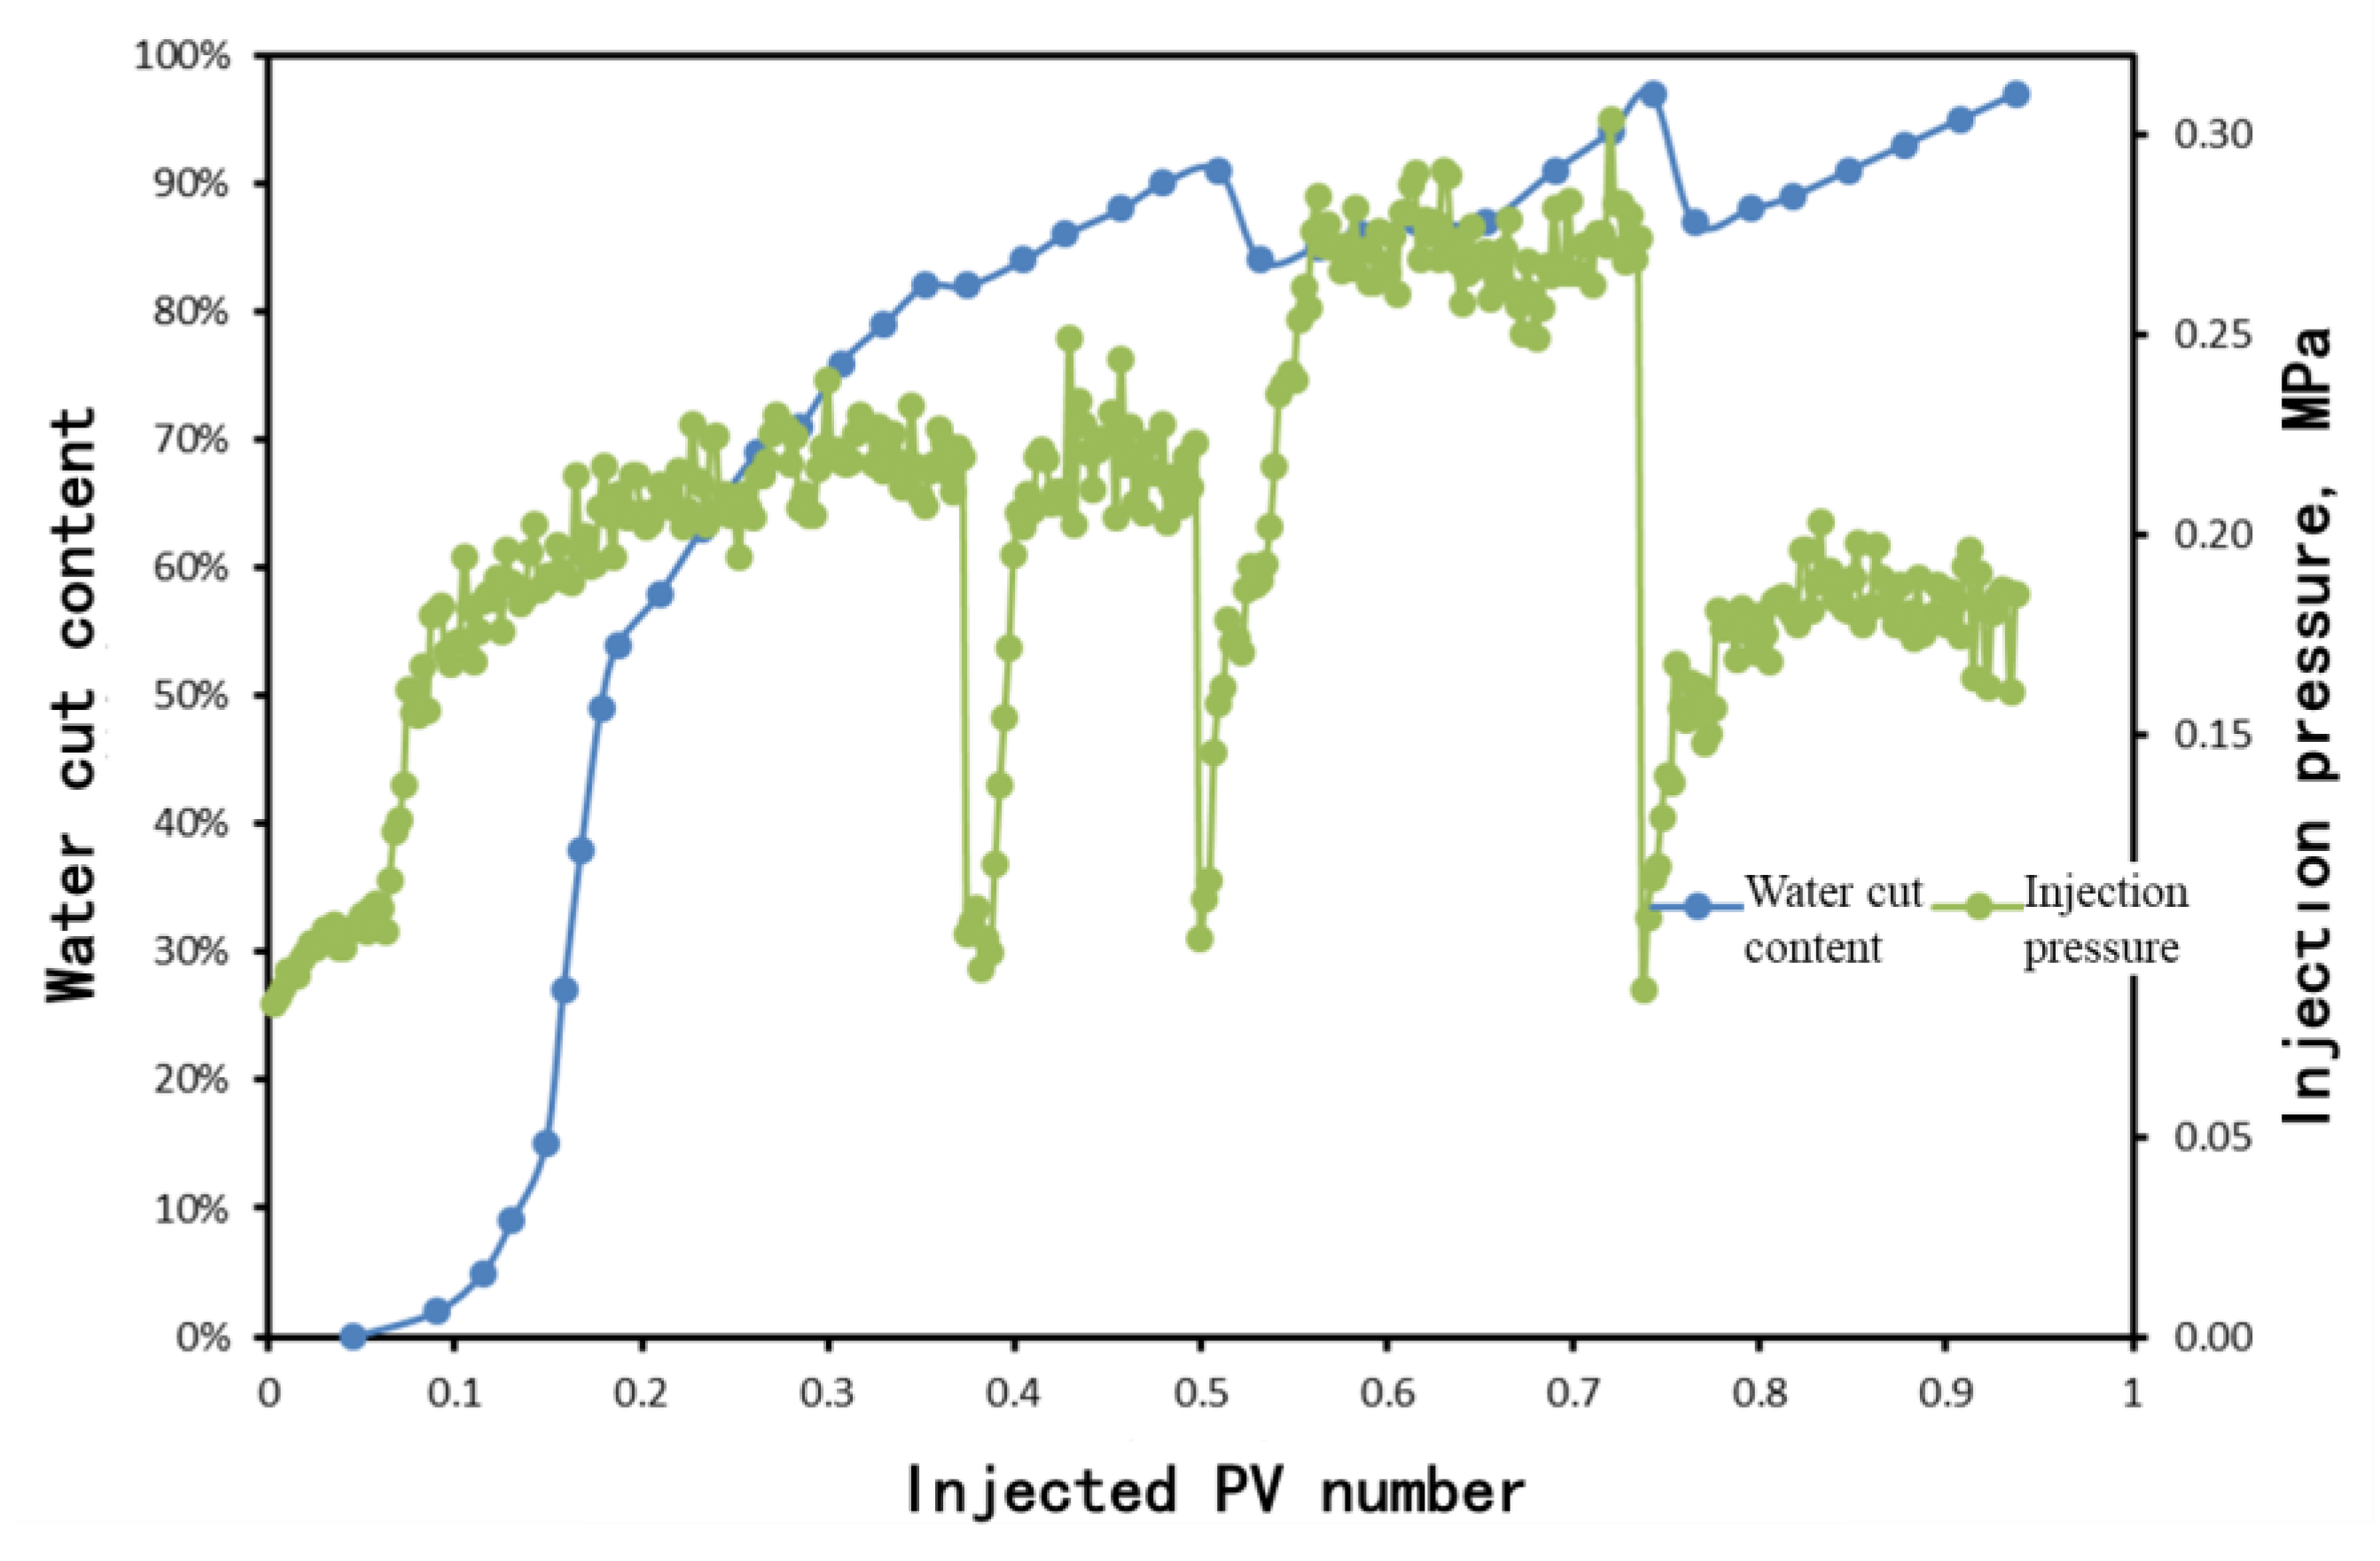
The production performance measured by the resistance method is shown in Figure 8, Figure 9 and Figure 10 below:
From the physical experiments of large plates, it can be seen that the preparation stage of the experiment involves simulating the reservoir formation process and the formation process of bound water for two large plates of saturated formation water and saturated oil (with a relatively high-permeability layer of 1000 mD and a relatively low-permeability layer of 300 mD), and then water flooding them to a water content of 92%. The experimental stage involves a three-dimensional well network for rotary injection and production, and the well is shut in after the water content reaches 98%. From the statistical analysis of production performance of each well, it is found that: (1) the recovery degree of a 300 mD large flat plate is lower than that of a 1000 mD large flat plate, with a 2.3% lower recovery degree in the first stage of water flooding and a 3.12% lower final recovery degree; (2) the recovery degree of layers of differing permeability after using three-dimensional well network injection wheel mining is significantly higher than that of the first stage of water drive. Among them, the recovery degree of the 300 mD large flat plate increased by 9.69%, and the recovery degree of the 1000 mD large flat plate increased by 10.51% (as shown in Table 1).
The remaining oil distribution is shown in Figure 11.
It can be seen from the figure that:
- (1)
- After the first stage of water drive, the remaining oil is mainly distributed in the upper and lower edge parts;
- (2)
- After the three-dimensional well pattern rotation injection and rotation production, the fluid flow changes direction, water channeling is reduced, and water injection sweep efficiency is expanded, which shows that the remaining oil is produced and the saturation of the remaining oil is significantly reduced. The displacement effect of remaining oil in the upper and lower edges of the 1000 mD large plate simulation model is obvious. The displacement effect of the upper part of the 300 mD large plate simulation model is good, while the displacement effect of the lower edge is weak.
The streamline changes are shown in Figure 12:
It can be seen from the obtained streamline chart that: after the vertical well pattern rotation injection and rotation production, the fluid flow in the formation is further verified to turn, the water injection wave efficiency is expanded, and the remaining oil is produced. The specific performance is as follows: the sweep of the low-permeability layer to the upper right is strengthened, and the transverse sweep of the high permeability layer is strengthened, which promotes the production of remaining oil and improves oil recovery.
4. Study on Quantitative Numerical Simulation of Interlayer Utilization Status
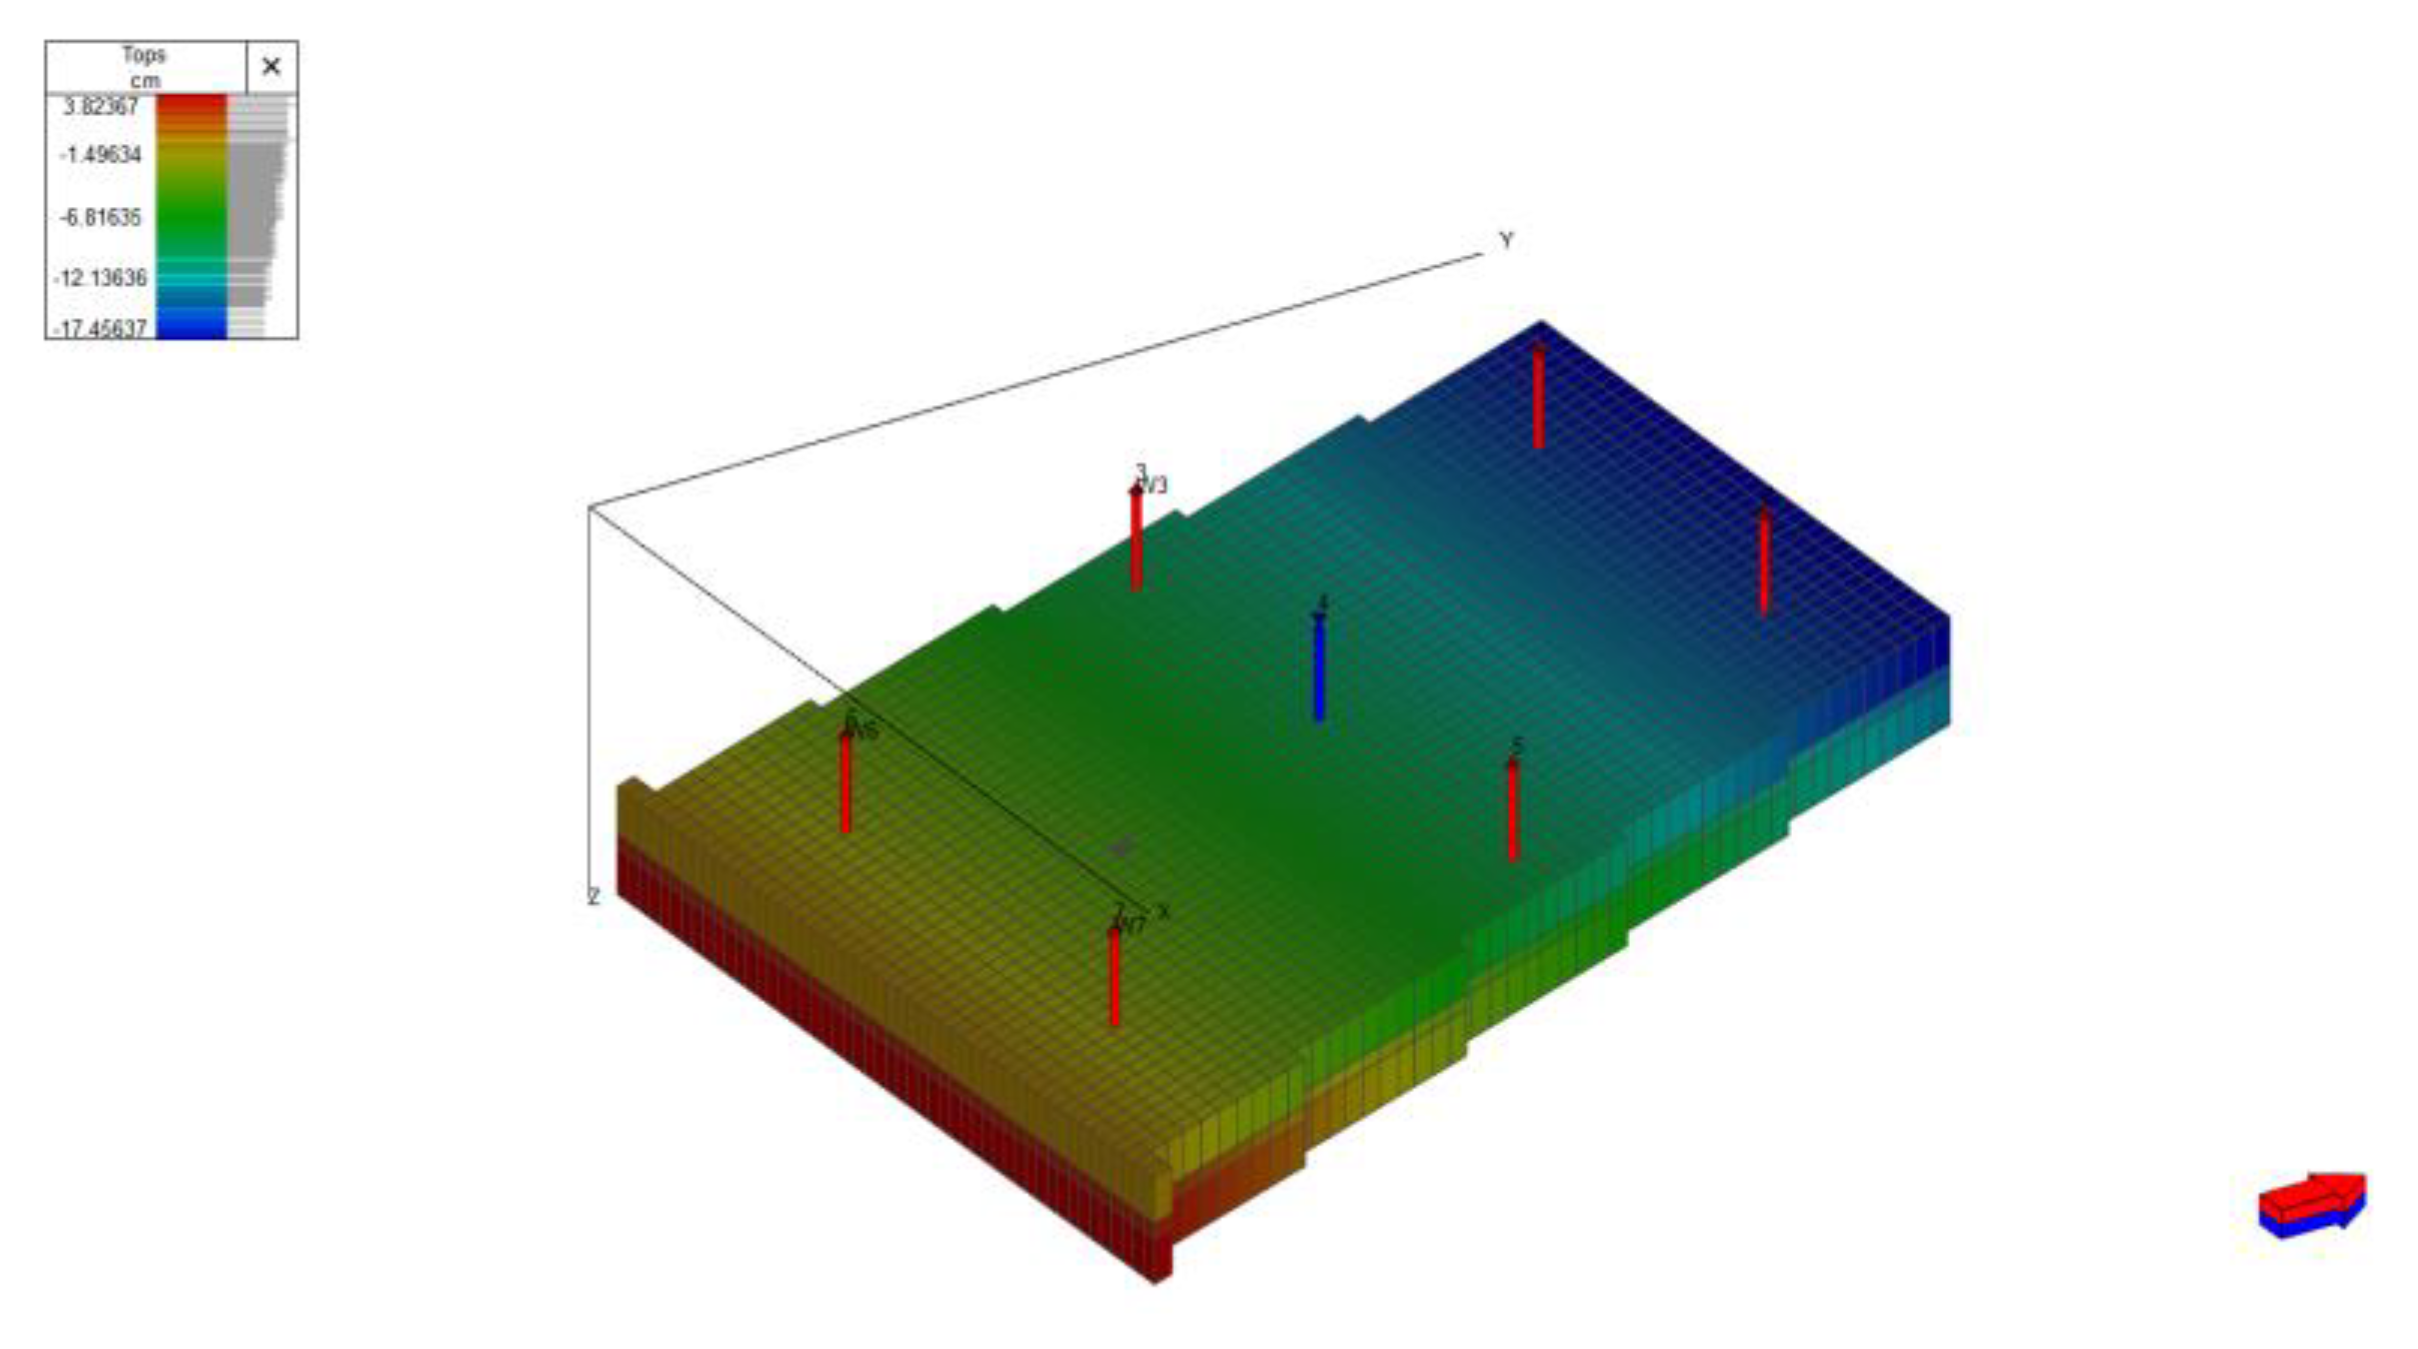
Due to the nonrepeatability of the large plate experiment and the difficulty of the experiment, the corresponding numerical simulation model is designed based on the actual large plate model to study the balanced production of multilayer reservoirs. This numerical simulation model mainly adopts balanced injection and production methods of rotary injection and production, combined injection and production, and separate injection and production. It analyzes the distribution and mechanism of remaining oil under different balanced injection and production methods. The numerical simulation model is shown in Figure 13.
Experiment preparation:
- The model has an inclination of 10° to the ground;
- Rock sample A is placed directly above rock sample B;
- The corresponding wells in rock sample AB are connected by a tee (A1 is connected with B1, A2 is connected with B2, and so on), so as to control the well opening and closing.
The production dynamic fitting is shown in Figure 14 below:
First, basic experiments are carried out (rock samples A and B follow the same steps):
- Saturated oil after saturated water of rock sample;
- Well 4 is injected with water, and the oil production of the surrounding wells reaches 80~85% of the water content;
- Well 4 is shut in, Well 3, Well 6, and Well 7 are transferred to water injection, and other wells are opened for production until the water content reaches 92~93%.
The result is shown in Figure 15 below:
On the basis of the basic experiments, the simulation research on the cyclic injection and cyclic production, separate injection and cyclic production, and cyclic injection and combined production and chemical plugging control is carried out.
- (1)
- Separate injection and alternate production
The first cycle: B3, B6, and B7 are injected with 2 mL/min of water, while A3, A6, and A7 are injected with 3 mL/min of water. Shut in B1, B2, and B5 and shut in A1, A2, and A5 when water cut reaches 98%.
The second cycle: water injection for B3, B6, and B7 with injection volume of 2 mL/min, and water injection for A3, A6, and A7 with injection volume of 3 mL/min. Shut in A1, A2, and A5 and shut in B1, B2, and B5 when the water content reaches 98%.
The results are shown in Figure 16 below:
The production changes of each well are shown in Table 2 below:
Measures are taken when the water cut reaches 92%. Compared with the direct simulation in which Wells 3, 6, and 7 are injected with water continuously until the water cut of production wells is 98%, the cumulative oil production after separate injection and alternate production can reach 3882.82, and the recovery factor of the whole area has increased by nearly 3%. According to the analysis of the oil production of each production well, the production increase effect of Well 2 is obvious after the separate injection and alternate production is adopted, and Wells 1 and 5 remain unchanged.
- (2)
- Cyclic injection and production
The first cycle: shut in A3, A6, and A7 and inject water into B3, B6, and B7. Shut in B1, B2, and B5 and shut in A1, A2, and A5 when water cut reaches 98%.
The second cycle: shut in B3, B6, and B7 and inject water into A3, A6, and A7. Shut in A1, A2, and A5 and shut in B1, B2, and B5 when the water content reaches 98%.
The results are shown in Figure 17 below:
The production changes of each well are shown in Table 3 below:
Measures are taken when the water cut reaches 92%. Compared with the direct simulation in which Wells 3, 6, and 7 are injected with water continuously until the water cut of production wells is 98%, the cumulative oil production after the use of cyclic injection and production can reach 3985.54, and the recovery factor in the whole area has increased by nearly 5%. According to the analysis of the oil production situation of each production well, after the use of cyclic injection and rotation production, the production increase effect of Wells 1 and 2 is relatively obvious, which is the main action area, and Well 5 is basically unchanged.
- (3)
- Combined production by round injection
The first cycle: shut in B3, B6, and B7 and inject water into A3, A6, and A7; 1. 2. Well 5 is shut in when the water content reaches 98%.
The second cycle: shut in A3, A6, and A7 and inject water into B3, B6, and B7; 1. 2. Well 5 is shut in when the water content reaches 98%.
The results are shown in Figure 18 below:
The production changes of each well are shown in Table 4 below:
Measures are taken when the water cut reaches 92%. Compared with the direct simulation in which Wells 3, 6, and 7 are injected with water continuously until the water cut of production wells is 98%, the cumulative oil production after the use of combined injection and production can reach 3912.82, and the recovery factor in the whole area has increased by nearly 4%. According to the analysis of the oil production situation of each production well, after the use of combined injection and production, the production increase effect of Wells 1 and 2 is relatively obvious, which is the main area of action, and Well 5 is basically unchanged.
- (4)
- Chemical plugging control
The results are shown in Figure 19 below:
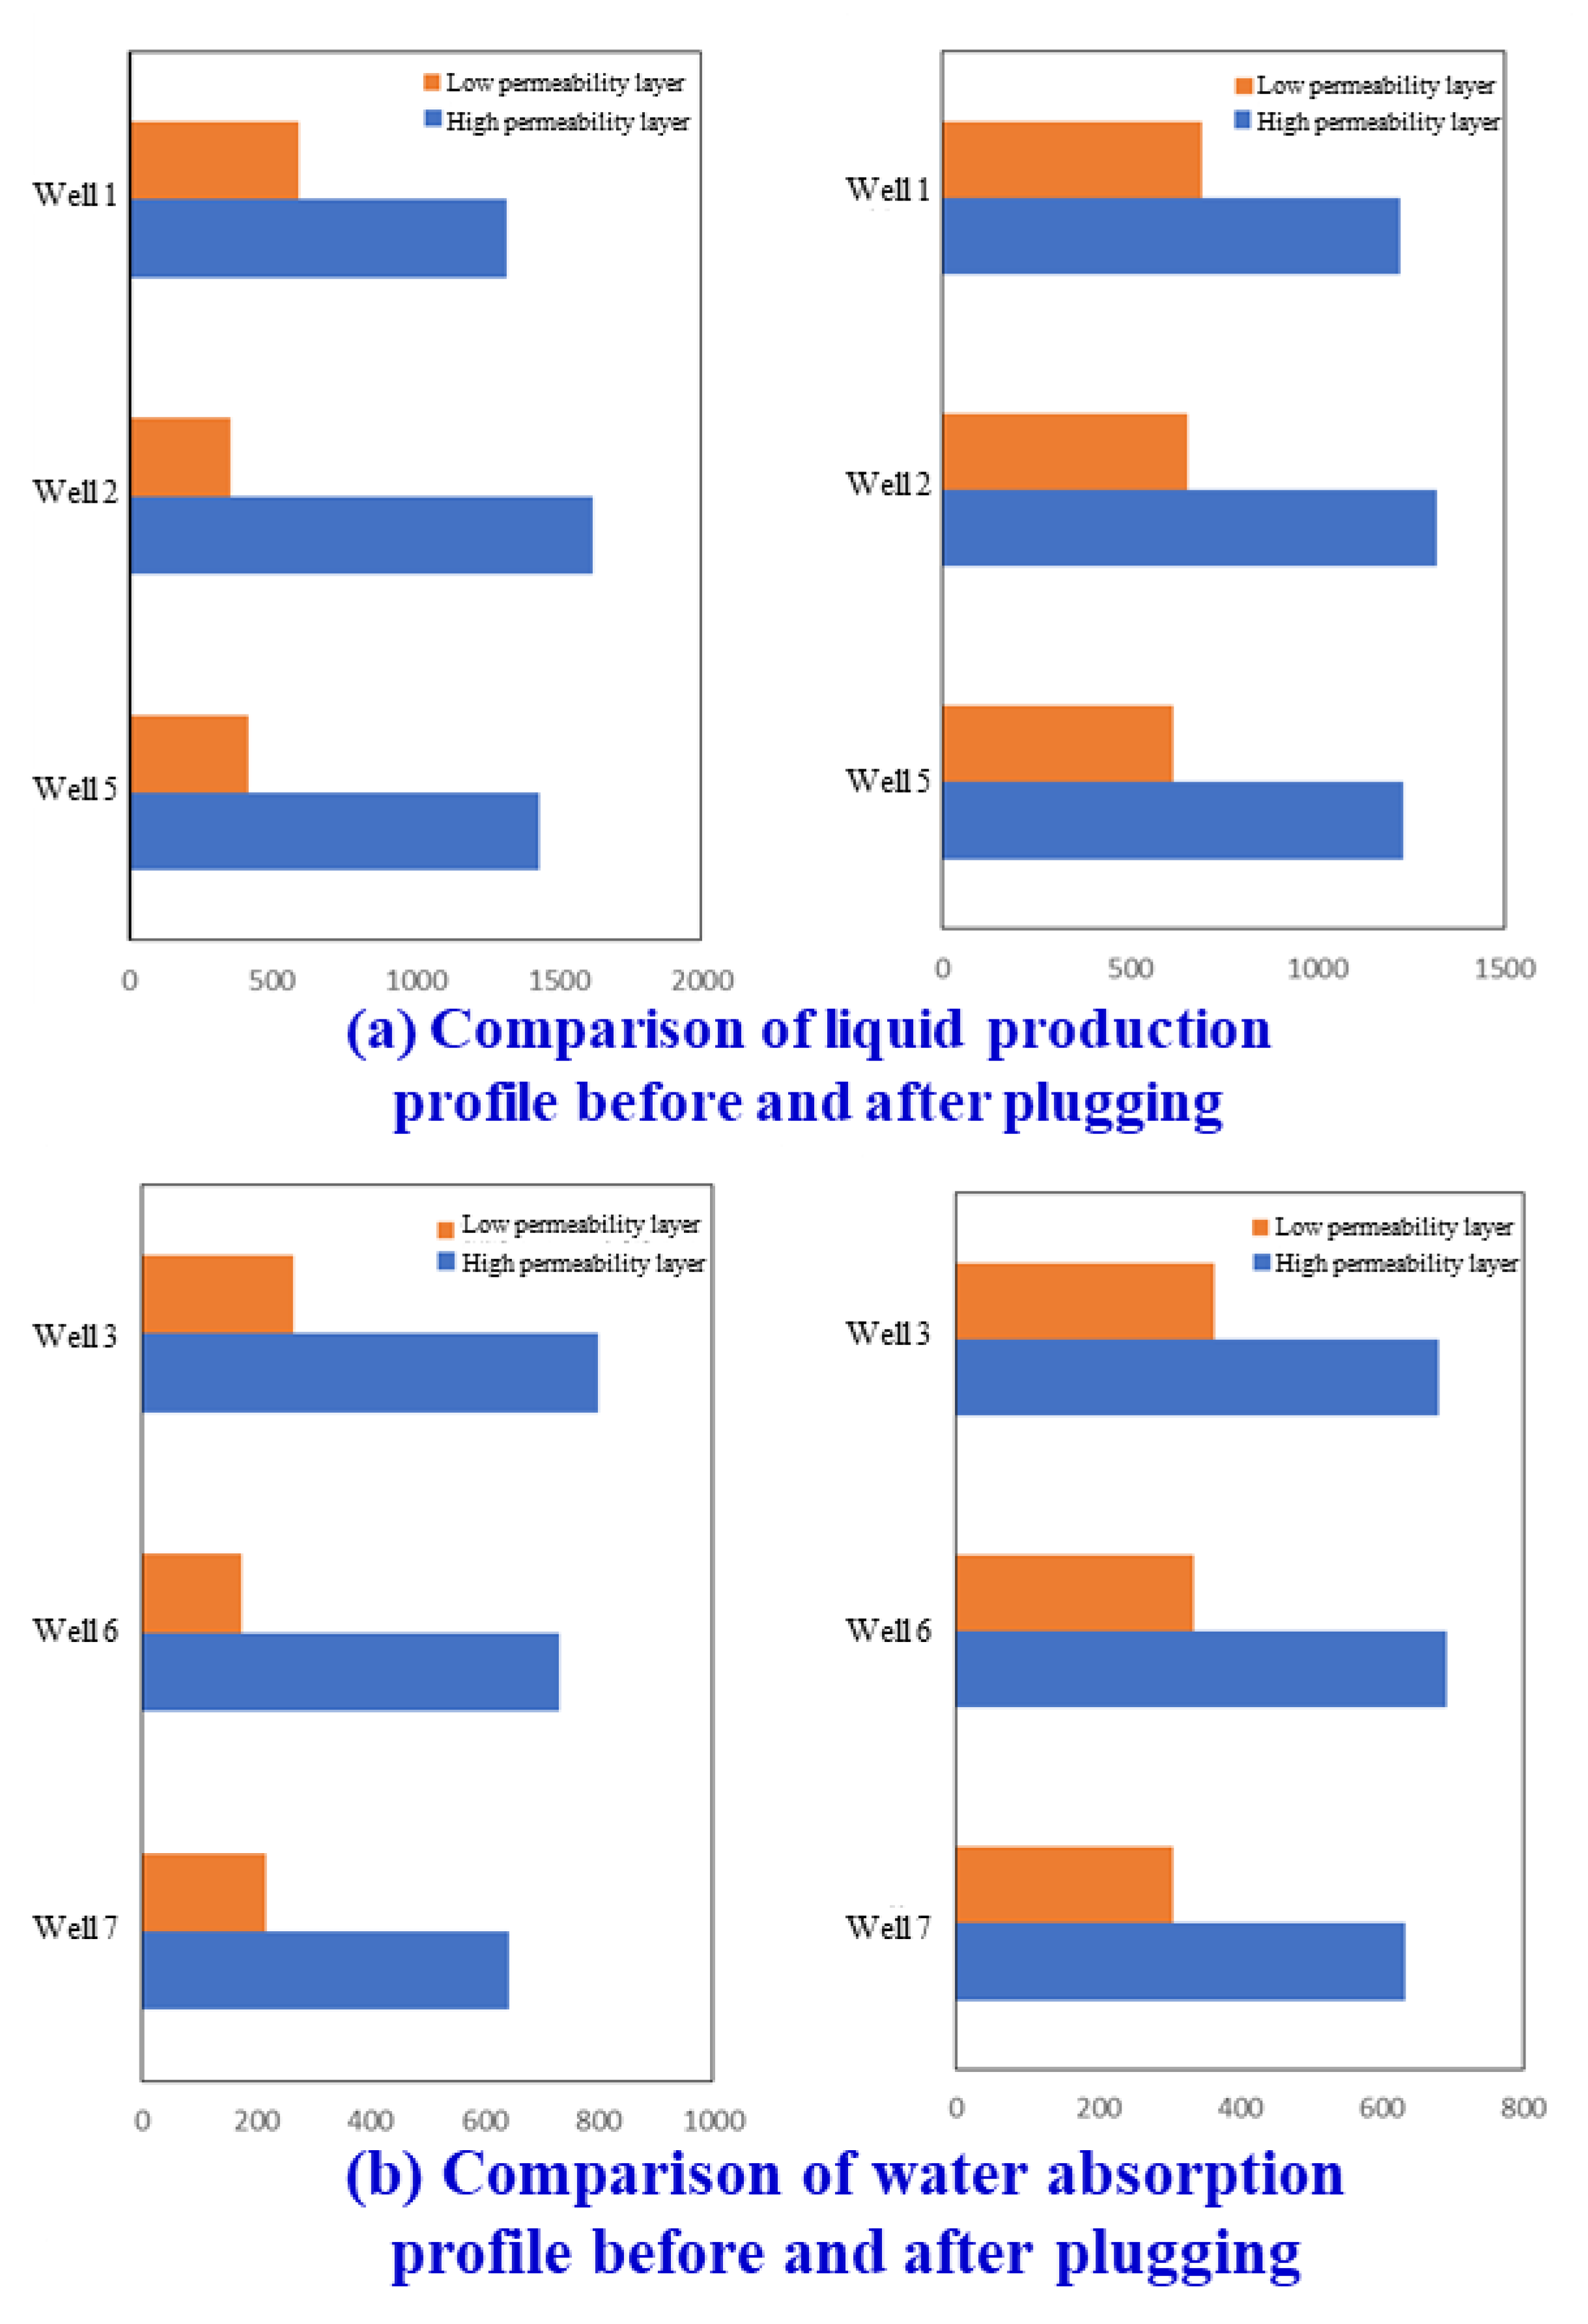
The changes in liquid production profiles are shown in Figure 20 below:
After chemical plugging, the cumulative oil production can reach 4031.08, and the recovery factor in the whole area has increased by nearly 5%. According to the analysis of production and suction profiles of production wells, the production and suction profiles of production wells and water injection wells have been improved after chemical plugging.
5. Conclusions and Suggestions
Balanced utilization strategies for water injection development in multilayer oil reservoirs encompass several approaches, including asynchronous injection production, rotational injection combined production, rotational injection rotational production, and separate injection rotational production. In the context of a fault block oil reservoir in Shengli Oilfield, a large-scale physical experiment was conducted. The results from these experiments revealed notable variations in well performance under different balanced utilization strategies, as well as variations in the distribution of remaining oil. This comprehensive study, incorporating single-well production performance, remaining oil distribution, flow field modifications, and subsequent numerical simulations, led to the identification of an optimal production strategy for multilayer fault block high water cut reservoirs. Water control measures, including chemical plugging, were employed, resulting in a significant enhancement of the area’s overall recovery rate. The specific findings are as follows:
- (1)
- Large plate physical experiments:
The large plate physical experiments demonstrated that, following conventional injection and production, the majority of the remaining oil was concentrated in the upper and lower edge areas of the reservoir. The introduction of three-dimensional well network injection and production technology led to substantial alterations in the distribution and flow field of remaining oil, effectively expanding the water drive sweep coefficient and improving the recovery rate. This approach was particularly effective in the high-permeability layer, whereas its impact on low-permeability layers was comparatively weaker.
- (2)
- Numerical simulation results:
Laboratory-scale numerical simulations indicated that split injection rotary production primarily targeted the lower right corner, resulting in an overall recovery rate increase of nearly 3%. Round injection rotary production was particularly effective in the lower section, contributing to an approximate 5% overall recovery rate improvement. Round injection combined production primarily impacted the lower part, leading to an overall recovery rate increase of approximately 4%. In comparison, round injection rotary production appeared to be the more suitable strategy for multilayer fault block high-water-bearing reservoirs.
- (3)
- Chemical plugging strategy:
Chemical plugging, a prominent technique for addressing high water cut reservoirs, was found to enhance oil recovery rates in the studied reservoir by approximately 5%, as evidenced through a comparison of production profiles. This strategy is poised to become a primary focus for future research. Additionally, improving micro oil displacement efficiency is expected to be a critical avenue for further enhancing recovery efficiency in such reservoirs.
Author Contributions
Conceptualization, H.J. and Y.W.; methodology, J.L.; software, Z.W.; validation, P.D., Z.W. and Y.W.; formal analysis, Y.W.; investigation, Z.W.; resources, H.J.; data curation, Z.W.; writing—original draft preparation, Y.W.; writing—review and editing, J.L. and P.D; visualization, P.D.; supervision, J.L.; project administration, J.L.; funding acquisition, J.L. All authors have read and agreed to the published version of the manuscript.
Funding
This research was funded by National Natural Science Foundation Project: Multiple physics coupling fine grid numerical simulation and optimization design method for water control completion of horizontal wells, grant number 52374055. The APC was funded by 52374055.
Data Availability Statement
All the data have been presented in the article, there is no need to share the research data.
Conflicts of Interest
The authors declare no conflict of interest.
References
- AlShalabi, E.W.; Sepehrnoori, K. A comprehensive review of low salinity/engineered water injections and their applications in sandstone and carbonate rocks. J. Petrol. Sci. Eng. 2016, 139, 137–161. [Google Scholar] [CrossRef]
- Alshehri, A.J.; Stanford, U.; Sagatov, E.; Kovscek, A.R. Pore-Level Mechanics of Forced and Spontaneous Imbibition of Aqueous Surfactant Solutions in Fractured Porous Media. In Proceedings of the SPE Annual Technical Conference and Exhibition, New Orleans, LA, USA, 4–7 October 2009. [Google Scholar] [CrossRef]
- Alves, D.R.; Carneiro, J.S.; Oliveira, I.F.; Façanha, F., Jr.; Santos, A.F.; Dariva, C.; Franceschi, E.; Fortuny, M. Influence of the salinity on the interfacial properties of a Brazilian crude oil–brine systems. Fuel 2014, 118, 21–26. [Google Scholar] [CrossRef]
- Amirian, T.; Haghighi, M.; Mostaghimi, P. Pore scale visualization of low salinity waterflooding as an enhanced oil recovery method. Energy Fuels 2017, 31, 13133–13143. [Google Scholar] [CrossRef]
- Amirian, T.; Haghighi, M. Impact of clay type and water composition on low salinity water injection—Visualization approach. APPEA J. 2018, 58, 51–59. [Google Scholar] [CrossRef]
- Austad, T.; RezaeiDoust, A.; Puntervold, T. Chemical Mechanism of Low Salinity Water Flooding in Sandstone Reservoirs. In Proceedings of the SPE Symposium on Improved Oil Recovery Conference, Tulsa, OK, USA, 24–28 April 2010. [Google Scholar]
- Geng, Z. Research on Vertical Equilibrium Displacement Optimization of Multilayer Oil Reservoirs in Extra High Water Cut Stage; China University of Petroleum (East China): Qingdao, China, 2013. [Google Scholar]
- Wang, S.; Niu, Z. Research on Subdivided Layer Series in the Late High Water Cut Stage of Complex Fault Block Reservoirs with Multiple Oil Layers in Dongxin Oilfield. Pet. Explor. Prod. 2004, 31, 116–118. [Google Scholar]
- Bao, J.; Song, X.; Ye, J.; Wang, J. Reorganization of High Water Cut Oilfield Development Layer Series. Xinjiang Pet. Geol. 2010, 31, 291–294. [Google Scholar]
- Shu, S. Research on the Reconstruction Technology of Subdivision Well Network in the Z Block of Lamadian Oilfield during the Extra High Water Cut Period; Northeast Petroleum University: Daqing, China, 2016. [Google Scholar]
- Sorbie, K.S. Gel Placement in Heterogeneous Systems With Crossflow. In Proceedings of the SPE/DOE Enhanced Oil Recovery Symposium, Society of Petroleum Engineers, Tulsa, OK, USA, 21–24 April 1992. [Google Scholar]
- Gao, H.W.; Chang, M.M.; Burchfield, T.E.; Tham, M.K. Permeability Modification Simulator Studies of Polymer-Gel-Treatment Initiation Time and Crossflow Effects on Waterflood Oil Recovery. SPE Reserv. Eng. 1993, 8, 221–227. [Google Scholar] [CrossRef]
- Wang, Y.; Liu, Y.; Deng, Q. Current situation and development strategy of the extra-high water cuts tage of continental facies oilfields in China. J. Northeast Pet. Univ. 2014, 38, 1–9. [Google Scholar]
- Li, Q.; Han, Y.; Liu, X.; Ansari, U.; Cheng, Y.; Yan, C. Hydrate as a by-product in CO2 leakage during the long-term sub-seabed sequestration and its role in preventing further leakage. Environ. Sci. Pollut. Res. 2022, 29, 77737–77754. [Google Scholar] [CrossRef] [PubMed]
- Yong, W.; Jiang, H.; Li, J. Study on water injection indicator curve model in fractured vuggy carbonate reservoir. Geofluids 2021, 2021, 5624642. [Google Scholar] [CrossRef]
- Muskat, M. The Flow of Homogeneous Fluids through Porous Media; McGrawhill: New York, NY, USA, 1937; pp. 9–150. [Google Scholar]
- Christman, P.G. Modeling the efforts of infill drilling and pattern modification in discontinuous reservoirs. SPE Reserv. Eng. 1995, 10, 4–9. [Google Scholar] [CrossRef]
- Collings, R.C.; Hild, G.P.; Abidi, H.R. Pattern modification by injection well shut-in: A combined cost reduction and sweep improvement effort. SPE Reserv. Eng. 1996, 11, 69–72. [Google Scholar] [CrossRef]
- Stirpe, M.T.; Guzman, J.; Manrique, E.; Alvarado, V. Cyclic Water Injection Simulations for Evaluations of its Potential in Lagocinco Field. In Proceedings of the SPE Improved Oil Recovery Conference, Tulsa, OK, USA, 17–21 April 2004. [Google Scholar]
- Li, Q.; Wang, F.; Wang, Y.; Forson, K.; Cao, L.; Zhang, C.; Zhou, C.; Zhao, B.; Chen, J. Experimental investigation on the high-pressure sand suspension and adsorption capacity of guar gum fracturing fluid in low-permeability shale reservoirs: Factor analysis and mechanism disclosure. Environ. Sci. Pollut. Res. 2022, 29, 53050–53062. [Google Scholar] [CrossRef] [PubMed]
- Surguchev, L.; Giske, N.H.; Kollbotn, L.; Shchipanov, A. Cyclic Water Injection Improves Oil Production in Carbonate Reservoir. J. Biol. Chem. 2008, 286, 3129–3138. [Google Scholar]
- Yu, F.; Jiang, H.; Xu, F.; Fan, Z.; Su, H.; Li, J. New insights into flow physics in the EOR process based on 2.5D reservoir micromodels. J. Pet. Sci. Eng. 2019, 181, 106214. [Google Scholar] [CrossRef]
- Wang, H.; Oyenowo, O.P.; Okuno, R. Aqueous formate solution for enhanced water imbibition in oil recovery and carbon storage in carbonate reservoirs. Fuel A J. Fuel Sci. 2023, 345, 128198. [Google Scholar] [CrossRef]
Figure 1.
Implementation drawing of asynchronous injection production.

Figure 2.
Flow chart of combined injection and production.

Figure 3.
Flow chart of cyclic injection and production.

Figure 4.
Flow chart of separate injection and rotation production.
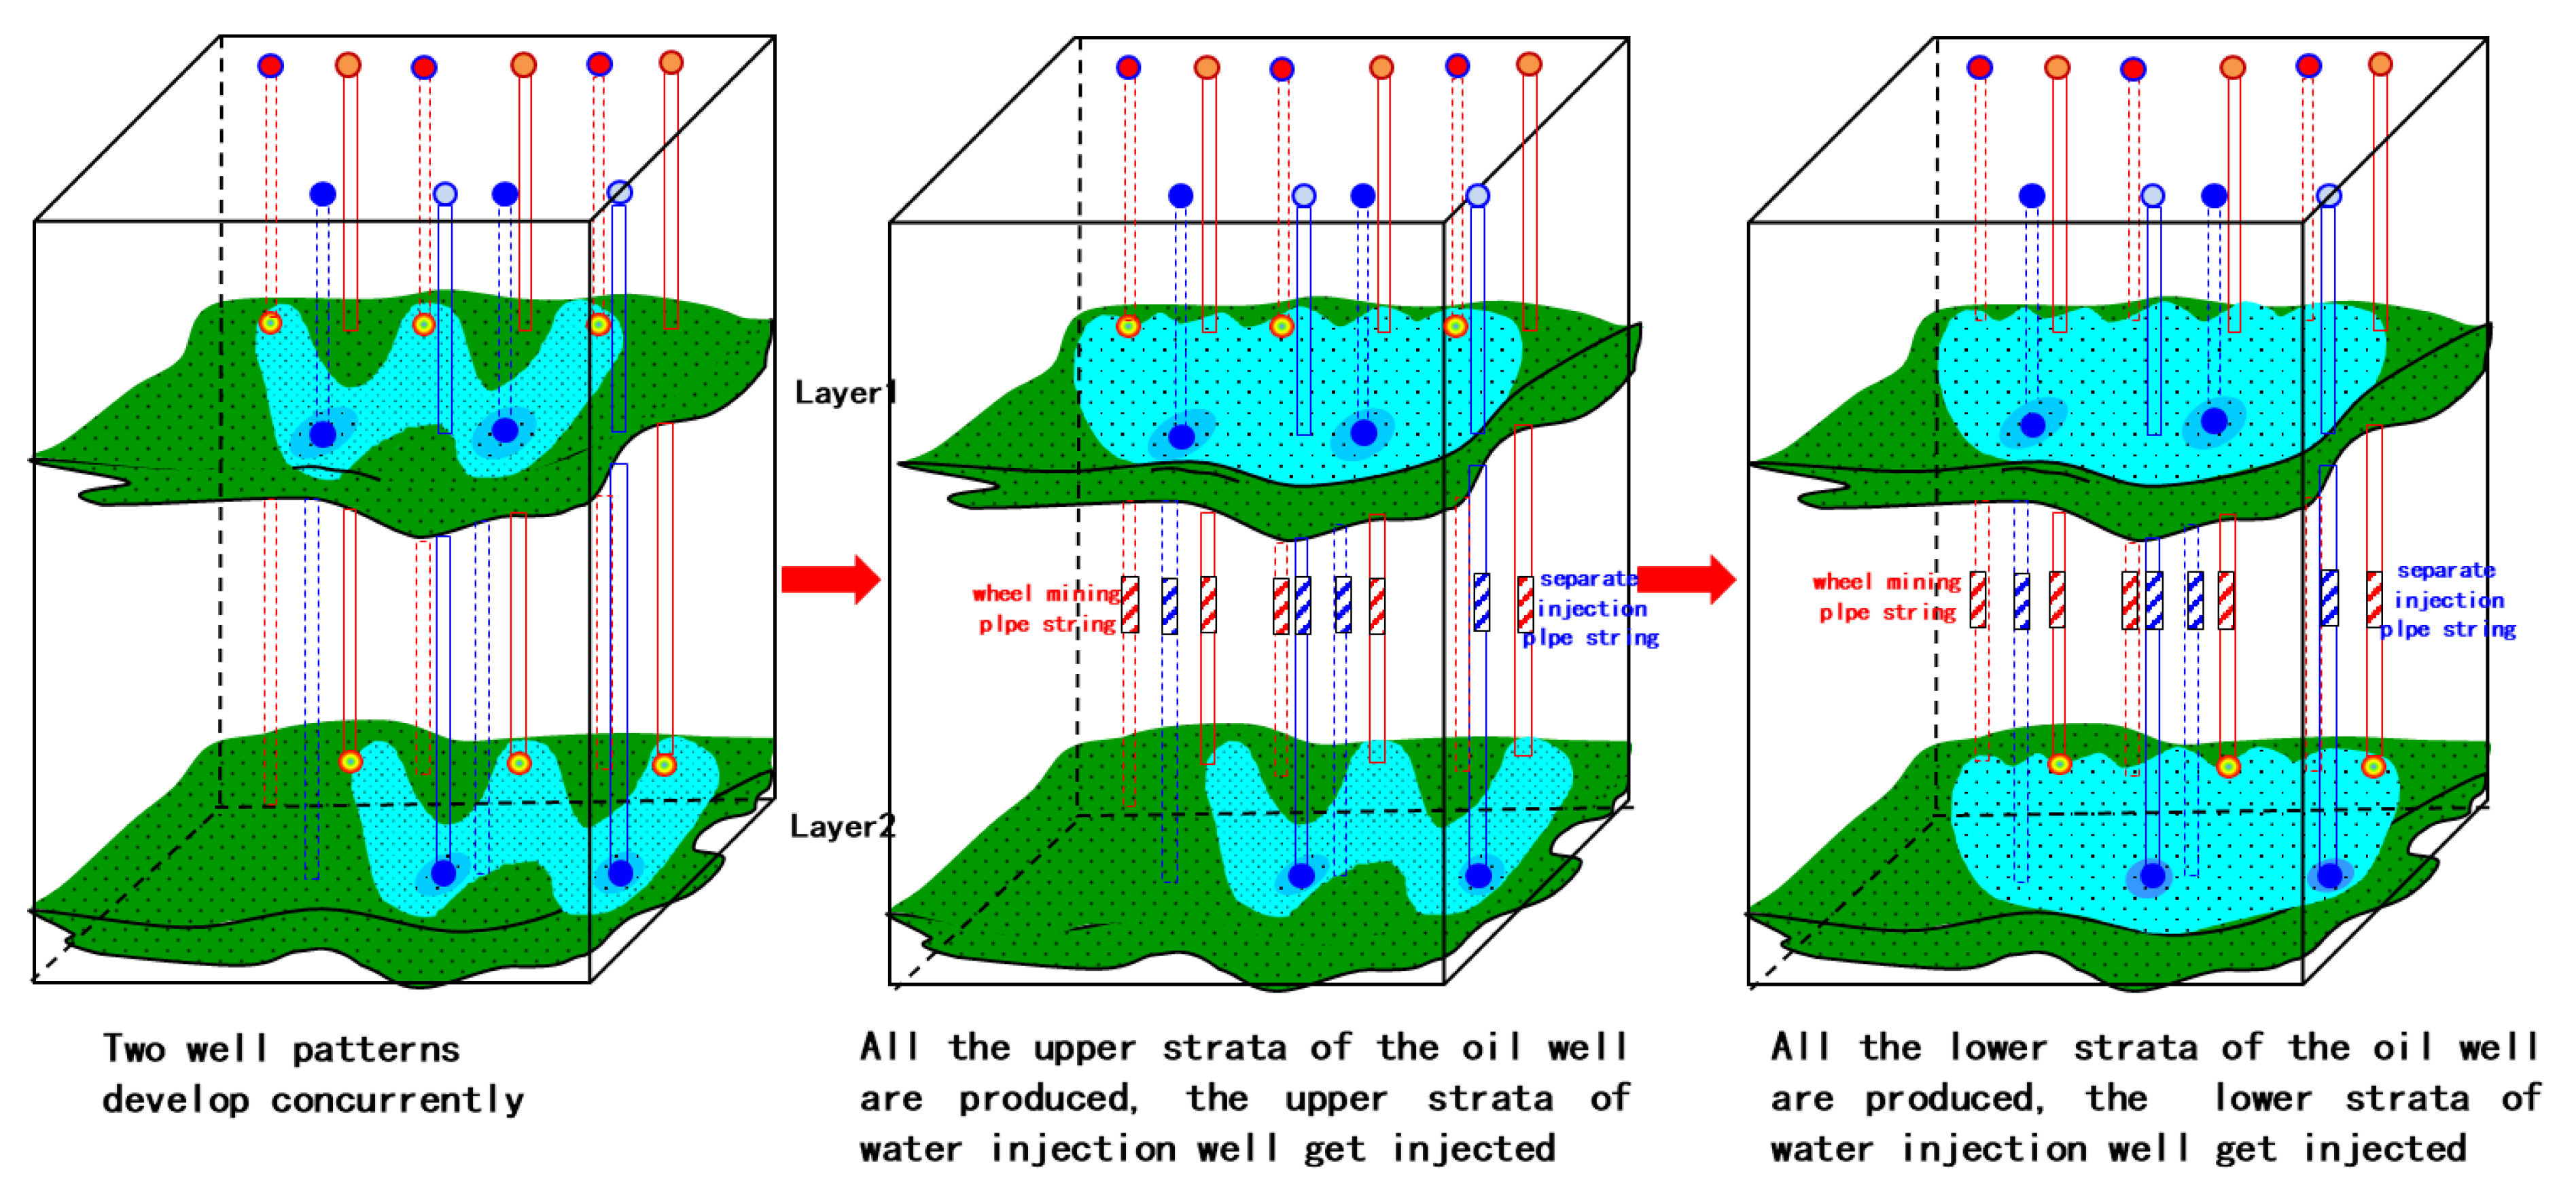
Figure 5.
Model diagram.
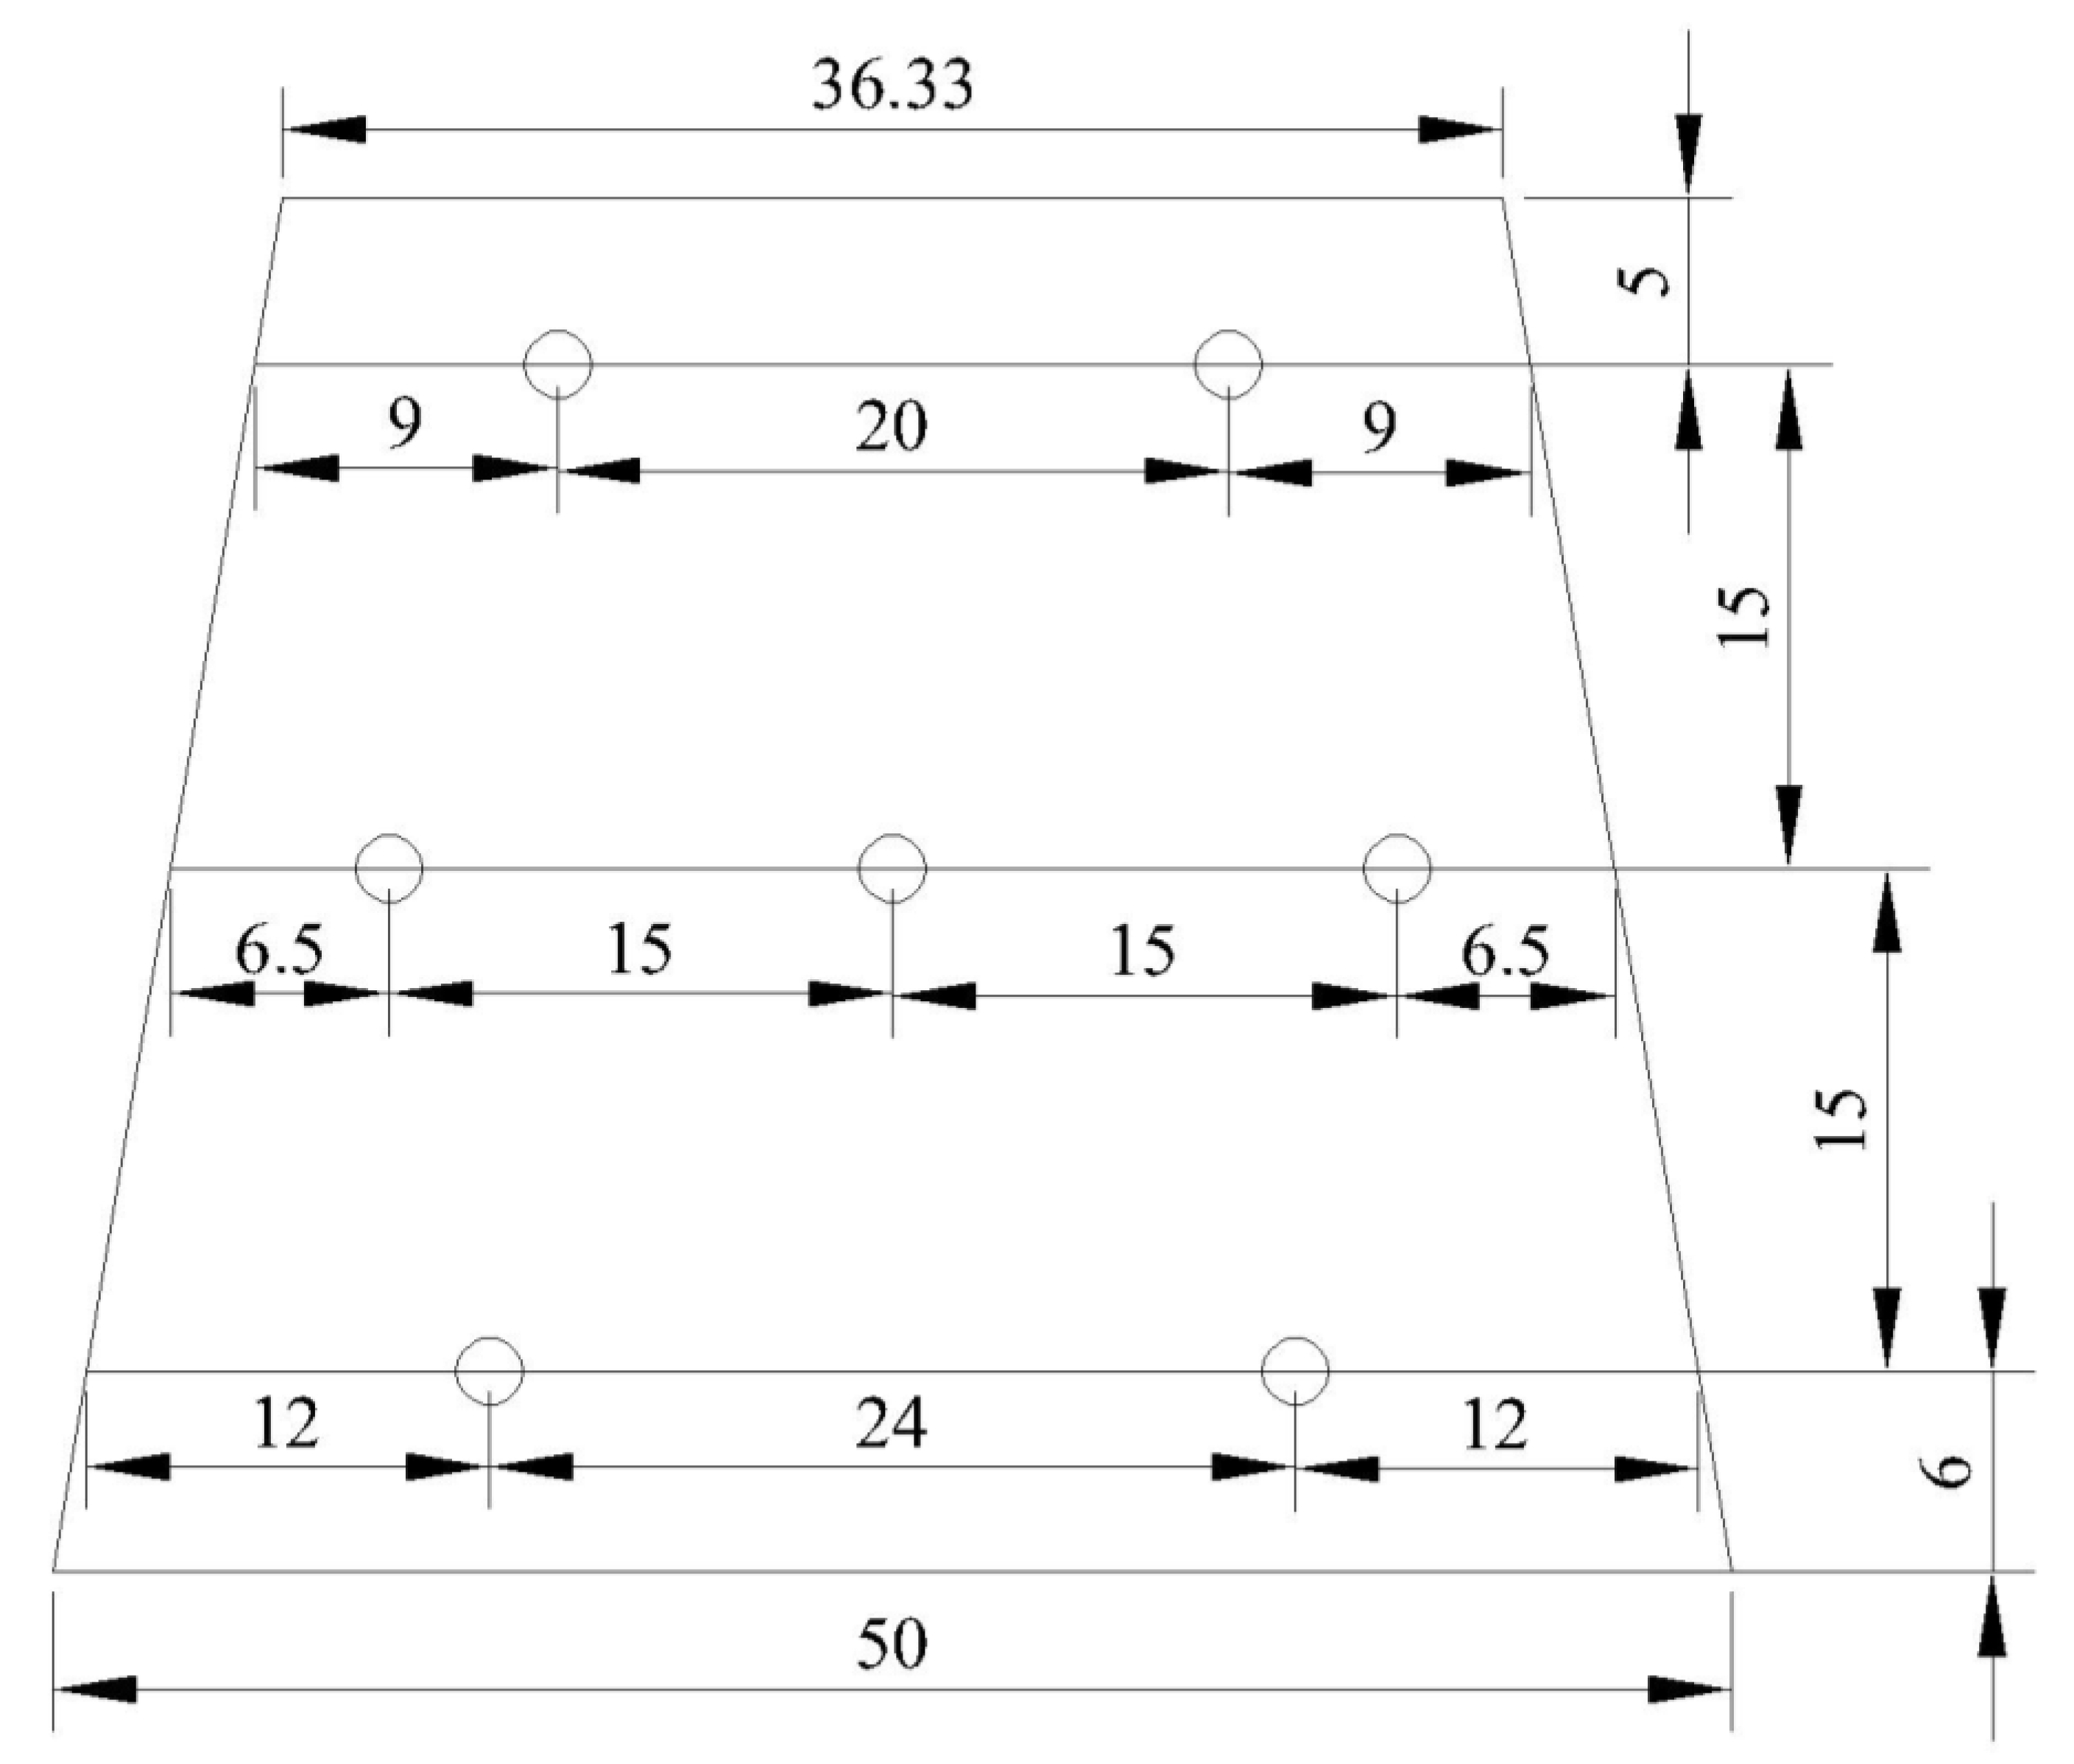
Figure 6.
Basic experimental physical map.

Figure 7.
Physical diagram of cyclic injection and mining.
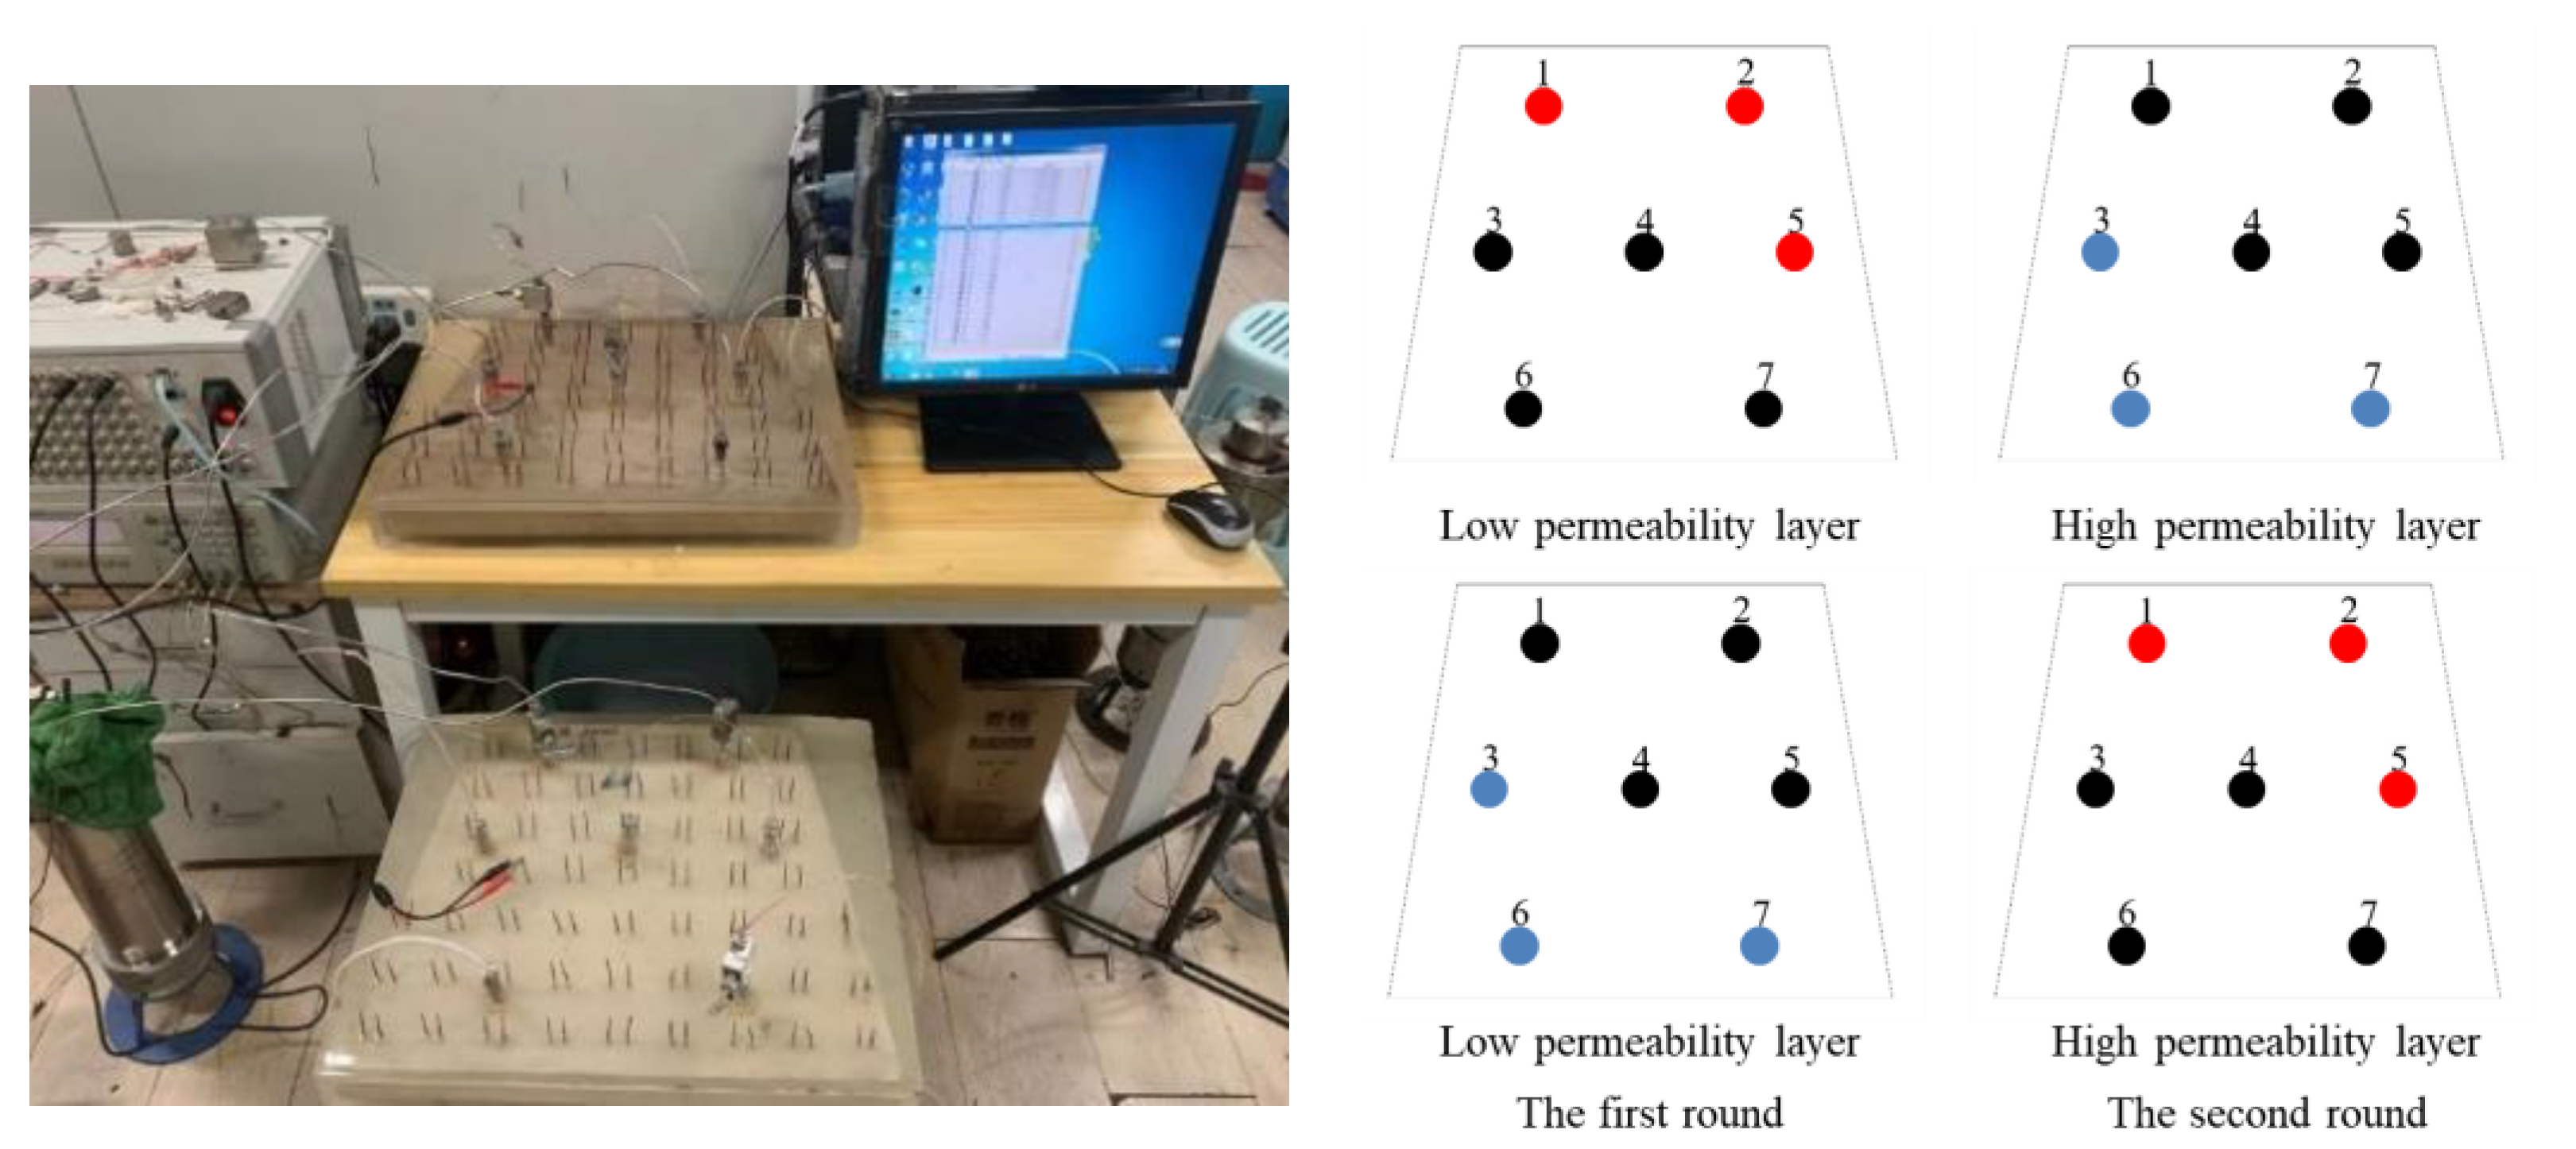
Figure 8.
Well 1 production dynamic diagram.
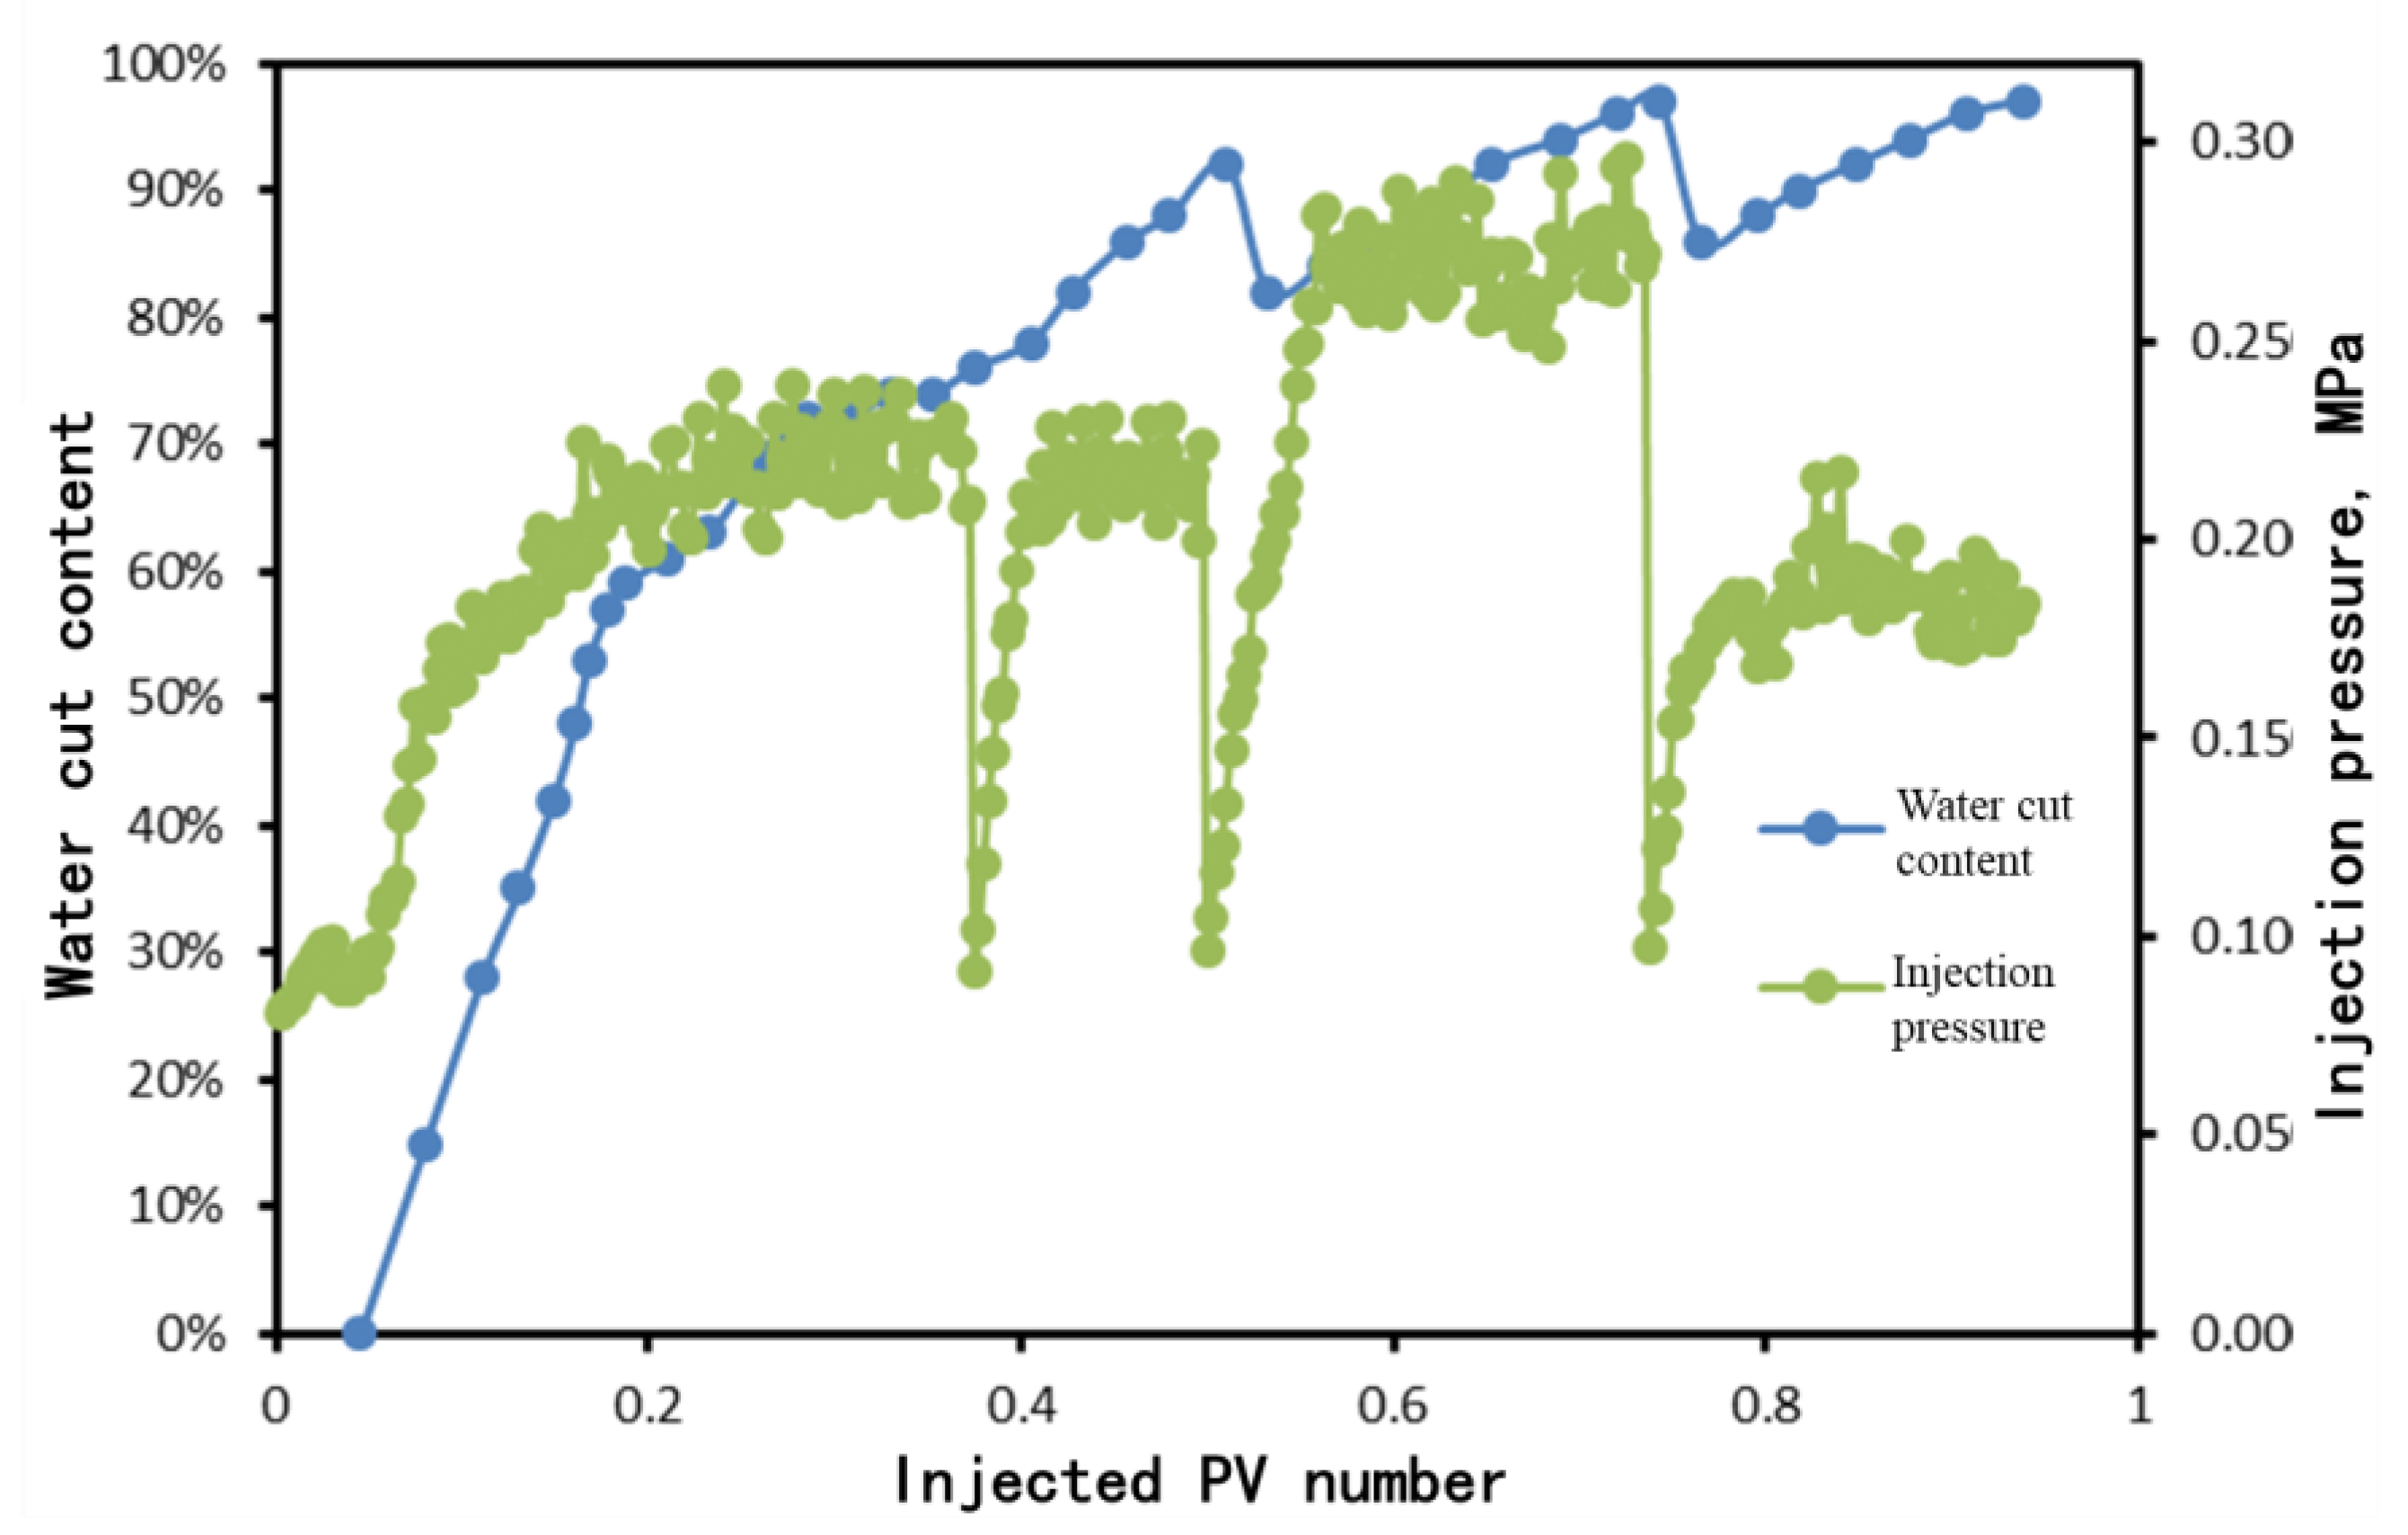
Figure 9.
Well 2 production dynamic diagram.

Figure 10.
Well 5 production dynamic diagram.
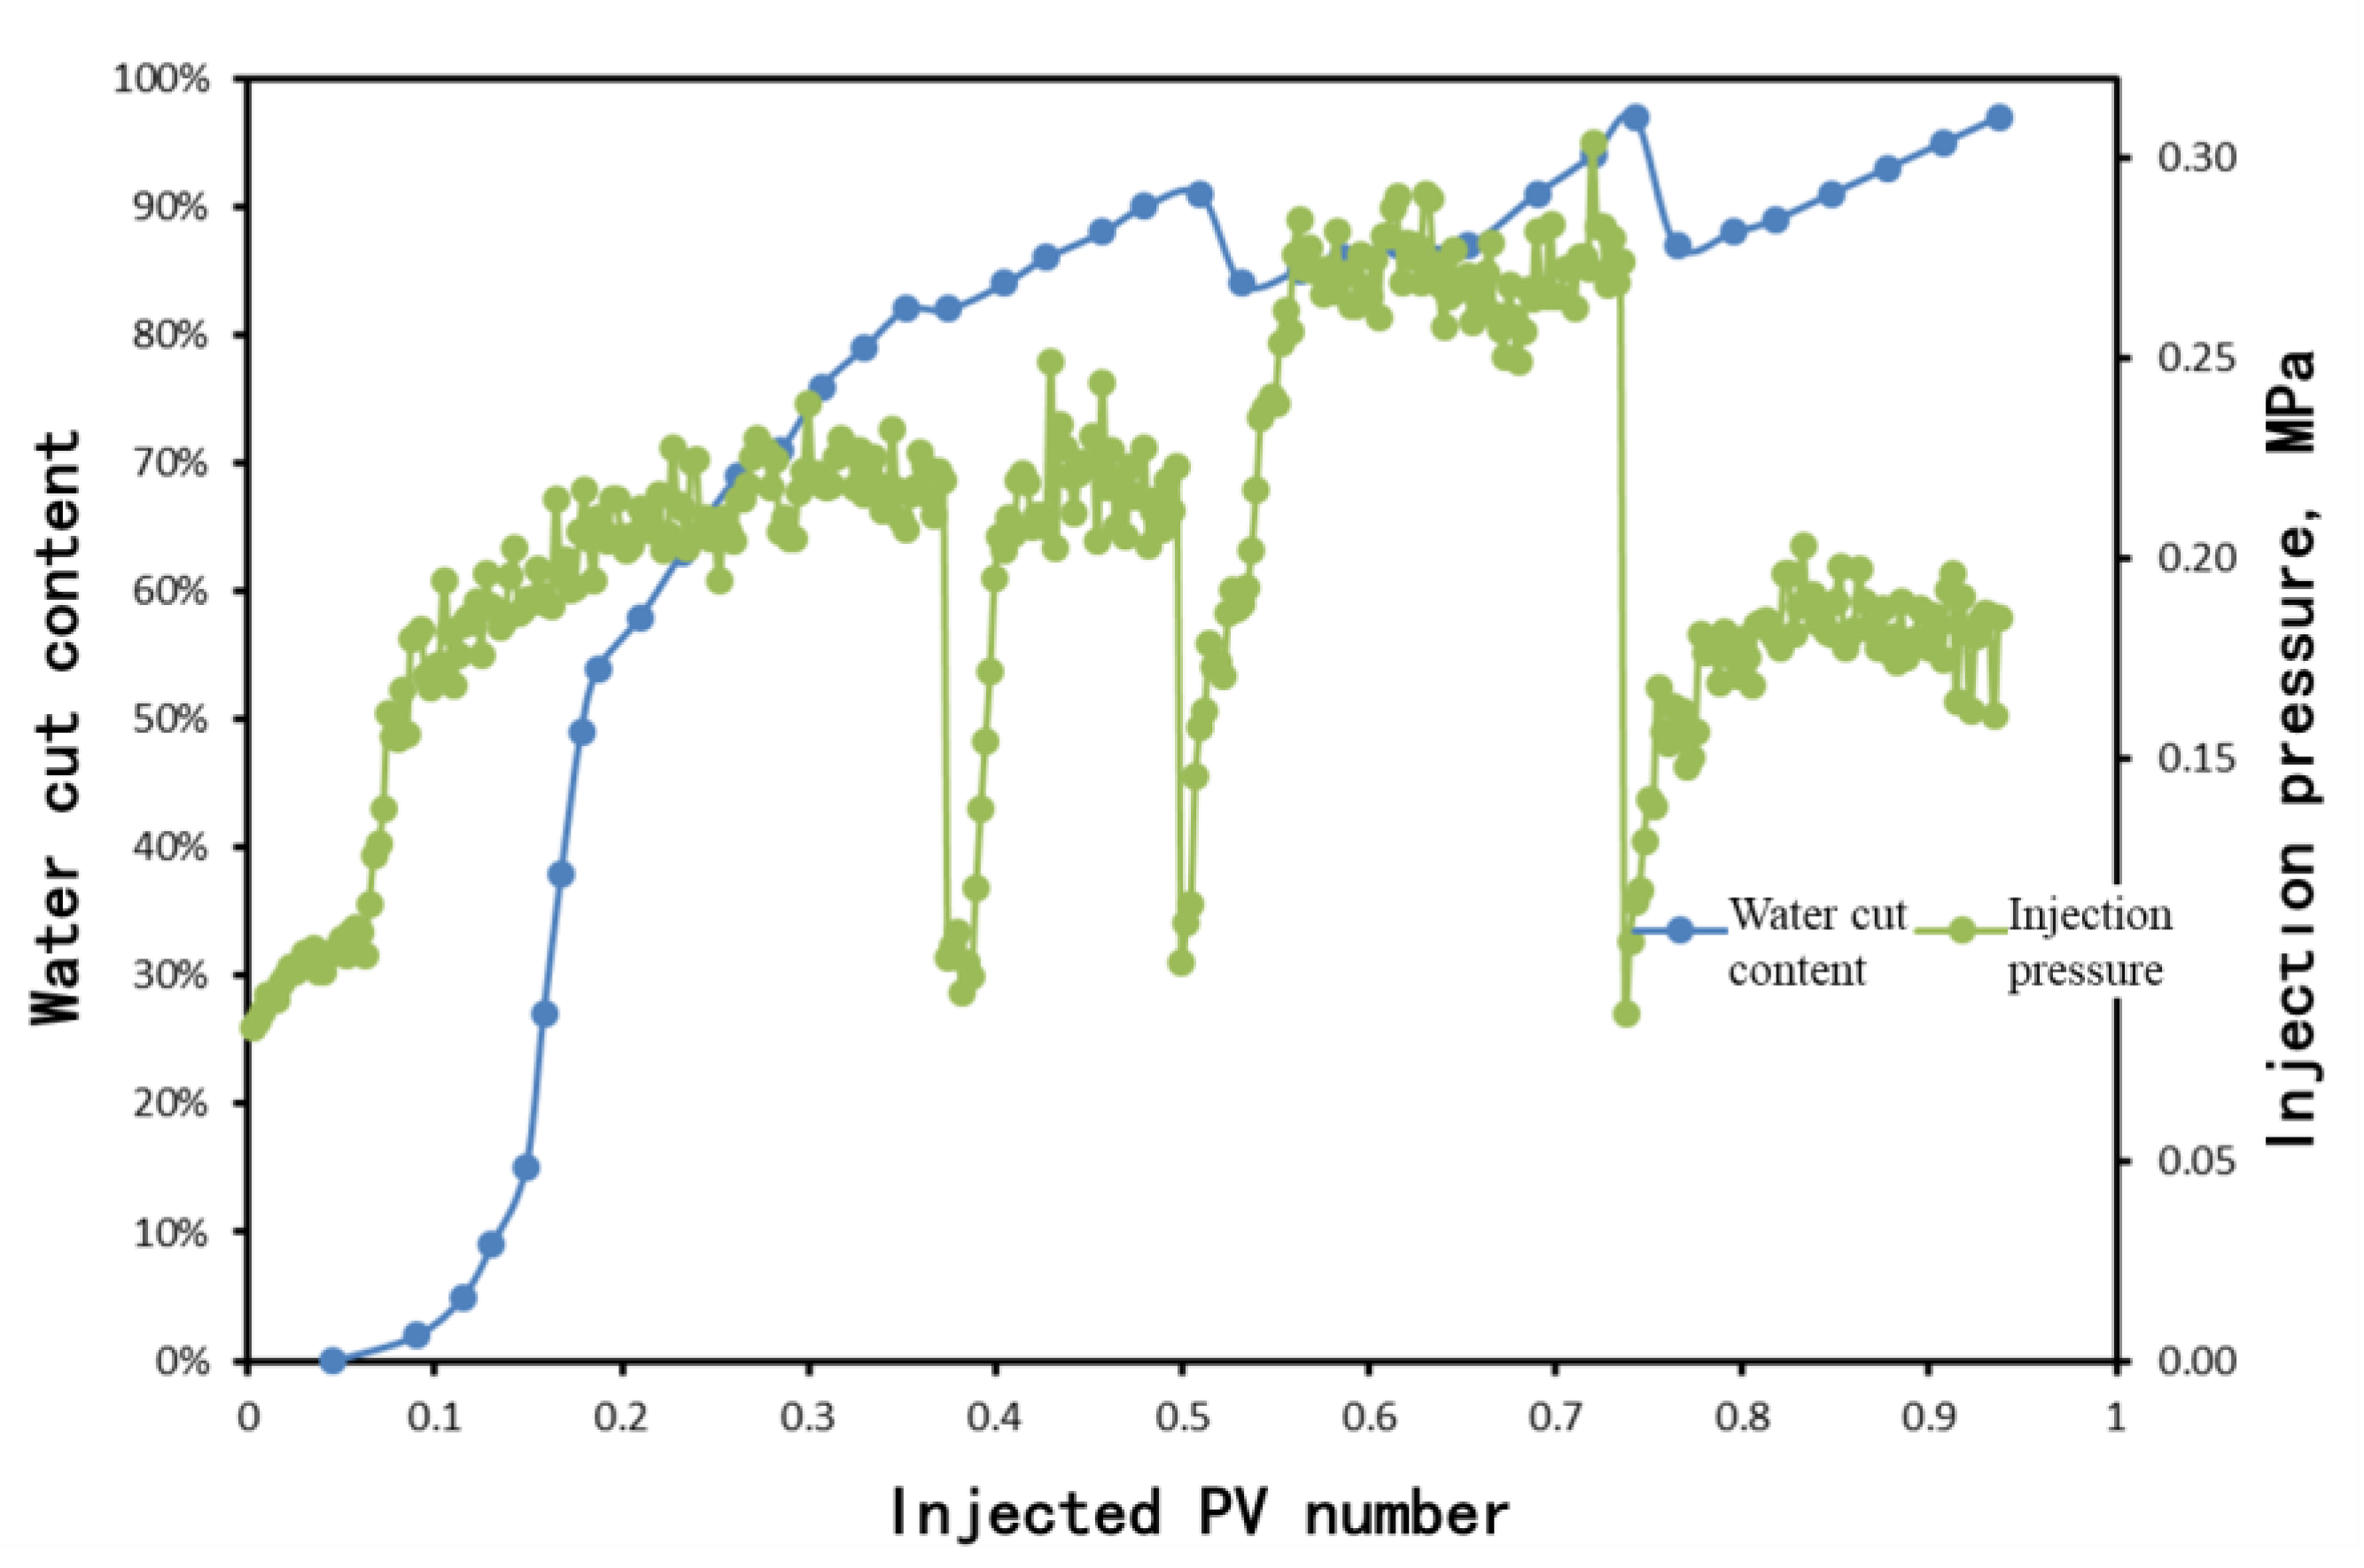
Figure 11.
Remaining oil distribution diagram.
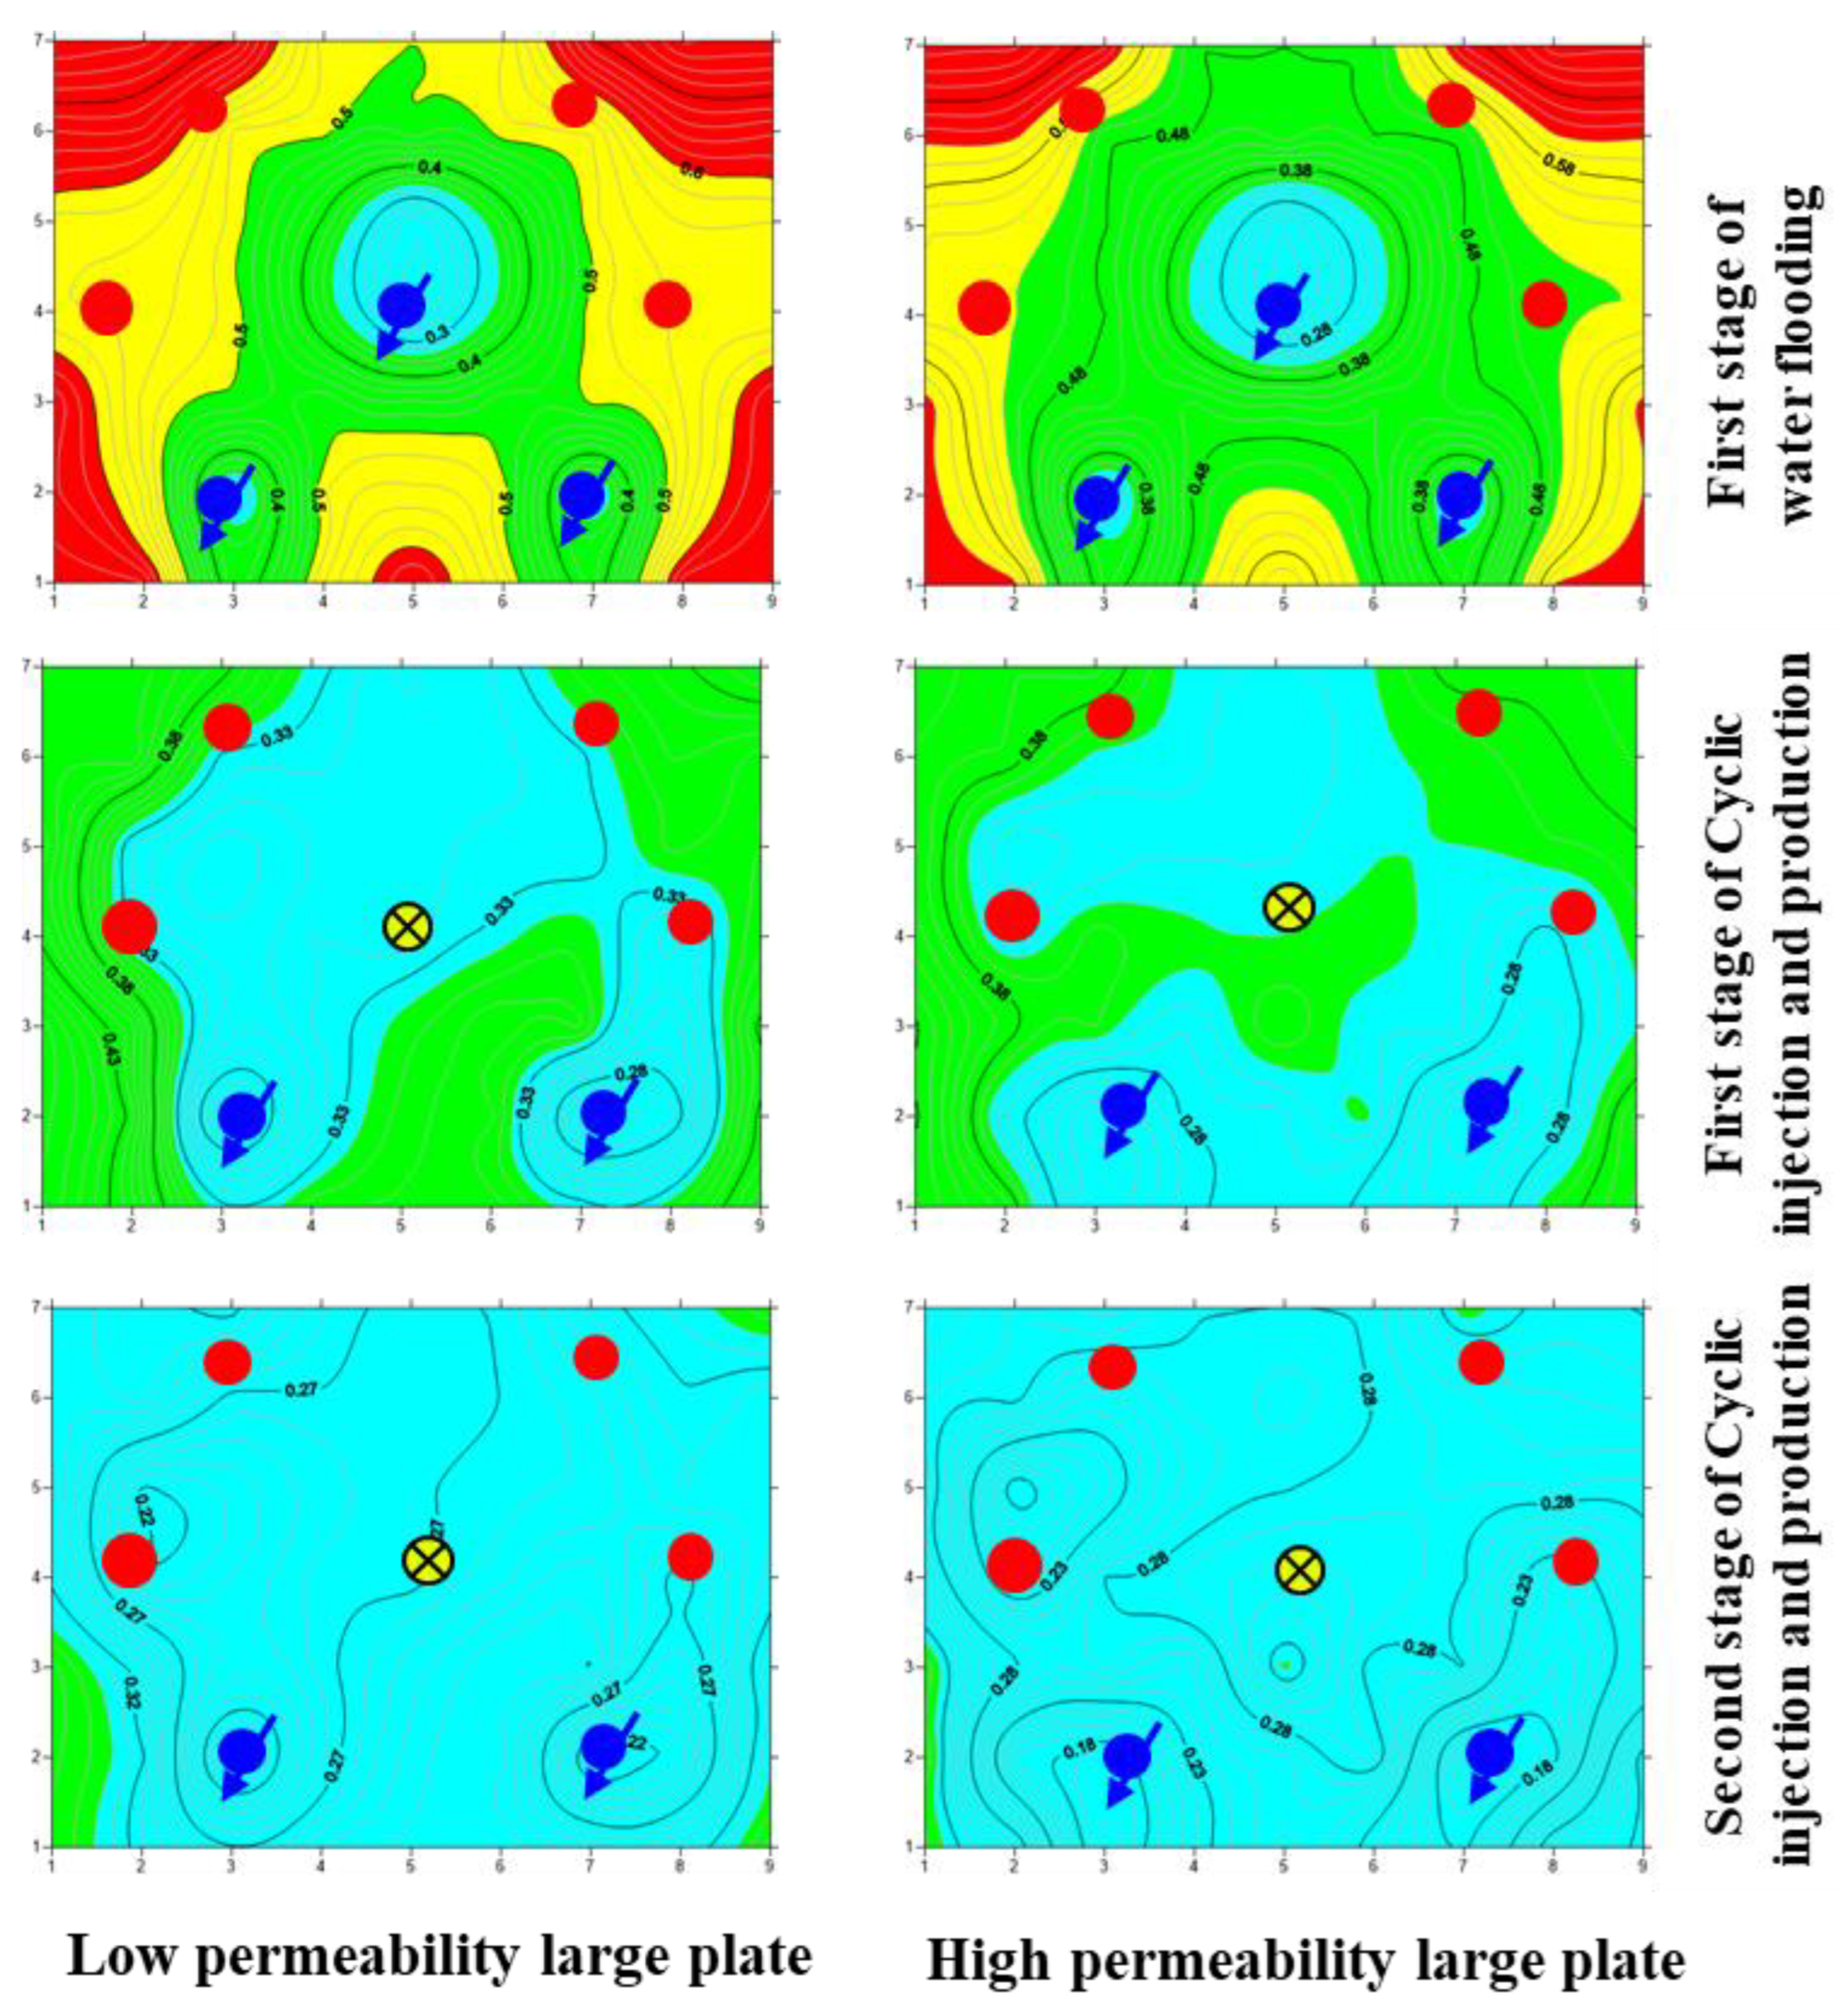
Figure 12.
Streamline change diagram.

Figure 13.
Numerical simulation research model of large plate experiment.

Figure 14.
Dynamic Fitting Curve of Experimental Production.

Figure 15.
Results of Basic Experiment (1–7: respectively representing wells 1–7).
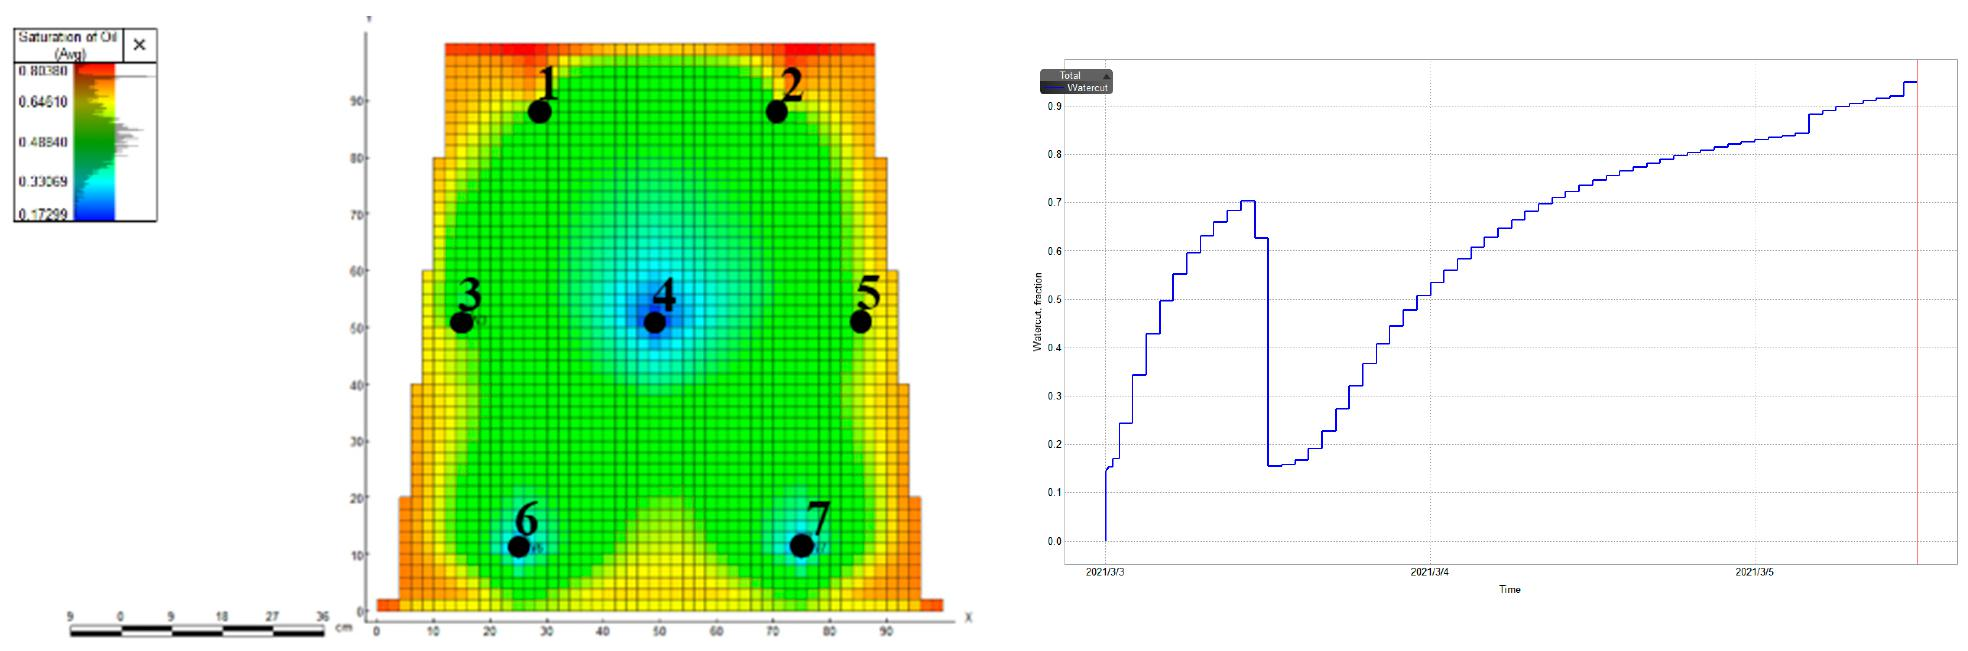
Figure 16.
Distribution of remaining oil saturation before and after Separate injection and alternate production (1–7: respectively representing wells 1–7).
Figure 16.
Distribution of remaining oil saturation before and after Separate injection and alternate production (1–7: respectively representing wells 1–7).
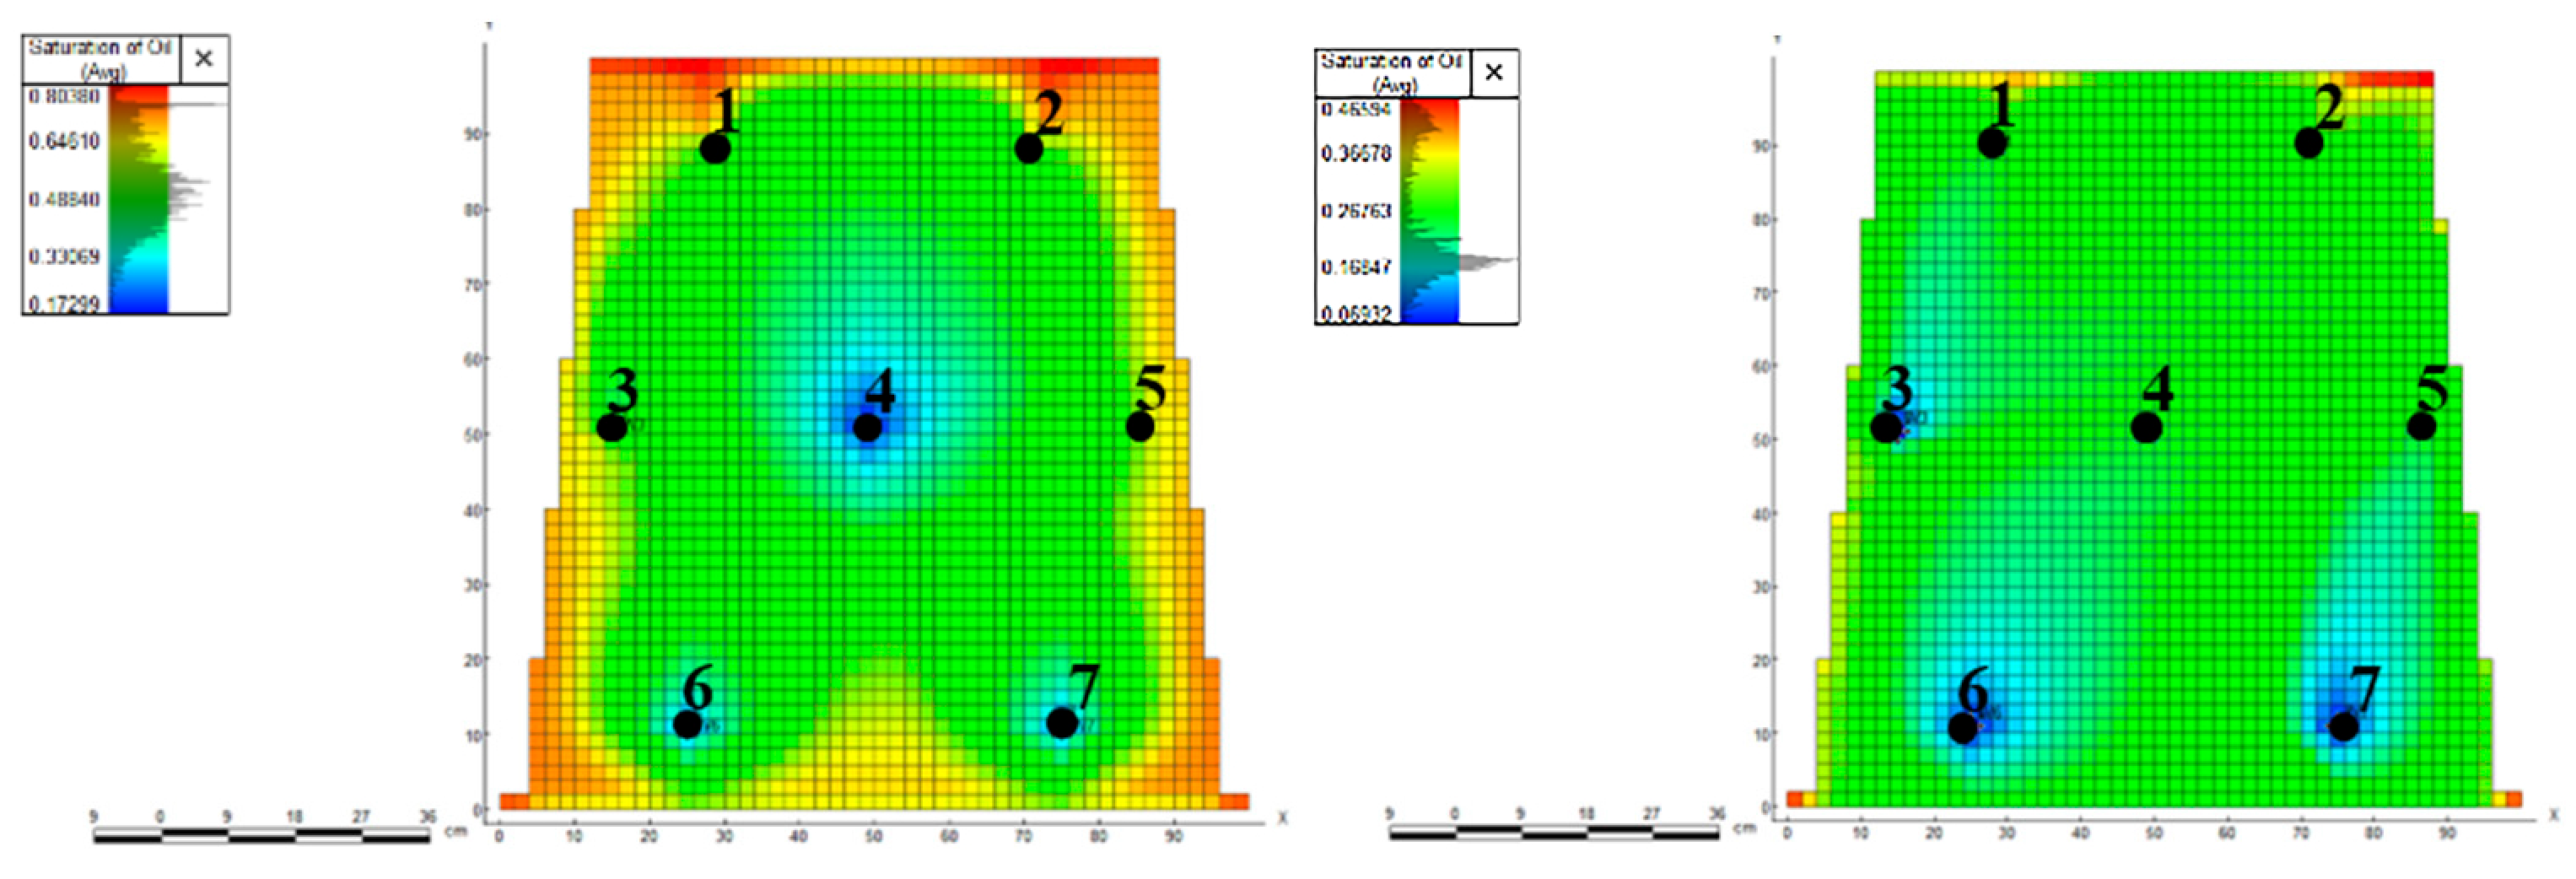
Figure 17.
Residual Oil Saturation Distribution before and after Cyclic injection and production (1–7: respectively representing wells 1–7).
Figure 17.
Residual Oil Saturation Distribution before and after Cyclic injection and production (1–7: respectively representing wells 1–7).
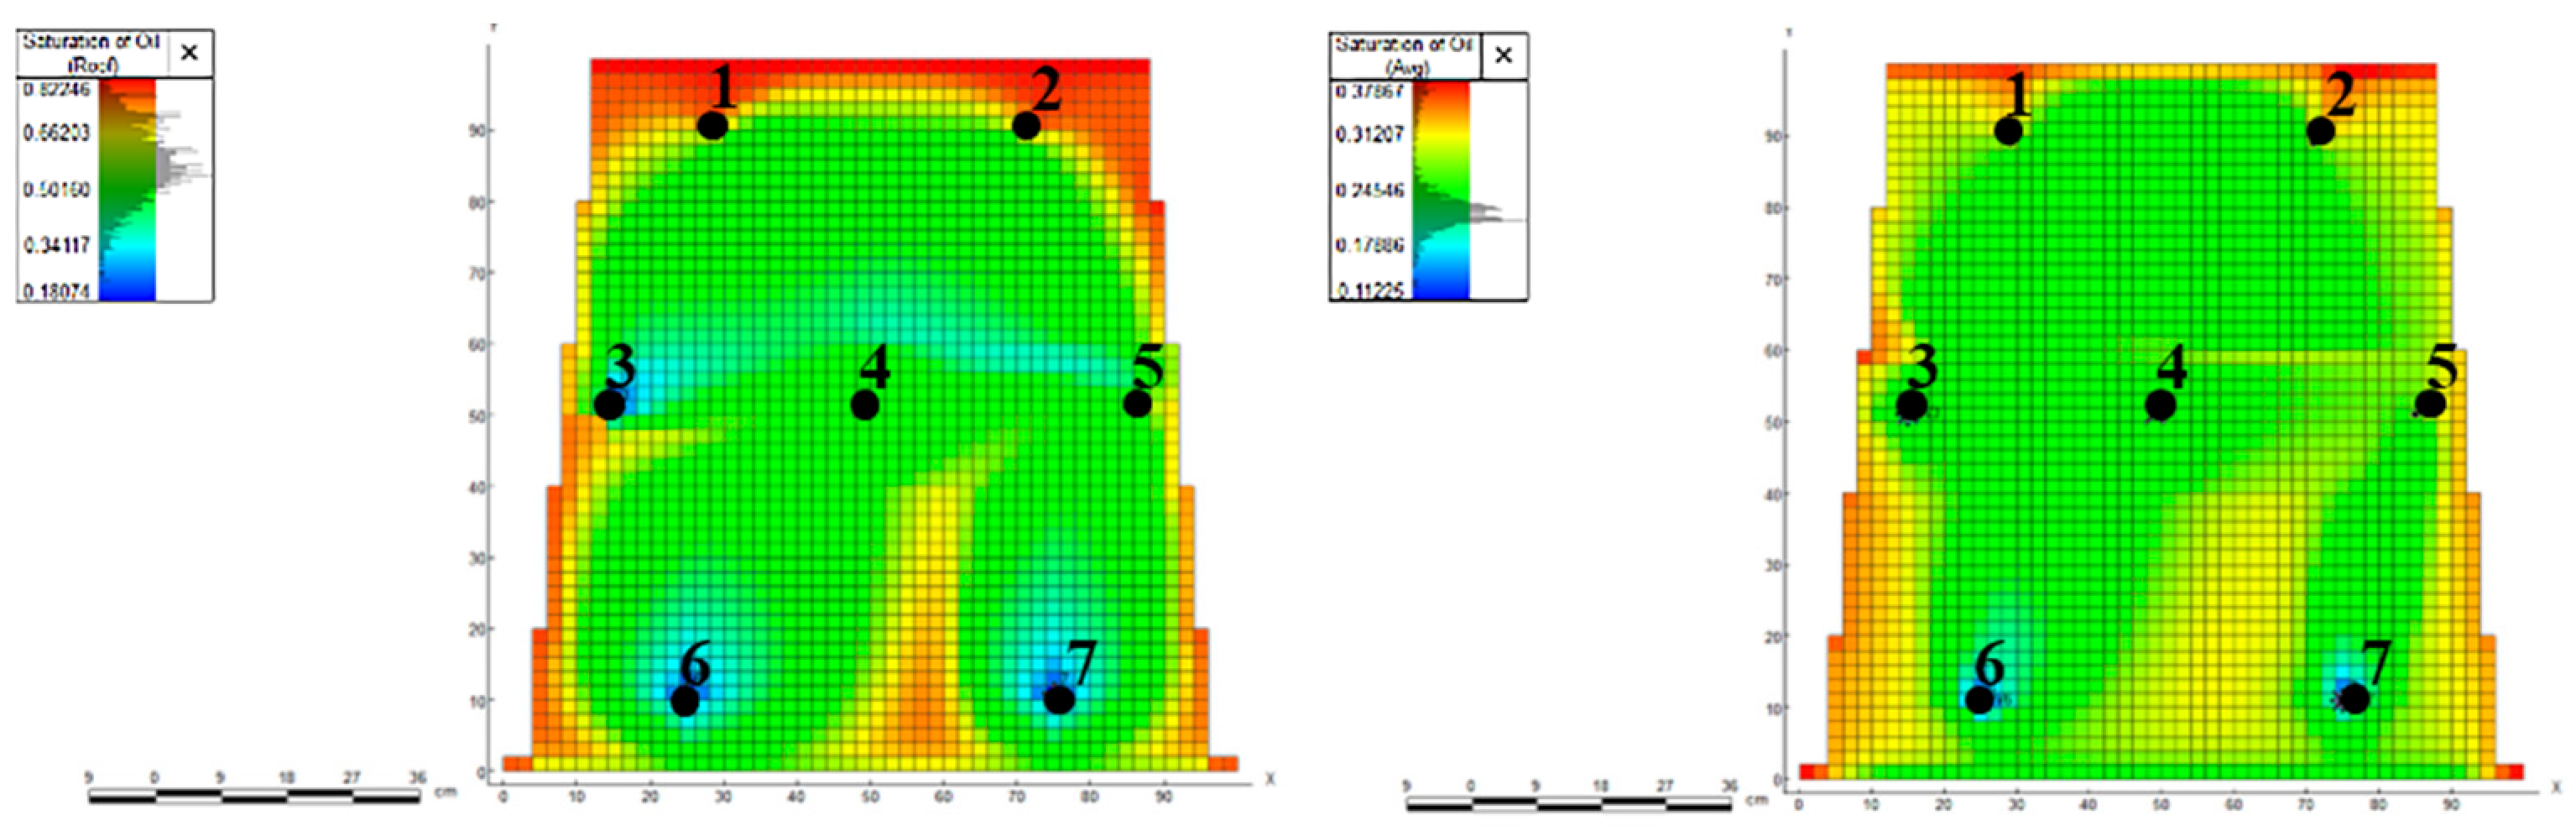
Figure 18.
Residual Oil Saturation Distribution before and after Combined production by round injection (1–7: respectively representing wells 1–7).
Figure 18.
Residual Oil Saturation Distribution before and after Combined production by round injection (1–7: respectively representing wells 1–7).
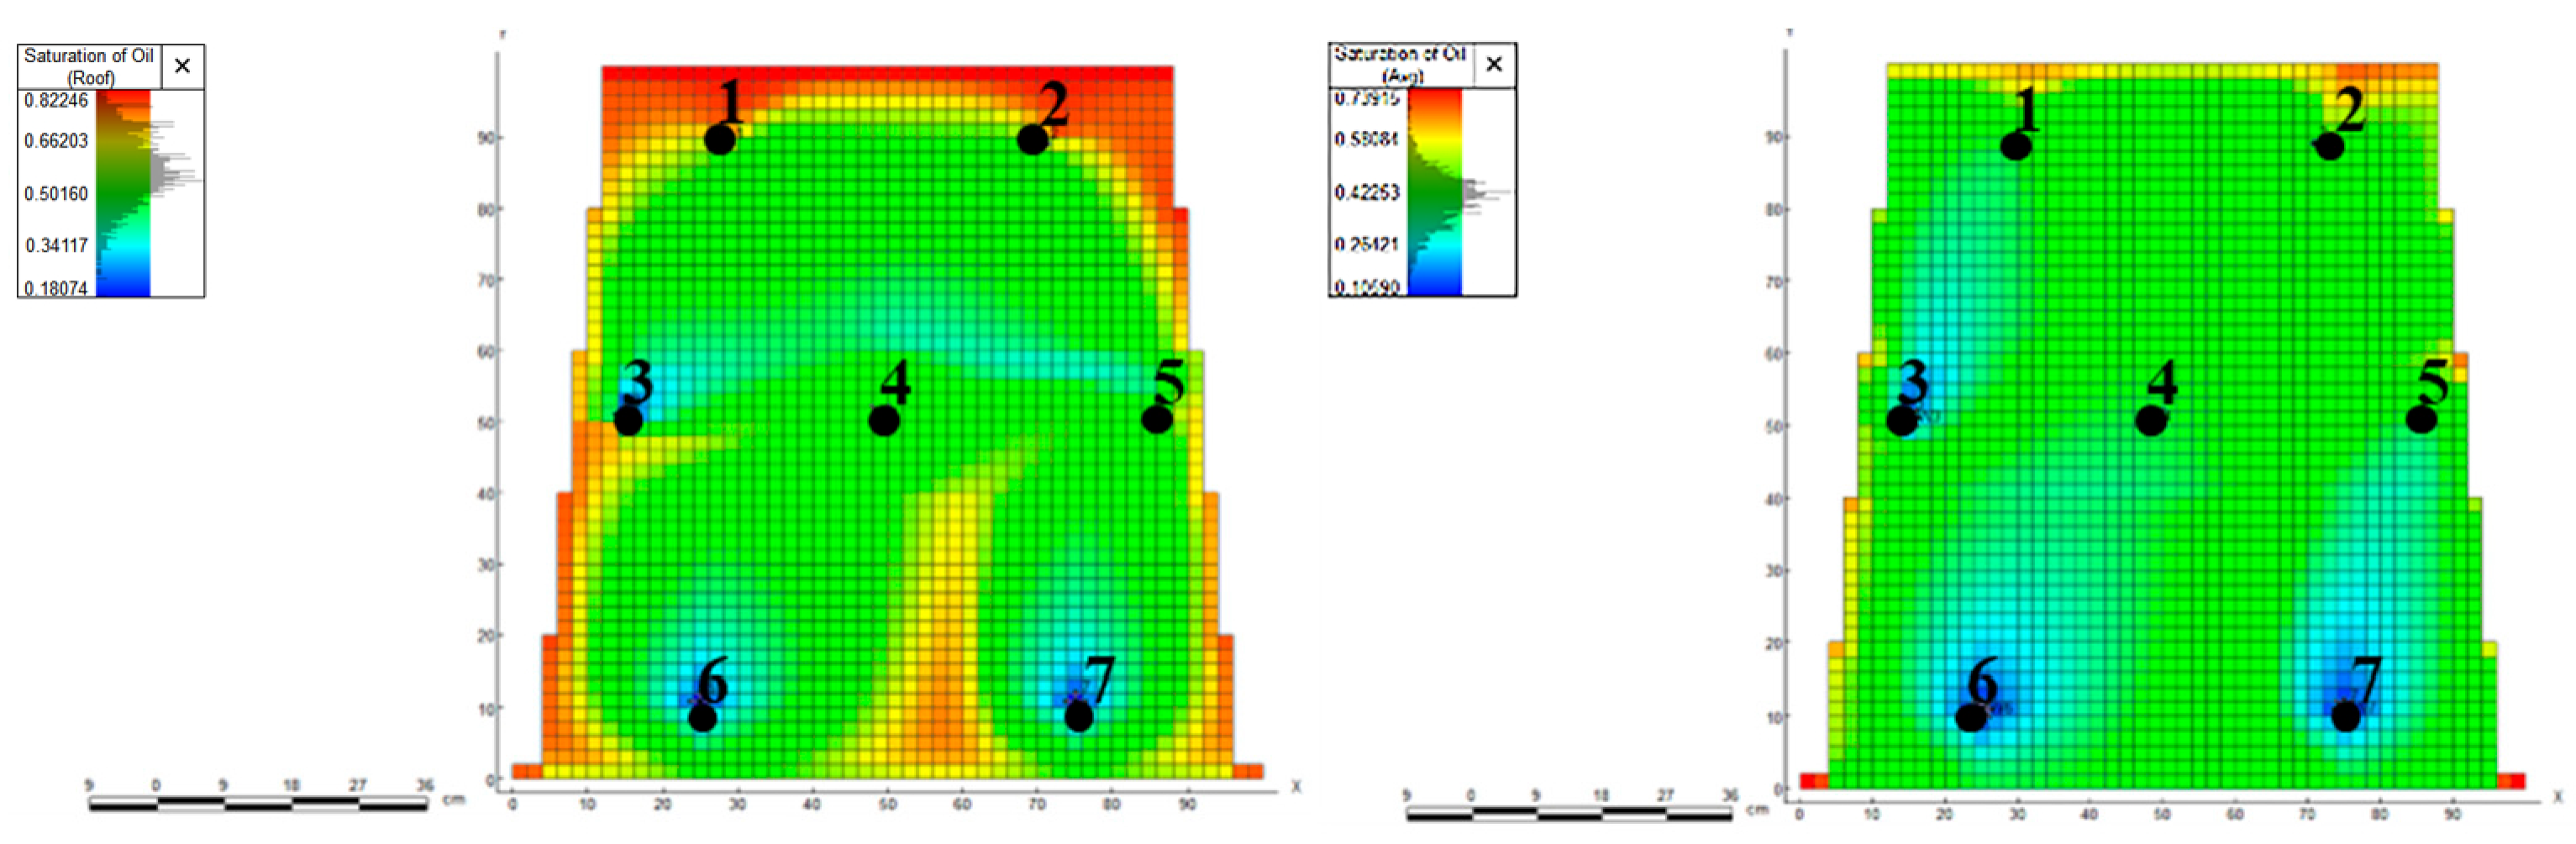
Figure 19.
Residual Oil Saturation Distribution before and after chemical plugging control (1–7: respectively representing wells 1–7).
Figure 19.
Residual Oil Saturation Distribution before and after chemical plugging control (1–7: respectively representing wells 1–7).
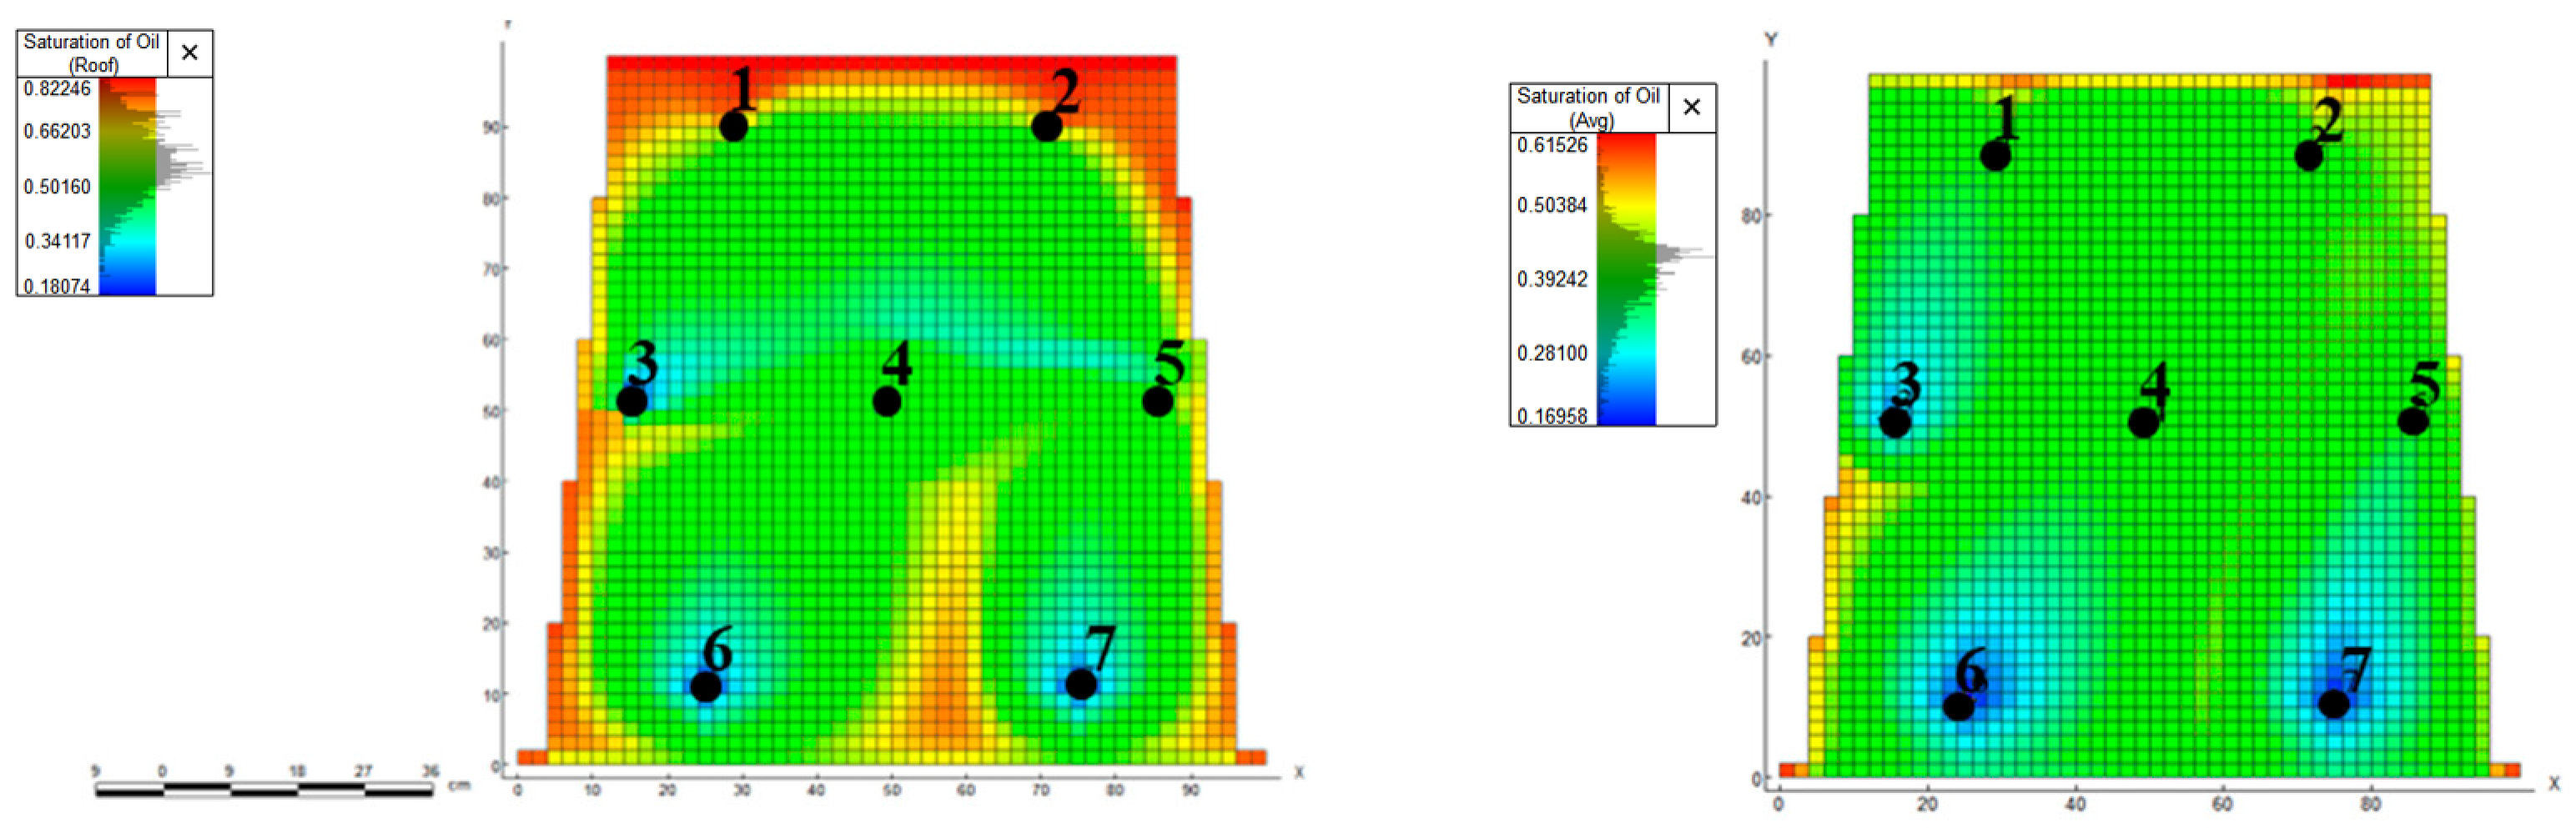
Figure 20.
Variation of Liquid Production Profile. (a) Comparison of liquid production profile before and after plugging. (b) Comparison of water absorption profile before and after plugging.
Figure 20.
Variation of Liquid Production Profile. (a) Comparison of liquid production profile before and after plugging. (b) Comparison of water absorption profile before and after plugging.

Table 1.
Results of Large Plate Physical Simulation Experiment: Degree of Enhanced Oil Recovery in Layers of Differing Permeability.
Table 1.
Results of Large Plate Physical Simulation Experiment: Degree of Enhanced Oil Recovery in Layers of Differing Permeability.
| Grouping | Recovery Efficiency of the First Stage of Water Drive | Ultimate Recovery | Recovery Rate Improvement Value |
|---|---|---|---|
| 300 mD large plate | 39.32% | 49.01% | 9.69% |
| 1000 mD large plate | 41.62% | 52.13% | 10.51% |
Table 2.
Yield change chart of Separate injection and alternate production.
| Cumulative Oil Production of Water Gut Reaching 98%, Scc (Ordinary Water Injection) | Cumulative Oil Production of Water Cut Reaching 98%, Scc (Sub-Cycle Injection Production) | Oil Recovery (Ordinary Water Injection) | Oil Recovery (Sub-Cycle Injection Production) | |
|---|---|---|---|---|
| Well 1 | 809.34 | 766.15 | 7.38% | 6.35% |
| Well 2 | 802.79 | 912.63 | 7.36% | 10.24% |
| Well 5 | 725.86 | 798.99 | 6.88% | 7.12% |
Table 3.
Yield Change Chart of Cyclic injection and production.
| Cumulative Oil Production of Water Gut Reaching 98%, Scc (Ordinary Water Injection) | Cumulative Oil Production of Water Cut Reaching 98%, Scc (Sub-Cycle Injection Production) | Oil Recovery (Ordinary Water Injection) | Oil Recovery (Sub-Cycle Injection Production) | |
|---|---|---|---|---|
| Well 1 | 809.34 | 967.23 | 7.38% | 11.32% |
| Well 2 | 802.79 | 955.73 | 7.36% | 10.56% |
| Well 5 | 725.86 | 600.50 | 6.88% | 5.41% |
Table 4.
Yield Change Chart of Combined production by round injection.
| Cumulative Oil Production of Water Cut Reaching 98%, Scc (Ordinary Water Injection) | Cumulative Oil Production of Water Cut Reaching 98%, Scc (Sub-Cycle Injection Production) | Oil Recovery (Ordinary Water Injection) | Oil Recovery (Sub-Cycle Injection Production) | |
|---|---|---|---|---|
| Well 1 | 809.34 | 913.54 | 7.38% | 9.82% |
| Well 2 | 802.79 | 961.84 | 7.36% | 9.91% |
| Well 5 | 725.86 | 772.36 | 6.88% | 6.95% |
Disclaimer/Publisher’s Note: The statements, opinions and data contained in all publications are solely those of the individual author(s) and contributor(s) and not of MDPI and/or the editor(s). MDPI and/or the editor(s) disclaim responsibility for any injury to people or property resulting from any ideas, methods, instructions or products referred to in the content. |
© 2023 by the authors. Licensee MDPI, Basel, Switzerland. This article is an open access article distributed under the terms and conditions of the Creative Commons Attribution (CC BY) license (https://creativecommons.org/licenses/by/4.0/).
Share and Cite
MDPI and ACS Style
Wang, Y.; Jiang, H.; Wang, Z.; Diwu, P.; Li, J. Study on the Countermeasures and Mechanism of Balanced Utilization in Multilayer Reservoirs at Ultra-High Water Cut Period. Processes 2023, 11, 3111. https://doi.org/10.3390/pr11113111
AMA Style
Wang Y, Jiang H, Wang Z, Diwu P, Li J. Study on the Countermeasures and Mechanism of Balanced Utilization in Multilayer Reservoirs at Ultra-High Water Cut Period. Processes. 2023; 11(11):3111. https://doi.org/10.3390/pr11113111
Chicago/Turabian StyleWang, Yong, Hanqiao Jiang, Zhiqiang Wang, Pengxiang Diwu, and Junjian Li. 2023. "Study on the Countermeasures and Mechanism of Balanced Utilization in Multilayer Reservoirs at Ultra-High Water Cut Period" Processes 11, no. 11: 3111. https://doi.org/10.3390/pr11113111
Note that from the first issue of 2016, this journal uses article numbers instead of page numbers. See further details here.