Article

Energy, Exergy, Economic, and Environmental Prospects of Solar Distiller with Three-Vertical Stages and Thermo-Storing Material

by
Habib Ben Bacha
1,*,
AbdelKader S. Abdullah
1,2,
Fadl A. Essa
3 and
Zakaria M. Omara
3
1
Mechanical Engineering Department, College of Engineering, Prince Sattam bin Abdulaziz University, Alkharj 16273, Saudi Arabia
2
Department of Mechanical Power Engineering, Faculty of Engineering, Tanta University, Tanta 31521, Egypt
3
Mechanical Engineering Department, Faculty of Engineering, Kafrelsheikh University, Kafrelsheikh 33516, Egypt
*
Author to whom correspondence should be addressed.
Processes 2023, 11(12), 3337; https://doi.org/10.3390/pr11123337
Submission received: 31 October 2023 / Revised: 24 November 2023 / Accepted: 25 November 2023 / Published: 30 November 2023
(This article belongs to the Special Issue New Trends in Distillation and Absorption Technology)

Abstract

:
Solar distillation emerges as a viable remedy for addressing water scarcity in both remote and urban locales. However, its operational efficiency remains a limiting factor. Consequently, this study undertakes a comprehensive approach by introducing design modifications to enhance a distiller’s overall productivity. The pivotal adjustment involves configuring the distiller into a three-tiered structure, thus designating it as a multi-stage solar still (MSSS). Notably, the solar stills are crafted entirely from glass to optimize consistent solar tracking, eschewing the conventional sun-tracking rotation mechanism. Furthermore, the three-stage distiller undergoes refinement through the incorporation of a thermo-storing material (PCM) comprising paraffin infused with graphene nanocomposites at the base of the solar still (SS). Subsequent to these design enhancements, a comprehensive evaluation encompassing exergy, economic viability, environmental impact, and thermal considerations is conducted for both the conventional solar still (CSS) and MSSS. The outcomes elucidate that the upper stage of the MSSS outperforms its counterparts, producing superior results. Comparative analysis indicates a remarkable 160% enhancement in productivity for the MSSS over the CSS. Cumulative water productivities for the CSS and MSSS with PCM are recorded at 2840 and 7980 mL/m2 during the daytime, reflecting an improvement of 181%. The energy efficiency metrics reveal values of 31%, 49.8%, and 53% for the CSS, MSSS, and MSSS with PCM, respectively. Moreover, the MSSS with PCM demonstrates an exergy efficiency of 5.8%. The environmental implications are quantified at 12 tons of CO2 emissions per year for the MSSS with PCM. Finally, the cost considerations illustrate a reduction in the cost of freshwater for the MSSS with PCM (0.10 $/L) and the MSSS (0.13 $/L), as compared to the conventional SS (0.24 $/L).

1. Introduction

Energy and water are two relevant topics that occupy the thinking of decision makers for any country [1,2,3]. This is because they (energy and water) are considered lifeblood: water is the most important aspect for the survival of living organisms, while energy is essential to the progress of nations and the continuation and improvement of civilizations [4,5,6,7,8]. Commercial desalination processes, such as reverse osmosis and multiple-effect distillation, are crucial for large-scale water treatment and supply. These technologies play a vital role in providing fresh water in regions facing water scarcity. However, for household use, technologies like humidification–dehumidification and distillers are employed. These smaller-scale systems are designed to meet the water needs of individual households, offering a decentralized approach to water production and treatment. The development and adoption of such water treatment processes are essential for ensuring sustainable access to clean water and mitigating the environmental impact of traditional energy sources. As advancements continue, the goal is to create more efficient, cost-effective, and environmentally friendly solutions to address the pressing issues of water scarcity and energy consumption [9,10,11,12,13,14,15,16]. The disadvantages of distillers include their low efficiency (~30%) and low output productivity (~3 L/day) [17,18,19]. As a result, numerous types of distillers have been suggested in an attempt to overcome the disadvantages of traditional SSs [20,21]. As a result of this, there are several designs of stills in the literature, like drum [22], stepped [23], tubular [24], and pyramid SSs [25,26]. Furthermore, numerous changes have been made to improve the operation of solar stills.
Absolutely, enhancing the vaporization process within a solar still is a key factor in improving productivity. The efficiency of a solar still depends on the rate at which water vaporizes from the saline water and then condenses to form distilled water. Nanomaterials have been explored and utilized in distillation structures to improve this vaporization process. Nanomaterials, due to their unique properties at the nanoscale, can enhance heat absorption, increase surface area, and facilitate more efficient energy transfer, all of which contribute to improved vaporization [27,28,29,30]. In order to boost the output of a distiller, a revolving black burlap belt was employed in both vertical and horizontal orientations. It was claimed that employing nanofluids and operating the wick belt for 5 min before pausing it for 30 min increased production by 315% [22,31,32]. The wick ropes were also utilized in a pyramidal-shaped distiller equipped with mirrors and a coolant system. The efficiency increased by 53%, while the productivity increased by 195%. Additionally, it was reported that the distiller cone surfaces greatly increased their production [33,34]. In addition, a tubular still with a spinning cylinder was suggested to lessen the basin water depth. It was discovered that a speed of 0.05 rpm produced the best distiller performance when using wicks, increasing productivity by 175% and thermal efficiency to 56.4%.
Employing phase-change materials (PCMs) and thermal ponds in desalination processes has also demonstrated their positive effects on system effectiveness [35,36,37,38,39]. Abdelgaied et al. placed a PCM beneath the absorber of a tubular solar still [40] to enhance its functionality. When the distillation achieved 7.89 L/m2/day, the distiller output increased by 90.1%. Additionally, a pyramidal distiller with basin stages was suggested by Beik et al. [41]. The output of the distiller increased by 13%, according to their findings. Essa et al. [42] examined how using curved and corrugated absorbers with nano-PCM affects the operation of stepped SSs. Solar still productivity was improved by around 170%. A study by Saleh et al. [43] focused on distiller efficiency using conic surfaces, and they reported a substantial increase in output by 95%, along with an efficiency boost of 62.4%. This suggests that the introduction of conic surfaces had a positive impact on the overall performance of the distillation system. Additionally, improvements suggested for tray stills included the incorporation of mirrors, tray cracks, nano-coatings, and phase-change materials. Among these enhancements, the combination of phase-change materials and mirrors resulted in the most significant increase in production, with a maximum thermal efficiency of 108% and 51.5%. This highlights the effectiveness of these modifications in enhancing both the quantity of distilled water produced and the overall thermal efficiency of the tray still system.
The primary objective of the current research is to enhance the operation of the solar distiller through design modifications. This involves the construction of a distiller with three stages stacked on top of each other. To ensure a fair comparison of their performances, two distillers are tested concurrently: a conventional solar still and a multi-stage solar still (MSSS). Both distillers are made entirely of glass to facilitate steady solar tracking without the need for rotational adjustments. In addition to the three-stage design, the performance of the MSSS is further improved by incorporating a thermo-storing material (PCM) at the base of the solar still. This PCM consists of paraffin mixed with graphene nanocomposites, aiming to enhance heat retention and overall efficiency. The evaluation of the distillers includes assessments on economic, exergy, thermal, and environmental aspects to provide a comprehensive understanding of the performance and sustainability of both the conventional solar still and the MSSS.

2. Methodology

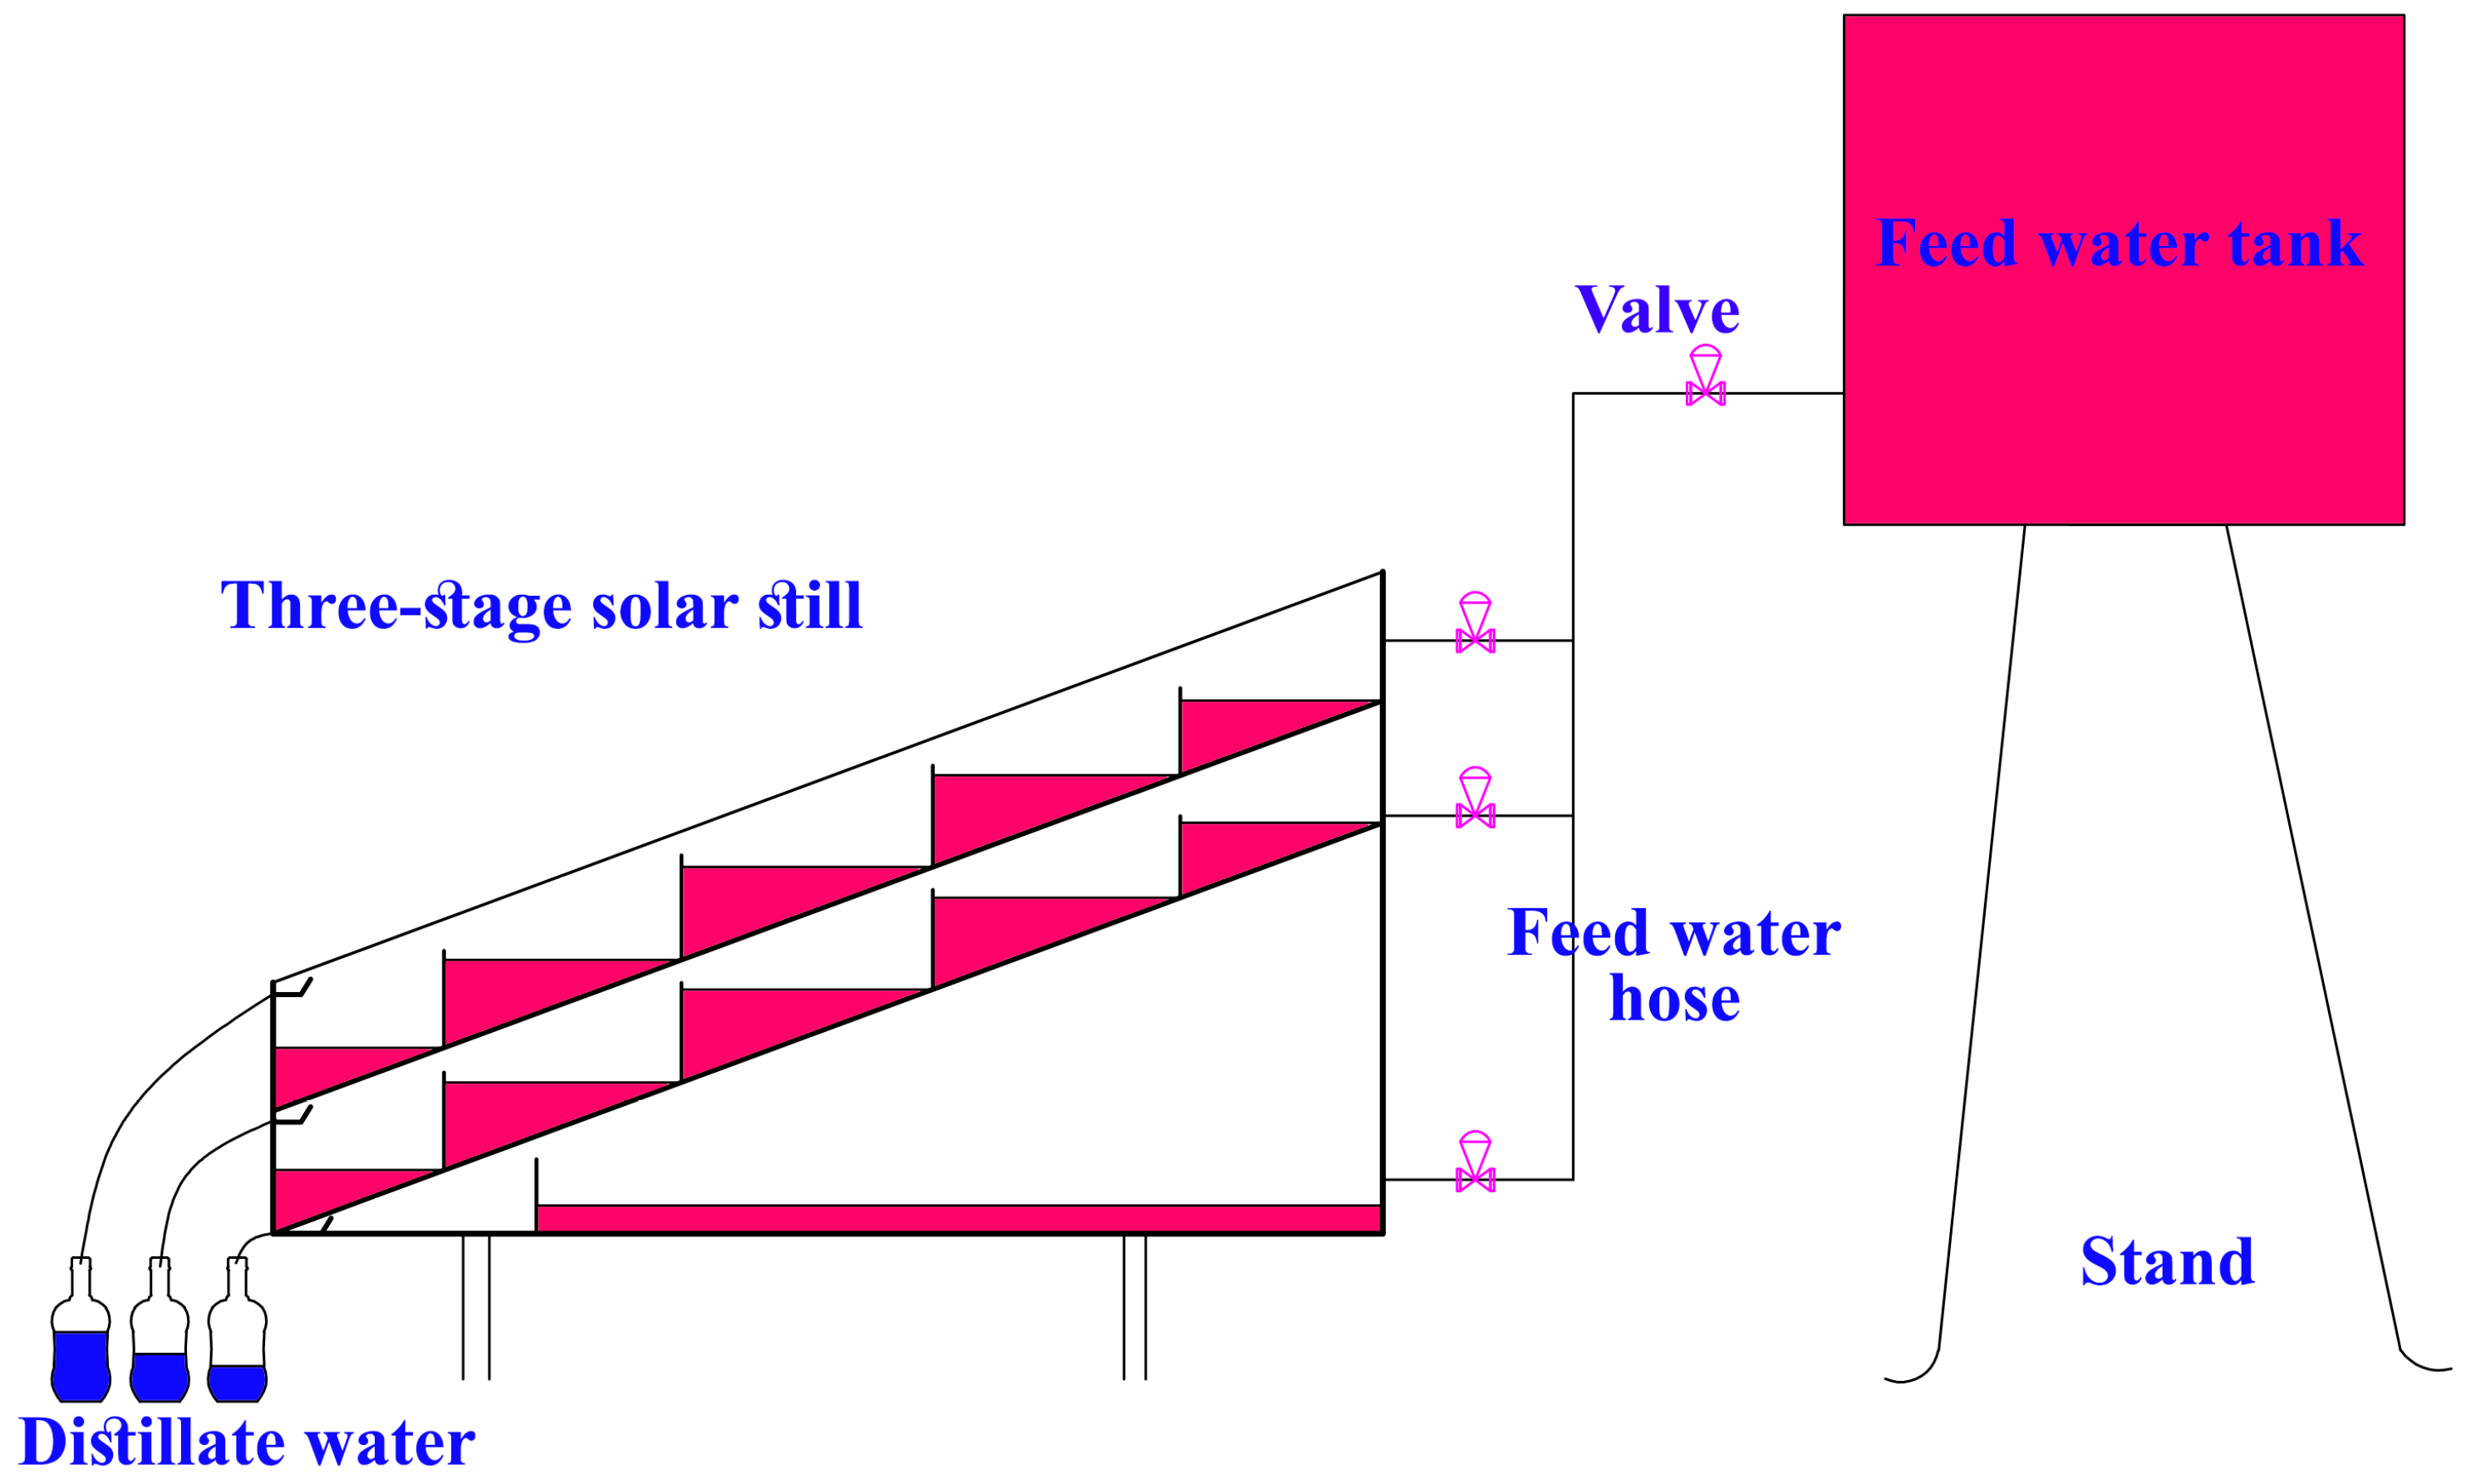
2.1. Manufacturing and Assembly of Solar Stills

Figure 1 provides a visual representation of the experimental setup, showcasing the testing rig utilized for both the conventional solar still (CSS) and the multi-stage solar still (MSSS). Meanwhile, Figure 2 presents a three-dimensional schematic representation specifically detailing the MSSS configuration.
The CSS, with a projected area of 0.5 m2, featured base dimensions measuring 100 cm × 50 cm, with a maximum wall height of 43 cm and a minimum wall height of 15 cm. The entire solar distiller was constructed from 5 mm thick glass sheets, with the floor and back surfaces coated in black paint. Furthermore, thermal insulation was applied to the bottom and rear using a 50 mm thick fiberglass wool blanket. The glass cover was inclined horizontally at an angle of 30°, aligned with the latitude of Kafrelsheikh City, Egypt. To prevent any seepage from the interior basins to the external environment, silicon was employed to seal all contiguous borders. Additionally, the CSS received water from a raised saline water tank through a controlled valve to regulate the feed flow rate.
The multi-stage solar still (MSSS) was composed of three vertical stages, each with distinct components and functionalities, as illustrated in Figure 1 and Figure 2. The projected area of the MSSS was the same as that of the CSS (0.5 m2) and featured base dimensions measuring 100 cm × 50 cm. The MSSS configuration involved three graded distillate flasks, four controlling valves, and three drain valves, with each stage having one feed tap, one distillate tap, and one drain tap. The following is a breakdown of the MSSS design:
Lower Stage (First Stage):
Traditional solar still design.
One barrier with a height of 2.5 cm to form the distiller shape.
No collecting troughs, except for the contact edge of the tilting glass cover with the glass base.
The collected distillate is directed to the outside graded flask, as shown in Figure 1 and Figure 2.
Intermediate (Second) and Upper (Third) Stages:
Each stage has four barriers or stops, each with a height of 5 cm.
These barriers create five basin sections in each stage.
The stops work to store the basin water in each section with horizontal water surfaces.
This multi-stage configuration allows for precise control and optimization of the distillation process, utilizing different stages to enhance overall performance.

2.2. Measuring Instruments

To really be capable of determining how well the distiller was operating, all necessary measurement sensors were integrated into the MSSS. In this regard, the sun’s irradiation levels were measured using a solarimeter (pyranometer). The numeric data of temperatures were quantified using a combined system of sensors and an Arduino microcontroller. An anemometer was used to estimate the airspeed. In addition, the relative humidity was measured via a capacitive humidity sensor. The quantity of freshwater was reported using graded flasks. Table 1 contains the characteristics and specifics of the measuring devices.

2.3. Uncertainty Analyses

By following the method mentioned in Ref. [44], the error of experimental results is evaluated. Consider a collection of observations in which each measurement’s error can be stated using the same probabilities. The requested outcome of the tests is then calculated using these data. After that, based on the errors in the main measurements, the uncertainties in the derived output can be approximated. The output R is a productivity formula of the independent parameters x1, x2, x3,… , xn. Thus,
R = R ( x 1 ,   x 2 ,   x 3 ,   ,   x n )
Assuming that the different independent parameters have uncertainty of W1, W2, W3,…, Wn. Then, the error created in the result will be:
W R = R X 1 W 1 2 + R X 2 W 2 2 + + R X n W n 2
The monitoring apparatus errors are listed in Table 1. As a result, the efficiency error is:
W η t h = η t h m W m 2 + η t h I R W I t 2
The resolution of an instrument refers to the smallest incremental change in a measured quantity that the instrument can detect or display. The reading error in Table 1 is the discrepancy between the observed or measured value that a user reads from an instrument and the true or actual value of the quantity being measured. Then, minimizing reading errors is essential for better operation and evaluation of performance. Regarding these relations, the thermal efficiency has an error of around ±2.3.

2.4. Steps to Conduct the Experiments

The experimental testing was performed under the weather conditions of Kafrelsheikh City (31.1107° N, 30.9388° E), Egypt, within the period from June 2022 to July 2022. The parameters mentioned in Section 2.2 and Section 2.3 were measured using suitable equipment during the daytime, from 09:00 to 17:00. As a result, the sun radiation, wind velocity, water temperatures, ambient and glass temperatures, and quantity of distillate were quantitated every hour. The total cumulative productivity was determined by adding the distillate quantity for each hour over 24 h. Moreover, each tested case was replicated twice, and the results presented in the findings section represent the averaged data to ensure accuracy and reliability. The subsequent phases included experimental testing as follows:
  • The thermal performances of the CSS and MSSS were evaluated and compared to obtain the differences between both distillers.
  • The operation of the MSSS was tested when employing the thermo-storing material (PCM). The PCM was placed under the base of the absorber in the first stage. The PCM was combined with graphene nanocomposites using paraffin wax. Paraffin wax, a hydrocarbon wax, finds widespread application in various contexts, notably as a phase-change material for thermal energy storage. Paraffin wax typically exhibits a melting point within the range of 46–68 °C. Also, the specific heat capacity of paraffin wax is approximately 2.1–2.5 J/g °C, indicating its ability to absorb and release thermal energy efficiently. Paraffin wax is characterized by a relatively low thermal conductivity, typically falling within the range of 0.2–0.3 W/m °C.
  • Finally, the economic, exergy, thermal, and environmental prospects for the CSS and MSSS are evaluated.

3. Results

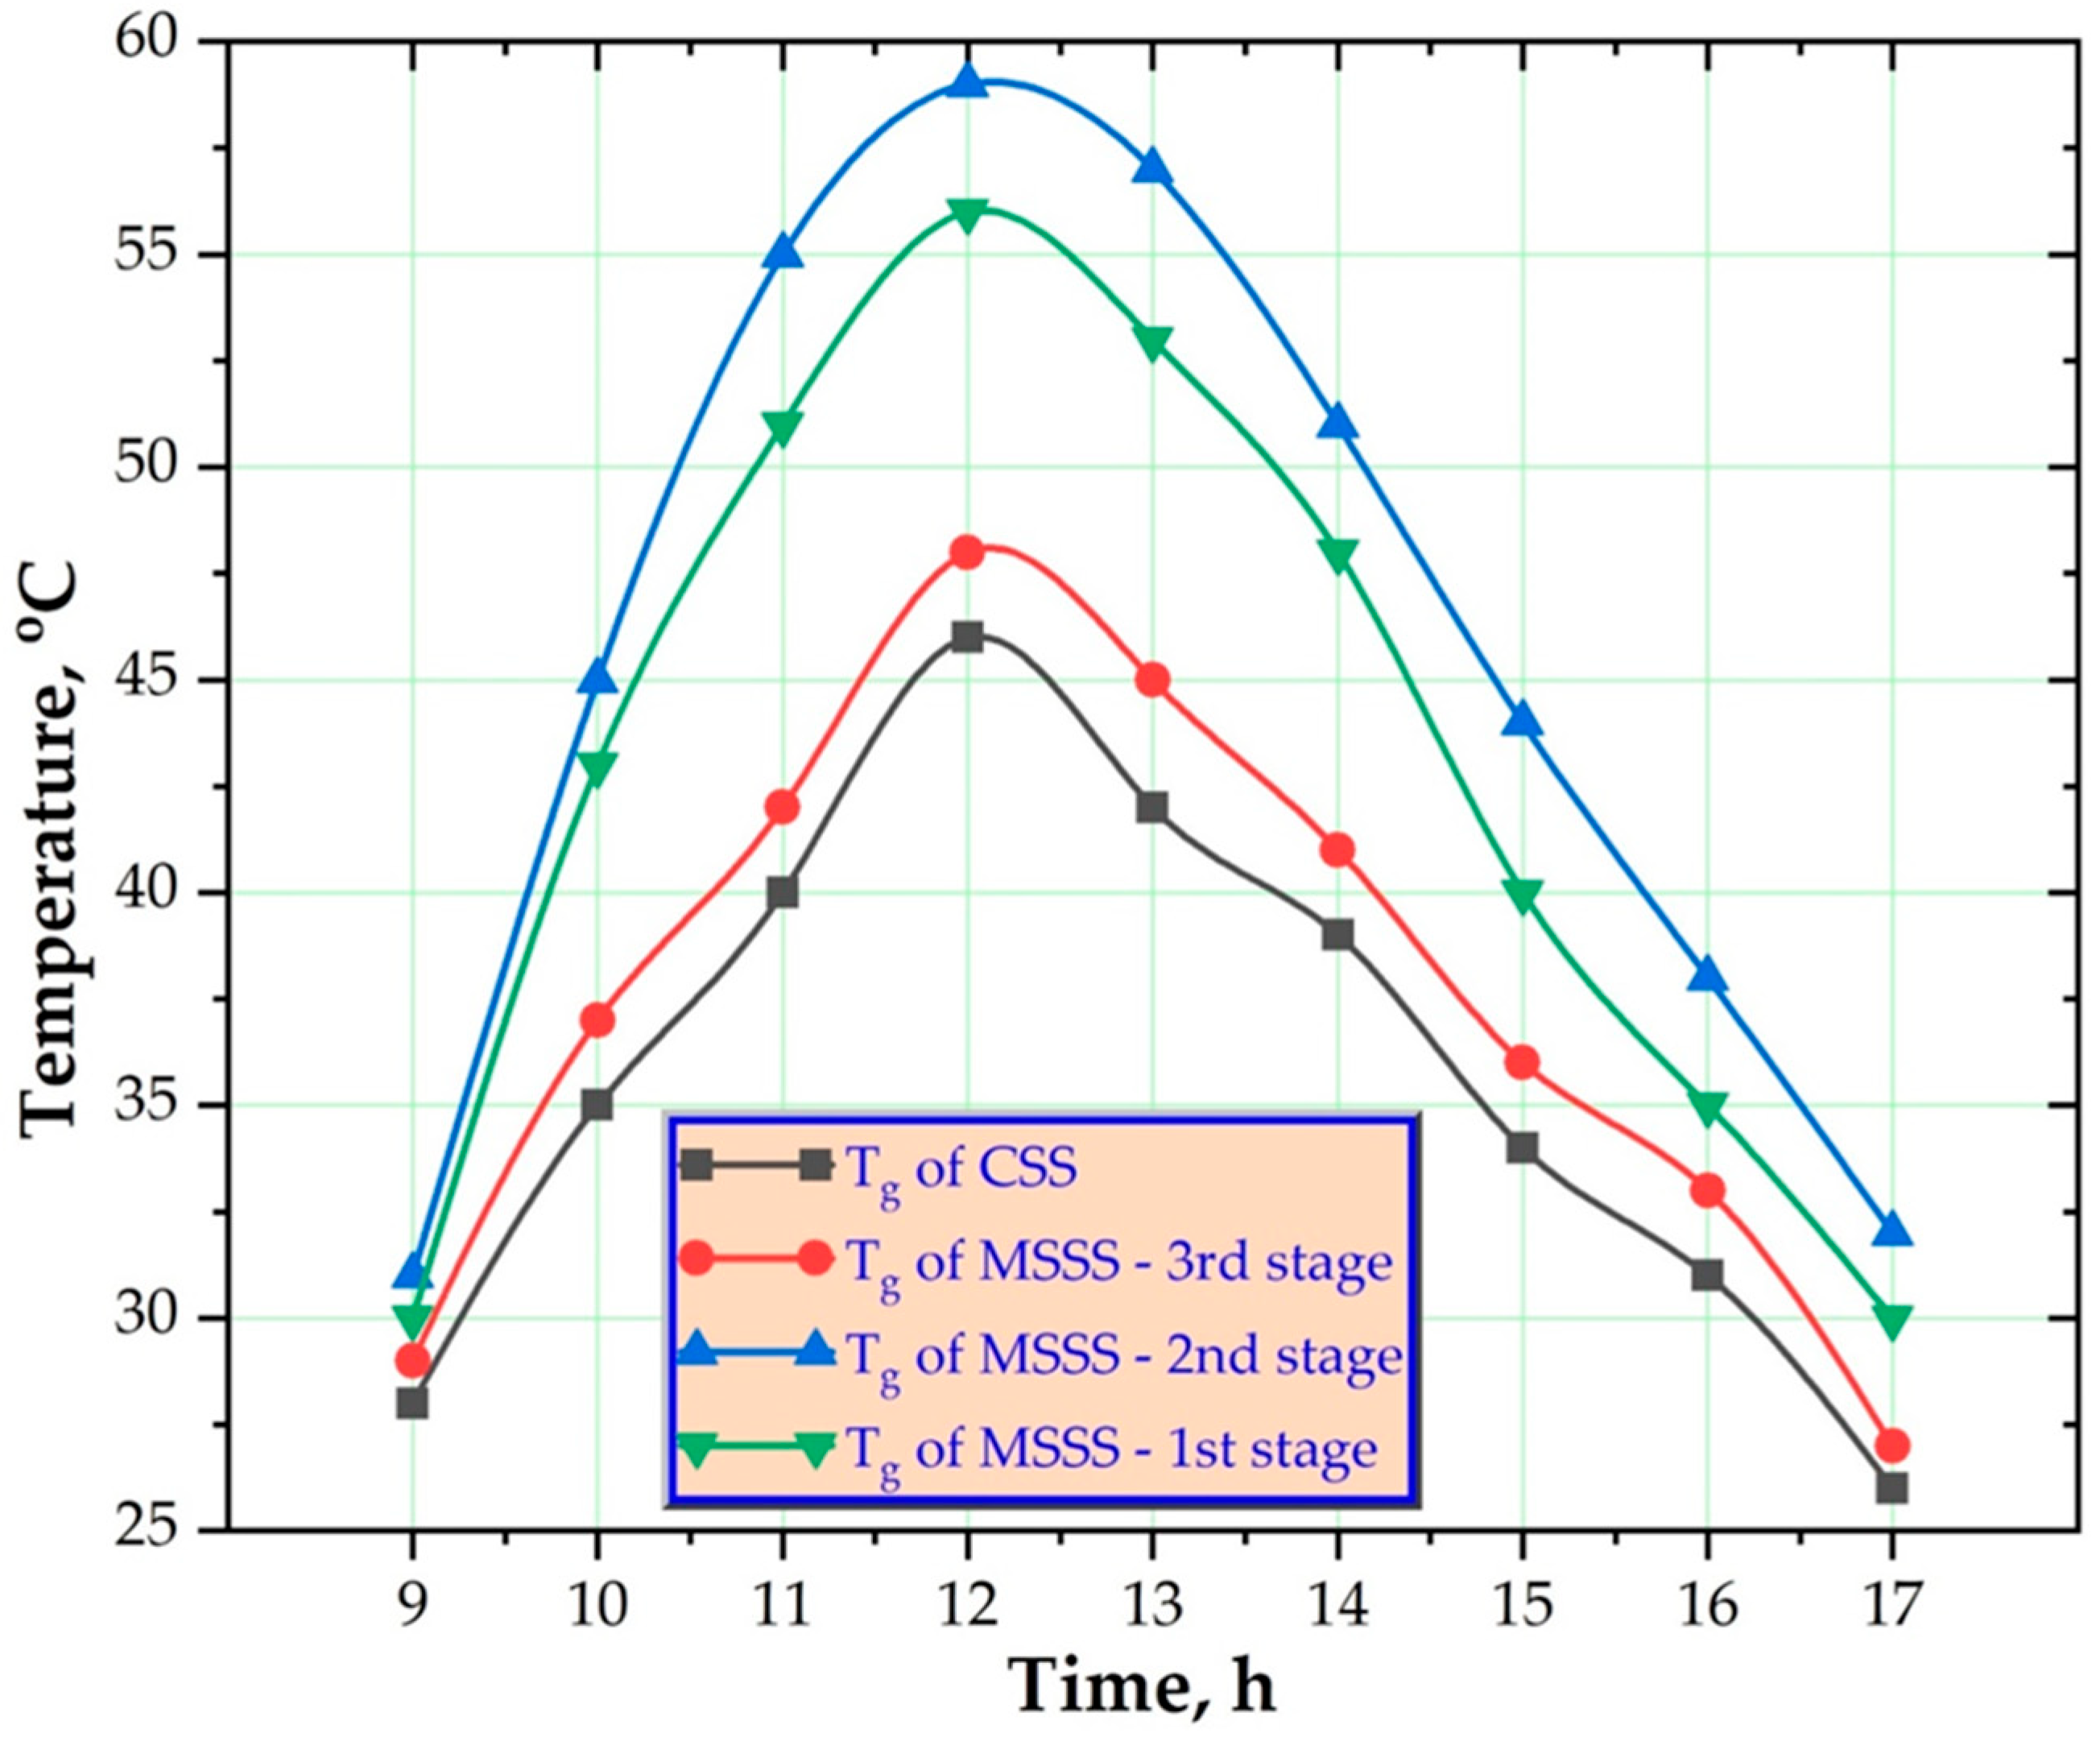
3.1. Thermal Performance of Solar Distillers (CSS and MSSS)

The weather conditions, like the wind velocity, sun irradiation, air humidity, and ambient air temperature, were measured and recorded hourly. As a result, Figure 3 depicts the hourly behaviors of these parameters. It can be observed in Figure 3 that the sun’s irradiation rises from a low point in the morning to a peak at noon (11:00–13:00). The solar irradiation then drops to zero as the sun begins to set. At 12:00, the maximum sun radiation was around 910 W/m2. Furthermore, Figure 3 shows that increasing the sun’s radiation raises the temperature of ambient air and vice versa. So, at 09:00, the temperature of ambient air was around 27 °C, and it rose to a maximum of 34.5 °C at 12:00. The air temperature was then reduced to 25.5 °C at 17:00 (Figure 3). Furthermore, the influence of air speed on the thermal efficiency of the distiller was minor. This was concluded because, despite the large shift in air speed, the influence on water, glass temperatures, and production productivity appeared to be minimal, as shown in Figure 4, Figure 5 and Figure 6. As shown in Figure 3, the air speed changed from 1.2 to 4.8 m/s at 09:00 and 14:00, and after that, at 17:00, it changed to 4 m/s. Furthermore, as indicated in Figure 3, the ambient air’s average humidity ratio was about 60%.
Figure 4 depicts the water temperature of both the CSS and the three stages of MSSS. The behavior of the water temperature is comparable to that of sun irradiation. So, the water temperature of the CSS was elevated from 32.5 to 64 °C at 09:00 and 12:00 and decreased again to 35 °C (Figure 4) at 17:00. The MSSS had three water temperatures: one temperature for the water in every stage. For instance, the water temperature of the third stage (the upper stage) is higher than that of the second (intermediate) stage, which was more than that of the first (lower) stage, as depicted in Figure 4. Then, the water temperatures of the third, second, and first stages were 34, 33, and 32 °C at 09:00, respectively. Also, the water temperatures of the third, second, and first stages were raised to 67, 63.5, and 60 °C, respectively, at 12:00 (Figure 4). In the afternoon, the water temperatures of the third, second, and first stages declined to 41, 34.5, and 31 °C at 17:00 (Figure 4). Therefore, the CSS daily average water temperature was about 51.5 °C compared to 54.3 °C, 50.8 °C, and 46.3 °C for the third, second, and first stages of the MSSS. As a result of this, the third stage’s water temperature was greater than the second stage’s, which was almost the same as for the CSS. This results in more improved water vaporization for the higher achieved water temperature. The main reason for the elevated water temperature inside the MSSS during the third stage in comparison to the CSS may be the geometrical shape of the water within the MSSS, which almost forms a triangle. The triangle shape has a gradual increase in water temperature from zero until the water reaches the edge of the standing barrier inside the first stage. The second stage has a lower water temperature than the upper stage because the upper stage receives solar radiation from all directions of the MSSS (upper glass cover + three vertical basin walls of south, west, and east directions), while the second (intermediate) stage receives sun irradiation from only the three vertical basin walls of south direction, west direction, and east direction in addition to the heat losses from the glass base of the upper stage.
Figure 5 depicts the glass temperature of both the CSS and the three stages of the MSSS. The behavior of the glass temperature for both solar stills was similar to sun irradiation and the temperatures of saline water. So, the temperature of the glass of the CSS increased from 28 to 46 °C at 09:00 and 12:00 and decreased again at 17:00 to 26 °C, as shown in Figure 5.
The MSSS had three glass temperatures: one temperature for each glass cover in every stage. For example, the glass temperature of the second (intermediate) stage of the MSSS was higher than that of the first (lower) stage, which was higher than that of the third (upper) stage, as shown in Figure 5. Additionally, the lowest temperature of the glass was indicated for the cover of the glass of the CSS compared to that of the stages of the MSSS, as shown in Figure 5. The glass temperatures of the second, first, and third stages were 31, 30, and 29 °C at 09:00, respectively. Then, the glass temperatures of the second, first, and third stages increased to 59, 56, and 48 °C at 12:00 (Figure 5). The temperatures of glass in the second, first, and third stages decreased to 32, 30, and 27 °C at 17:00 in the afternoon (Figure 5). As a consequence, the CSS had an average daily glass temperature of approximately 35.5 °C compared to 45.8 °C, 42.9 °C, and 37.6 °C for the second, first, and third stages of the MSSS. As a result of this, the difference in temperature between water and glass for the CSS was about 15 °C, compared to around 17 °C for the temperature difference between the water and glass for the third stage of the MSSS. The temperature difference between the glass and water for the second and first stages of the MSSS was around 5 °C and 3 °C, respectively. As is well known, the greater the difference in temperature between the glass and water, the higher the productivity due to the higher condensation rate obtained. The elevation in the temperature of the glass in the intermediate stage is attributable to the fact that the upper glass is subjected to ambient atmospheric air. It is inherent that exposure to atmospheric conditions leads to a reduction in temperature. Conversely, the glass in the intermediate stage is exposed to the elevated temperature of the water at its base and is concurrently influenced by the temperature of the steam generated from the lower stage. Consequently, both the steam emanating from the base of the glass and the water above it contribute to an elevation in the temperature of the glass in the intermediate stage. In contrast, the lower stage experiences a decrease in temperature with increasing depth, as the water progressively dissipates a portion of its thermal energy. Consequently, the temperature of the glass in the lower stage is inherently lower than that of the intermediate stage.
Figure 6 shows the hourly productivity of the CSS and the three stages of the MSSS as well as the accumulated production of the CSS and MSSS. The production of the MSSS was greater than that of the conventional SS. Also, the hourly productivity shows the same behavior as the sun irradiation and the temperatures of glass and water. So, the production begins from zero at 09:00 and progressively increases to a maximum at noon (from 12:00 to 14:00); then, it begins to fall until it reaches its lowest at sunset (about 17:00), as illustrated in Figure 6. Additionally, the hourly production achieved from the third stage of the MSSS was only higher than that of the conventional SS, as shown in Figure 6. Moreover, the productivity obtained from the third stage of the MSSS was greater than that of the second stage, which was more than that of the first stage. Thus, the higher the temperature of the water–glass variation, the greater the hourly distillate produced by the same distiller. This result is confirmed by the data presented in Figure 6 when compared with those presented in Figure 4 and Figure 5. As the water–glass temperature variation for the third stage of the MSSS was more than that of the CSS, the second stage of the MSSS, and the first stage of the MSSS, the hourly distillate obtained from the third stage of the MSSS was greater than the CSS, the second stage of the MSSS, and the first stage of the MSSS (Figure 6). The CSS hourly production had a maximal value of 350 mL/m2 at 13:00 compared to 400, 300, and 200 mL/m2 at 13:00 as the maximal values for the third, second, and first stages of MSSS, respectively, as shown in Figure 6. Afterward, the production of the conventional SS reached 150 mL/m2 at 17:00 compared to 220, 120, and 80 mL/m2 at 17:00 as the minimal values for the third, second, and first stages of the MSSS, respectively, as depicted in Figure 6. Moreover, the cumulative daytime productivity of the CSS was 1750 compared to 4550 mL/m2 for the MSSS. As a result of this, MSSS production was increased by about 160%.

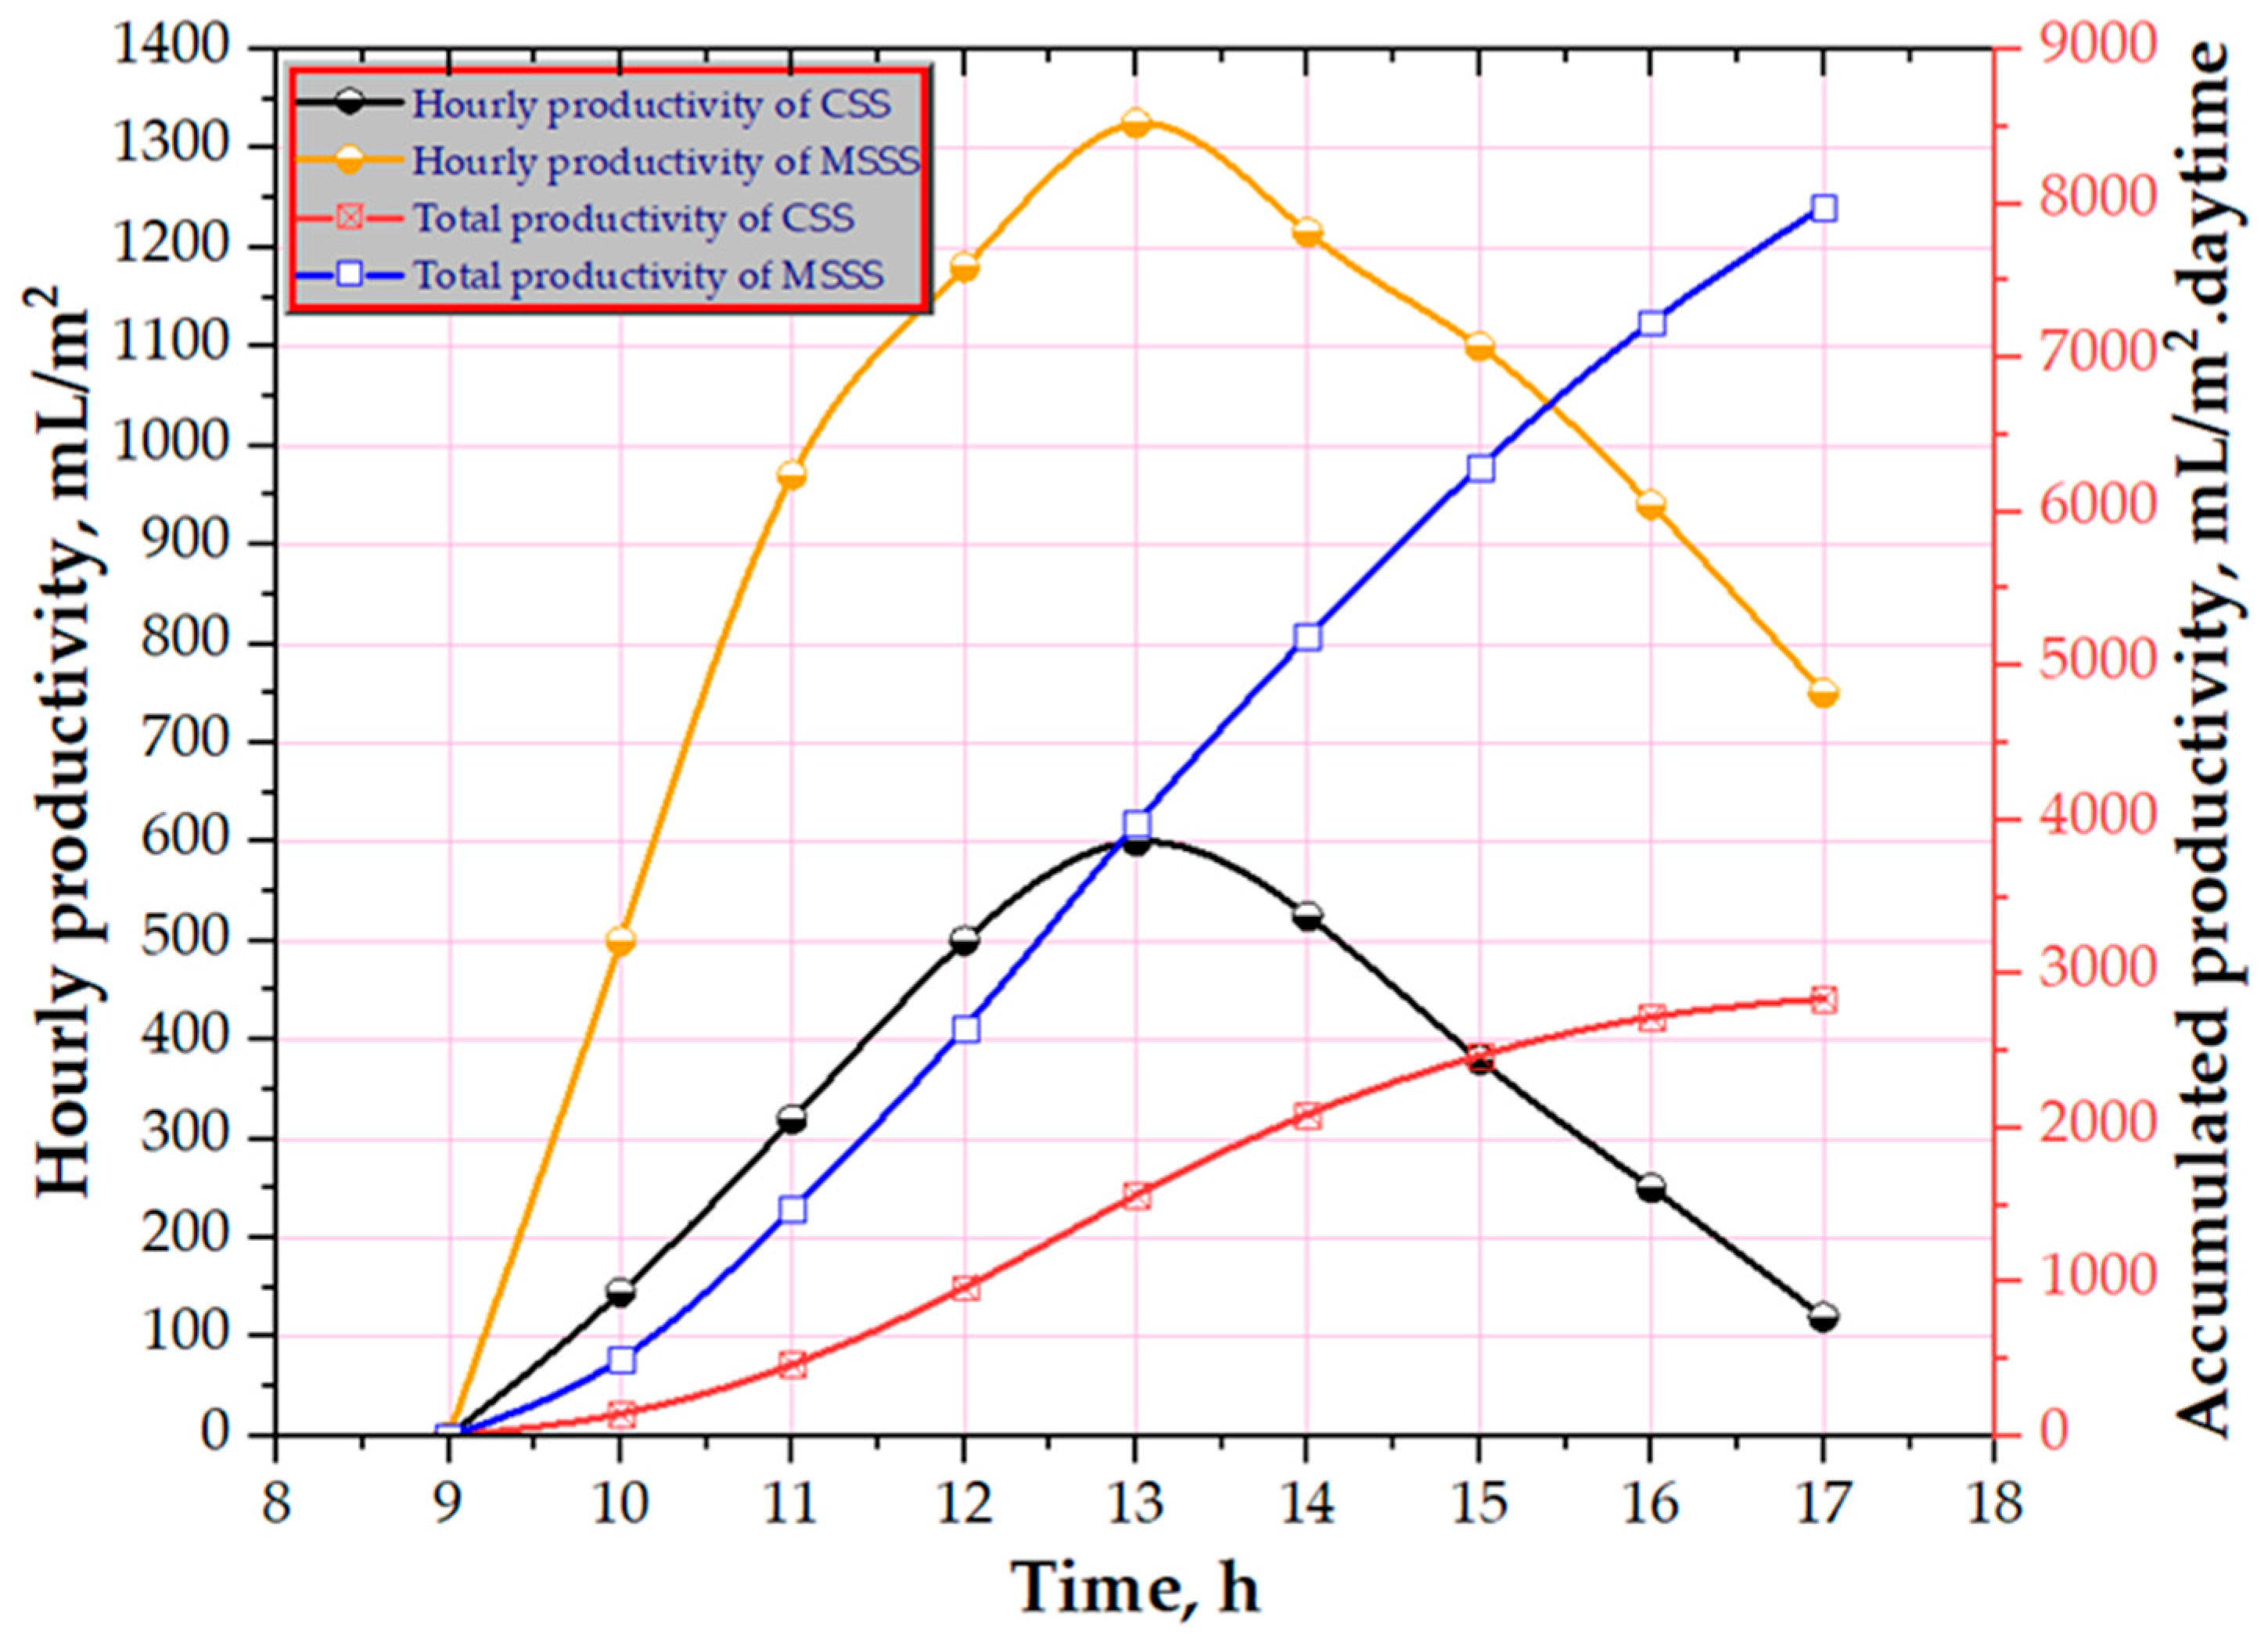
3.2. Influence of Using PCM on MSSS Performance

The operation of the MSSS was tested when employing the thermo-storing material (PCM) of paraffin co-mixed with graphene nanocomposites. The PCM was placed under the base of the absorber of the first stage. To prevent the repetition of figures, the authors favored only displaying the data of the hourly and total productivities of distillers. Additionally, it can be deduced that the PCM heats up while sun irradiation increases. Water served as a heat supplier, and the PCM served as a heat sink throughout this operation (loading). The heat of the PCM increased. The PCM, however, tends to discharge as soon as the sun intensity starts to decline. Additionally, while phase changing was seen during dissolving, the heating processes resulted in a detectable temperature difference. PCM’s temperature noticeably increased through the pre- and post-heating operations. This is consequently referred to as perceptible heat. PCM changes from a solid to a liquid phase during dissolving.
Figure 7 shows the cumulative production and hourly output of the CSS and MSSS with PCM. The productivity of the MSSS was greater than that of the traditional SS. The hourly production of the CSS reached a maximal value of 600 mL/m2 at 13:00 compared to 1325 mL/m2 at 13:00 for the MSSS with PCM, as shown in Figure 7. Following that, the productivity of the conventional SS reached a minimal value of 120 mL/m2 at 17:00 compared to 750 mL/m2 at 17:00 for the MSSS with PCM, as depicted in Figure 7. Furthermore, the CSS’s cumulative daytime production was stated to be 2840 compared to 7980 mL/m2 for the MSSS with PCM. Therefore, the productivity of the MSSS with PCM was increased by around 181%.

3.3. Thermal Efficiency of Investigated Solar Distillers

The execution of a distiller relies mainly on its energy efficiency as follows [45,46].
η d ( % ) = m ˙ ( p r o d u c t i v i t y ,   k g / s ) × h f g ( v a p o r i z a t i o n   l a t e n t   h e a t   a t   w a t e r   t e m p e r a t u r e ,   J / k g ) 3600 × A ( a r e a ,   m 2 ) × I ( s u n   i r r a d i a t i o n ,   W / m 2 )
The daily productivity, production increase, and thermal efficiency of solar distillers are tabulated in Table 2. The thermal operation of the MSSS is better than that of the CSS. The energy efficiency of the CSS was around 31%, while the energy efficiency of the MSS reached 49.8% when the productivity increased by 160%. In addition, the efficiency of the MSSS with PCM was approximately 53% and the productivity increase was 181%. Therefore, the thermal efficiency had a growing behavior similar to that of the daily productivity increase, as shown in Table 2. The greater the increase in daily productivity, the greater the increase in energy efficiency.

3.4. Exergy Analyses

To evaluate the energy quality for thermal arrangements, exergy analyses may be employed. The proportion of exergy inputs to exergy outputs is known as exergy efficiency ( η e x ) [47,48].
η e x = E x e r g y   o u t p u t E x e r g y   i n p u t = m ˙   ×   h f g 3600 × 1 T a + 273 T w + 273 A × I t 1 4 3 × T a + 273 T s u n + 1 3 T a + 273 T s u n 4 × 100
where the system area (m2), sun intensity (W/m2), temperature of air (K), and sun temperature (6000 K) are presented as A , I t , T a , and T s u n , respectively.
Based on the relationships mentioned previously, the MSSS with PCM has an exergy efficiency of 5.8%.

3.5. Environmental Analysis

The environmental studies of the current proposal are assessed in this section, as environmental investigations of ecosystems have received a lot of attention in order to elucidate the influence of greenhouse gas emissions, particularly CO2, as well as offer life cycle evaluations.
This piqued the interest of the authors since using carbon fuels results in natural catastrophes and hazards, like the release of greenhouse gas emissions into the atmosphere. To achieve sustainability goals, scholars have employed renewable energies for devices, rather than carbon fuels. The recommended equations for CO2 emissions and reduction by solar energy (annually and throughout a device’s lifetime) are as follows:
The yearly generated distiller energy (kW·h/year) is
E o u t = 365 × m ˙ × h f g 3600
The average CO2 equivalent intensity for power produced from fossil-fuel-based power plants is roughly 2 Kg CO2 per kW·h, [49,50]. Additionally, Sahota et al. [51] showed that the average CO2 equivalent intensity for electricity generation from coal is about 2 kg CO2/kW·h.
C O 2 ,   e m i t t e d = 2 × E i n ( e m b o d i e d   e n e r g y   o f   c o m p o n e n t s ) n
where n is the lifespan of the solar still and Ein is the embodied energy of the distillation unit. Embodied energy Ein is defined as energy consumed throughout the production process of distiller components, and it is computed by multiplying the energy density of each section of solar still with their corresponding mass [49]. Subsequently, the total carbon dioxide emissions during the device’s lifespan are determined.
C O 2 , e m i t t e d , l i f e = 2 × E i n
The annual CO2 mitigation of the solar still (kg of CO2) equals Eout × 2, where Eout represents the annual energy yield gained from the solar still [51]. So, the quantity of carbon dioxide that is decreased in kg/year is
C O 2 , m i t i g a t e d = 2 × E o u t
Likewise, the quantity of CO2 reduced in kilograms over the device’s life cycle is
C O 2 , m i t i g a t e d , l i f e = 2 × E o u t × n
The following shows how the environmental variables ( ϕ C O 2 and Z ) are derived:
ϕ C O 2 = 2 × E o u t × n E i n 1000
And,
Z = z C O 2 × ϕ C O 2
where ( z C O 2 ) is the price of carbon on global markets (14.5 $ per ton).
Table 3 shows the embodied energies of individual elements when the above correlations are taken into account. Table 4 includes the environmental and enviroeconomic parameters. As a result, the environmental impact of the MSSS with PCM was 12 tons of CO2 per year.

3.6. Economic Analyses

To ensure the viability of the suggested system, the framework was evaluated from the standpoint of financial research. The total fixed costs for the MSSS, MSSS with PCM, and conventional SS were 170, 180, and 120 $. Table 5 and Table 6 show the planned financial literature inputs and statistical connections.
The price of water for the CSS, MSSS, and MSSS with PCM, based on the aforementioned relationships, was 0.24, 0.13, and 0.10 $/L. In light of the financial evaluation, the suggested system is, therefore, practicable.

4. Conclusions

This research focused on enhancing the productivity of a solar still by introducing design modifications. These adjustments involved creating a three-stage solar still, referred to as the multi-stage solar still (MSSS), and comparing it to a conventional solar still, designated as the CSS. Unlike the CSS, which rotates to track the sun, the MSSS was constructed with three glass stages stacked on top of each other to maximize steady solar tracking. Moreover, to further improve the performance of the MSSS, a thermo-storing material (PCM) was incorporated at the base of the still. This study evaluated the economic, exergy, thermal, and environmental aspects of both the CSS and MSSS. The results indicated that the water temperature in the MSSS varied across its three stages, with the third stage (upper stage) having the highest temperature, followed by the second (intermediate) stage and the first (lower) stage. Specifically, the average daily water temperature of the CSS was approximately 51.5 °C, compared to 54.3 °C, 50.8 °C, and 46.3 °C for the third, second, and first stages of the MSSS, respectively. Additionally, the glass temperature in the MSSS also exhibited variation among its stages, with the second stage (intermediate) having the highest temperature, followed by the first (lower) stage and the third (upper) stage. The average daily glass temperature of the CSS was around 35.5 °C, while it was 45.8 °C, 42.9 °C, and 37.6 °C for the second, first, and third stages of the MSSS, respectively. These findings highlight the temperature variations within the MSSS stages and the potential impact on overall performance. The most important findings of this study can be summarized in the following points:
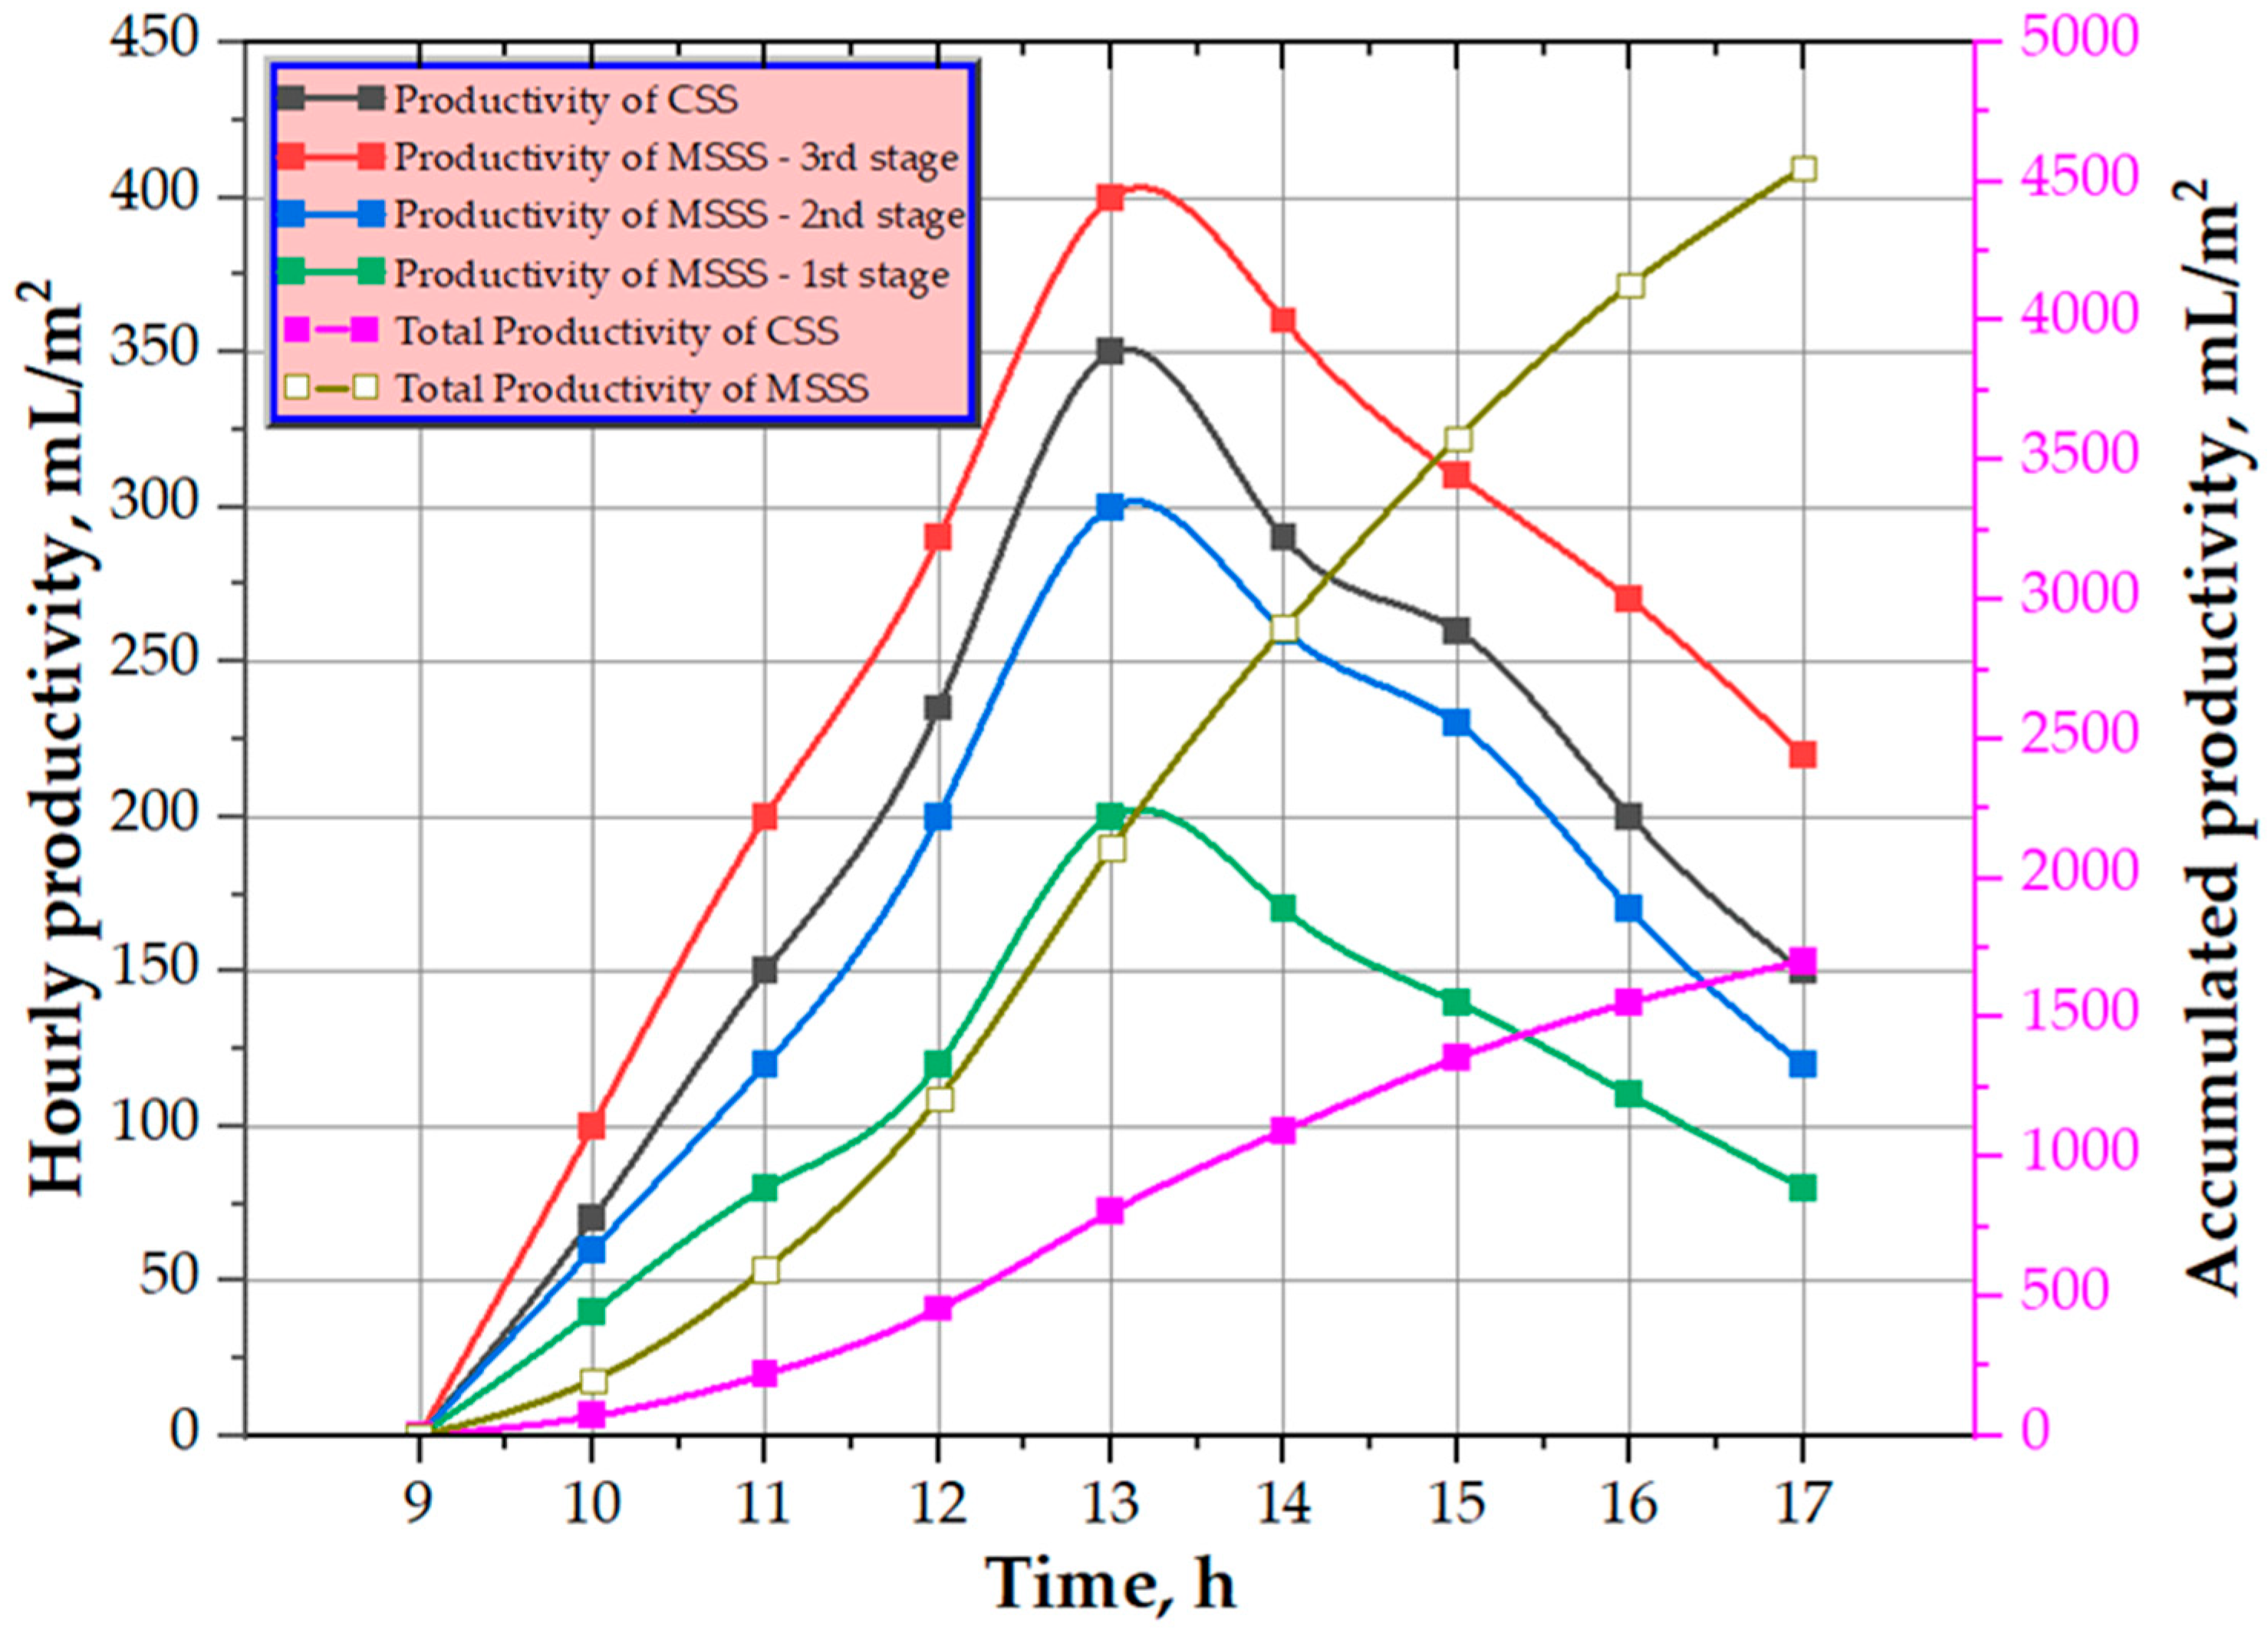
  • The upper stage was better than that of the other stages of the MSSS.
  • Furthermore, the cumulative day production of the CSS was reported to be 1750 compared to 4550 mL/m2 for the MSSS. Therefore, the productivity of the MSSS was increased by about 160%.
  • The cumulative daytime outputs of the CSS and MSSS with PCM were 2840 and 7980 mL/m2, respectively, with an improvement of 181%.
  • The energy efficiencies of the CSS, MSSS, and MSSS with PCM were 31%, 49.8%, and 53%, respectively. The MSSS with PCM had an exergy efficiency of 5.8%.
  • The MSSS with PCM had an environmental impact of 12 tons of carbon dioxide per year.
  • The costs of freshwater for the conventional SS, MSSS, and MSSS with PCM were 0.24, 0.13, and 0.10 $/L, respectively.

Author Contributions

All authors contributed to the study’s conception and design. Material preparation, data collection, and analysis were performed by H.B.B., Abdullah A.S.A., F.A.E. and Z.M.O. All authors have read and agreed to the published version of the manuscript.

Funding

This research was funded by Deputyship for Research & Innovation, the Ministry of Education in Saudi Arabia through the project number: IF2/PSAU/2022/01/21835.

Data Availability Statement

The data presented in this study are available upon request from the corresponding author.

Acknowledgments

The authors extend their appreciation to the Deputyship for Research & Innovation, the Ministry of Education in Saudi Arabia, for funding this research work through the project number: IF2/PSAU/2022/01/21835.

Conflicts of Interest

The authors declare no conflict of interest.

Nomenclature

h f g Vaporization latent heat at water temperature, J/kg
m ˙ Productivity, kg/s
η d Daily efficiency, %
T a Air temperature, K
T s u n Sun temperature, K
T w Water temperature, K
z C O 2 Price of carbon on the global markets, $/ton
η e x Exergy efficiency, %
ϕ C O 2 and Z Environmental variables
A Area, m2
CO2Carbon dioxide
CSSConventional solar still
I Sun irradiation, W/m2
MSSSMulti-stage solar still
PCMPhase-change material
A M C Annual maintenance costs, $
A S V Annual salvage value, $
C P L Price of distillate, $/L
C R F Capital recovery factor
E Energy, kW.h
F Total fixed expenses, $
F A C Annual fixed costs, $
M Annual productivity, L/m2·year
N Annual working days, day
S Salvage value, $
S F F Sinking fund factor
T A C Annual total cost, $
i Interest rate, %
n Lifespan of solar still, year

References

  1. Piernavieja, G.; Peñate, B. Review: Desalination Technologies and Renewable Energies. Study Case: PV-RO. 2015. Available online: https://www.irena.org/-/media/Files/IRENA/Agency/Publication/2012/IRENA-ETSAP-Tech-Brief-I12-Water-Desalination.pdf (accessed on 30 October 2023).
  2. Al-Othman, A.; Tawalbeh, M.; El Haj Assad, M.; Alkayyali, T.; Eisa, A. Novel Multi-Stage Flash (MSF) Desalination Plant Driven by Parabolic Trough Collectors and a Solar Pond: A Simulation Study in UAE. Desalination 2018, 443, 237–244. [Google Scholar] [CrossRef]
  3. Ali, E.S.; Alsaman, A.S.; Harby, K.; Askalany, A.A.; Diab, M.R.; Ebrahim Yakoot, S.M. Recycling Brine Water of Reverse Osmosis Desalination Employing Adsorption Desalination: A Theoretical Simulation. Desalination 2017, 408, 13–24. [Google Scholar] [CrossRef]
  4. Gude, V.G.; Nirmalakhandan, N.; Deng, S. Desalination Using Solar Energy: Towards Sustainability. Energy 2011, 36, 78–85. [Google Scholar] [CrossRef]
  5. Shemer, H.; Semiat, R. Sustainable RO Desalination—Energy Demand and Environmental Impact. Desalination 2017, 424, 10–16. [Google Scholar] [CrossRef]
  6. Paixão, D.F.S.; Quirino, P.P.S.; Fialho, R.L.; Americano Da Costa, M.V.; Pontes, K.V. A Dynamic Optimization Approach for a Multi-Effect Desalination (MED) Integrated with Thermosolar Storage System. Sol. Energy 2023, 262, 111837. [Google Scholar] [CrossRef]
  7. Garg, K.; Das, S.K.; Tyagi, H. Thermal Design of a Humidification-Dehumidification Desalination Cycle Consisting of Packed-Bed Humidifier and Finned-Tube Dehumidifier. Int. J. Heat Mass Transf. 2022, 183, 122153. [Google Scholar] [CrossRef]
  8. Al-Enezi, G.; Ettouney, H.; Fawzy, N. Low Temperature Humidification Dehumidification Desalination Process. Energy Convers. Manag. 2006, 47, 470–484. [Google Scholar] [CrossRef]
  9. Chong, T.H.; Loo, S.L.; Krantz, W.B. Energy-Efficient Reverse Osmosis Desalination Process. J. Memb. Sci. 2015, 473, 177–188. [Google Scholar] [CrossRef]
  10. Suzuki, T.; Tanaka, R.; Tahara, M.; Isamu, Y.; Niinae, M.; Lin, L.; Wang, J.; Luh, J.; Coronell, O. Relationship between Performance Deterioration of a Polyamide Reverse Osmosis Membrane Used in a Seawater Desalination Plant and Changes in Its Physicochemical Properties. Water Res. 2016, 100, 326–336. [Google Scholar] [CrossRef]
  11. Eder, E.; Preißinger, M. Experimental Analysis of the Humidification of Air in Bubble Columns for Thermal Water Treatment Systems. Exp. Therm. Fluid Sci. 2020, 115, 110063. [Google Scholar] [CrossRef] [PubMed]
  12. Alrbai, M.; Hayajneh, H.S.; Al-Dahidi, S.; Alahmer, A. Thermodynamics Analysis of a Lab Scale Humidification-Dehumidification Desalination System Employing Solar Energy and Fogging Approach. Sol. Energy 2022, 247, 397–407. [Google Scholar] [CrossRef]
  13. Shaikh, J.S.; Ismail, S. Theoretical Investigation on Humidification–Dehumidification Desalination Employing Flat-Plate Solar Water Collector. J. Therm. Anal. Calorim. 2023, 148, 11835–11853. [Google Scholar] [CrossRef]
  14. Tiwari, G.N.; Sahota, L. Advanced Solar-Distillation Systems: Basic Principles, Thermal Modeling, and Its Application; Springer: Berlin/Heidelberg, Germany, 2017; ISBN 9789811046711. [Google Scholar]
  15. Diaf, A.; Cherfa, A.; Karadaniz, L.; Tigrine, Z. A Technical-Economical Study of Solar Desalination. Desalination 2016, 377, 123–127. [Google Scholar] [CrossRef]
  16. Abu El-Maaty, A.E.; Awad, M.M.; Sultan, G.I.; Hamed, A.M. Solar Powered Fog Desalination System. Desalination 2019, 472, 114130. [Google Scholar] [CrossRef]
  17. Nwosu, E.C.; Nwaji, G.N.; Ononogbo, C.; Ofong, I.; Ogueke, N.V.; Anyanwu, E.E. Effects of Water Thickness and Glazing Slope on the Performance of a Double-Effect Solar Still. Sci. Afr. 2023, 21, e01777. [Google Scholar] [CrossRef]
  18. Nayagam, V.S.; Geetha, K.; Vallikannu, R.; Muthuvel, S.K.; Ram, G.C.; Gupta, P.; Sudhakar, M.; Mohanavel, V.; Sathyamurthy, R. Energy Efficient Tubular Solar Still for Augmented Yield Using Electrical Heater. Energy Rep. 2022, 8, 959–964. [Google Scholar] [CrossRef]
  19. Mohsenzadeh, M.; Aye, L.; Christopher, P. A Review on Various Designs for Performance Improvement of Passive Solar Stills for Remote Areas. Sol. Energy 2021, 228, 594–611. [Google Scholar] [CrossRef]
  20. Angappan, G.; Pandiaraj, S.; Panchal, H.; Kathiresan, T.; Ather, D.; Dutta, C.; Subramaniam, M.K.; Muthusamy, S.; Kabeel, A.E.; El-Shafay, A.S.; et al. An Extensive Review of Performance Enhancement Techniques for Pyramid Solar Still for Solar Thermal Applications. Desalination 2022, 532, 115692. [Google Scholar] [CrossRef]
  21. Okampo, E.J.; Nwulu, N. Optimisation of Renewable Energy Powered Reverse Osmosis Desalination Systems: A State-of-the-Art Review. Renew. Sustain. Energy Rev. 2021, 140, 110712. [Google Scholar] [CrossRef]
  22. Saravanan, A.; Parida, S.; Murugan, M.; Reddy, M.S.; Bora, P.; Sree, S.R. Performance Estimation of Tubular Solar Still with a Wicked Rotating Drum Using DT, LR, and KNN Techniques of Machine Learning. Neural Comput. Appl. 2022, 34, 14415–14425. [Google Scholar] [CrossRef]
  23. Shanmugan, S.; Djuansjah, J.; Ahmadein, M.; Alsaleh, N.A.; Parsa, S.M.; Elsheikh, A.H. Chemical Potential of Different Phases inside the Pyramid Stepped Basin Solar Still through Gibbs Free Energy. Case Stud. Therm. Eng. 2023, 49, 103277. [Google Scholar] [CrossRef]
  24. Kabeel, A.E.; Harby, K.; Abdelgaied, M.; Eisa, A. Augmentation of a Developed Tubular Solar Still Productivity Using Hybrid Storage Medium and CPC: An Experimental Approach. J. Energy Storage 2020, 28, 101203. [Google Scholar] [CrossRef]
  25. Sathyamurthy, R.; Kennady, H.J.; Nagarajan, P.K.; Ahsan, A. Factors Affecting the Performance of Triangular Pyramid Solar Still. Desalination 2014, 344, 383–390. [Google Scholar] [CrossRef]
  26. Abulkhair, H.; Sharshir, S.W.; Moustafa, E.B.; Alsaiari, A.; Moujdin, I.A.; Elsheikh, A.H. Thermal Performance Enhancement of a Modified Pyramid Distiller Using Different Modifications with Low-Cost Materials. Sustain. Energy Technol. Assess. 2023, 57, 103191. [Google Scholar] [CrossRef]
  27. Arani, R.P.; Sathyamurthy, R.; Chamkha, A.; Kabeel, A.E.; Deverajan, M.; Kamalakannan, K.; Balasubramanian, M.; Manokar, A.M.; Essa, F.; Saravanan, A. Effect of Fins and Silicon Dioxide Nanoparticle Black Paint on the Absorber Plate for Augmenting Yield from Tubular Solar Still. Environ. Sci. Pollut. Res. 2021, 28, 35102–35112. [Google Scholar] [CrossRef]
  28. Amiri, A.; Shanbedi, M.; Dashti, H. Thermophysical and Rheological Properties of Water-Based Graphene Quantum Dots Nanofluids. J. Taiwan Inst. Chem. Eng. 2017, 76, 132–140. [Google Scholar] [CrossRef]
  29. Nazari, S.; Najafzadeh, M.; Daghigh, R. Techno-Economic Estimation of a Non-Cover Box Solar Still with Thermoelectric and Antiseptic Nanofluid Using Machine Learning Models. Appl. Therm. Eng. 2022, 212, 118584. [Google Scholar] [CrossRef]
  30. Alsehli, M. Application of Graphene Nanoplatelet/Platinum Hybrid Nanofluid in a Novel Design of Solar Still for Improving Water Production and Energy Management. Sustain. Energy Technol. Assess. 2022, 53, 102607. [Google Scholar] [CrossRef]
  31. Gad, H.E.; El-Gayar, S.M.; Gad, H.E. Performance of a Solar Still with Clothes Moving Wick. 2014. Available online: https://ouci.dntb.gov.ua/en/works/45wO5x39/ (accessed on 30 October 2023).
  32. Younis, M.; Habchi, C.; Ahmad, M.N.; Ghali, K. Optimization of the Performance of a Solar Still Assisted by a Rotating Drum with a Rough Surface. Sol. Energy 2020, 211, 847–865. [Google Scholar] [CrossRef]
  33. Hou, J.; Yang, J.; Chang, Z.; Zheng, H.; Su, Y. The Mass Transfer Coefficient Assessment and Productivity Enhancement of a Vertical Tubular Solar Brackish Water Still. Appl. Therm. Eng. 2018, 128, 1446–1455. [Google Scholar] [CrossRef]
  34. Elashmawy, M. Experimental Study on Water Extraction from Atmospheric Air Using Tubular Solar Still. J. Clean. Prod. 2020, 249, 119322. [Google Scholar] [CrossRef]
  35. Ahmed, M.E.; Abdo, S.; Abdelrahman, M.A.; Gaheen, O.A. Finned-Encapsulated PCM Pyramid Solar Still—Experimental Study with Economic Analysis. J. Energy Storage 2023, 73, 108908. [Google Scholar] [CrossRef]
  36. Vigneswaran, V.S.; Kumaresan, G.; Dinakar, B.V.; Kamal, K.K.; Velraj, R. Augmenting the Productivity of Solar Still Using Multiple PCMs as Heat Energy Storage. J. Energy Storage 2019, 26, 101019. [Google Scholar] [CrossRef]
  37. Hussain, F.; Shaik, S.; Khan, S.A.; Van Huynh, V.; Jilte, R.D.; Sundara, V.; Asif, M.; Linul, E. Transient Solidification and Melting Numerical Simulation of Lauric Acid PCM Filled Stepped Solar Still Basin Used in Water Desalination Process. Case Stud. Therm. Eng. 2023, 49, 103370. [Google Scholar] [CrossRef]
  38. Afolabi, L.O.; Enweremadu, C.C.; Kareem, M.W.; Arogundade, A.I.; Irshad, K.; Islam, S.; Oladosu, K.O.; Elfaghi, A.M.; Didane, D.H. Experimental Investigation of Double Slope Solar Still Integrated with PCM Nanoadditives Microencapsulated Thermal Energy Storage. Desalination 2023, 553, 116477. [Google Scholar] [CrossRef]
  39. Yu, C.; Song, Y.S. Enhancing Energy Harvesting Efficiency of Form Stable Phase Change Materials by Decreasing Surface Roughness. J. Energy Storage 2023, 58, 106360. [Google Scholar] [CrossRef]
  40. Abdelgaied, M.; Zakaria, Y.; Kabeel, A.E.; Essa, F.A. Improving the Tubular Solar Still Performance Using Square and Circular Hollow Fins with Phase Change Materials. J. Energy Storage 2021, 38, 102564. [Google Scholar] [CrossRef]
  41. Jafar Gholi Beik, A.; Assari, M.R.; Basirat Tabrizi, H. Passive and Active Performance of a Multi-Side-Stepped Square Pyramid Solar Still; Experimental and Modeling. J. Energy Storage 2020, 32, 101832. [Google Scholar] [CrossRef]
  42. Essa, F.A.; Abdullah, A.S.; Omara, Z.M. Improving the Performance of Tubular Solar Still Using Rotating Drum—Experimental and Theoretical Investigation. Process Saf. Environ. Prot. 2021, 148, 579–589. [Google Scholar] [CrossRef]
  43. Saleh, B.; Essa, F.A.; Aly, A.; Alsehli, M.; Panchal, H.; Afzal, A.; Shanmugan, S. Investigating the Performance of Dish Solar Distiller with Phase Change Material Mixed with Al2O3 Nanoparticles under Different Water Depths. Environ. Sci. Pollut. Res. 2022, 29, 28115–28126. [Google Scholar] [CrossRef]
  44. Holman, J.P. Experimental Methods for Engineers, 8th ed.; Lange, M., Ed.; McGraw-Hill Companies: New York, NY, USA, 2011; ISBN 9780073529301. [Google Scholar]
  45. Mohammed, S.A.; Basem, A.; Omara, Z.M.; Alawee, W.H.; Dhahad, H.A.; Essa, F.A.; Abdullah, A.S.; Majdi, H.S.; Alshalal, I.; Isahak, W.N.R.W.; et al. Pyramidal Solar Stills via Hollow Cylindrical Perforated Fins, Inclined Rectangular Perforated Fins, and Nanocomposites: An Experimental Investigation. Sustainability 2022, 14, 14116. [Google Scholar] [CrossRef]
  46. Alsehli, M.; Essa, F.A.; Omara, Z.M.; Othman, M.M.; Elsheikh, A.H.; Alwetaishi, M.; Alghamdi, S.; Saleh, B. Improving the Performance of a Hybrid Solar Desalination System under Various Operating Conditions. Process Saf. Environ. Prot. 2022, 162, 706–720. [Google Scholar] [CrossRef]
  47. Prasanna, Y.S.; Deshmukh, S.S. Energy, Exergy and Economic Analysis of an Air Cavity Appended Passive Solar Still of Different Basin Material at Varying Depth. Energy Sustain. Dev. 2022, 71, 13–26. [Google Scholar] [CrossRef]
  48. Mohammed, R.H.; Radwan, A.; Rezk, A.; Olabi, A.G.; Sharma, V.; Kalam Hossain, A.; Alaswad, A.; Abdelkareem, M.A. Energy and Exergy Study of the Integrated Adsorption-Absorption System Driven by Transient Heat Sources for Cooling and Desalination. Energy Convers. Manag. 2023, 277, 116614. [Google Scholar] [CrossRef]
  49. Dwivedi, V.K.; Tiwari, G.N. Thermal Modeling and Carbon Credit Earned of a Double Slope Passive Solar Still. Desalin. Water Treat. 2010, 13, 400–410. [Google Scholar] [CrossRef]
  50. Yousef, M.S.; Hassan, H. Assessment of Different Passive Solar Stills via Exergoeconomic, Exergoenvironmental, and Exergoenviroeconomic Approaches: A Comparative Study. Sol. Energy 2019, 182, 316–331. [Google Scholar] [CrossRef]
  51. Sahota, L.; Shyam; Tiwari, G.N. Energy Matrices, Enviroeconomic and Exergoeconomic Analysis of Passive Double Slope Solar Still with Water Based Nanofluids. Desalination 2017, 409, 66–79. [Google Scholar] [CrossRef]
  52. Bait, O. Exergy, Environ–Economic and Economic Analyses of a Tubular Solar Water Heater Assisted Solar Still. J. Clean. Prod. 2019, 212, 630–646. [Google Scholar] [CrossRef]
Figure 1. Real photograph of the test rig for both conventional distiller (CSS) and multi-stage distiller (MSSS).
Processes 11 03337 g001
Figure 2. Three-dimensional scheme for the MSSS.
Processes 11 03337 g002
Figure 3. The environmental conditions for the tests conducted.
Processes 11 03337 g003
Figure 4. The water temperature of CSS and three stages of MSSS.
Processes 11 03337 g004
Figure 5. The glass temperature of CSS and three stages of MSSS.
Processes 11 03337 g005
Figure 6. Hourly productivity of CSS and three stages of MSSS and accumulated productivity of CSS and MSSS.
Processes 11 03337 g006
Figure 7. Water production and cumulative output of CSS and MSSS with PCM.
Processes 11 03337 g007
Table 1. The characteristics and specifics of the measuring devices.
Measuring ToolParameterResolutionErrorRange
PyranometerSolar radiation0.1 W/m2±1 W/m20–5000 W/m2
Temperature sensorTemperature0.1 °C±0.5 °C−55–150 °C
Capacitive humidity sensorAir relative humidity1% RH±2% RH0% to 100% RH
AnemometerAir velocity0.01 m/s±0.1 m/s0–30 m/s
Water flaskProductivity0.1 mL0.2 mL0–2500 mL
Table 2. The energy efficiency, production increase, and distillate of tested SSs.
NoCaseDaytime DistillateProductivity IncreaseEfficiency
1CSS2180 mL/m2Reference still31%
2MSSS1750 mL/m2 for CSS160%49.8%
4550 mL/m2 for MSSS
3MSSS + PCM2840 mL/m2 for CSS181%53%
7980 mL/m2 for MSSS + PCM
Table 3. Embodied energies of individual components.
ComponentMade fromEnergy Density,
kW·h/kg
Embodied Energy,
Ein (kW·h)
CoatingBlack paint253.2
BasinGlass13.8140
TapesBrass17.224.1
CoverGlass4.1640
Total187.3
Table 4. Environmental and enviroeconomic parameters.
MSSS with PCMEmbodied Energy = EinEout YearlyEout for Lifetime Enviroeconomic   Parameter ,   Z Environmental   Parameter ,   ϕ C O 2
187.3 (kW·h)220 (kW·h)4400 (kW·h)17412
Table 5. Inputs for financial analysis proposed.
No.ParameterDescriptionAmount
1. n Lifetime of device20 years
2. i Interest rate18%
3. N Annual working days340 days
4. F Total fixed expenses120$ for CSS
170$ for MSSS
180$ for MSSS with PCM
5. M Annual productivity18,000 L/m2·year for CSS
46,850 L/m2·year for MSSS
51,600 L/m2·year for MSSS with PCM
Table 6. Statistical relationships for financial analyses [52].
No.RelationDescription
1. C R F = i   ( 1 + i ) n ( 1 + i ) n 1 Capital recovery factor
2. F A C = F   ( C R F ) Annual fixed costs
3. S F F = i   ( 1 + i ) n 1 Sinking fund factor
4. S = 0.2   F Salvage value
5. A S V = S ( S F F ) Annual salvage value
6. A M C = 0.15 ( F A C ) Annual maintenance costs
7. T A C = F A C + A M C A S V Annual total cost
8. C P L = T A C / M Price of distillate
Disclaimer/Publisher’s Note: The statements, opinions and data contained in all publications are solely those of the individual author(s) and contributor(s) and not of MDPI and/or the editor(s). MDPI and/or the editor(s) disclaim responsibility for any injury to people or property resulting from any ideas, methods, instructions or products referred to in the content.

