

Integrated Semi-Continuous Manufacturing of Lentiviral Vectors Using a HEK-293 Producer Cell Line


Viral Vectors and Vaccines Bioprocessing Group, Department of Bioengineering, McGill University, Montreal, QC H3A 0G4, Canada
*
Author to whom correspondence should be addressed.
Processes 2023, 11(12), 3347; https://doi.org/10.3390/pr11123347
Submission received: 12 October 2023
/
Revised: 20 November 2023
/
Accepted: 28 November 2023
/
Published: 1 December 2023
(This article belongs to the Special Issue Advances in Bioprocess Technology)
Abstract
:There have been considerable efforts on improving the lentiviral vector (LV) system and their production. However, there remains the persisting challenge of producing a sufficient quantity of LVs at manufacturing scale to support treatments beyond early clinical trials. Furthermore, their innately labile nature poses an equally important obstacle in LV production. As LVs lose function over time and they are sensitive to environmental factors in each unit operation in the bioprocess workflow, integrated continuous manufacturing is an attractive strategy for process intensification. This manuscript describes the implementation of nuclease treatment, clarification, and capture step in a semi-continuous mode. Combining the clarification and loading of the capture step as well as operating those steps in parallel to the purification of the capture step expedite the processing time, reducing it by 4-fold as compared to processing the same volume in batch mode using the same membrane size. This semi-continuous operation also improves the recoveries of functional vector particles and total vector particles by 26% and 18%, respectively, showing an added benefit in loading the capture membranes in series in continuous flow chromatography. Building on previously published upstream work using a scalable cell retention device in perfusion mode, this manuscript demonstrates the integration of upstream and downstream in a semi-continuous manner, reducing processing and hold times as well as showing improvements in LV product quality and recovery.
1. Introduction
Lentiviral vectors (LVs) have become a prevailing gene delivery tool in cell and gene therapy in the past three decades [1,2,3,4]. LVs are primarily used for ex vivo modifications, such as transduction of T-cells for expression of chimeric antigen receptor in CAR-T cell therapies, and they are gaining popularity in in vivo applications. With 6 approved ex vivo LV products and a rapidly growing number of LV clinical trials, there is an increased urgency in addressing the persisting challenge of producing LVs at manufacturing scale to support treatments beyond early clinical trials [5,6,7,8,9,10,11]. In addition to the challenge of generating a sufficient quantity of LVs, their innately labile nature poses an equally important obstacle in LV production. As LVs lose function over time and they are sensitive to environmental factors in each unit operation in the bioprocess workflow [11,12,13], integrated continuous manufacturing is an attractive strategy for process intensification [14,15,16].
Continuous bioprocessing has the potential to address the current challenges of biomanufacturing technology, such as reducing cost, increasing flexibility and standardization, accelerating development and scaling times, and improving product quality. There have been many discussions about the impact of continuous bioprocessing [17,18] and an integrated process [19,20] that connects the upstream and downstream, especially for unstable products. The shift from batch to continuous bioprocessing for biopharmaceuticals has been realized in antibody production, and an end-to-end integrated continuous process has been reported [21].
In the space of viral vectors, mentions of continuous manufacturing have typically referred to the continuous nature of the perfusion cell culture for the upstream process [15]. Usually, the perfusion harvest is pooled and frozen every 24 h, and the collected material is then processed downstream as a series of batches, where unit operations are performed and completed before the process stream moves to the next step. For the downstream process, there are two recent publications of continuous purification of adeno-associated virus [22] and hepatitis C virus-like particles [23] using multiple-column counter-current chromatography, utilizing upstream material produced in the batch format. Although there has been some development work in continuous manufacturing in either upstream or downstream, an integrated continuous bioprocess has yet to be reported.
Implementing the upstream process in perfusion mode increases productivity and continuously harvesting LVs from the bioreactor reduces the residence time, thus preserving their quality attributes. Executing this at manufacturing scale has been a challenge due to limitations of currently commercialized cell retention devices. To circumvent this, a scalable technology that can be used as a cell retention device that does not retain the product in perfusion mode for LV production using a stable producer cell line was demonstrated [24], which serves as the first piece of an integrated continuous manufacturing process of LVs.
Building on that upstream work, this manuscript demonstrates (1) the implementation of a downstream process in semi-continuous mode and (2) the integration between the perfusion culture from upstream to the capture step from downstream. The Mustang Q membrane, which has been reported to work well for purifying LVs [25,26], is chosen for the capture step for its attributes that are advantageous at manufacturing scale: high binding capacity, ability to handle high volumetric flow rates, and scalability. The goal for the work in this manuscript is to investigate the effects of reduced processing time from a semi-continuous downstream process and reduced process hold times from the integration between the production and capture of LVs on recovery and quality. The term “semi-continuous” is used in place of “continuous” due to the fact that the Mustang Q membranes are manually moved in the downstream setup.
To characterize the LV product quality, functional vector particles and total vector particles are analyzed to convey the potency aspect, and DNA and protein contents are analyzed to convey the purity aspect. The functional vector particles are reported as transducing units, assessed by a cell-based assay that measures the GFP-transgene expression in transduced target cells. The total vector particles are reported as vector genome units, assessed by a droplet digital PCR assay. Furthermore, the product quality of LVs produced by the integrated semi-continuous process is supported by an in vitro validation using confocal microscopy.
2. Materials and Methods
2.1. LV Starting Materials
The LV harvest materials used for the downstream work in this manuscript are previously described in detail [24]. In brief, LVs containing GFP as the transgene and VSV-G at the membrane surface were produced in batch (1 L bioreactor) and perfusion (3 L bioreactor) modes using a stable producer cell line HEK293SF-LVP-CMVGFPq-92 [27] by inducing with doxycycline and cumate. Both inducers are required for LV production in this double switch system to ensure tighter transcription regulation, as previously described [28]. In batch mode, the producer cells were harvested at 3 days post induction for both runs. In perfusion mode, the Tangential Flow Depth Filtration cartridge with 30 cm2 surface area was used as the cell retention device. The producer cells were continuously harvested at around 1 VVD (vessel volume per day) over 6 days for run 1 and at 2 VVD over 4 days for run 2.
2.2. Development of the Capture Step
Mustang Q XT Acrodisc Units (Pall Life Sciences, Ann Arbor, MI, USA) with a membrane volume of 0.86 mL were used for the capture step and an AKTA Avant (GE Healthcare, Uppsala, Sweden) was used for chromatography purification. Three buffers were used: equilibration (EQ) contains 10 mM Histidine and 0.15 M Sodium Chloride (NaCl), elution A contains 20 mM Tris-HCl with 3% sucrose, and elution B contains 20 mM Tris-HCl and 1.6 M NaCl with 3% sucrose, all at pH 7.5.
The purification steps are as follows: equilibration for 25 membrane volumes (MV) with EQ buffer, LV load (variable, between 100 and 600 MV), wash for 60 MV with EQ buffer, elution 1 for 12 MV using 25% elution buffer B for 0.4 M NaCl, elution 2 for 12 MV using 75% elution buffer B for 1.2 M NaCl, and strip for 25 MV using 100% elution buffer B. Elution 2 fraction was immediately diluted with EQ buffer to achieve a lower salt concentration of 0.4 M NaCl. In this work, the combined elution fractions represent the Mustang Q elution.
The loading flowrate (2.5 vs. 7 MV/min) and general flowrate (2.5 vs. 10 MV/min) were tested in establishing Mustang Q run conditions. For the rest of the downstream work, the flowrates used were 7 MV/min for loading and 10 MV/min for the rest of the purification steps. The conversions from MV/min to mL/min are as follows: 2.5 MV/min = 2.15 mL/min, 7 MV/min = 6.02 mL/min, and 10 MV/min = 8.60 mL/min. This work reports in the units of MV and MV/min.
2.3. Downstream Steps in Batch Mode
After thaw, the LV materials from the perfusion bioreactor runs were processed by nuclease treatment using 50 U/mL Benzonase (MilliPore Sigma, Darmstadt, Germany) and 2 mM MgCl2 at 24 °C with 135 RPM shaking speed for 30 min, followed by clarification through a 0.45 µm syringe filter (MilliPore Sigma), and then purification on the AKTA for the Mustang Q capture step.
The LV materials from the batch bioreactor runs were previously treated with 20 U/mL Benzonase and 2 mM MgCl2 at 27 °C for 60 min with 110 RPM mixing before harvesting by centrifuging at 2000× g for 15 min. Therefore, after thaw, these materials were clarified using a 0.45 µm syringe filter and then purified on the AKTA.
2.4. Downstream Steps in Semi-Continuous Mode
Two systems were used in the semi-continuous downstream setup. In system 1, nuclease-treated material was pumped through a MD0HC23CL3 depth filter (Millipore Sigma) before being directly loaded onto two Mustang Q membranes, MA + MB, connected in series. Once MA was loaded to the targeted 86 mL, it was removed from system 1 and transferred to system 2 (the AKTA), and MC was then connected in series after MB. While the clarification and loading processes continued in system 1 for MB + MC, MA was subjected to wash, elution, and regeneration steps (i.e., strip, then EQ) in system 2. Then, MB was transferred to system 2 for purification and MA was re-transferred to system 1 behind MC. These steps were repeated until all three membranes went through two cycles each, totaling 516 mL of LV starting material.
Before commencing the semi-continuous operation, the depth filter was first flushed with milli-Q water and then with EQ buffer using the peristaltic pump in system 1, and the three Mustang Q membranes were equilibrated with EQ buffer using the AKTA in system 2.
2.5. Gene Transfer Assay for Functional LV Quantification
A flow cytometry-based gene transfer assay was used to determine functional vector titer in transducing units per milliliter (TU/mL), as previously described in detail [24]. Downstream samples were filtered using a 0.45 µm filter and 1% Penicillin-Streptomycin was added to their respective wells to avoid contamination. Accepted GFP values range between 2 and 20% fluorescent cells to avoid signal due to super transduction.
2.6. Droplet Digital Polymerase Chain Reaction Assay for Total LV Quantification
A QX200TM Droplet Digital PCR (ddPCR) system was used to determine total vector titer in vector genome units per milliliter (Vg/mL), as previously described in detail [24].
2.7. Picogreen Assay for DNA Quantification
The Quant-iT PicoGreen dsDNA Assay kit (Invitrogen, Eugene, OR, USA) was used to quantify DNA in LV samples, as previously described in detail [24].
2.8. RC DC Assay for Protein Quantification
The RC DC Protein Assay Kit (Bio-Rad, Hercules, CA, USA) was used to quantify protein content in LV samples, following the manufacturer’s protocol.
2.9. Confocal Microscopy
HEK293SF cells were plated onto 35 mm coverglass bottom dishes (MatTek, Ashland, Wilmington, DE, USA) and 24 h later were either transduced with LVs manufactured by the integrated semi-continuous process, LV supernatant produced in a shake flask, or non-induced producer cell supernatant serving as the negative control at MOI of 1. Just prior to imaging, the cells were stained with Deep Red CellMask plasma membrane stain (Invitrogen, Eugene, OR, USA). Dishes were placed onto the stage of a IX83-DSU Olympus microscope and maintained at 37 °C and 5% CO2 in a stage-top incubator. The labelling of the cell membrane was performed as per the manufacturer’s instructions. All images were acquired at 100× (oil immersion) UPLANO objectives with 1000-ms exposure uniformly for all image acquisition using the Metamorph Advanced 14 Olympus software. The acquired images were post-processed using ImageJ FIJI v1.53. The built-in fluorescence intensity per unit area plugins were used for all of the analysis.
3. Results
3.1. Establishing Mustang Q as the Capture Step
To establish run conditions, first, the loading flowrate (2.5 vs. 7 MV/min), the general flowrate (2.5 vs. 10 MV/min), and a quick verification of the load amount (100 vs. 600 MV, membrane volume) were tested in four purification runs (Figure 1) using LVs harvested from 72 to 96 hpi (hours post induction) from a perfusion run (referred to as P1 72–96 hpi LV). The amount of functional vectors, total vectors, DNA, and protein in the load material for the membrane, which had been nuclease treated and filtered, was defined as 100% and the amounts in the subsequent purification steps were calculated as percent recoveries.
Figure 1A,B show that there is no loss of functional vectors (represented by transducing units, TU) and total vectors (represented by vector genome units, Vg) in the flowthrough (FT) and wash steps for the three purification runs with 100 MV load (M1, M2, and M3). There is a loss of both TU and Vg in the FT, and a loss of Vg in the wash, for the purification run with 600 MV load (M4), suggesting an over-loaded membrane. The highest TU and Vg recoveries in the elution are 68% and 79%, respectively, for M3.
Overall, Mustang Q is effective at clearing DNA and protein, as shown by high percentages in the FT of all four runs (Figure 1C,D). The protein clearance for M4 is significantly higher than the other three runs, most likely due to loss in the FT. Between the three runs with 100 MV load, results show highest DNA clearance in M1 (86%), with a close second highest in M3 (84%), and highest protein clearance in M3 (63%). Ultimately, the loading and general flowrates for M3 were selected. Overlaid chromatograms for purification runs M1–M4 are shown in Figure S1.
Next, 100 MV, 200 MV, and 300 MV loads were tested to fine-tune the load amount, using a different pool of LVs, harvested 0 to 72 hpi from the perfusion run (referred to as P1 0–72 hpi LV). Aside from the difference in harvesting time, P1 0–72 hpi LV material was held at 4 °C for 5 days post thaw before downstream processing whereas P1 72–96 hpi LV material was processed upon thaw. No TU was detected in the flowthrough and wash fractions of these runs.
Figure 2 shows TU recoveries for the Mustang Q step (from load to elution) and cumulatively (from thawed LV harvest to Mustang Q elution). For P1 0–72 hpi LV material, results show highest step and cumulative recoveries (58% and 43%, respectively) for 100 MV as compared to 200 and 300 MV. Similar cumulative recoveries are observed for both 100 MV runs (43% for P1 0–72 hpi LV vs. 44% for P1 72–96 hpi LV), although the step recovery is higher for P1 72–96 hpi LV (68%) as compared to P1 0–72 hpi LV (58%). The difference in step recoveries can be explained by the 5-day hold time, although the cumulative recovery was not affected similarly. Given the highest step and cumulative recoveries of functional vectors were observed in both experiments, 100 MV load was selected.
3.2. Semi-Continuous Downstream Process
Two systems operate concurrently in the semi-continuous downstream setup (Figure 3). In system 1, nuclease-treated LV material is pumped through a depth filter before directly loading onto two Mustang Q membranes connected in series. While the clarification and loading processes occur in system 1, a third fully loaded membrane is subjected to wash, elution, and regeneration steps in system 2, the AKTA. The run time per cycle is similar on both systems (steps 2 through 6 in Figure 3), with 14 m 20 s for loading 100 MV at a flowrate of 7 MV/min in system 1 and 13 m 24 s for the rest of the purification steps at a flowrate of 10 MV/min in system 2. There is a time difference in step 1 due to filling the dead volume of the flow path in system 1, and in step 7 when the last membrane is purified in system 2 (Figure 3). Overlaid chromatograms for the six cycles of the semi-continuous downstream run are shown in Figures S2 and S3; overlaid chromatograms for another semi-continuous downstream run are shown in Figure S4.
In this semi-continuous set up, the time for loading and eluting six Mustang Q membranes to process 516 mL of LV harvest is ~1.75 h. Including the 30 min of nuclease treatment brings the total to ~2.25 h. In contrast, processing the same amount in batch mode using the same membrane size, where each cycle is nuclease treated (30 min), clarified (30 min), and loaded and purified on the AKTA (28 min), takes ~8.75 h cumulatively. Therefore, implementing these downstream steps in a semi-continuous mode expedites the process by almost 4-fold.
Figure 4A compares the recoveries of functional vectors, total vectors, DNA content, and protein content between semi-continuous and batch modes using LVs harvested from 0 to 72 hpi from the perfusion run (P1 0–72 hpi LV). Overall, results show advantages in implementing the downstream in semi-continuous mode. The semi-continuous operation improves the recoveries of functional vector particles by 26% (69% vs. 43%) and total vector particles by 18% (91% vs. 73%). The DNA clearance is similar in both modes, with 15% recovered in the Mustang Q elution for semi-continuous mode and 16% for batch mode. The protein clearance is higher for semi-continuous mode, with 25% recovered in Mustang Q elution for semi-continuous mode and 31% for batch mode. Figure 4C shows that the Vg/Tu ratio is lower for the downstream process in semi-continuous mode (75) as compared to batch mode (119), indicating higher LV potency.
3.3. Integrated Semi-Continuous Process
To evaluate the effect of the process hold time for LV harvest before the capture step, LVs harvested from 48 to 72 hpi from another perfusion run (referred to as P2 48–72 hpi LV) were used for the downstream process in batch mode (Figure 4B). Upon thaw, the LV material was held at 4 °C for 1 day or 6 days before nuclease treatment, clarification, and purification over the Mustang Q capture step. A shorter process hold time shows a higher functional vector recovery (42% for 1-day hold vs. 33% for 6-day hold) and a higher total vector recovery (69% vs. 59%, respectively). The DNA clearance was similar in both purification runs, with 12% recovered in the elution for the 1-day hold and 11% for the 6-day hold. The protein clearance is higher for the 1-day hold, with 24% recovered in the elution for the 1-day hold and 29% for the 6-day hold. Figure 4C shows that the Vg/TU ratio is lower for the batch mode with 1-day hold (168) as compared to the batch mode with 6-day hold (360), indicating higher LV potency.
3.4. In Vitro Validation of LVs Produced by the Integrated Semi-Continuous Process
Confocal microscopy was used to monitor LV transduction effectiveness in HEK293SF cells. Three samples were tested: LVs manufactured by the integrated semi-continuous process (ISC LV for short), in which LVs were produced in a perfusion bioreactor and processed downstream in semi-continuous mode; LV supernatant from a shake flask production; and supernatant from non-induced producer cells serving as the negative control.
Several rounds of live cell imaging HEK293SF cells transduced with both LV samples from 0 to 36 h post transduction at 100× magnification reveal the earliest timepoint of GFP expression around 10 h and peak saturation around 20 h. In addition, images containing cells transduced with LV supernatant have a distinct background signal, which is not observed in images of cells transduced with ISC LV.
GFP expression is observed in cells transduced with ISC LV (Figure 5A) and LV supernatant (Figure 5B), with a sharper contrast for the former. The GFP signal intensity is comparable for both samples (Figure S5), which makes sense given the same multiplicity of infection was used. However, the error bar for the ISC LV is much tighter, which corroborates the sharper contrast observed in the microscopy images, implying the purification achieved in the capture step. Figure 5C shows that there is no GFP expression observed in the negative control and Figure S5 confirms no GFP signal.
3.5. A Case Study: Comparing Projected Processing Times and Functional Yields
To investigate the significance of a semi-continuous process, a comparison of projected processing times (Figure 6) and a comparison of projected recovered functional yields (Figure 7) were generated. The cases include batch upstream and batch downstream (Case I), perfusion upstream and batch downstream (Case II), and perfusion upstream and semi-continuous downstream (Case III).
To facilitate a direct comparison between the perfusion and batch bioreactor runs, the harvesting scheme for the perfusion bioreactor was normalized to 3 dpi (days post induction) and the functional yield (represented by total transducing units, TU) for the batch bioreactor was normalized to 2 L working volume. Using upstream data from the previously published work [24], it is calculated that 2.13 × 10¹¹ TU is achieved for the perfusion bioreactor and 1.62 × 10¹⁰ TU is achieved for the batch bioreactor. Assuming that the batch operation is reproducible with the same level of production, it would need to repeat 13 times in order to produce the same amount of functional vectors as in perfusion mode. In terms of harvest volume for the perfusion bioreactor, a 2 L working volume at an exchange rate of 1 vessel volume per day, harvested for 3 days, including a 20% increase of the working volume in a final harvest step, brings the total to 8.4 L. The processing times for the downstream in batch mode and semi-continuous mode are calculated using the experimental data from Section 3.2.
In Case I with batch upstream and batch downstream (Figure 6A), the producer cells were grown for 2 days, induced for LV production, and harvested at 3 dpi. Then, the downstream processing which includes nuclease treatment, clarification, and purification over the capture step for 2 L harvest takes ~1.5 days. Thus, the total time for one operation from inoculation of the batch bioreactor to purification over the capture step is 6.5 days. Using the assumption made above, where the batch upstream process is repeated 13 times, brings the projected processing time to 84.5 days.
In Case II with perfusion upstream and batch downstream (Figure 6B), the producer cells were grown for 9 days to reach high cell density, induced for LV production, and harvested continuously for 3 dpi, including a final harvest step. The downstream processing for 8.4 L takes ~6.25 days, which brings the projected processing time to 18.25 days.
In Case III with perfusion upstream and semi-continuous downstream (Figure 6C), the upstream process is the same as in Case II. Here, the downstream can initiate shortly after the producer cells are induced for LV production. Scenario 1 presents a timeline for LVs processed every 12 h of harvesting (denoted as DSP S1, Figure 6) and scenario 2 presents a processing timeline for every 24 h (denoted as DSP S2), and both scenarios bring the projected processing time to less than 13 days.
To speculate the recovered functional yields for each of the three cases, the percent recovery of TU achieved in previous downstream experiments was used. For Case I, using 48% TU recovery for batch upstream material processed downstream in batch mode (Figure S6) results in 1.01 × 10¹¹ TU. For Case II, using 43% for perfusion upstream and batch downstream (Figure 4A) results in 9.16 × 10¹⁰ TU. For Case III, using 69% for perfusion upstream and semi-continuous downstream (Figure 4A) results in 1.47 × 10¹¹ TU.
Figure 7 shows the projected processing times and recovered functional yields to highlight the advantages of a semi-continuous process. Comparing Cases II and III, implementing only the downstream in a semi-continuous mode increases the functional yield by 1.6-fold while reducing 5.5 days in the manufacturing plant. Comparing Cases I and III, implementing an integrated semi-continuous process increases the functional yield by 1.5-fold while reducing 71.75 days in the manufacturing plant.
4. Discussion
With an increasing number of successful clinical trials utilizing LVs for cell and gene therapy treatments for various conditions, an integrated manufacturing process that connects the upstream to the downstream has become more frequently discussed in the field. Integrated continuous manufacturing is a powerful strategy that has the potential to address the persisting challenges of producing a sufficient amount of LVs at manufacturing scale to support treatments for patients as well as addressing the innately labile nature of LVs. In attempting to establish an integrated continuous process for LV production that has the capability to be implemented at manufacturing scale, the work was broken into two parts. First, a scalable technology that can be used as a cell retention device that does not retain the product in perfusion mode for LV production using a stable producer cell line was demonstrated in a recently published work [24]. Second, implementing the downstream process in a semi-continuous mode using a scalable capture step and then demonstrating the integration of the upstream and downstream, as discussed in this manuscript. The term “semi-continuous” is used in place of “continuous” due to the fact that the Mustang Q membranes are manually moved between the two systems in the downstream setup.
In the development of the Mustang Q capture step (Figure 1), results show high step recoveries of functional vectors (represented by transducing units, TU) and total vectors (represented by vector genome units, Vg) at the higher tested loading (7 MV/min) and general (10 MV/min) flowrates. Results also show high DNA and protein clearance in the flowthrough, confirming that Mustang Q is an efficient capture step for LVs. Operating at high flowrates expedites the processing time, which poses as an asset at manufacturing scale, and doing so without compromising on product integrity is advantageous when purifying an unstable product. Further optimizing the Mustang Q capture step can potentially improve product recovery and quality.
The load amount of 100 MV was selected due to high step and cumulative recoveries of TU (Figure 2) shown in two experiments that used different pools of harvested LVs. Fortuitously, the load time for 100 MV on the Mustang Q membrane lines up well with the time for the purification steps on the AKTA, allowing the two systems to run in parallel (Figure 3). Combining the clarification and loading of the capture step as well as operating those steps in parallel to the purification of the capture step expedited the processing time, reducing it by 4-fold as compared to processing the same volume in batch mode using the same membrane size, where each unit operation is completed before moving onto the next step. This highlights the advantage of operating in semi-continuous mode, since it is not possible to have loading and elution occur simultaneously in batch mode. This demonstration at lab scale has potential to be applied to large scale, especially in the case where a membrane size cannot accommodate the processing volume in one run. For example, semi-continuous mode is an attractive solution for processing 500 L harvest daily from a bioreactor in perfusion mode using six 780 mL Mustang Q, whereas the next size up, a 5 L Mustang Q, is oversized.
In addition to the time saved from running the downstream process in semi-continuous mode, improvement in product recovery is observed, with a 26% increase in the recovery of functional vectors and 18% increase in the recovery of total vectors (Figure 4A), and a lower Vg/TU ratio indicating higher potency (Figure 4C). These results show higher LV product quality for the semi-continuous process and suggest an added benefit in loading the membranes in series. The improvements can be attributed to the efficiency of continuous flow chromatography. While the membranes were each loaded to 100 MV, given two membranes are connected in series during the loading step in the semi-continuous setup, the material that did not bind to the first membrane may have bound to the second membrane, thus pushing the capacity of the membrane a bit further.
In fact, overlaid chromatograms of the six cycles in the semi-continuous downstream run support this hypothesis, where the A280 signal for cycles 2–6 is higher than cycle 1 (Figure S3). Given that cycle 1 occurred first, the membrane was loaded to 100 MV with no spillover, whereas cycles 2–6 had some spillover from the loading of the previous membrane. In contrast, in a different semi-continuous downstream run where the holdup volume of system 1 of the semi-continuous setup was not accounted for, thereby loading less than 100 MV in cycle 1, and the leftover LV material was loaded in cycle 7, the overlaid chromatograms show lower A280 signal for cycles 1 and 7 as compared to cycles 2–6 (Figure S4). Given the ineffective loading of this semi-continuous downstream run, the recovered TU and Vg were lower (30% and 63%, respectively) than the correctly implemented semi-continuous downstream run (69% TU and 91% Vg recovered).
There is a possibility of further improving the product quality by optimizing the nuclease treatment and clarification steps. For example, temperature and duration can be optimized for the nuclease treatment, and the depth filtration step might be further assessed for improved performance.
An additional characterization of the ISC LV (i.e., LVs manufactured by the integrated semi-continuous process) was implemented to visually assess product quality. The functionality of LVs is defined as their ability to transduce host cells to effectively deliver genetic material to be integrated in the host cell genome. Given that the transgene of the LVs in this work is GFP, it is possible to qualitatively assess the functionality in terms of GFP expression using confocal microscopy (Figure 5). These results allow for a visual assessment of the product quality in this experiment, and they indicate the potential of leveraging imaging techniques as additional analytical tools for assessing the quality of LVs, such as a validation assay to assess transduction effectiveness for LVs used in ex vivo applications.
In investigating the effect of process hold times, results show that perfusion LV harvest held at 4 °C for 6 days versus 1 day post thaw decreases the TU recovery by 9% and the Vg recovery by 10% (Figure 4B) and increases the Vg/TU ratio indicating lower potency (Figure 4C). These results are in line with what has been shown in the literature, where LVs lose function over time, and they support the implication that reducing process hold times can help in maintaining a higher number of the produced functional vectors. These results highlight the relevance of integrating a continuous upstream process (i.e., perfusion) that increases LV productivity and a semi-continuous downstream process that preserves LV quality attributes by reducing both the processing time and processing hold times.
The presented case study demonstrates the feasibility and practicality of an integrated semi-continuous process for LV production and capture using upstream data from a previous publication [24] and downstream data from this manuscript to generate projected processing times (Figure 6) and recovered functional yields (Figure 7). The assumption of repeating the batch bioreactor to produce the same amount of functional vectors as in one perfusion bioreactor is used for comparison with precaution. The projected processing time for the batch upstream and batch downstream process (Case I) is an underestimation, since it does not take into account the necessary time for cleaning and set up between batch operations. In addition, the need to operate multiple batch bioreactors increases the risk of contamination.
The case study shows reduced processing time and improved product recovery for both the semi-continuous downstream process (Case II) and the integrated semi-continuous manufacturing (Case III). The integrated semi-continuous process results in the shortest processing time for the highest amount of recovered functional vectors, which has great implications on reducing cost and increasing productivity of the manufacturing plant. Depending on the layout of the manufacturing plant, LVs harvested from the perfusion bioreactor can be processed downstream every 12 h or 24 h, which gives flexibility in operation.
The downstream processing times in batch mode and semi-continuous mode from the lab scale experiment with 0.86 mL Mustang Q membrane was applied to the calculations in the case study. The caveat in this simulation is that a larger membrane would be more appropriately sized to process larger harvest volumes. Given that the exact time calculations for a larger membrane cannot be simulated, the case study used the processing times from the lab scale demonstration. Future experiments using larger membranes in semi-continuous mode would be helpful in validating the effect of time savings and product quality at large scale. However, employing a larger membrane for both batch and semi-continuous mode would still result in the same time savings advantage by combining the clarification and loading of the capture step as well as operating those steps in parallel to the purification of the capture step.
The two highly discussed drivers behind the current interest in continuous bioprocessing are cost and improvements in product quality. In terms of cost, an article discussing the LV bioprocess economics for cell and gene therapy reported high treatment costs for gene-modifying cell therapy products that use LVs as the gene delivery method: USD 473k for Kymriah approved in 2017 to treat acute lymphoblastic leukemia and USD 1.8M projected for Zynteglo approved in 2022 to treat beta-thalassemia [9]. There is an increased interest in reducing the price, especially in the effort to make life-saving therapies available to patients in developing countries. In terms of product quality, continuous processing has the potential to provide improvements through enhanced control of the manufacturing process.
In the context of LVs, the main motivation for an integrated continuous process is the instability of LVs. While increasing the total vector yield through process intensification in the upstream process contributes to the scalability and mass production of LVs, improving the functional yield in the downstream process will improve the transducibility ratio, which means less LVs are needed for an effective treatment. Together, increasing vector yield and improving functional yield will lead to higher quantity and quality of viral vectors, contributing to improved process performance and robustness. Overall, these improvements will lead to lower drug prices for consumers and allow manufacturers to respond much quicker to changes in demand, contributing to the prevention of drug shortages.
Until limitations such as hardware and software integration are addressed, the direct link between the bioreactor and the capture step cannot be made. However, this investigation of a proof-of-concept for the workflow in a semi-continuous manner shows that implementing such strategy would be successful in maintaining the functionality of LVs produced. Ultimately, the work shows that there is an advantage to implementing an integrated semi-continuous manufacturing process for LV production to support late-stage clinical trials and treatments.
5. Conclusions
In summary, an integrated semi-continuous process that has the capability to be implemented at manufacturing scale was demonstrated to address two notable challenges of LV production: generating a sufficient quantity for treatments and increasing the vector quality. In combining the perfusion cell culture in the upstream process, which generates a considerably higher amount of LVs and reduces their residence time in the bioreactor, with an expedited semi-continuous downstream process that offers high recovery of the LV product, the integrated semi-continuous process mitigates LV instability and improves product quality by slowing down the loss of functionality of LVs through reduced processing times and process hold times. The semi-continuous manufacturing process enhances the overall process efficiency, leading to increased productivity, reduced processing time, and reduced process hold times, which are all particularly advantageous for LVs given its notorious instability.
Supplementary Materials
The supporting information can be downloaded at: https://www.mdpi.com/article/10.3390/pr11123347/s1.
Author Contributions
Conceptualization, M.Y.T. and A.A.K.; methodology, M.Y.T.; execution, M.Y.T., S.D., and Z.Y.; writing—original draft, M.Y.T.; writing—review and editing, M.Y.T. and A.A.K.; funding acquisition and resources, A.A.K. All authors have read and agreed to the published version of the manuscript.
Funding
M.Y.T. is financially supported by a fellowship from the Faculty of Engineering at McGill University and a doctoral scholarship from Fonds de recherche—Nature et technologies Québec (FRQNT); A.A.K. is partially funded through Canada Research Chair CRC-2021-00032.
Data Availability Statement
Data are contained within the article and Supplementary Materials.
Acknowledgments
We would like to thank Ayyappasamy Sudalaiyadum Perumal and Dan Nicolau for providing access to microscopy equipment and support. A portion of this work has been captured in the form of an abstract (Tran and Kamen, 2023) published online for the Cell Culture Engineering XVIII Conference, held in Cancun, Mexico on 23–28 April 2023.
Conflicts of Interest
The authors declare no commercial or financial conflict of interest.
References
- Escors, D.; Breckpot, K.; Arce, F.; Kochan, G.; Stephenson, H. Lentiviral Vectors and Gene Therapy; Springer: Berlin/Heidelberg, Germany, 2012. [Google Scholar] [CrossRef]
- Naldini, L.; Trono, D.; Verma, I.M. Lentiviral Vectors, Two Decades Later. Science 2016, 353, 1101–1102. [Google Scholar] [CrossRef]
- Milone, M.C.; O’Doherty, U. Clinical Use of Lentiviral Vectors. Leukemia 2018, 32, 1529–1541. [Google Scholar] [CrossRef]
- Arabi, F.; Mansouri, V.; Ahmadbeigi, N. Gene therapy clinical trials, where do we go? An overview. Biomed. Pharmacother. 2022, 153, 113324. [Google Scholar] [CrossRef]
- Martínez-Molina, E.; Chocarro-Wrona, C.; Martínez-Moreno, D.; Marchal, J.A.; Boulaiz, H. Large-Scale Production of Lentiviral Vectors: Current Perspectives and Challenges. Pharmaceutics 2020, 12, 1051. [Google Scholar] [CrossRef]
- Schweizer, M.; Merten, O.W. Large-Scale Production Means for the Manufacturing of Lentiviral Vectors. Curr. Gene Ther. 2010, 10, 474–486. [Google Scholar] [CrossRef] [PubMed]
- Moreira, A.S.; Cavaco, D.G.; Faria, T.Q.; Alves, P.M.; Carrondo, M.J.T.; Peixoto, C. Advances in Lentivirus Purification. Biotechnol. J. 2021, 16, e2000019. [Google Scholar] [CrossRef]
- Bauler, M.; Roberts, J.K.; Wu, C.-C.; Fan, B.; Ferrara, F.; Yip, B.H.; Diao, S.; Kim, Y.-I.; Moore, J.; Zhou, S.; et al. Production of Lentiviral Vectors Using Suspension Cells Grown in Serum-free Media. Mol. Ther. Methods Clin. Dev. 2020, 17, 58–68. [Google Scholar] [CrossRef] [PubMed]
- Comisel, R.M.; Kara, B.; Fiesser, F.H.; Farid, S.S. Lentiviral vector bioprocess economics for cell and gene therapy commercialization. Biochem. Eng. J. 2021, 167, 107868. [Google Scholar] [CrossRef]
- Ansorge, S.; Lanthier, S.; Transfiguracion, J.; Durocher, Y.; Henry, O.; Kamen, A. Development of a Scalable Process for High-Yield Lentiviral Vector Production by Transient Transfection of HEK293 Suspension Cultures. J. Gene Med. 2009, 11, 868–876. [Google Scholar] [CrossRef] [PubMed]
- Ansorge, S.; Henry, O.; Kamen, A. Recent Progress in Lentiviral Vector Mass Production. Biochem. Eng. J. 2010, 48, 362–377. [Google Scholar] [CrossRef]
- Merten, O.-W.; Hebben, M.; Bovolenta, C. Production of Lentiviral Vectors. Mol. Ther. Methods Clin. Dev. 2016, 3, 16017. [Google Scholar] [CrossRef]
- Transfiguracion, J.; Tran, M.Y.; Lanthier, S.; Tremblay, S.; Coulombe, N.; Acchione, M.; Kamen, A.A. Rapid In-Process Monitoring of Lentiviral Vector Particles by High-Performance Liquid Chromatography. Mol. Ther. Methods Clin. Dev. 2020, 18, 803–810. [Google Scholar] [CrossRef]
- McCarron, A.; Donnelley, M.; McIntyre, C.; Parsons, D. Challenges of Up-Scaling Lentivirus Production and Processing. J. Biotechnol. 2016, 240, 23–30. [Google Scholar] [CrossRef] [PubMed]
- Gutiérrez-Granados, S.; Gòdia, F.; Cervera, L. Continuous Manufacturing of Viral Particles. Curr. Opin. Chem. Eng. 2018, 22, 107–114. [Google Scholar] [CrossRef]
- Moleirinho, M.G.; Silva, R.J.S.; Alves, P.M.; Carrondo, M.J.T.; Peixoto, C. Current Challenges in Biotherapeutic Particles Manufacturing. Expert Opin. Biol. Ther. 2020, 20, 451–465. [Google Scholar] [CrossRef] [PubMed]
- Konstantinov, K.; Cooney, C. White Paper on Continuous Bioprocessing May 20–21, 2014, Continuous Manufacturing Symposium. J. Pharm. Sci. 2015, 104, 813–820. [Google Scholar] [CrossRef] [PubMed]
- Croughan, M.S.; Konstantinov, K.B.; Cooney, C. The future of industrial bioprocessing: Batch or continuous? Biotechnol. Bioeng. 2015, 112, 648–651. [Google Scholar] [CrossRef]
- Zydney, A.L. Perspectives on integrated continuous bioprocessing—Opportunities and challenges. Curr. Opin. Chem. Eng. 2015, 10, 8–13. [Google Scholar] [CrossRef]
- Walther, J.; Godawat, R.; Hwang, C.; Abe, Y.; Sinclair, A.; Konstantinov, K. The business impact of an integrated continuous biomanufacturing platform for recombinant protein production. J. Biotechnol. 2015, 213, 3–12. [Google Scholar] [CrossRef]
- Godawat, R.; Konstantinov, K.; Rohani, M.; Warikoo, V. End-to-end integrated fully continuous production of recombinant monoclonal antibodies. J. Biotechnol. 2015, 213 (Suppl. C), 13–19. [Google Scholar] [CrossRef]
- Mendes, J.P.; Bergman, M.; Solbrand, A.; Peixoto, C.; Carrondo, M.J.T.; Silva, R.J.S. Continuous Affinity Purification of Adeno-Associated Virus Using Periodic Counter-Current Chromatography. Pharmaceutics 2022, 14, 1346. [Google Scholar] [CrossRef]
- Silva, R.J.S.; Mendes, J.P.; Carrondo, M.J.T.; Marques, P.M.; Peixoto, C. Continuous Chromatography Purification of Virus-Based Biopharmaceuticals: A Shortcut Design Method. In Animal Cell Biotechnology: Methods in Molecular Biology; Springer: New York, NY, USA, 2020; Chapter 21; pp. 367–384. [Google Scholar] [CrossRef]
- Tran, M.Y.; Kamen, A.A. Production of Lentiviral Vectors Using a HEK-293 Producer Cell Line and Advanced Perfusion Processing. Front. Bioeng. Biotechnol. 2022, 10, 887716. [Google Scholar] [CrossRef] [PubMed]
- Moreira, A.; Faria, T.; Oliveira, J.; Kavara, A.; Schofield, M.; Sanderson, T.; Collins, M.; Gantier, R.; Alves, P.; Carrondo, M.; et al. Enhancing the purification of Lentiviral vectors for clinical applications. Sep. Purif. Technol. 2021, 274, 118598. [Google Scholar] [CrossRef]
- Tinch, S.; Szczur, K.; Swaney, W.; Reeves, L.; Witting, S.R. A scalable lentiviral vector production and purification method using mustang Q chromatography and tangential flow filtration. In Viral Vectors for Gene Therapy: Methods in Molecular Biology; Springer: Berlin/Heidelberg, Germany, 2019; Chapter 8; pp. 135–153. [Google Scholar] [CrossRef]
- Manceur, A.P.; Kim, H.; Misic, V.; Andreev, N.; Dorion-Thibaudeau, J.; Lanthier, S.; Bernier, A.; Tremblay, S.; Gélinas, A.-M.; Broussau, S.; et al. Scalable Lentiviral Vector Production Using Stable HEK293SF Producer Cell Lines. Hum. Gene Ther. Methods 2017, 28, 330–339. [Google Scholar] [CrossRef] [PubMed]
- Broussau, S.; Jabbour, N.; Lachapelle, G.; Durocher, Y.; Tom, R.; Transfiguracion, J.; Gilbert, R.; Massie, B. Inducible Packaging Cells for Large-Scale Production of Lentiviral Vectors in Serum-free Suspension Culture. Mol. Ther. 2008, 16, 500–507. [Google Scholar] [CrossRef]
Figure 1.
Percent recoveries in the Mustang Q capture step. The amount of functional vectors, total vectors, DNA, and protein in the load material for the membrane, which had been nuclease treated and filtered, was defined as 100% and the amounts in the subsequent purification steps were calculated as percent recoveries. TU = transducing units; Vg = vector genome units; FT = flowthrough; MV = membrane volume; FR = flowrate. (A) Functional vectors, represented by TU. (B) Total vectors, represented by Vg. (C) DNA content. (D) Protein content.
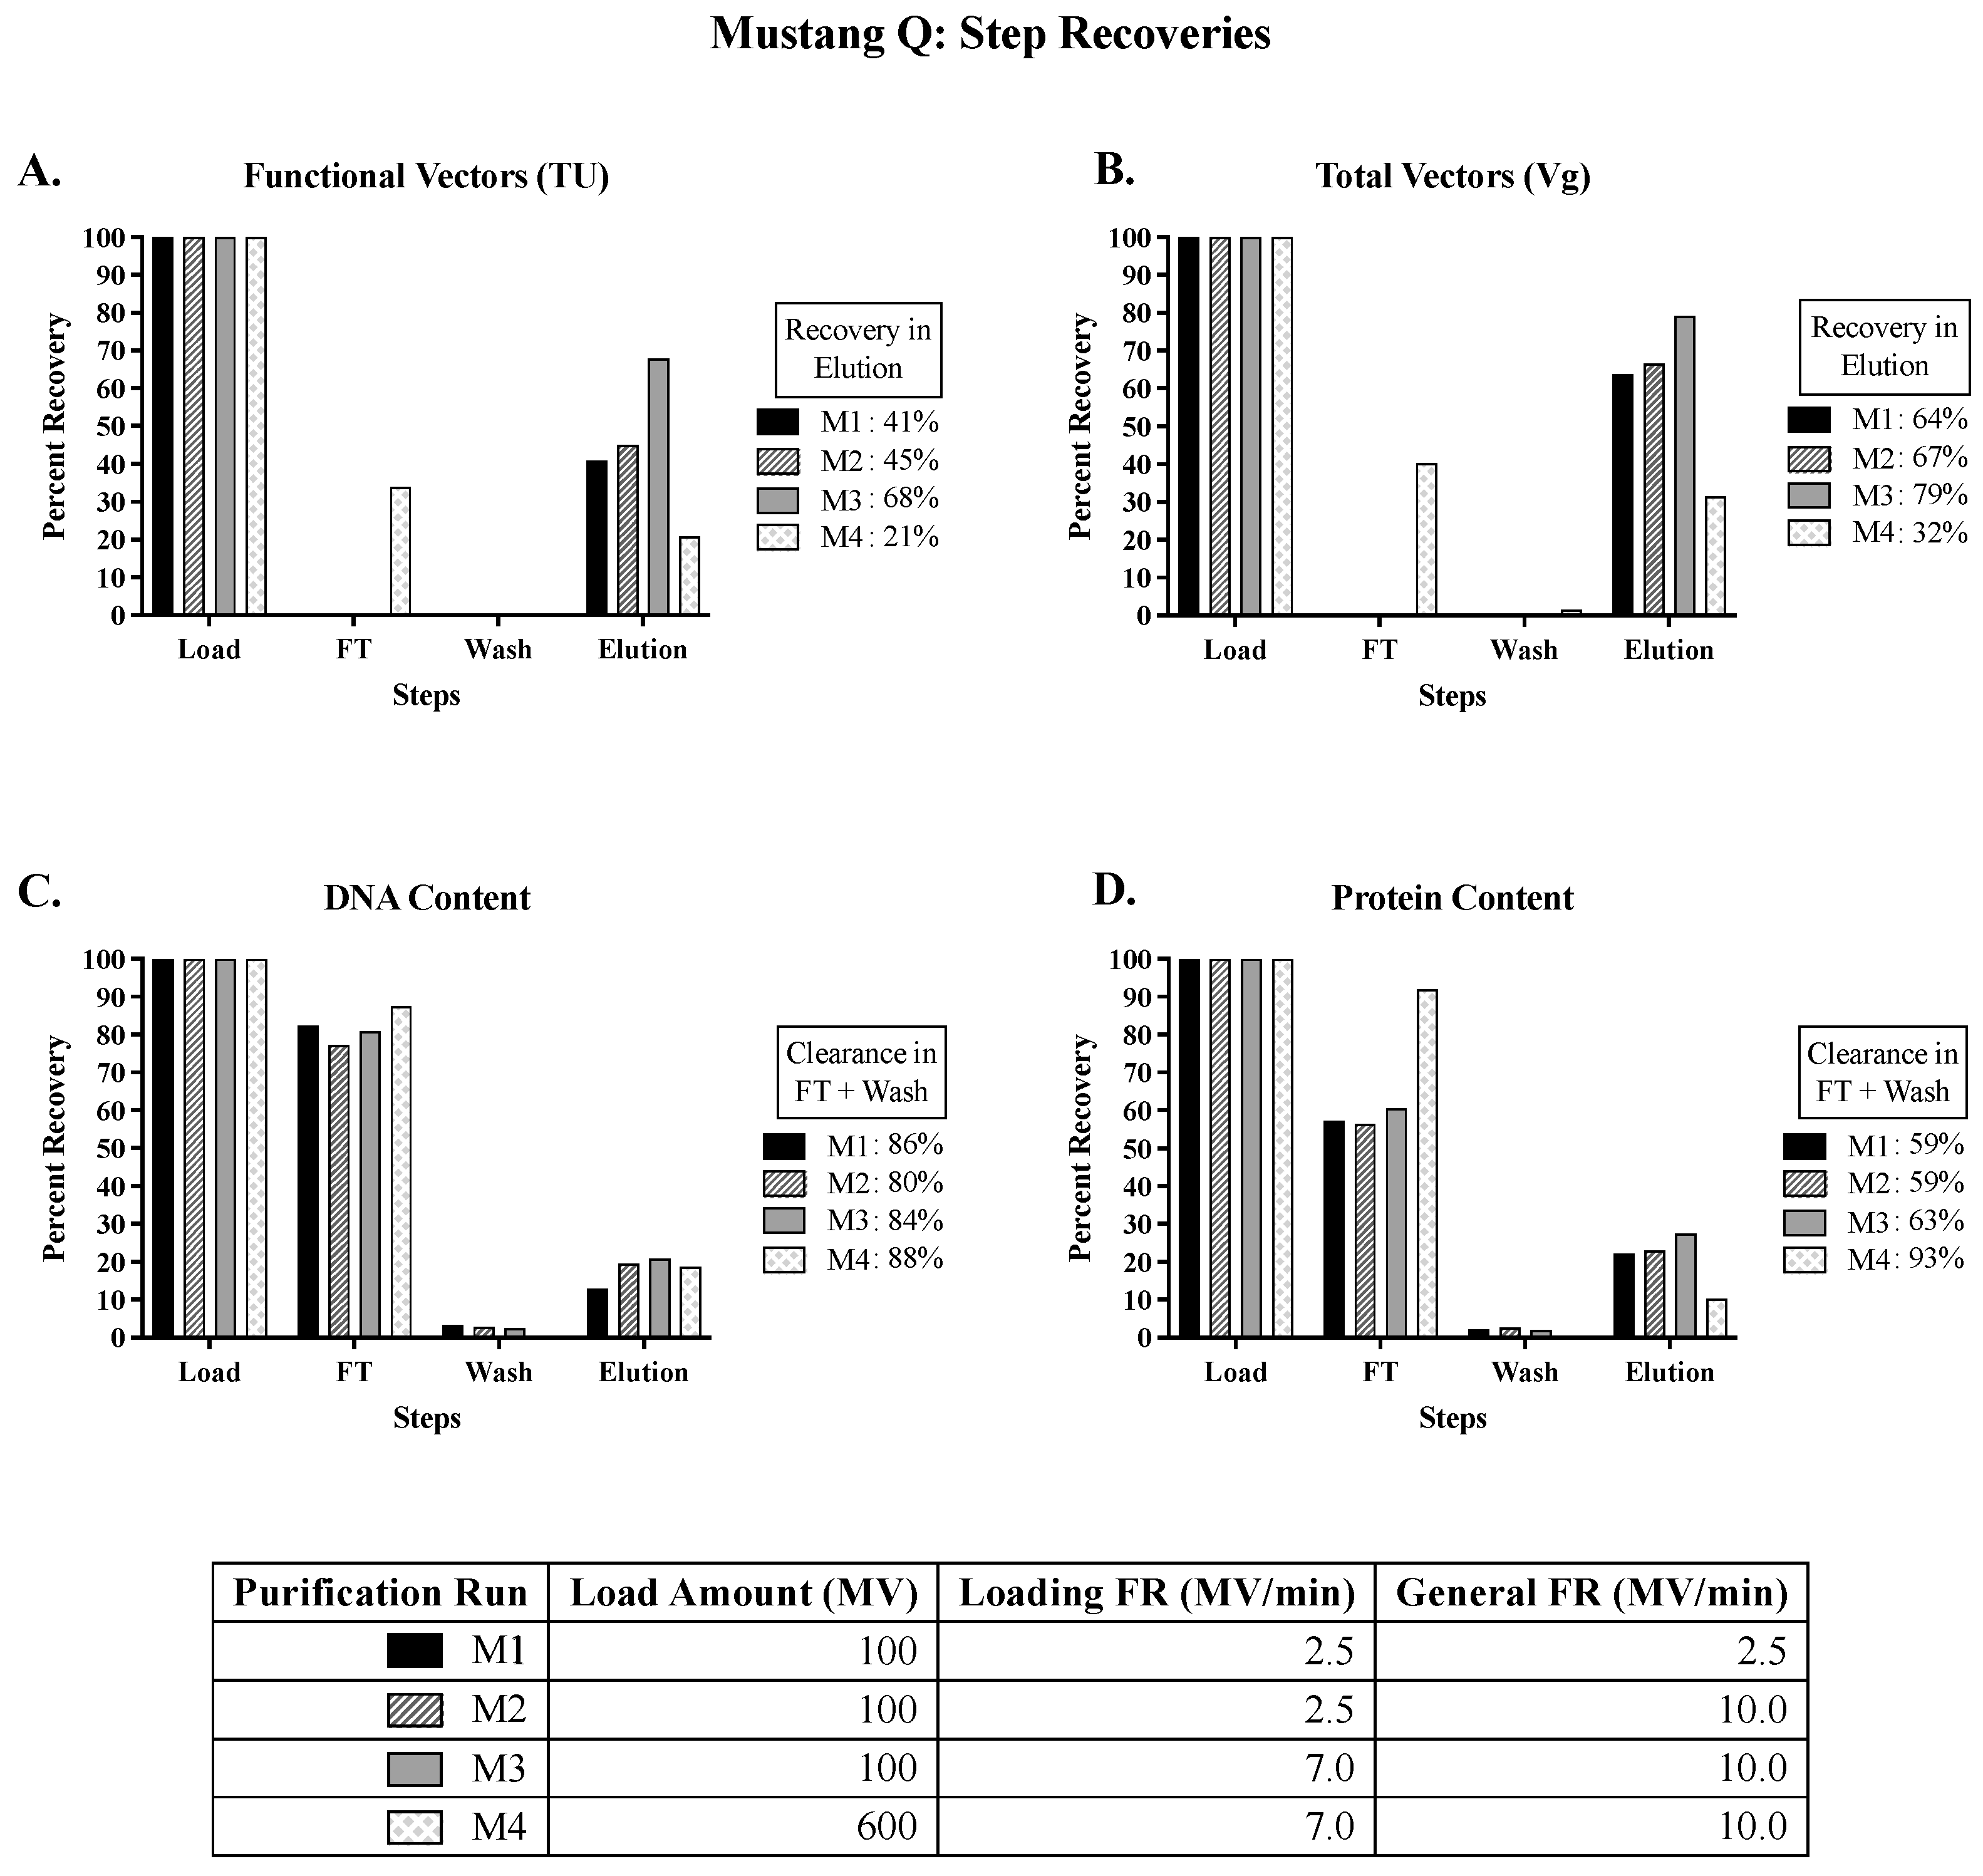
Figure 2.
Step and cumulative recoveries of functional vectors, represented as TU. Mustang Q step recovery is calculated from membrane load to elution; cumulative recovery is calculated from thawed LV harvest material to Mustang Q elution. P1 0–72 hpi LV material was held at 4 °C for 5 days post thaw before downstream processing; P1 72–96 hpi LV material was processed upon thaw. TU = transducing units; MV = membrane volume.

Figure 3.
Semi-continuous downstream process set up. Three Mustang Q membranes are denoted as A, B, and C. Once A is fully loaded, it is removed from system 1 and transferred to system 2 (the AKTA), and C is then connected in series after B. While the clarification and loading processes continue in system 1 for B + C, A is subjected to wash, elution, and regeneration steps (i.e., strip, then equilibration) in system 2. Then, B is transferred to system 2 for purification and A is re-transferred to system 1 behind C. These steps are repeated until all three membranes go through two cycles each. FT = flowthrough.

Figure 4.
Semi-continuous downstream process. In semi-continuous mode, the clarification of nuclease-treated LV material and loading of the Mustang Q capture step are combined, and they are operated in parallel to the purification steps of the capture step. In batch mode, nuclease treatment, clarification, loading, and purification for each cycle occurs in series. TU = transducing units; Vg = vector genome units; Vg/TU ratio indicates potency. 1-day and 6-day hold were implemented at 4 °C upon LV harvest thaw. (A) Comparing semi-continuous and batch downstream processes. (B) Comparing process hold times of the LV harvest. (C) Comparing Vg/TU ratio.

Figure 5.
Confocal microscopy images of transduced HEK293SF cells. Cells were transduced with (A) ISC LV: LVs manufactured by the integrated semi-continuous process (i.e., LVs produced in perfusion bioreactor and processed downstream in semi-continuous mode), captured at 11 h 50 min post transduction. (B) LV supernatant: LV supernatant from a shake flask production, captured at 15 h 10 min post transduction. (C) Cell supernatant: Supernatant from non-induced producer cells serving as the negative control. Left panel = GFP expression in green; Middle panel = Deep Red CellMask plasma membrane (PM) stain in red; Right panel = merged. Scale bar corresponds to 10 µm.

Figure 6.
Comparison of projected processing times for batch versus semi-continuous manufacturing. USP = upstream processing; refers to LV production in cell culture. DSP = downstream processing; refers to nuclease treatment, clarification, and Mustang Q capture step. Calculations are made based on the 2 L working volume of the perfusion bioreactor with 1 vessel volume per day media exchange rate, resulting in 2 L of LV harvest per day over 3 days along with 2.4 L of the final harvest, rendering a total of 8.4 L of harvest material with a total of 2.13 × 10¹¹ TU. The yield of functional vectors for the batch bioreactor is normalized to 2 L to facilitate comparison between the two modes of LV production, resulting in 1.62 × 10¹¹ TU. Assuming that the batch operation is completely reproducible, this process in batch mode needs to be repeated 13 times to produce the same amount of functional vectors as compared to the perfusion upstream processes. (A) Batch upstream and batch downstream; 6.5 days of processing repeated 13 times to equal 84.5 days of manufacturing; this estimation does not take into account the necessary time for cleaning and set up between the batch operations. (B) Perfusion upstream and batch downstream; 18.25 days of manufacturing. (C) Perfusion upstream and semi-continuous downstream; average of 12.75 days of manufacturing, depending on the scenario of the downstream. Scenario 1 (S1) processes LV harvest every 12 h; scenario 2 (S2) processes LV harvest every 24 h.

Figure 7.
Comparison of projected processing times and recovered functional yields for batch versus semi-continuous manufacturing. Case I = batch upstream + batch downstream. Case II = perfusion upstream + batch downstream. Case III = perfusion upstream + semi-continuous downstream; representative of an integrated semi-continuous manufacturing process. Upstream refers to LV production in cell culture. Downstream refers to nuclease treatment, clarification, and Mustang Q capture step; batch refers to each of these steps implemented in series; semi-continuous refers to these steps implemented in parallel, as described in Materials and Methods. Total processing time for Case I is 84.5 days, using the assumption that the batch bioreactor is repeated 13 times to produce the same amount of functional vectors as compared to Cases II and III. Total processing time for Case II is 18.25 days and Case III is 12.75 days.

Disclaimer/Publisher’s Note: The statements, opinions and data contained in all publications are solely those of the individual author(s) and contributor(s) and not of MDPI and/or the editor(s). MDPI and/or the editor(s) disclaim responsibility for any injury to people or property resulting from any ideas, methods, instructions or products referred to in the content. |
© 2023 by the authors. Licensee MDPI, Basel, Switzerland. This article is an open access article distributed under the terms and conditions of the Creative Commons Attribution (CC BY) license (https://creativecommons.org/licenses/by/4.0/).
Share and Cite
MDPI and ACS Style
Tran, M.Y.; Dash, S.; Yang, Z.; Kamen, A.A. Integrated Semi-Continuous Manufacturing of Lentiviral Vectors Using a HEK-293 Producer Cell Line. Processes 2023, 11, 3347. https://doi.org/10.3390/pr11123347
AMA Style
Tran MY, Dash S, Yang Z, Kamen AA. Integrated Semi-Continuous Manufacturing of Lentiviral Vectors Using a HEK-293 Producer Cell Line. Processes. 2023; 11(12):3347. https://doi.org/10.3390/pr11123347
Chicago/Turabian StyleTran, Michelle Yen, Shantoshini Dash, Zeyu Yang, and Amine A. Kamen. 2023. "Integrated Semi-Continuous Manufacturing of Lentiviral Vectors Using a HEK-293 Producer Cell Line" Processes 11, no. 12: 3347. https://doi.org/10.3390/pr11123347
Note that from the first issue of 2016, this journal uses article numbers instead of page numbers. See further details here.