
Study on Cavitation of Port Plate of Seawater Desalination Pump with Energy Recovery Function
by
 , ,
, ,
Wenlei Li
1,
Rui Guo
1,*,
Guogang Wang
2,
Jingyi Zhao
1 ,
,
Qian Zhang
3,
Lin Yu
2 and
Qisheng Zhang
1 1
School of Mechanical Engineering, Yanshan University, Qinhuangdao 066004, China
2
Yongchunjie Seawater Desalination Technology Engineering Co., Ltd., Qinhuangdao 066004, China
3
The Institute of Seawater Desalination and Multipurpose Utilization, Tianjin 300192, China
*
Author to whom correspondence should be addressed.
Processes 2023, 11(3), 743; https://doi.org/10.3390/pr11030743
Submission received: 31 December 2022
/
Revised: 24 February 2023
/
Accepted: 25 February 2023
/
Published: 2 March 2023
(This article belongs to the Special Issue Intelligent Control and Maintenance of Fluid Component and System)
Abstract
:To address the problem of low integration and efficiency of reverse osmosis desalination system, an energy-recovery type incurve multiple acting pump is developed with integrated functions of a high-pressure pump, energy recovery device and booster pump. In order to determine its flow range and suppress cavitation generation, a mathematical model of the port plate is established, combining the realizable k-ɛ turbulence model and the Schnerr-Sauer cavitation model to obtain the internal flow field characteristics of the port plate. The effects of different rotational speeds and inlet pressures on cavitation were analyzed to obtain the gas volume fraction distribution rules. The design is based on the pressure and mass flow monitoring test device to verify the numerical calculation results. The results show that the experimental and simulation data match accurately, and with the increase in speed and the decrease in inlet pressure, the cavitation phenomenon becomes serious and the flow coefficient is reduced. The optimal working speed of the pump in this paper is 520 r/min and the output flow is 200 L/min. Compared with conventional products, the volume is reduced by more than 40%.
1. Introduction
Nowadays, with the increase in population and the rapid development of industry, the demand for water resources is growing, and the problem of water shortage is becoming more and more serious [1,2]. According to statistics, the world’s per capita share of fresh water has halved in the past 50 years [3]. Due to its simplicity, low energy consumption and relatively low operating cost, reverse osmosis (RO) has become an important means to solve the water resource crisis [4]. Increasing the rotating speed of the high-pressure pump can improve the water production capacity, but excessively high rotating speed is likely to cause cavitation in the low-pressure area of the high-pressure pump, booster pump and energy recovery device. Bubbles are generated and get bigger in the low-pressure area. When flowing to the high-pressure area, bubbles will collapse, resulting in noise and hitting that corrodes the wall, which will shorten the performance and service life of components [5]. Shengnan Tang by using an improved convolutional neural network (CNN) and a normalized convolutional neural network (NCNN) framework with batch normalization strategy analysis of vibration signal and sound signal identifies the fault of the plunger pump [6,7,8].
At present, due to the high pressure and large flow rate in the high-pressure pump, it is difficult to observe the internal flow field changes and the mechanism of various phenomena by experimental means. In particular, cavitation transiently evolves and is highly similar to turbulent flow [9]. Bin Xi investigated the characteristic of dynamic fluid loss is in eccentric annulus flow channel and tubing and in flow line in terms of velocity, vorticity, and pressure field [10]. The cavitation process is accompanied by a change in the temperature field. When latent heat is absorbed by the surrounding liquid, the temperature around the cavitation vapor bubble decreases [11,12]. MM Ge et al. investigated the effect of flow temperature on cavitation intensity and shedding dynamics. At a starting temperature of 20 °C, the cavity begins to increase in size and transforms from a sheet-shaped cavity to a cloud-shaped cavity. With the temperature increasing, the cavitation length first increases and then decreases, with cavitation intensity peaking at the transition temperature of 58 °C. The shedding frequencies show a decrease and then increase trend with temperature increasing, and the cavitation size has the dominant or direct influence. When the temperature is over 58 °C in water, the thermal effect dominates over the effect of the Reynolds number, which signifies the “thermal delay” in cavitation growth and suggests a threshold point of temperature from which the cavity tends to shrink. A combined suppression parameter (CSP) is provided to predict that. With the CSP value increasing, the cavitation intensity can be decreased [13,14,15].
Computational fluid dynamics (CFD) is more cost-effective and high-efficiency compared to experiments and can overcome the difficulty brought about by practical experiment feasibility [16,17]. CFD has become the main method to study and optimize fluid mechanical properties. Hu B studied the flow characteristics within the pre-swirl system of a marine gas turbine at low rotational speed by varying the pressure at the pre-swirl nozzle. The flow in the rotor-stator cavities was analyzed to find the effects of nozzle pressure on the radial velocity, core swirl ratio, and pressure [18]. Zhaocheng Sun established a mathematical model of multi-objective optimization and used computational fluid dynamics (CFD) to verify the hydrodynamic characteristics of the generated turbine blades. In addition, the model improved the energy collection efficiency of tidal turbines [19]. Xiaolin Wang applied entropy generation theory and computational fluid dynamics (CFD) to analyze the relationship between cavitation flow field details and irreversible flow loss, as well as the distribution and flow details of entropy generation in the impeller. It is found that the serious cavitation flow changes the flow field structure and the maximum distribution area of entropy production. The turbulence velocity fluctuation is the main reason for the increase in the total entropy production, and the high-speed vortex has a great influence on the irreversible flow loss. The accuracy of the simulations is ascertained numerically and experimentally by comparing the cavitation performance curve and cavity distribution of the pump [20]. Jian Liang et al. investigated the relationship between inlet pressure fluctuations and unsteady cavitation process condition inside a water hydraulic poppet valve based on the numerical analysis carried out by a two-phase mixture model via CFD software ANSYS Fluent 14.5. To a certain extent, increasing or decreasing frequency f can suppress the occurrence or enhancement of cavitation [21]. Tiancheng Ouyang et al. proposed a computational fluid dynamics (CFD) model coupled with gear vibration, which was used to study the vibration cavitation mechanism. The CFD-vibration coupled model is validated by comparing it with experiments. The results show that cavitation is aggravated at high speeds, low loads, high gear modules, and low viscosities, and extreme pressure fluctuations occur at the variable pitch [22]. Chuan Wang numerically investigated the effect of the blade number on the internal flow condition. It was found that the predictions and the measurements are in good agreement of discrepancy. Serious cavitation could be observed within the pump when the flow rate reached 1300 m3/h. Meanwhile, the effect of the blade number on the cavitation intensity was extremely obvious [23]. Campo et al. simulated the internal cavitation flow of an external gear pump using the ZGB model to accurately predict the mass flow imbalance and cloud-shedding frequency [24,25]. Shen et al.simulated the cavitating flow and pressure fluctuation in the tip region of the axial flow pump. They pointed out that the pressure fluctuates obviously in the flow passage caused by suction-side-perpendicular cavitating vortices [26]. Jinbao Chen proposes an optimization strategy (OT-CFD), which is based on the orthogonal test method and computational fluid dynamics (CFD), to optimize the performance of the TMHT runner [27].
In recent years, CFD technology has been applied to various fields of desalination systems, such as membrane components, pipeline systems, high-pressure pumps, etc. Sahar Zare et al. performed the CFD simulation and optimization of an energy-efficient direct contact membrane distillation (DCMD) desalination system in a counter-current flow mode [28]. Nitikesh Prakash et al. simulated the nucleation, growth of gypsum crystals and membrane surface coverage by using the moment-based population balance method and CFD to understand the gypsum scaling mode and flux decline [29]. In particular, CFD can be used to calculate the internal flow field of pumps and energy recovery devices using the most basic control equations combined with the volume method. Khanjanpour proposed a conceptual design of a tidal power reverse osmosis (TPRO) desalination unit. The geometry of the HAT turbine, which can power the whole desalination system, was optimized with a combination of only 16 CFD simulations using the Taguchi method [30]. Wang et al. improved the performance of a vertical wind turbine by using the CFD-Taguchi method. They characterized design parameters such as wave amplitude, wavelength, and twist angle while making the objective function the power coefficient [31]. FH Ye et al. used the CFD method to numerically simulate the cavitation phenomenon of rotary vane energy recovery device (RVERD) and found that cavitation occurs in the clearance between the blade tip and stator wall, in the downstream area of the rotating blade and the bottom area of the blade groove. Delaying the discharge angle at the high-pressure outlet port by 3° and an optimal port-to-stator length ratio of 70% helped prevent backflow and eliminate peak torque. At the optimal rotational speed of 1000 RPM and with a tip clearance gap of 50 μm, the volume-averaged vapor volume fraction in the core decreased from 0.0206 to 0.0006 while the volumetric efficiency increased from 85.7% to 91.6% [32,33]. Liu et al. adopted the standard k-ε turbulence model to simulate the hydrodynamics and mixing process in the RERD pipe, and it is found that the rotational speed and velocity have opposite effects on the mixing process [34]. Kai Liu applied CFD to study the flow characteristics and mixing process in RERD. Three different turbulence simulation methods are compared and verified with PIV experimental data. It is recommended to use the realizable k-ε turbulence model which accords well with the experimental data to analyze the flow characteristics in detail [35]. Zheng Cao studied the mixing performance and flow pattern of the rotating pressure exchanger (RPE) under different working conditions by using the CFD method, and obtained the operating conditions of the minimum mixing rate [36]. Xu et al. used the CFD method to simulate the impact torque of the self-driven rotary energy recovery device (RERD) under different flows and slope angles, and calculated the friction resistance according to Newton’s law of viscosity. The rotor speed was obtained and verified with the test. The error was smaller than 4%, and a simple method for calculating the theoretical rotor speed was established [37]. Ye et al. proposed a matching design for vane number and port position, and the energy recovery efficiency of the sliding vane pressure exchanger (SVPE) is assessed using the established vane dynamics model combined with the energy loss model [38].
In this paper, an incurve multiple-acting pump with an energy recovery function is proposed, which is designed to realize energy recovery and pressurization of raw seawater without a booster pump. The CFD method is used to analyze the flow characteristics in the port plate, and the maximum working flow is determined by suppressing cavitation and reducing pressure difference. The mass flow coefficient method was proposed to verify the CFD calculation results, and the experimental bench was designed for testing and evaluation.
2. Method
2.1. Description of the Working Principle of the Incurve Multiple-Acting Pump with an Energy Recovery Function
The incurve multiple-acting pump creatively integrates the energy recovery function into the high-pressure pump, and the raw seawater and the concentrated seawater with pressure energy are simultaneously introduced into the pump. Figure 1 describes in detail the specific structure of the pump proposed in this paper, which is mainly composed of a stator, rotor, port plate, piston and related components.
In Figure 1, The 1/4/5/8 piston is in the stage of pressurizing raw seawater and recovering concentrated seawater pressure energy, while, 2/3/6/7 is in the stage of absorbing raw seawater and discharging concentrated seawater after work. Take the No. 1 piston as an example to illustrate the working process. As the rotor rotates clockwise, the No. 1 piston will move from remote point b to a, and high-pressure concentrated seawater will enter the rod end from the membrane module through the port plate. Under the drive of stator constraint and motor, the rotor and the high-pressure concentrated seawater pressurize the raw seawater together to reach the feed water pressure required by the membrane module, which realizes the pressurization of raw seawater while recovering the pressure energy of concentrated seawater. The piston is fully retracted at point c. Beyond the near point c, the piston will extend outward and will be in the position of piston two. The raw seawater will enter the rodless section through the port plate, and the concentrated seawater with work at the rod end will be discharged through the port plate.
Incurve multiple-acting pump is a six-acting eight-piston structure. Each piston completes six times of suction of raw seawater, pressurization of raw seawater, recovery of pressure energy of high-pressure concentrated seawater, and discharge of concentrated seawater after work. In order to satisfy the flow distribution of raw seawater and thick seawater with eight pistons for six times in a cycle, the double-layer flow distribution plate structure is newly designed. As shown in Figure 2, the first layer is the pressurized raw seawater channel and high-pressure concentrated seawater channel, and the second layer is the inhaled raw seawater channel and the worked concentrated seawater channel. The contact surface with the rotor forms a U-shaped waist.
2.2. Numerical Methodologies
2.2.1. Governing Equations
As the viscosity of seawater is only one-twentieth to forty times that of hydraulic oil, and the saturated vapor pressure is far lower than that of hydraulic oil, the high-speed flow of seawater in the pump is likely to form liquid-steam, which constantly changes the vapor-liquid turbulent flow due to the change of the cross-sectional area. Using the vapor-liquid two-phase homogeneous mixing model, its mass continuity equation can be described by the following equation:
where is the average density (kg/m3), t is time(s), is the velocity vector, is the liquid water density (kg/m3), is the water vapor density (kg/m3), and is the volume fraction of water vapor.
Ignoring the heat transfer, mass force and surface tension on the bubble surface, the momentum control equation can be described as:
where is the average dynamic viscosity (N·s/m2), is the liquid hydrodynamic viscosity (N·s/m2), and is the vapor dynamic viscosity (N·s/m2).
The full cavitation model equation takes into account the influence of non-condensing vapor and uses the standard viscous flow N-S equation and the conventional turbulence model to obtain the transport equation:
where is the vapor mass fraction, is the total density of the mixture (kg/m3), is the mixed fluid velocity vector, is the water vapor condensation rate, is the evaporation rate of water vapor, and is the diffusion coefficient.
The relationship between vapor volume fraction and mass fraction is as follows.
Assuming that the bubble is always spherical, the air is distributed evenly and the fluid is incompressible, regardless of physical force and transport and heat conduction, the bubble dynamics can be described by the Rayleigh Plesset equation:
where is the bubble radius (m), is the bubble internal pressure (Pa), is the pressure of the bubble’s external liquid (Pa), is the viscosity coefficient, and S is the bubble’s surface tension coefficient.
Homogeneous phase flow is when the medium is assumed to be a mixture of homogeneous liquid and vapor phases. This helps avoid the large amount of time consumed to solve the independent continuous equation and momentum equation of each component, so the mixed liquid equation is the following.
The surface tension, viscous damping and higher-order derivatives in the Rayleigh-Plesset equation are generally ignored. Equation (6) can be simplified as follows.
In the uniform hypothesis, liquid density and vapor density are constants. The density of the mixture is only related to the vapor volume fraction. The derivative of Equation (1) can be obtained as the following.
Vapor volume fraction can be expressed using the amount and diameter of vapor per unit volume:
where N is the number of bubbles.
The evaporation rate and condensation rate can be obtained by combining the above equations as follows:
where and are empirical coefficients of evaporation and condensation.
2.2.2. CFD Solution Methods
Commercial CFD software ANSYS was used as the simulation platform. A pressure-based solver was chosen to solve the governing equations, and a coupled algorithm was used for pressure-velocity coupling. The spatial discrete scheme was gradient least squares element method, pressure second order, momentum second order upwind scheme, and modified turbulence viscous second order upwind scheme. The realizable k-ε model was used for the turbulence model, and the spatial small unit size was 0.2 mm. The ANSYS meshing module was used to mesh the fluid domain of the port plate, as shown in Figure 3. Boundary layer inflation method and local grid refinement technique were used in the fluid domain.
The inlet and outlet boundary conditions of the port plate of the incurve multiple-acting pump are divided into four groups: the first group is raw seawater pressure inlet and raw seawater velocity outlet, the second group is raw seawater velocity inlet and raw seawater pressure outlet, the third group is concentrated seawater pressure inlet and concentrated seawater velocity outlet, the fourth group is concentrated seawater velocity inlet and concentrated seawater pressure outlet. The feed water flow is 366 L/min. The boundary conditions for numerical calculation are shown in Table 1.
3. Results and Discussion
The pseudo-transient model was turned on during the numerical simulation, and the time scale was 0.01. Whether the numerical calculation converges was based on the stability of the mass flow and the calculated residual is less than 0.0001. The outlet mass flow rate was detected, as shown in Figure 4. The accuracy of numerical simulation results and the consumption of computing resources were directly affected by the number of grids, grid density and grid quality. For the numerical simulation of pseudo-transient cavitation, the influence of the number of grids on the calculation time and results was more obvious. Taking the number of grids as the independent variable and the outlet mass flow rate as the criterion, the grid independence was verified, as shown in Figure 5.
It can be seen from Figure 5 that when the number of grids is less than 350,000, the mass flow rate of the original seawater calculated by fluent is large and the mass flow rate varies greatly along with the change in the number of grids. When the number of grids reaches more than 2,300,000, the mass flow of raw seawater calculated by fluent tends to be stable. Therefore, the number of grids in the range of 3,000,000–5,000,000 is more appropriate. If the number of grids is increased, the calculation amount will increase and the calculation accuracy will not be significantly improved, which will consume a lot of computing resources and time. It can be determined that the simulation results are not dependent on the grid.
Figure 6 and Figure 7 indicate the pressure fields of the port plate, among which Figure 7 shows the detailed pressure fields of the two interfaces across the Y-axis selected in Figure 6. As can be seen from Figure 5, the overall pressure inside the port plate is divided into four areas: high-pressure raw seawater area, high-pressure concentrated seawater area, low-pressure raw seawater area and low-pressure concentrated seawater area. The overall distribution is relatively evenly. However, whether for raw seawater or concentrated seawater, the pressure at the velocity inlet is higher than that at the pressure outlet. It is mainly caused by the local resistance loss inside the port plate and the friction head loss. In particular, the pressure difference between the velocity inlet and the pressure outlet of the raw seawater reached 0.5 MPa, which was significantly higher than that of the concentrated seawater. The reason for this phenomenon is that the flow area of raw seawater is significantly smaller than that of concentrated seawater and the flow rate of concentrated seawater is only 60% of that of raw seawater. Therefore, both the local resistance loss and the friction head loss are higher than that of concentrated seawater. From the detailed pressure field in Figure 6, it can be seen that when the local pressure in the seawater suction area of the raw material reaches 10,000 pa, which is lower than the saturated vapor pressure of the seawater vapor, cavitation will occur.
As can be seen from Figure 8, cavitation occurs in the raw seawater suction area, especially cavitation is more serious away from the raw seawater pressure inlet place, mainly due to the existence of flow resistance. The local pressure is lower than the air separation pressure of water vapor. Figure 9 shows the vapor volume distribution diagram of the two cross-sections through the Y-axis. It can be seen that the most serious part of the cavitation is located on the slender channel of the distribution port of the raw seawater. The main reason is that the hydraulic diameter of the slender pipeline is smaller than that of other raw seawater inlet basins, resulting in a higher flow rate and lower pressure.
According to the numerical calculation results, it is found that under the boundary conditions in Table 1, severe cavitation has occurred in the valve plate of the incurve multiple-acting pump. The generation, development, spalling and collapse of bubbles will produce severe vibration, noise, impact and high temperature within a certain area, which will directly affect the service life of the port plate and reduce the efficiency and performance of the whole reverse osmosis system. In order to obtain the maximum supply flow rate in as small a structure size as possible, the inlet pressure of raw seawater and the speed of the pump are taken as variables, and the maximum supply flow rate under the fixed structure size is explored under the condition that the volume fraction of the monitoring point is equal to 0. The location of the monitoring point is shown in Figure 10.
The main purpose of the design of the experiment (DOE) is to select the optimal sample points according to the level of each experimental factor, and to obtain the influence of experimental factors on the output from fewer samples, so as to achieve low consumption and high output, and provide data support for the establishment of the response surface. DOE includes the full factor method, central composite design, Box-Behnken, Latin hypercube design, etc. Anderson combines the maximum-minimum distance design with the optimal experimental design, takes the maximum-minimum distance between sample points as the goal, and considers the generalized variance of the regression coefficient of the regression model to determine the even distribution of the design sampling [39]. This method belongs to a typical space-filling design approach. In this paper, the optimized space-filling method is used, which is an optimization of the Latin hypercube design and is more suitable for generating complex response surfaces. The response surface is a model based on sample data to fit the relationship among rotational speed, inlet pressure and vapor volume fraction. The response surface mainly includes the polynomial surface model, Kriging model, neural network model, non-parametric regression model, sparse grid model and so on. Non-parametric regression models are particularly suitable for nonlinear and computationally possible noise points.
Because the cavitation phenomenon is highly nonlinear, the DOE in combination with the non-parametric regression method is used to establish the internal flow field agent model of the port plate, and then the mapping relationship between the inlet and outlet boundary conditions and cavitation is obtained. The inlet pressure of raw seawater is in the range of 0–0.5 MPa, and the inlet velocity of raw seawater is in the range of 0–10 m/s. The sampling test is carried out by using the space optimization filling method, and the sample points are obtained and shown in Table 2.
Figure 11 is the contour map. It can be seen that with the increase of the inlet pressure of the raw seawater and the decrease of the inlet velocity of the raw seawater, the cavitation phenomenon gradually decreases until the vapor volume fraction of the steam reaches 0, and it shows strong nonlinearity. The multi-genetic algorithm is used to make the inlet velocity of the raw seawater as high as possible under the condition that the volume fraction of the steam is 0 and the inlet pressure is low. The best point is at the inlet velocity of 7.1 m/s and the inlet pressure of 420,000 Pa, where the update shall be carried out in fluent.
It can be seen from Figure 12 that the volume fraction of vapor inside the optimization point is 0 after the inlet velocity condition is changed, indicating that there is no cavitation inside the port plate, which is consistent with response surface in the Figure 11. Figure 13 shows the pressure field of the two cross sections of the optimized point through the Y axis. The internal pressure distribution is evenly, and there is no local pressure lower than the vapor separation pressure, which is mutually verified with Figure 12.
In order to verify the correctness of numerical calculation and optimization, this paper proposes to use of the mass flow coefficient for verification. The CFD simulation mass flow coefficient is defined as the ratio of the mass flow through the flow channel to the maximum mass flow, which can be expressed by Formula (13). The experimental mass flow coefficient is defined as the ratio of the sum of the pump output mass flow and the leakage mass flow to the maximum mass flow of the pump, which is expressed by Formula (14):
where is the mass flow coefficient of CFD, is the raw seawater outlet mass flow calculated by CFD (kg/s), A is the flow area of raw seawater outlet (m2), is the density of raw seawater (kg/m3), is the inlet pressure of raw seawater velocity calculated by CFD (Pa), is the outlet pressure of raw seawater pressure (Pa), which is set by the boundary conditions. is the experimental mass flow coefficient, is the pump suction flow (m3/s), is the mass flow rate of raw seawater output for experimental testing (kg/s), and is leakage mass flow for experimental testing (kg/s).
The experimental principle is shown in Figure 14. The variable frequency motor 1 drives the pump, in which the flow sensor 2 is used to measure the flow rate. The inlet pressure of raw seawater is controlled by the feed pump, relief valve 2 and manual gate valve. When the pressure of the raw seawater pressure inlet is 0 MPa, the manual ball valve is opened. When the pressure of relief valve 2 is set to 0 MPa, the variable frequency motor 2 drives the feed pump to run at low speed. When the pressure of the inlet of the raw seawater pressure is adjusted, the manual ball valve is closed. The pressure of the relief valve 2 is adjusted arbitrarily according to the given current setting of 0–0.6 MPa. The frequency conversion motor 2 drives the feed pump to operate at high speed. The output flow is greater than the theoretical flow of the incurve multiple-acting pump to absorb the raw seawater. The remaining water flows out from relief valve 2 and returns to the water tank. It can be seen from the CFD simulation contour that the seawater intake area of the pump is the most prone to cavitation and the most serious area. Therefore, in order to prevent the inlet and outlet of concentrated seawater in the desalination pump and the leakage of concentrated seawater from interfering with the leakage of raw seawater, the inlet and outlet of concentrated seawater are connected with the atmosphere during the experiment.
The pressure at the raw seawater outlet of the desalination pump is set by relief valve 1 with a continuously adjustable range of 0–10 MPa. Flow sensor 1 tests the output flow of raw seawater. The weighing sensor is used to measure the weight of the raw seawater output by the incurve multiple-acting pump within 10 s. Weighing sensor 2 is used to measure the mass flow of the leakage port.
The experiment is divided into two stages. The first stage is about the pre-optimization of the condition. When the speed is 950 r/min, the raw seawater pressure inlet is 0 MPa, and the outlet is 6.5 MPa. After the system runs smoothly, the solenoid valve 1 and the solenoid valve 2 begin to reverse and maintain for 10 s. Then the power is off, and the system stops running, waiting for the seawater in the container to stabilize. The weighing sensor measures output mass and leakage mass in 10 s, which will be repeated 10 times. The second stage focuses on optimizing the working condition. The relief valve 2 is set to 0.42 MPa, the manual gate valve is closed, and the feed pump runs at high speed. After the system runs smoothly, the solenoid valve 1 and the solenoid valve 2 begin to reverse and maintain for 10 s. After that, the system stops running and waits for the seawater in the container to stabilize. The weighing sensor measures the output mass and leakage mass within 10 s, which will be repeated 10 times.
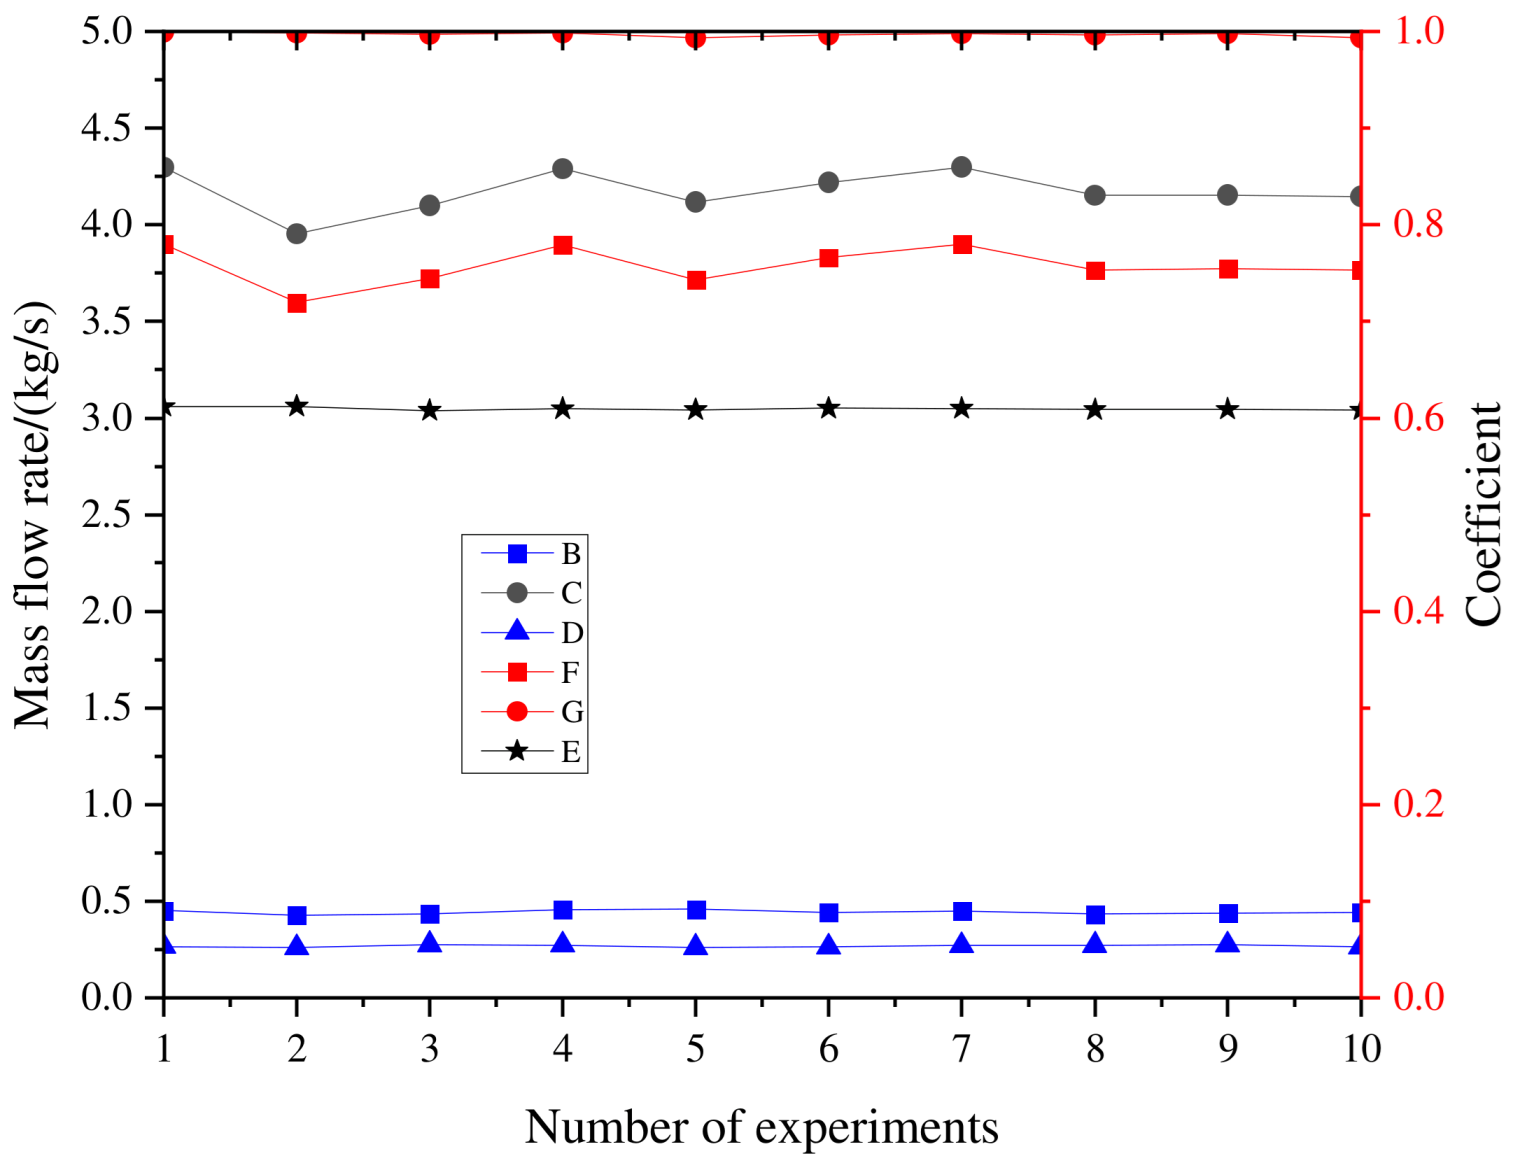
The experimental data are shown in Figure 15. Curve B represents the leakage mass flow before optimization; curve C represents the output mass flow before optimization; Curve D represents the leakage mass flow after optimization; Curve E represents the output mass flow after optimization; Curve F represents the mass flow coefficient before optimization; Curve G represents the mass flow coefficient after optimization. According to the CFD simulation results and Formula (13), the mass flow coefficient before optimization is about 74.6%, and the average experimental result is 75.4%, with good coincidence. According to the CFD simulation results and Formula (14), the mass flow coefficient before optimization is about 100%, and the average experimental result is 99.8%. The experimental results show that the CFD calculation is correct, and the optimized raw seawater pressure inlet is 0.42 MPa. The pressure of raw seawater after pre-treatment is 0.42 MPa. The inlet velocity is 7.1 m/s and the corresponding speed is 520 r/min.
4. Conclusions
In order to obtain the maximum output performance of the incurve multiple-acting pump with an energy recovery function of a certain size proposed in this paper, the fluid domain model inside the port plate was established to study the distribution characteristics of the complex flow field inside the port plate and the cavitation distribution under the initial working conditions was obtained. The DOE experiment was combined with the non-parametric regression method to establish the internal flow field proxy model. The genetic algorithm was used to obtain the best working conditions. In order to verify the correctness of the optimization results, this paper proposes a mass flow coefficient test method and formulates an experimental system. The main conclusions of this paper are summarized as follows:
- (1)
- The inlet pressure of raw seawater and the motor speed are important factors affecting the output performance of the incurve multiple-acting pump with energy recovery function. Under the condition of the structure size designed in this paper, the best working point is the motor speed of 520 r/min, the suction pressure of raw seawater is 0.42 MPa, and the output flow is 200 L/min.
- (2)
- Through the data collection and analysis of the mass flow experimental system, it is determined that cavitation occurs under the initial working condition, but no cavitation occurs in the optimization point of the port plate, which verifies the correctness of the establishment and simulation of the CFD model.
- (3)
- Compared with the same flow of seawater desalination high-pressure piston pump, the volume is reduced by more than 40%, and it also has the function of energy recovery. In this paper, the research method of port plate cavitation and the mass flow coefficient verification method are proposed to provide the method basis for the subsequent series of product designs.
Author Contributions
Conceptualization, J.Z. and R.G.; methodology, W.L.; software, W.L.; validation, G.W., Q.Z. (Qian Zhang) and L.Y.; formal analysis, R.G.; investigation, W.L.; resources, Q.Z. (Qisheng Zhang); data curation, R.G.; writing—original draft preparation, W.L.; writing—review and editing, W.L.; visualization, W.L.; supervision, J.Z.; project administration, J.Z.; funding acquisition, J.Z. All authors have read and agreed to the published version of the manuscript.
Funding
This research was funded by National Natural Science Foundation of China (No. 52075469, 12173054). And The APC was funded by National Natural Science Foundation of China No. 52075469.
Data Availability Statement
Not applicable.
Conflicts of Interest
The authors declare no conflict of interest.
References
- Chen, H.-C.; Chen, Y.-R.; Yang, K.-H.; Yang, C.-P.; Tung, K.-L.; Lee, M.-J.; Shih, J.-H.; Liu, Y.-C. Effective reduction of water molecules’ interaction for efficient water evaporation in desalination. Desalination 2018, 436, 91–97. [Google Scholar] [CrossRef]
- Ang, W.L.; Mohammad, A.W.; Hilal, N.; Leo, C.P. A review on the applicability of integrated/hybrid membrane processes in water treatment and desalination plants. Desalination 2015, 363, 2–18. [Google Scholar] [CrossRef]
- Tiziano, D.; Scott, K. Are We in Deep Water? Water Scarcity and Its Limits to Economic Growth. J. Ecol. Econ. 2018, 146, 130–147. [Google Scholar]
- Kim, J.; Park, K.; Yang, D.R.; Hong, S. A comprehensive review of energy consumption of seawater reverse osmosis desalination plants. Appl. Energy 2019, 254, 113652. [Google Scholar] [CrossRef]
- Qin, Z.; Zhang, Q.; Luo, Q. Microstructure design to improve the corrosion and cavitation corrosion resistance of a nick-el-aluminum bronze. J. Corros Sci. 2018, 139, 255–266. [Google Scholar] [CrossRef]
- Tang, S.; Zhu, Y.; Yuan, S. Intelligent fault identification of hydraulic pump using deep adaptive normalized CNN and synchrosqueezed wavelet transform. J. Relia. Eng. Syst. Safe. 2022, 224, 108560. [Google Scholar] [CrossRef]
- Tang, S.; Zhu, Y.; Yuan, S. A novel adaptive convolutional neural network for fault diagnosis of hydraulic piston pump with acoustic images. J. Adv. Eng. Inform. 2022, 52, 101554. [Google Scholar] [CrossRef]
- Tang, S.; Zhu, Y.; Yuan, S. An improved convolutional neural network with an adaptable learning rate towards multi-signal fault diagnosis of hydraulic piston pump. J. Adv. Eng. Inform. 2021, 50, 101406. [Google Scholar] [CrossRef]
- Bhatt, M.; Mahesh, K. Numerical investigation of partial cavitation regimes over a wedge using large eddy simulation. Int. J. Multiph. Flow 2019, 122, 103155. [Google Scholar] [CrossRef]
- Xi, B.; Wang, C.; Xi, W.; Liu, Y.; Wang, H.; Yang, Y. Experimental investigation on the water hammer characteristic of stalling fluid in eccentric casing-tubing annulus. J. Energy 2022, 253, 124113. [Google Scholar] [CrossRef]
- Chen, T.; Chen, H.; Liang, W.; Huang, B.; Xiang, L. Experimental investigation of liquid nitrogen cavitating flows in converg-ing-diverging nozzle with special emphasis on thermal transition. J. Int. J. Heat Mass Transf. 2019, 132, 618–630. [Google Scholar] [CrossRef]
- Zhou, J.; Wei, C.; Hu, J. A novel approach for predicting thermal effects of gas cavitation in hydraulic circuits. Energy 2015, 83, 576–582. [Google Scholar] [CrossRef]
- Ge, M.; Manikkam, P.; Ghossein, J.; Subramanian, R.K.; Coutier-Delgosha, O.; Zhang, G. Dynamic mode decomposition to classify cavitating flow regimes induced by thermodynamic effects. J. Energy 2022, 254, 124426. [Google Scholar] [CrossRef]
- Ge, M.; Sun, C.; Zhang, G.; Coutier-Delgosha, O.; Fan, D. Combined suppression effects on hydrodynamic cavitation performance in Venturi-type reactor for process intensification. Ultrason. Sonochem. 2022, 86, 106035. [Google Scholar] [CrossRef]
- Ge, M.; Petkovšek, M.; Zhang, G.; Jacobs, D.; Coutier-Delgosha, O. Cavitation dynamics and thermodynamic effects at elevated temperatures in a small Venturi channel. Int. J. Heat Mass Transf. 2021, 170, 120970. [Google Scholar] [CrossRef]
- Sun, Z.-Y.; Li, G.-X.; Chen, C.; Yu, Y.-S.; Gao, G.-X. Numerical investigation on effects of nozzle’s geometric parameters on the flow and the cavitation characteristics within injector’s nozzle for a high-pressure common-rail DI diesel engine. Energy Convers. Manag. 2015, 89, 843–861. [Google Scholar] [CrossRef]
- Jia, M.; Xie, M.; Liu, H.; Lam, W.-H.; Wang, T. Numerical simulation of cavitation in the conical-spray nozzle for diesel premixed charge compression ignition engines. Fuel 2011, 90, 2652–2661. [Google Scholar] [CrossRef]
- Hu, B.; Yao, Y.; Wang, M.; Wang, C.; Liu, Y. Flow and Performance of the Disk Cavity of a Marine Gas Turbine at Varying Nozzle Pressure and Low Rotation Speeds: A Numerical Investigation. J. Mach. 2023, 11, 68. [Google Scholar] [CrossRef]
- Sun, Z.; Li, D.; Mao, Y.; Feng, L.; Zhang, Y.; Liu, C. Anti-cavitation optimal design and experimental research on tidal turbines based on im-proved inverse BEM. Energy 2022, 239, 122263. [Google Scholar] [CrossRef]
- Wang, X.; Wang, Y.; Liu, H.; Xiao, Y.; Jiang, L.; Li, M. A numerical investigation on energy characteristics of centrifugal pump for cavitation flow using entropy production theory. J. Int. J. Heat Mass Transf. 2023, 201, 123591. [Google Scholar] [CrossRef]
- Liang, J.; Luo, X.; Liu, Y.; Li, X.; Shi, T. A numerical investigation in effects of inlet pressure fluctuations on the flow and cavitation characteristics inside water hydraulic poppet valves. J. Int. J. Heat Mass Transf. 2016, 103, 684–700. [Google Scholar] [CrossRef]
- Ouyang, T.; Mo, X.; Lu, Y.; Wang, J. CFD-vibration coupled model for predicting cavitation in gear transmissions. Int. J. Mech. Sci. 2022, 225, 107377. [Google Scholar] [CrossRef]
- Wang, C.; Chen, X.; Ge, J.; Cao, W.; Zhang, Q.; Zhu, Y.; Chang, H. Internal Flow Characteristics of High-Specific-Speed Centrifugal Pumps with Different Number of Impeller Blades under Large Flow Conditions. J. Mach. 2023, 11, 138. [Google Scholar] [CrossRef]
- Del Campo, D.; Castilla, R.; Raush, G.A.; Montero, P.J.G.; Codina, E. Numerical Analysis of External Gear Pumps Including Cavitation. J. Fluids Eng. 2012, 134, 081105. [Google Scholar] [CrossRef]
- del Campo, D.; Castilla, R.; Raush, G.; Gamez-Montero, P.; Codina, E. Pressure effects on the performance of external gear pumps under cavitation. Proc. Inst. Mech. Eng. Part C J. Mech. Eng. Sci. 2014, 228, 2925–2937. [Google Scholar] [CrossRef]
- Xi, S.; Zhang, D.; Xu, B.; Shi, W.; van Esch, B.B. Experimental and numerical investigation on the effect of tip leakage vortex induced cavitating flow on pressure fluctuation in an axial flow pump. J. Energy 2021, 163, 1195–1209. [Google Scholar] [CrossRef]
- Chen, J.; Zheng, Y.; Zhang, L.; He, G.; Zou, Y.; Xiao, Z. Optimization of geometric parameters of hydraulic turbine runner in turbine mode based on the orthogonal test method and CFD. J. Energy Rep. 2022, 8, 14476–14487. [Google Scholar] [CrossRef]
- Zare, S.; Kargari, A. CFD simulation and optimization of an energy-efficient direct contact membrane distillation(DCMD) desalination system. J. Chem. Eng. Res. Des. 2022, 188, 655–667. [Google Scholar] [CrossRef]
- Prakash, N.; Chaudhuri, A.; Das, S.P. Numerical modelling and analysis of concentration polarization and scaling of gypsum over RO membrane during seawater desalination. J. Chem. Eng. Res. Des. 2023, 190, 497–507. [Google Scholar] [CrossRef]
- Khanjanpour, M.H.; Javadi, A.A. Optimization of a Horizontal Axis Tidal (HAT) turbine for powering a Reverse Osmosis (RO) desalination system using Computational Fluid Dynamics (CFD) and Taguchi method. Energy Convers. Manag. 2021, 231, 113833. [Google Scholar] [CrossRef]
- Wang, Z.; Wang, Y.; Zhuang, M. Improvement of the aerodynamic performance of vertical axis wind turbines with leading-edge serrations and helical blades using CFD and Taguchi method. Energy Convers. Manag. 2018, 177, 107–121. [Google Scholar] [CrossRef]
- Ye, F.; Deng, J.; Liu, K. CFD Simulation on Cavitation in a Rotary Vane Energy Recovery Device. Energy Procedia 2019, 158, 4785–4790. [Google Scholar] [CrossRef]
- Ye, F.; Bianchi, G.; Rane, S.; Tassou, S.A.; Deng, J. Numerical methodology and CFD simulations of a rotary vane energy recovery device for seawater reverse osmosis desalination systems. J. Appl. Therm. Eng. 2021, 190, 116788. [Google Scholar] [CrossRef]
- Yu, L.; Yi-Hui, Z.; Ming-Shua, B. 3D numerical simulation on mixing process in ducts of rotary pressure exchanger. J. Desalin. Water Treat. 2012, 42, 269–273. [Google Scholar]
- Liu, K.; Deng, J.; Ye, F. Numerical simulation of flow structures in a rotary type energy recovery device. J. Desalination 2019, 449, 101–110. [Google Scholar] [CrossRef]
- Cao, Z.; Deng, J.Q.; Yuan, W.J.; Chen, Z.H. Integration of CFD and RTD analysis in flow pattern and mixing behavior of rotary pressure exchanger with extended angle. J. Desalin. Water Treat. 2012, 57, 15265–15275. [Google Scholar] [CrossRef]
- Xu, E.; Wang, Y.; Zhou, J.; Xu, S.; Wang, S. Theoretical investigations on rotor speed of the self-driven rotary energy recovery device through CFD simulation. J. Desalination 2016, 398, 189–197. [Google Scholar] [CrossRef]
- Ye, F.; Deng, J.; Cao, Z.; Liu, K. Study of energy recovery efficiency in a sliding vane pressure exchanger for a SWRO system. Desalination Water Treat. 2018, 119, 150–159. [Google Scholar] [CrossRef]
- Anderson, M.J.; Whitcomb, P.J. RSM Simplified: Optimizing Processes Using Response Surface Methods for Design of Experiments; Productivity Press: New York, NY, USA, 2016. [Google Scholar]
Figure 1.
Structural composition.
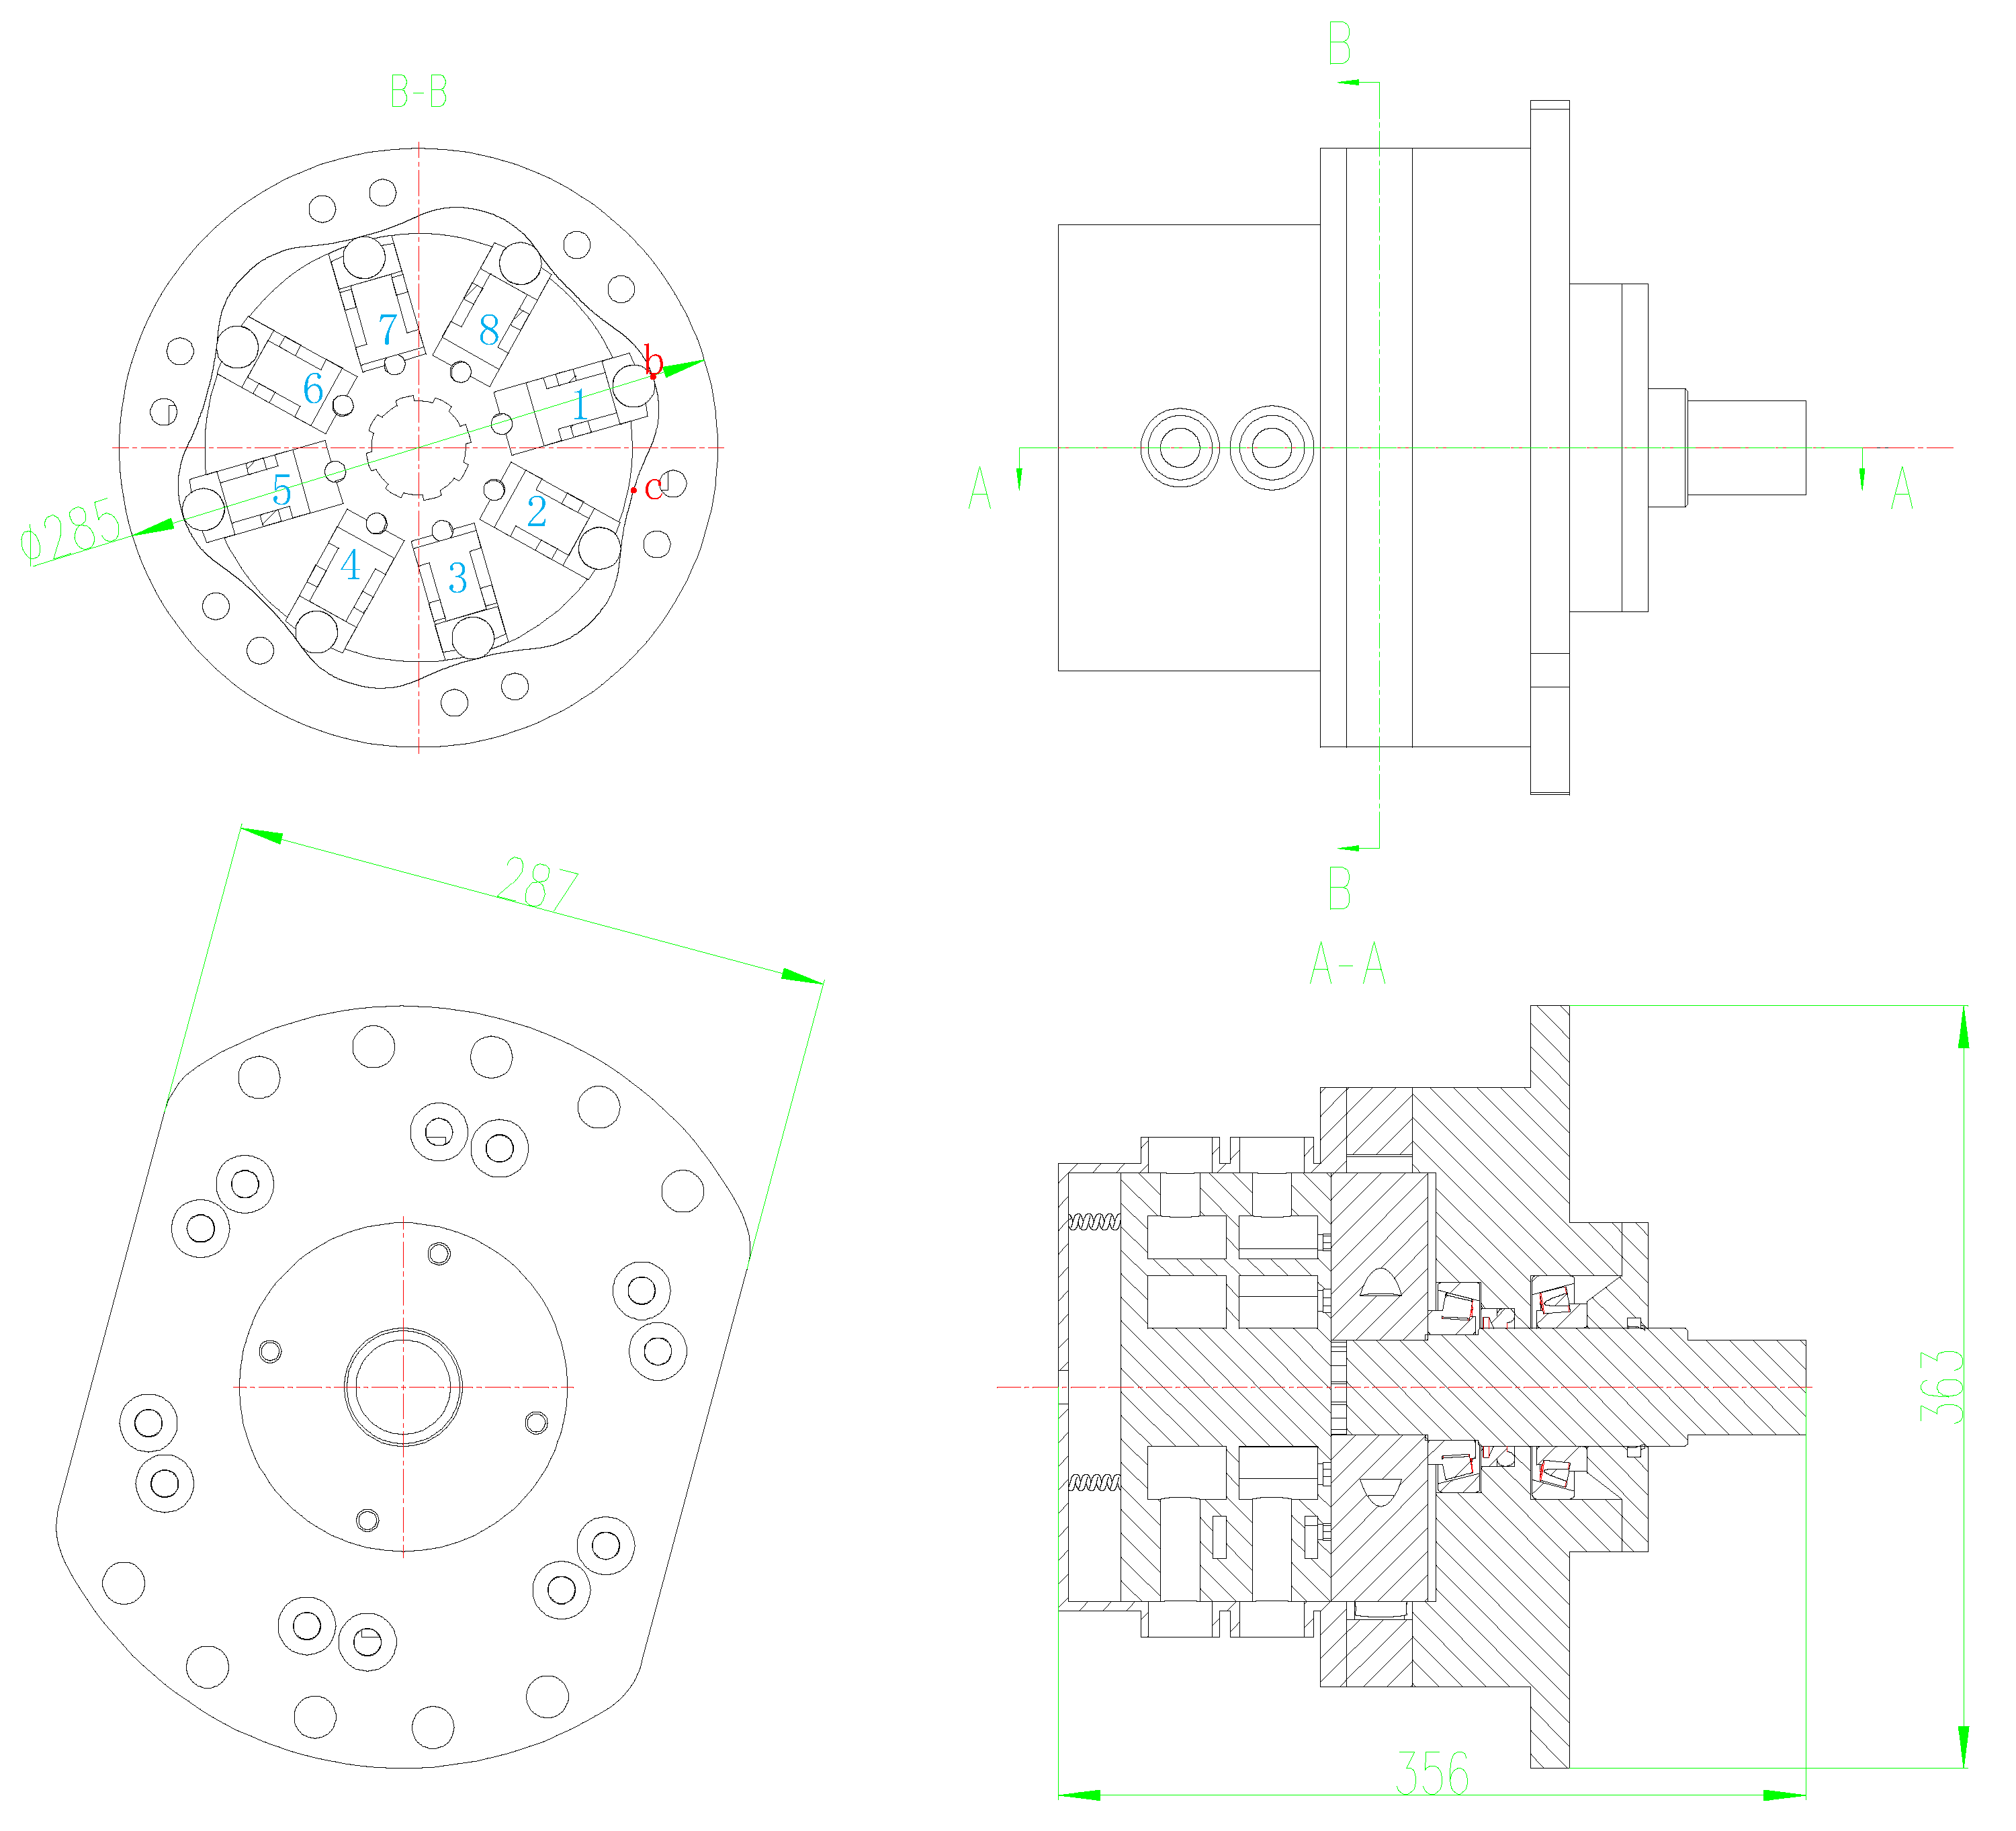
Figure 2.
Specific structure of the port plate.
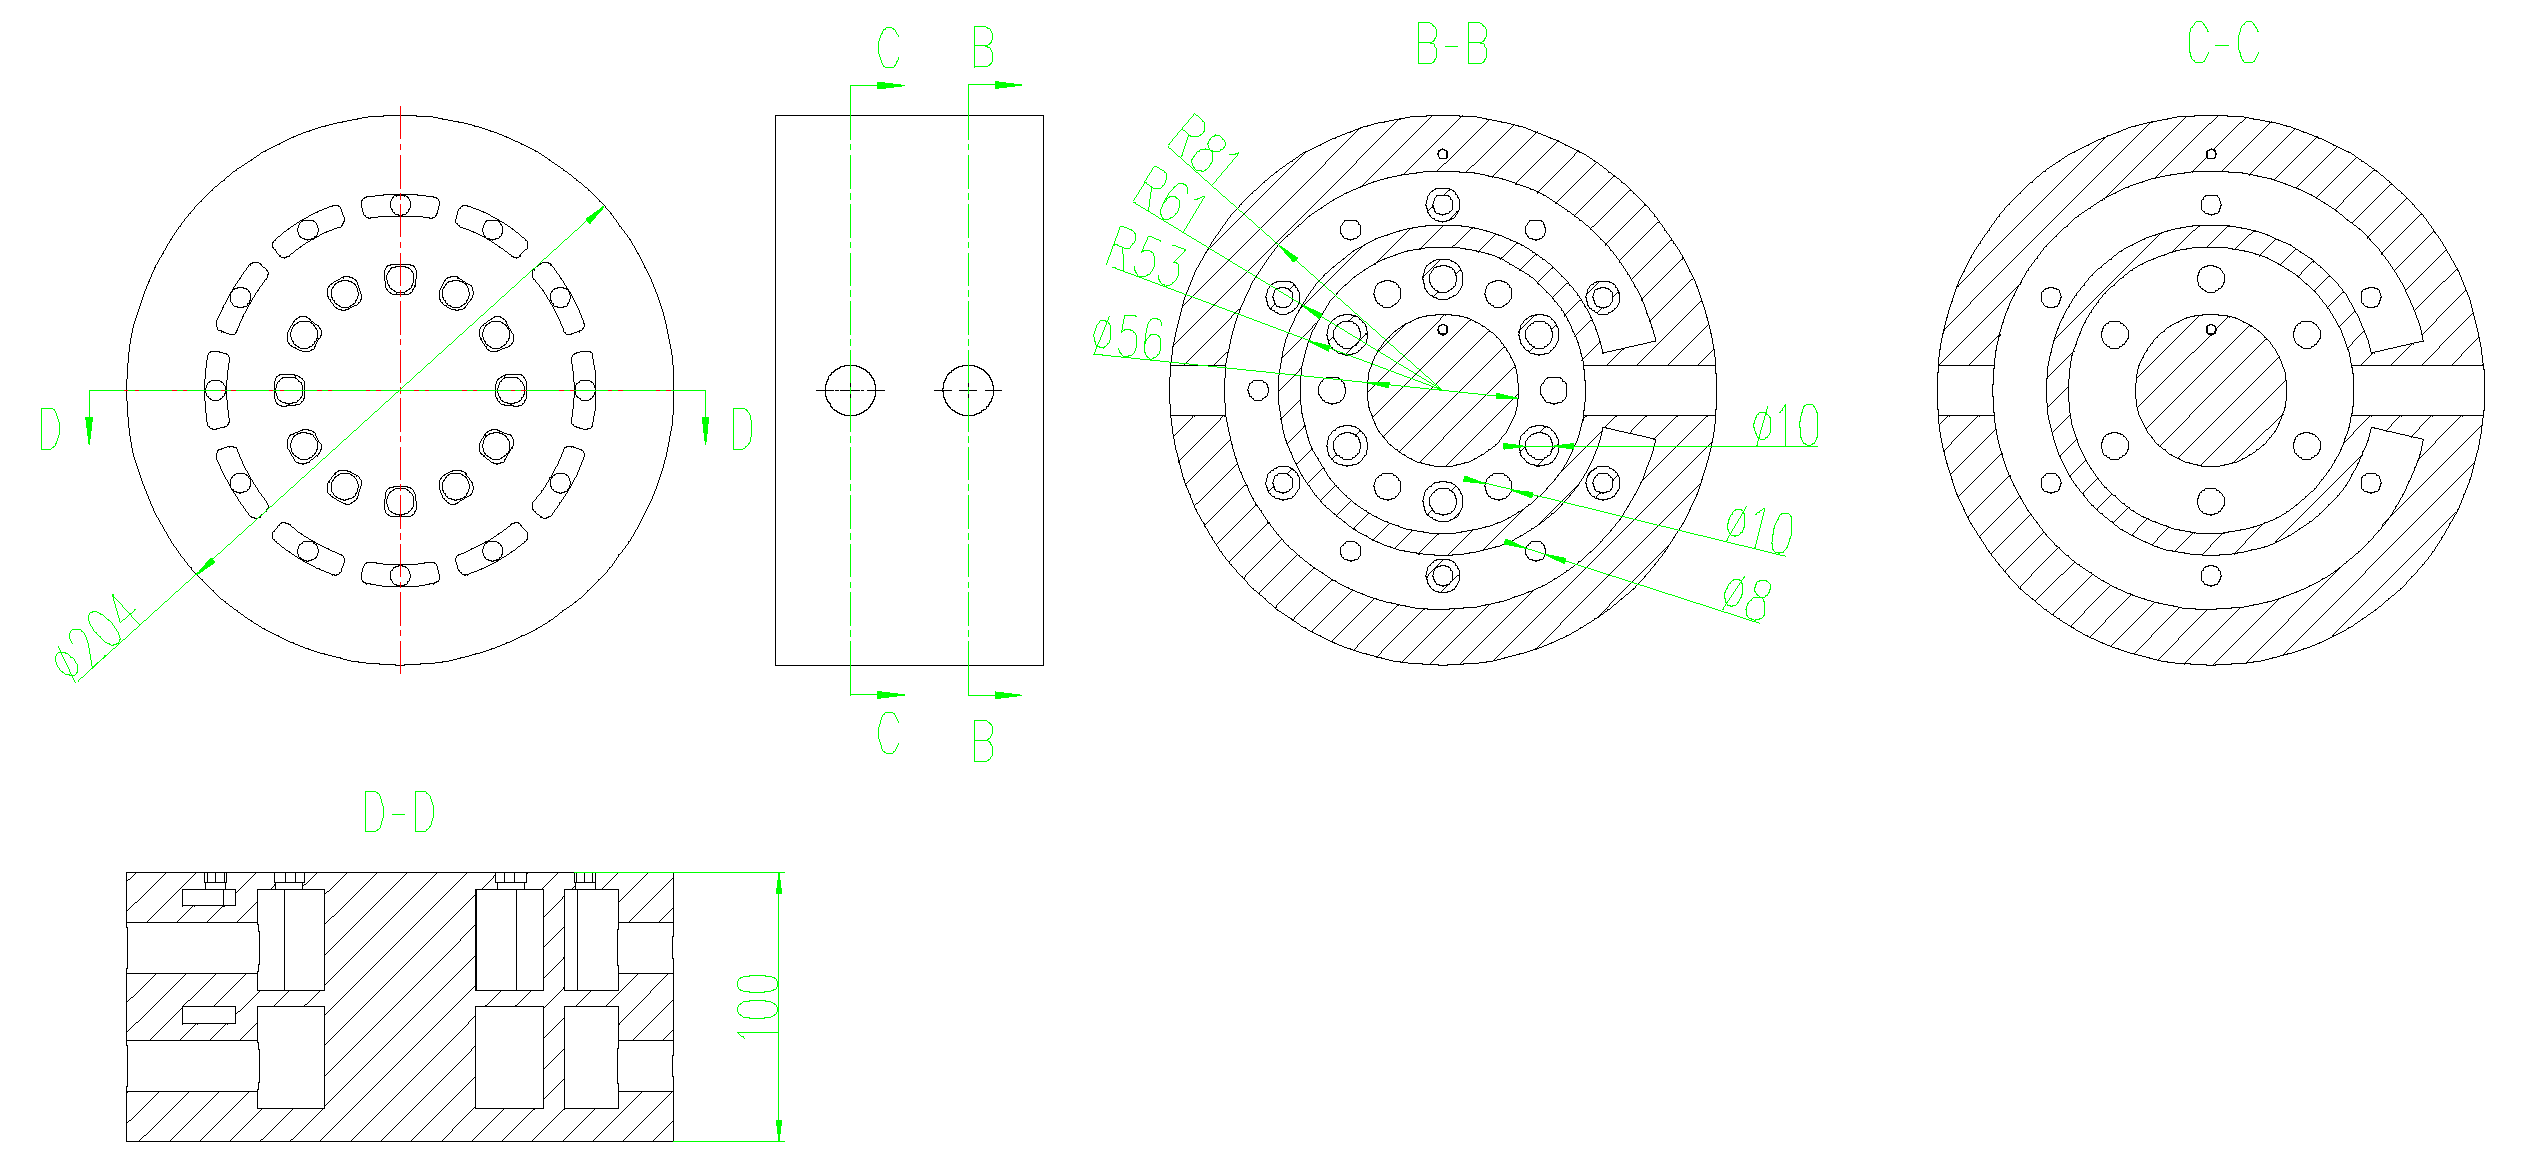
Figure 3.
Fluid domain meshing.

Figure 4.
Outlet mass flow curve.
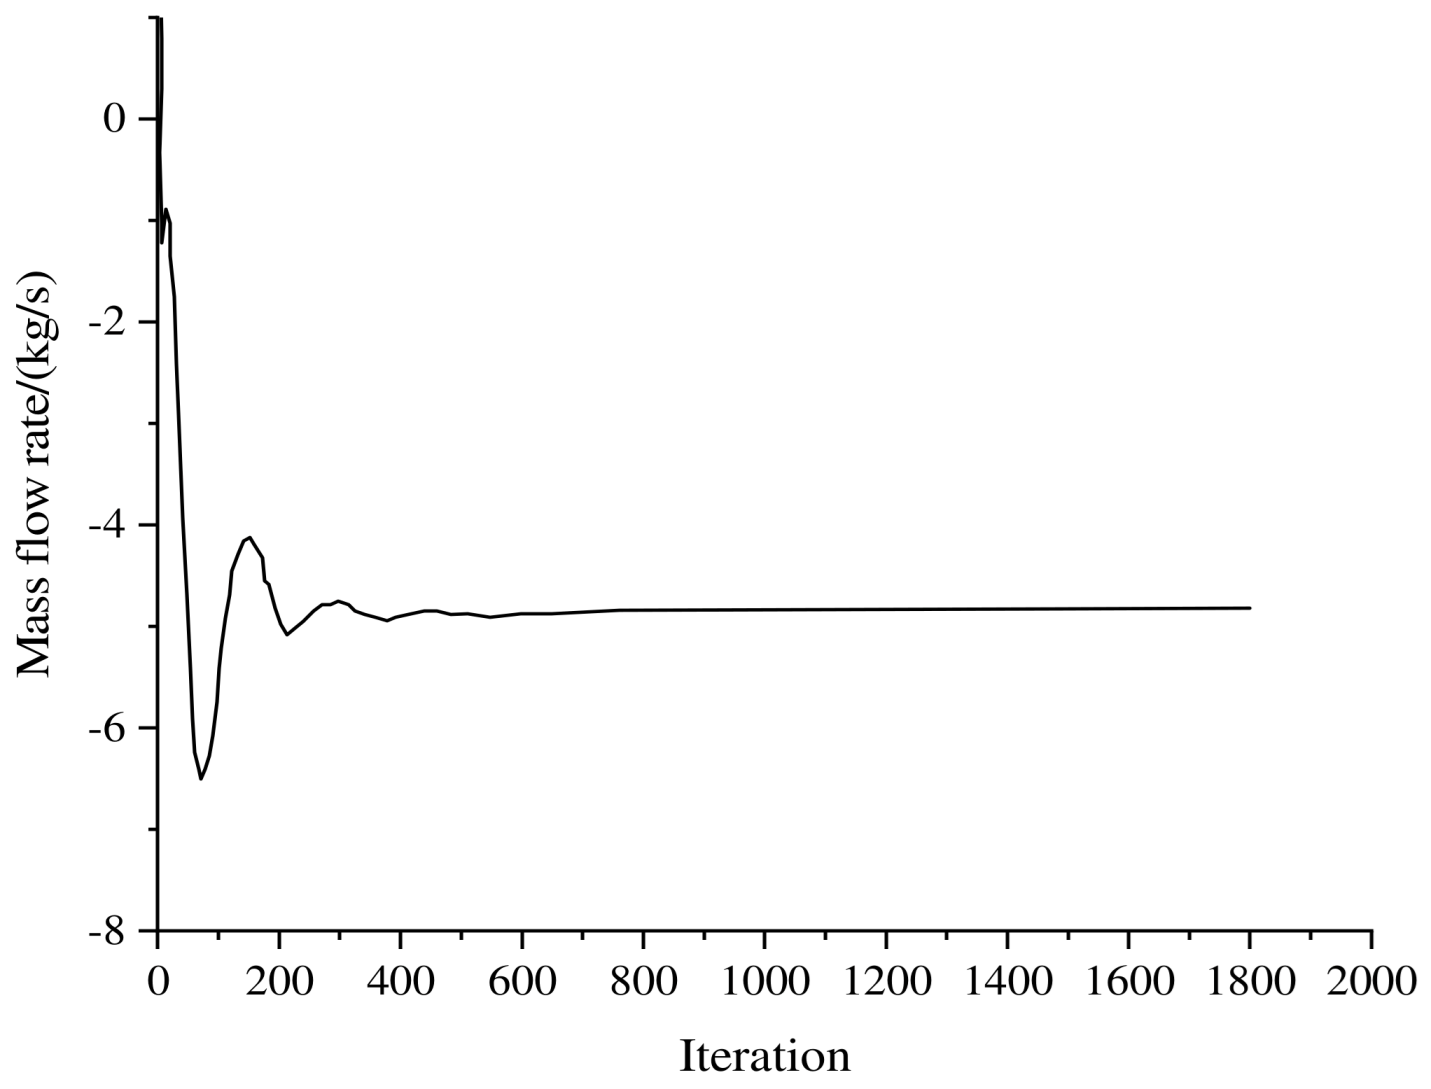
Figure 5.
Grid independence verification.
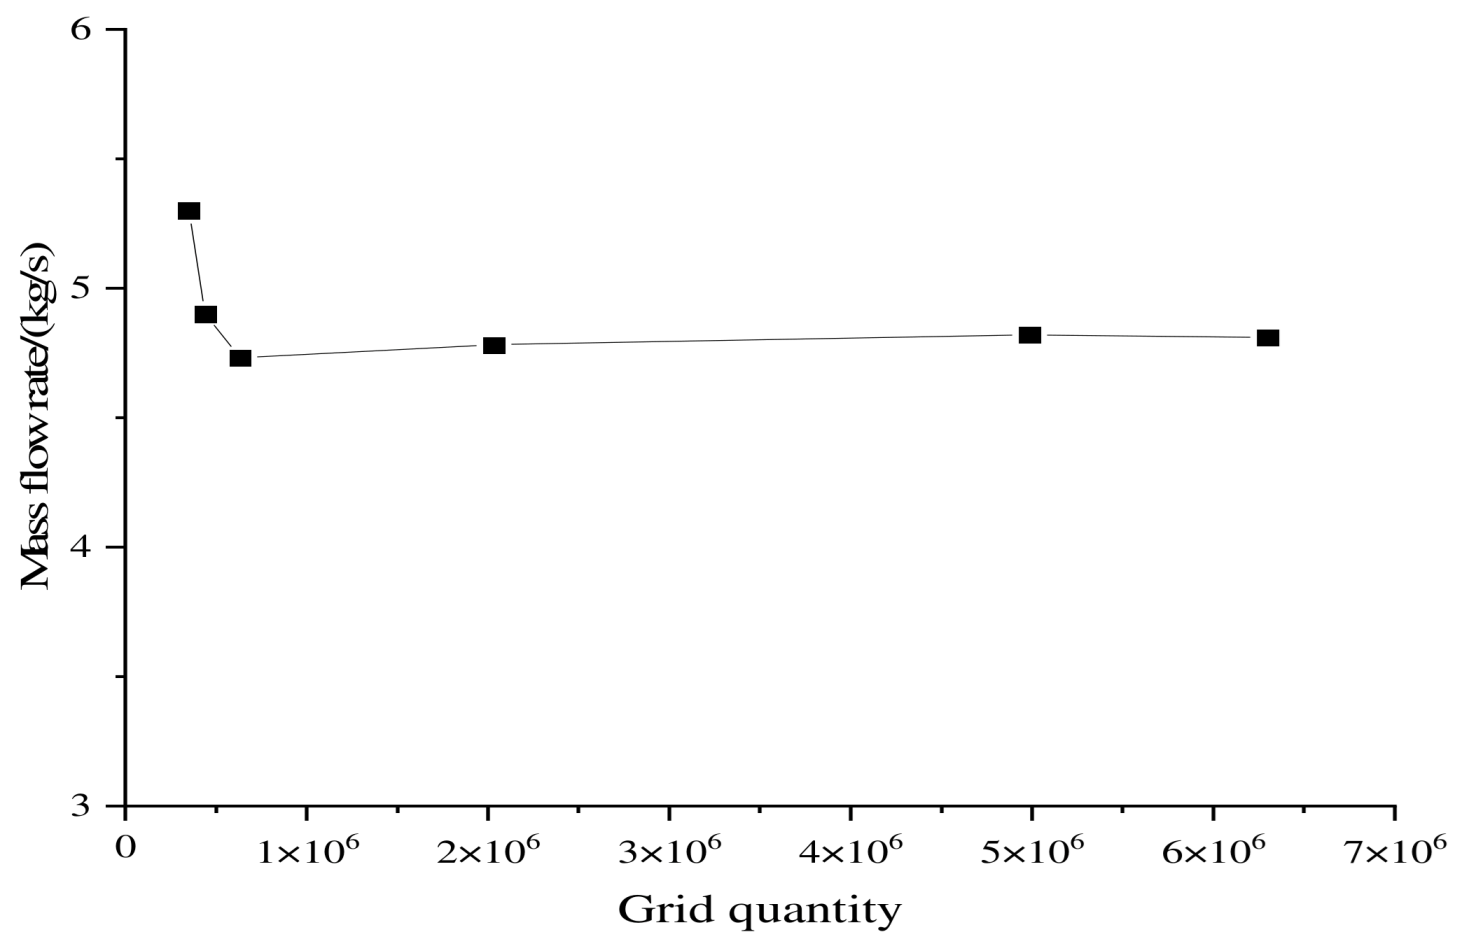
Figure 6.
Pressure field.
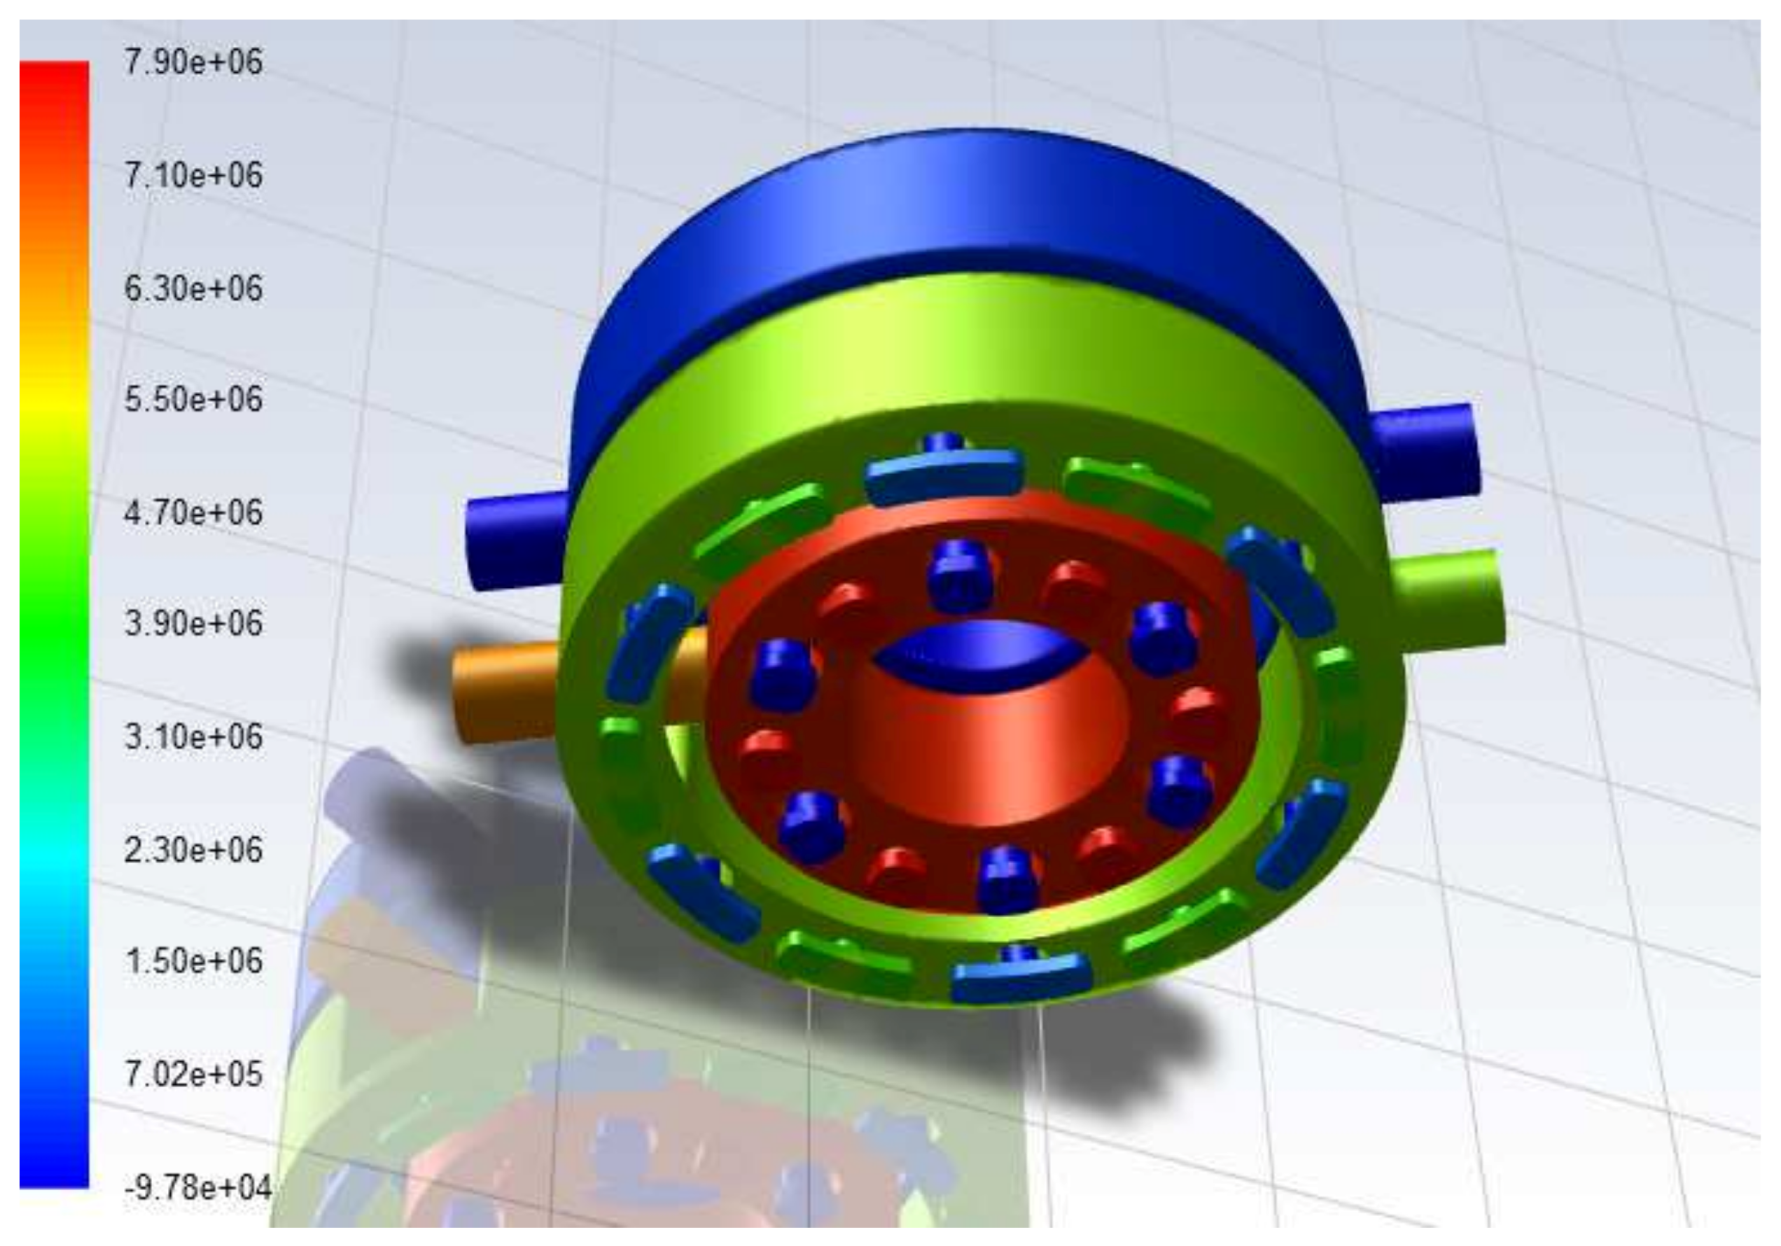
Figure 7.
Pressure field distribution of two sections through the Y-axis.
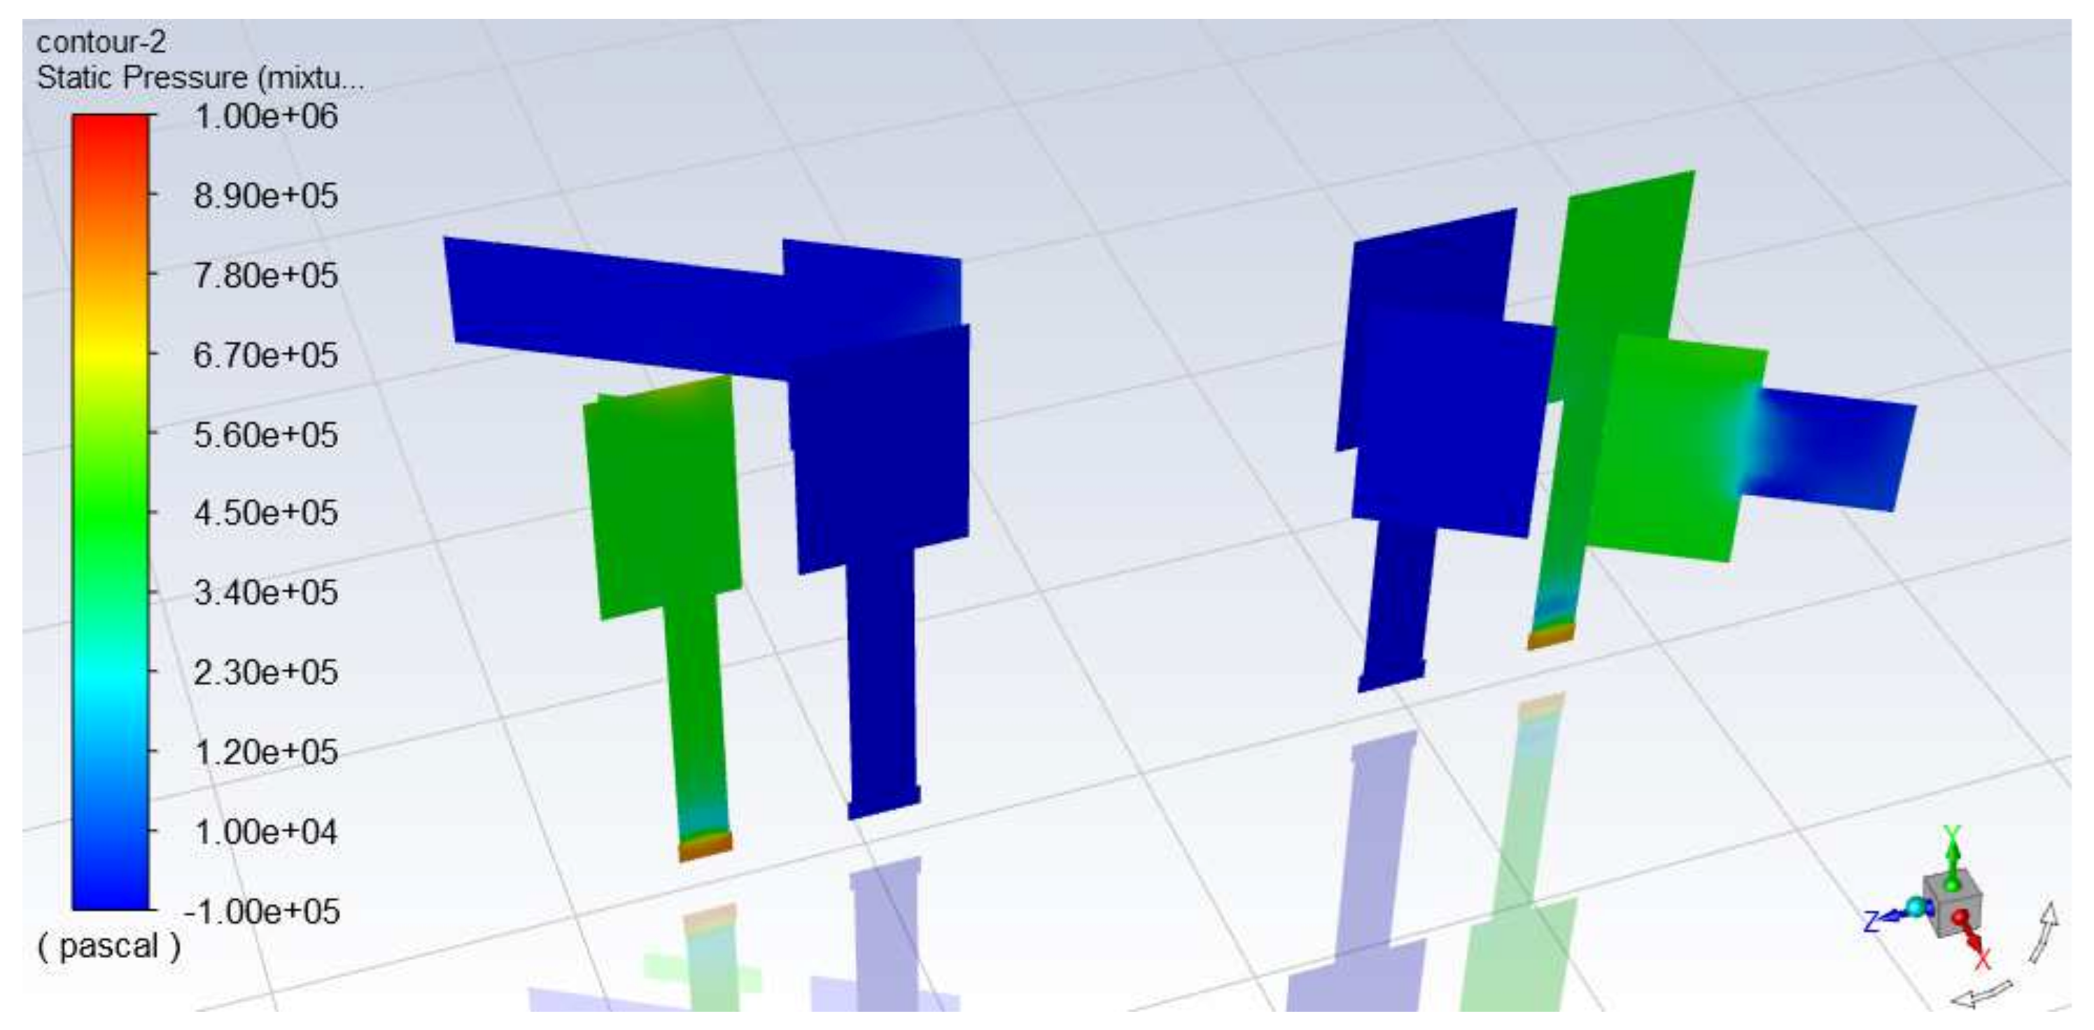
Figure 8.
Vapor volume fraction distribution.
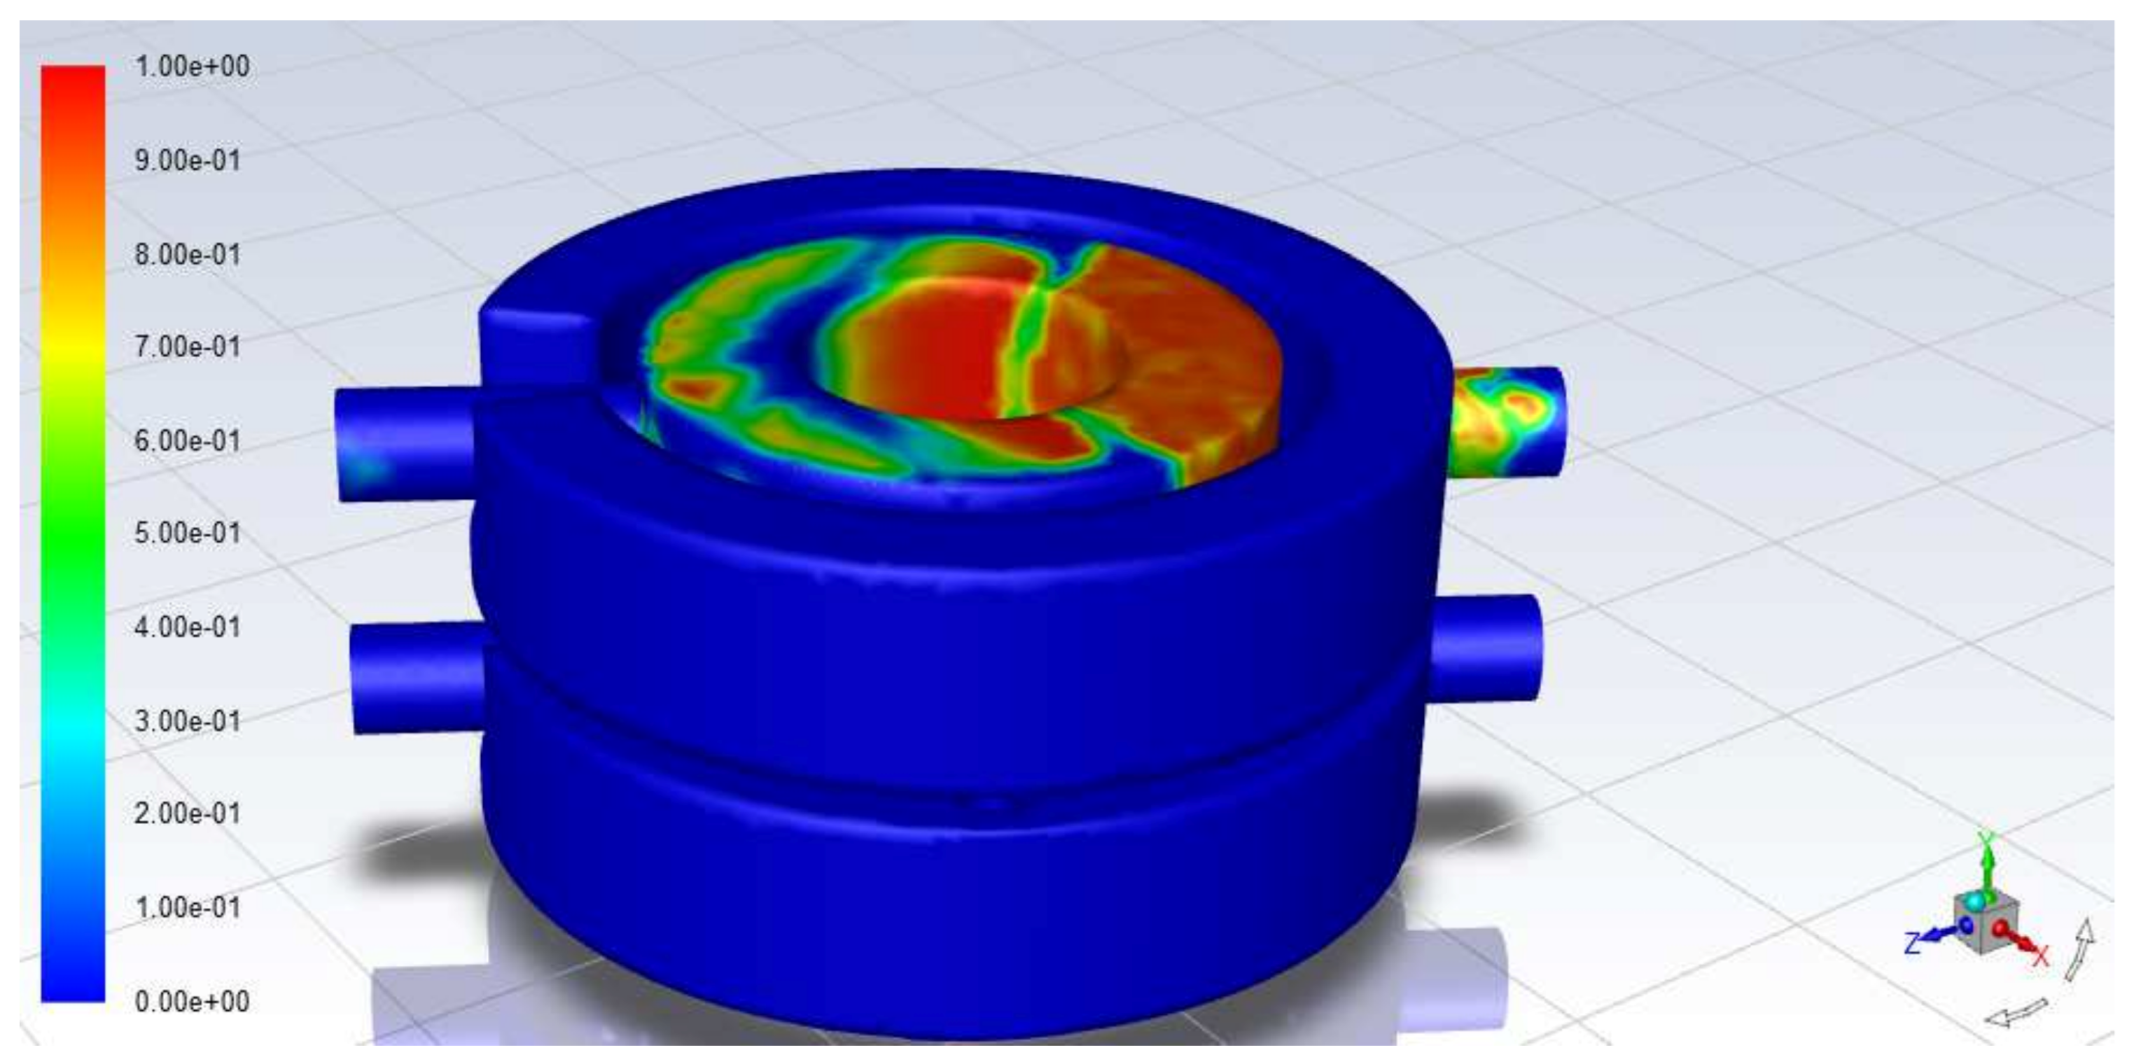
Figure 9.
Vapor volume fraction distribution of two sections through the Y-axis.
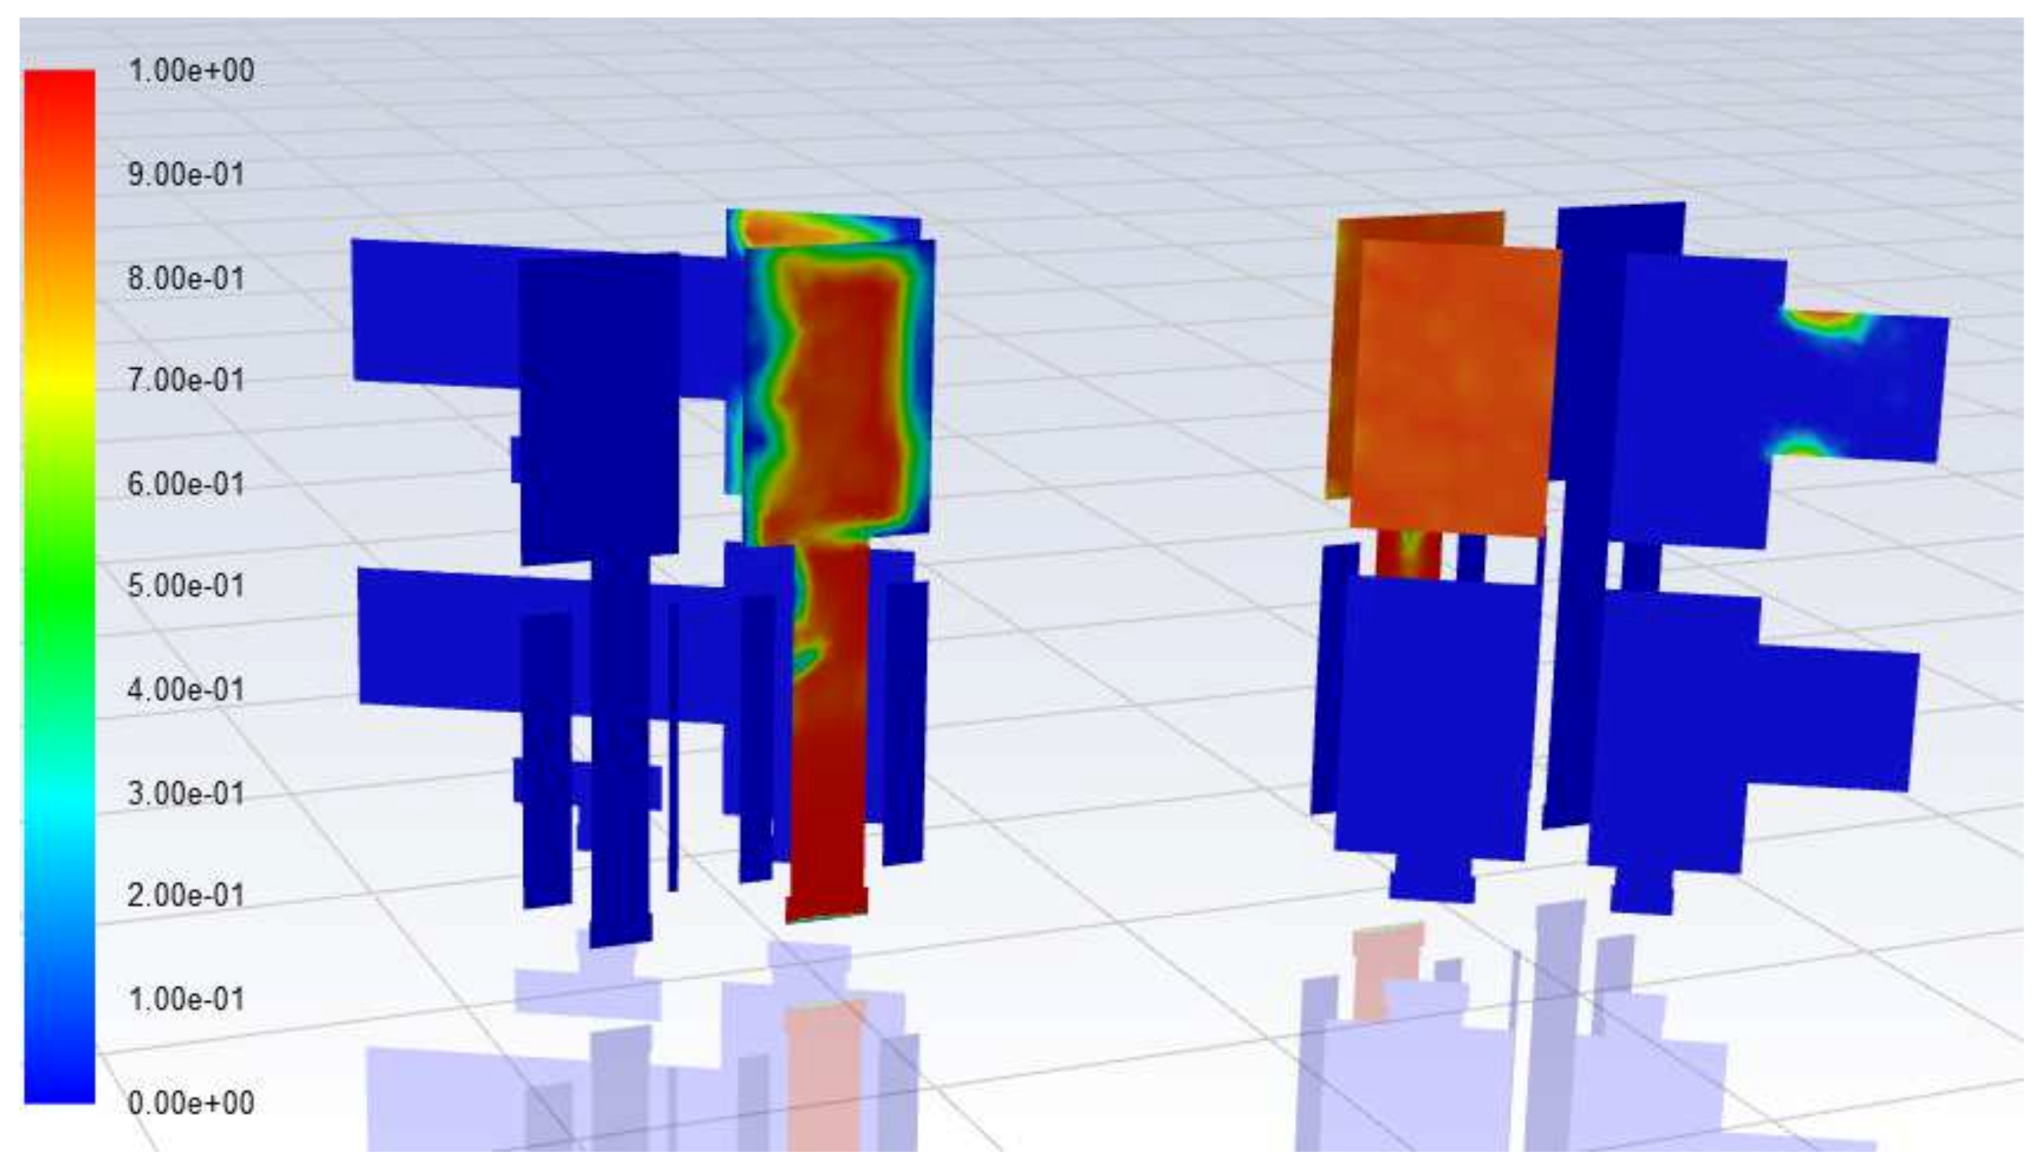
Figure 10.
Location of the monitoring point.

Figure 11.
Cavitation response surface of raw seawater velocity inlet & pressure inlet.

Figure 12.
Vapor volume fraction of the optimized point.
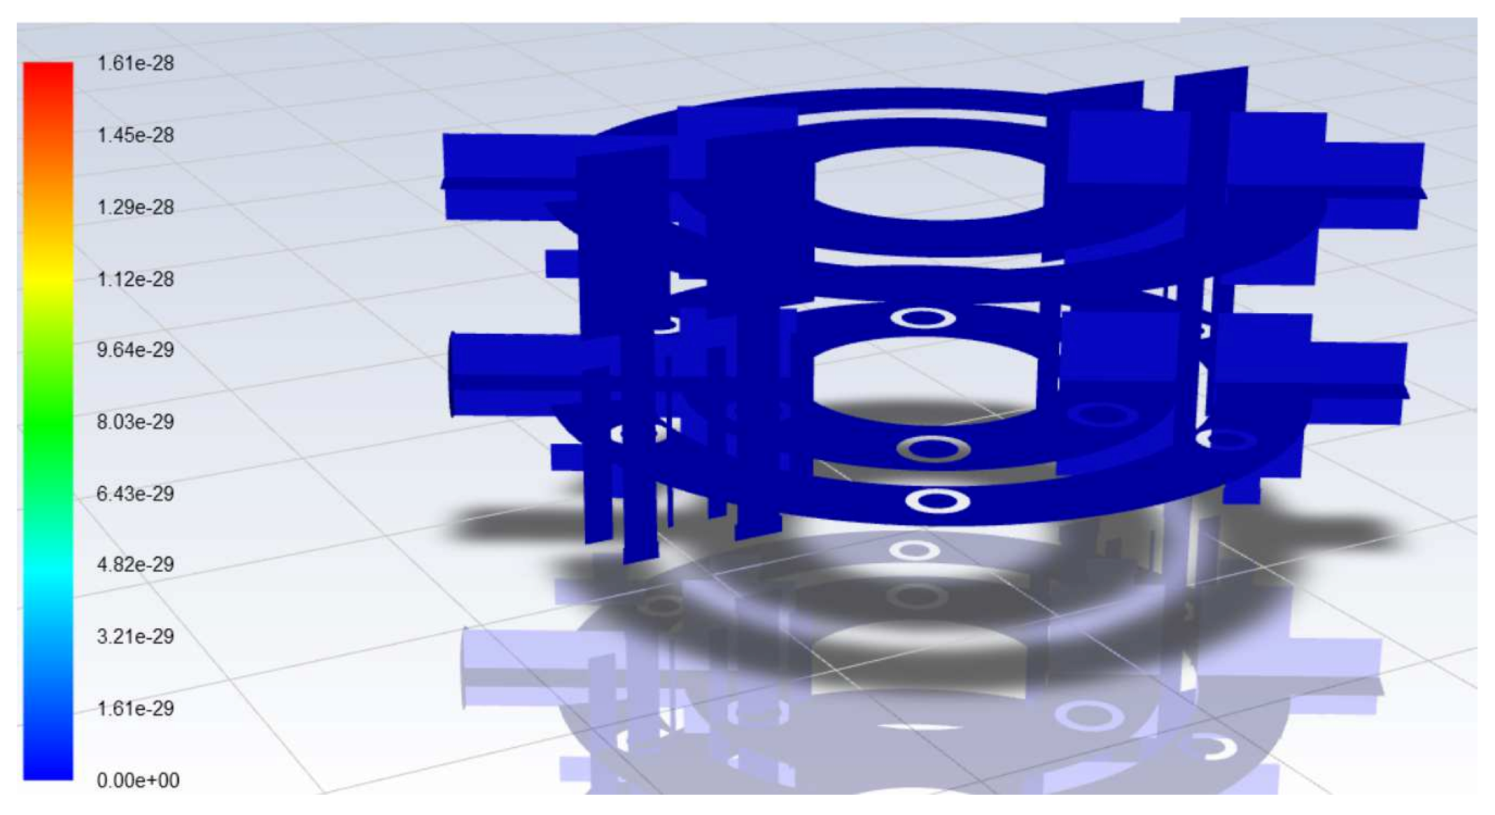
Figure 13.
Pressure field of the optimized point.
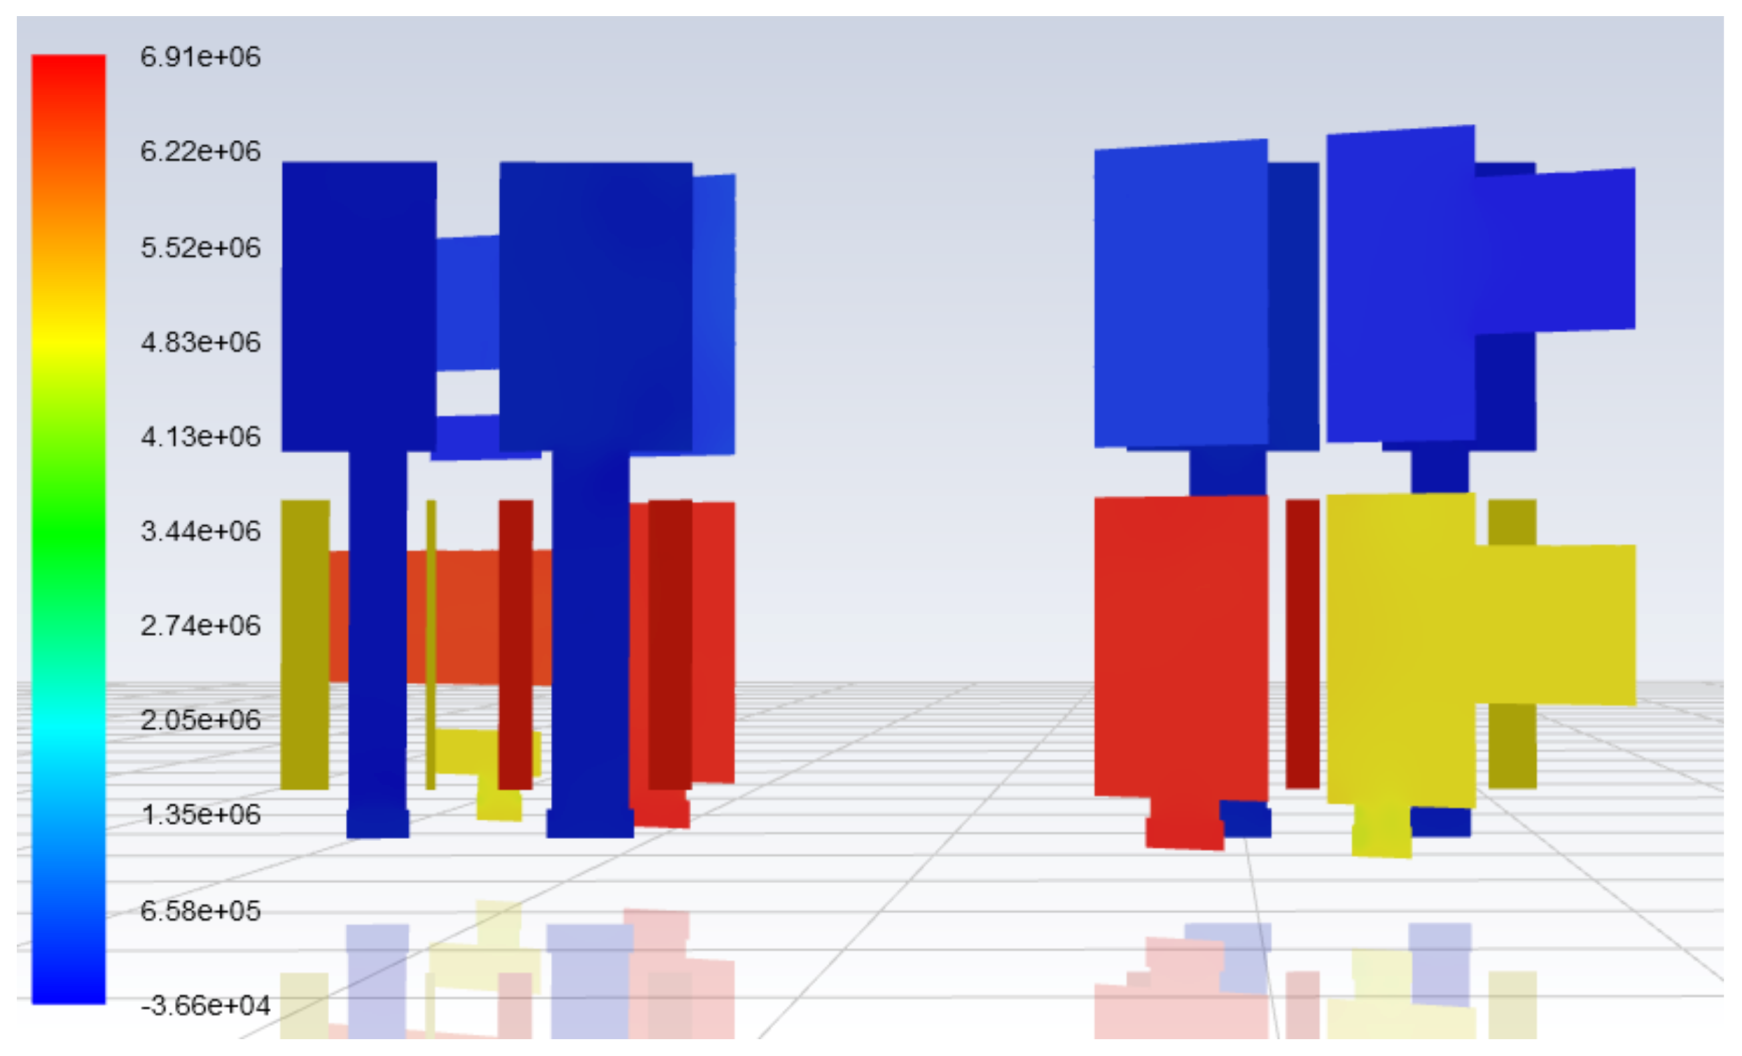
Figure 14.
Experimental schematic diagram.
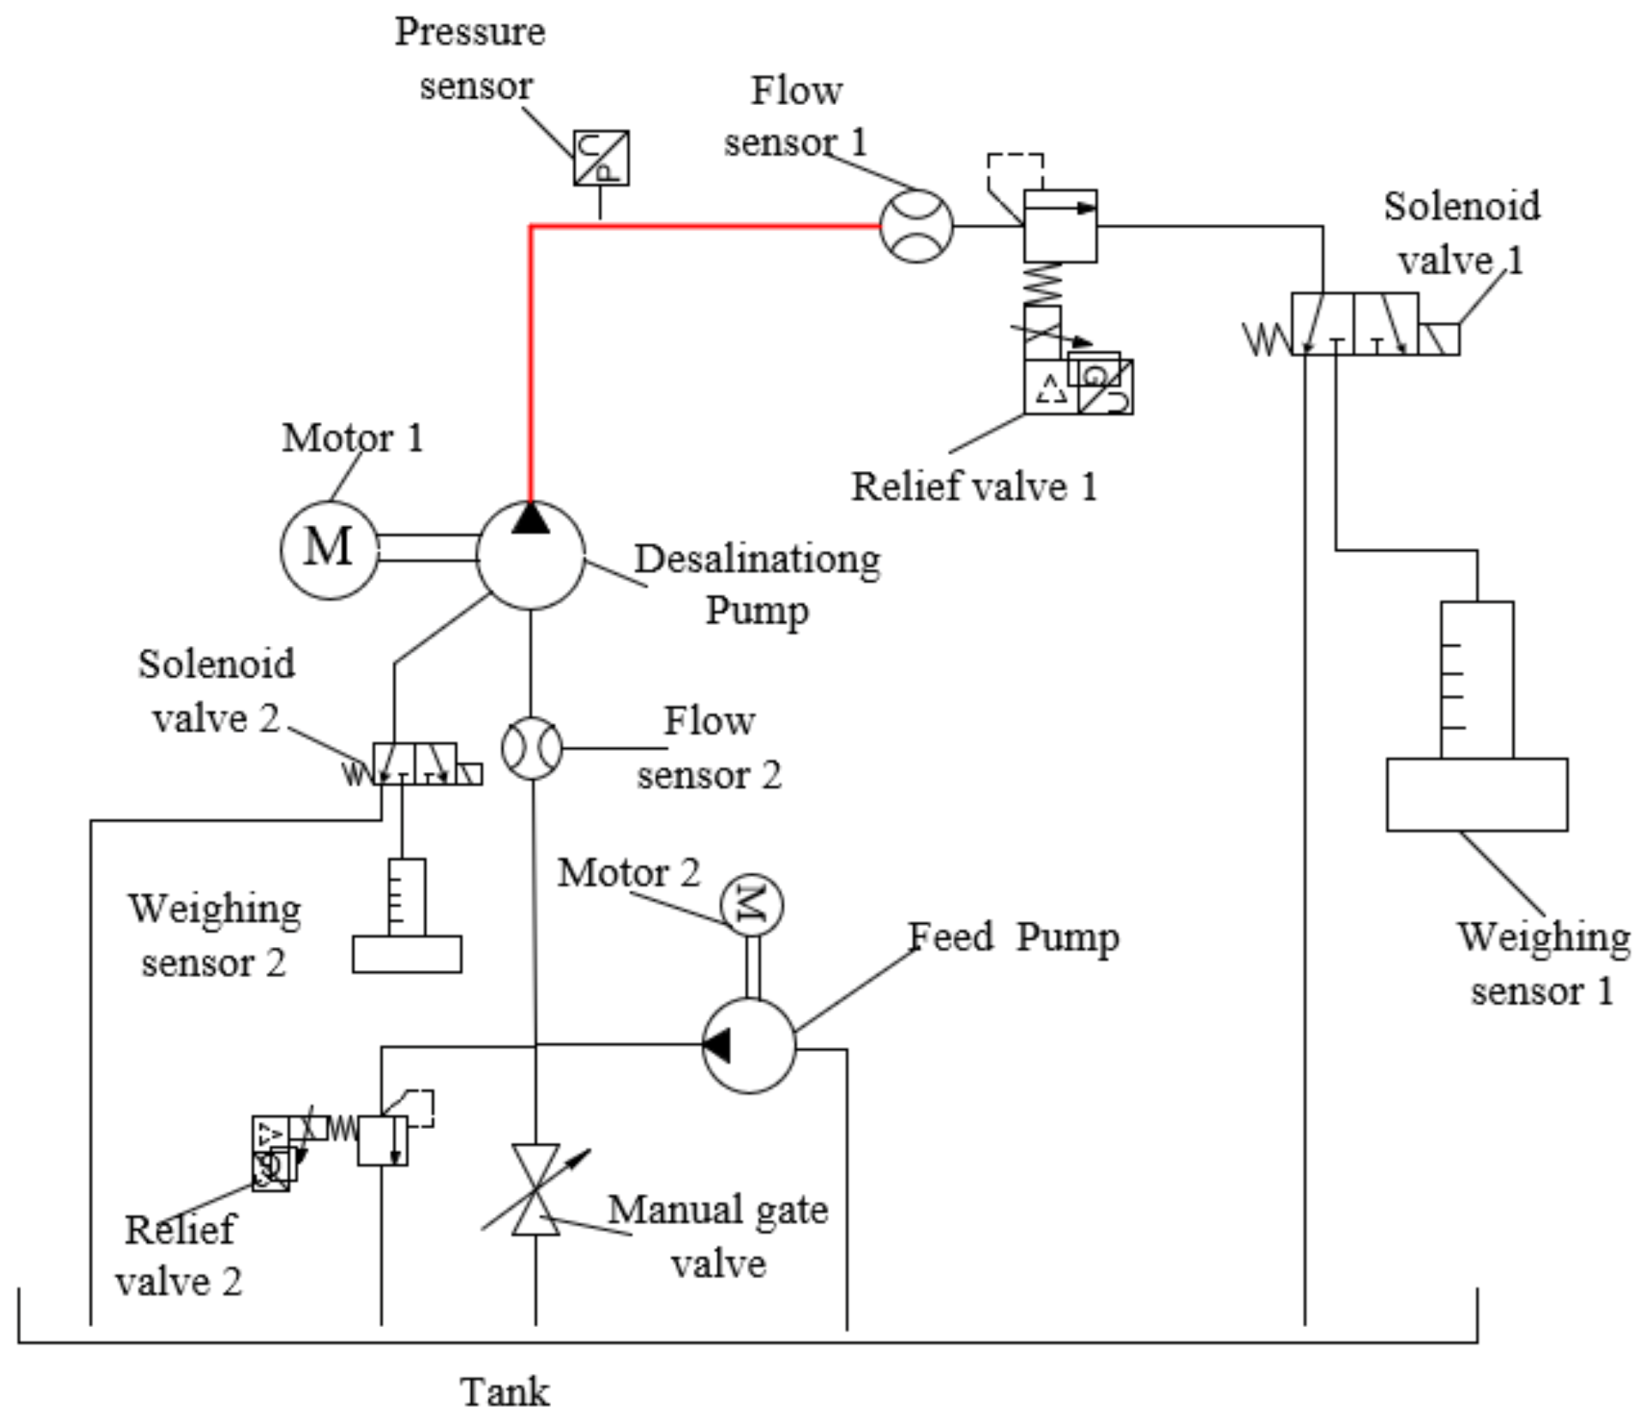
Figure 15.
Mass flow rate and coefficient.

Table 1.
Boundary condition.
| First Group | Second Group | Third Group | Fourth Group |
|---|---|---|---|
| Pri (pa) | Pro (pa) | Pbi (pa) | Pbo (pa) |
| 0 | 6,500,000 | 500,000 | 0 |
| Vro (m/s) | Vri (m/s) | Vbo (m/s) | Vbi (m/s) |
| 13 | 13 | 4.2 | 4.2 |
Table 2.
Sample points.
| Sample Point | Vri (m/s) | Pri (Pa) | Vapor Volume Fraction |
|---|---|---|---|
| 1 | −4.528 | 83,333.3 | 0 |
| 2 | −1.306 | 194,444.4 | 0 |
| 3 | −10.972 | 361,111.1 | 0.977 |
| 4 | −6.139 | 305,555.5 | 0 |
| 5 | −12.583 | 27,777.7 | 0.974 |
| 6 | −9.361 | 138,888.8 | 0.9787 |
| 7 | −7.75 | 472,222.2 | 0 |
| 8 | −2.917 | 416,666.6 | 0 |
| 9 | −14.194 | 250,000 | 0.970 |
Disclaimer/Publisher’s Note: The statements, opinions and data contained in all publications are solely those of the individual author(s) and contributor(s) and not of MDPI and/or the editor(s). MDPI and/or the editor(s) disclaim responsibility for any injury to people or property resulting from any ideas, methods, instructions or products referred to in the content. |
© 2023 by the authors. Licensee MDPI, Basel, Switzerland. This article is an open access article distributed under the terms and conditions of the Creative Commons Attribution (CC BY) license (https://creativecommons.org/licenses/by/4.0/).
Share and Cite
MDPI and ACS Style
Li, W.; Guo, R.; Wang, G.; Zhao, J.; Zhang, Q.; Yu, L.; Zhang, Q. Study on Cavitation of Port Plate of Seawater Desalination Pump with Energy Recovery Function. Processes 2023, 11, 743. https://doi.org/10.3390/pr11030743
AMA Style
Li W, Guo R, Wang G, Zhao J, Zhang Q, Yu L, Zhang Q. Study on Cavitation of Port Plate of Seawater Desalination Pump with Energy Recovery Function. Processes. 2023; 11(3):743. https://doi.org/10.3390/pr11030743
Chicago/Turabian StyleLi, Wenlei, Rui Guo, Guogang Wang, Jingyi Zhao, Qian Zhang, Lin Yu, and Qisheng Zhang. 2023. "Study on Cavitation of Port Plate of Seawater Desalination Pump with Energy Recovery Function" Processes 11, no. 3: 743. https://doi.org/10.3390/pr11030743
Note that from the first issue of 2016, this journal uses article numbers instead of page numbers. See further details here.