
Antioxidant Activity, Total Phenolic and Flavonoid Contents in Floral Saffron Bio-Residues

 ,
,  , , , and
Abstract
:
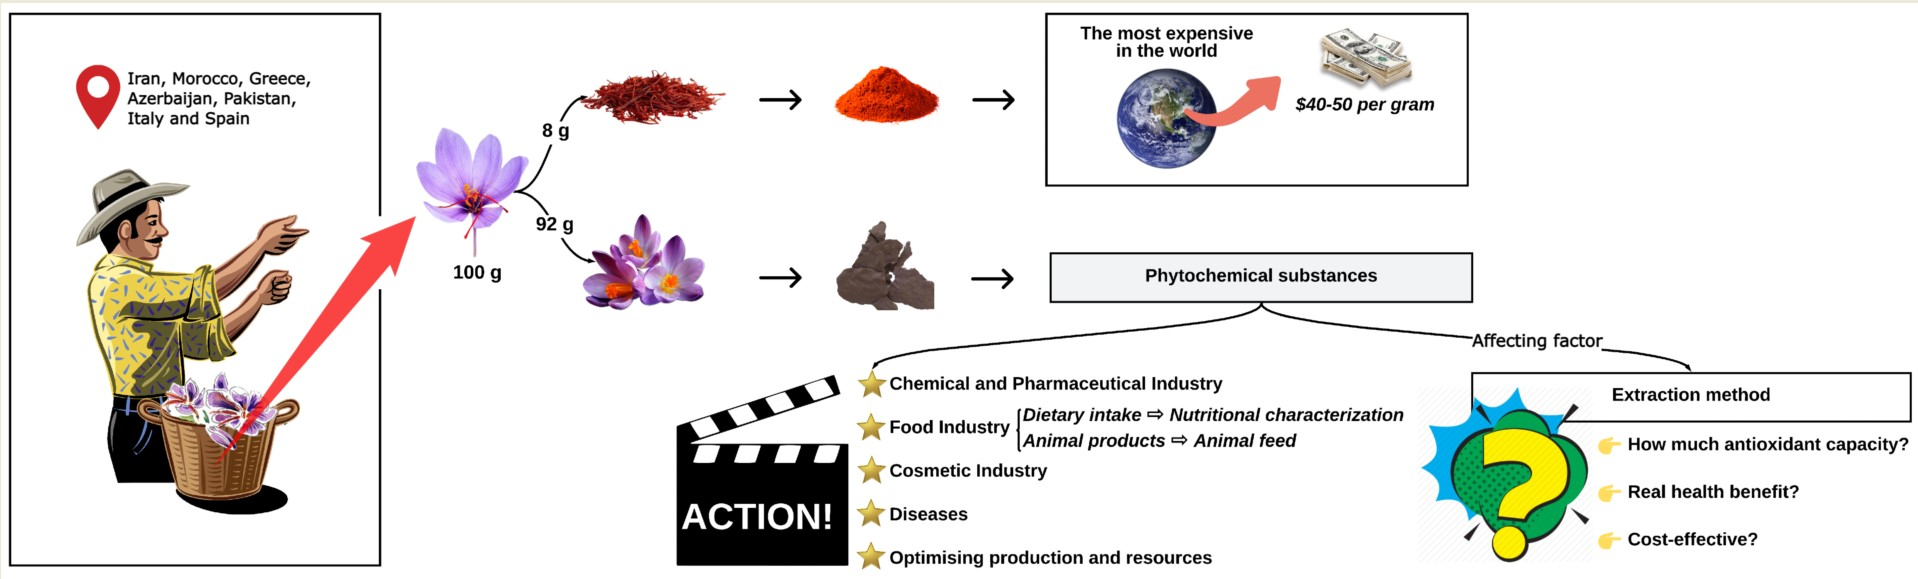
1. Introduction
2. Materials and Methods
2.1. Chemicals
2.2. Plant Material
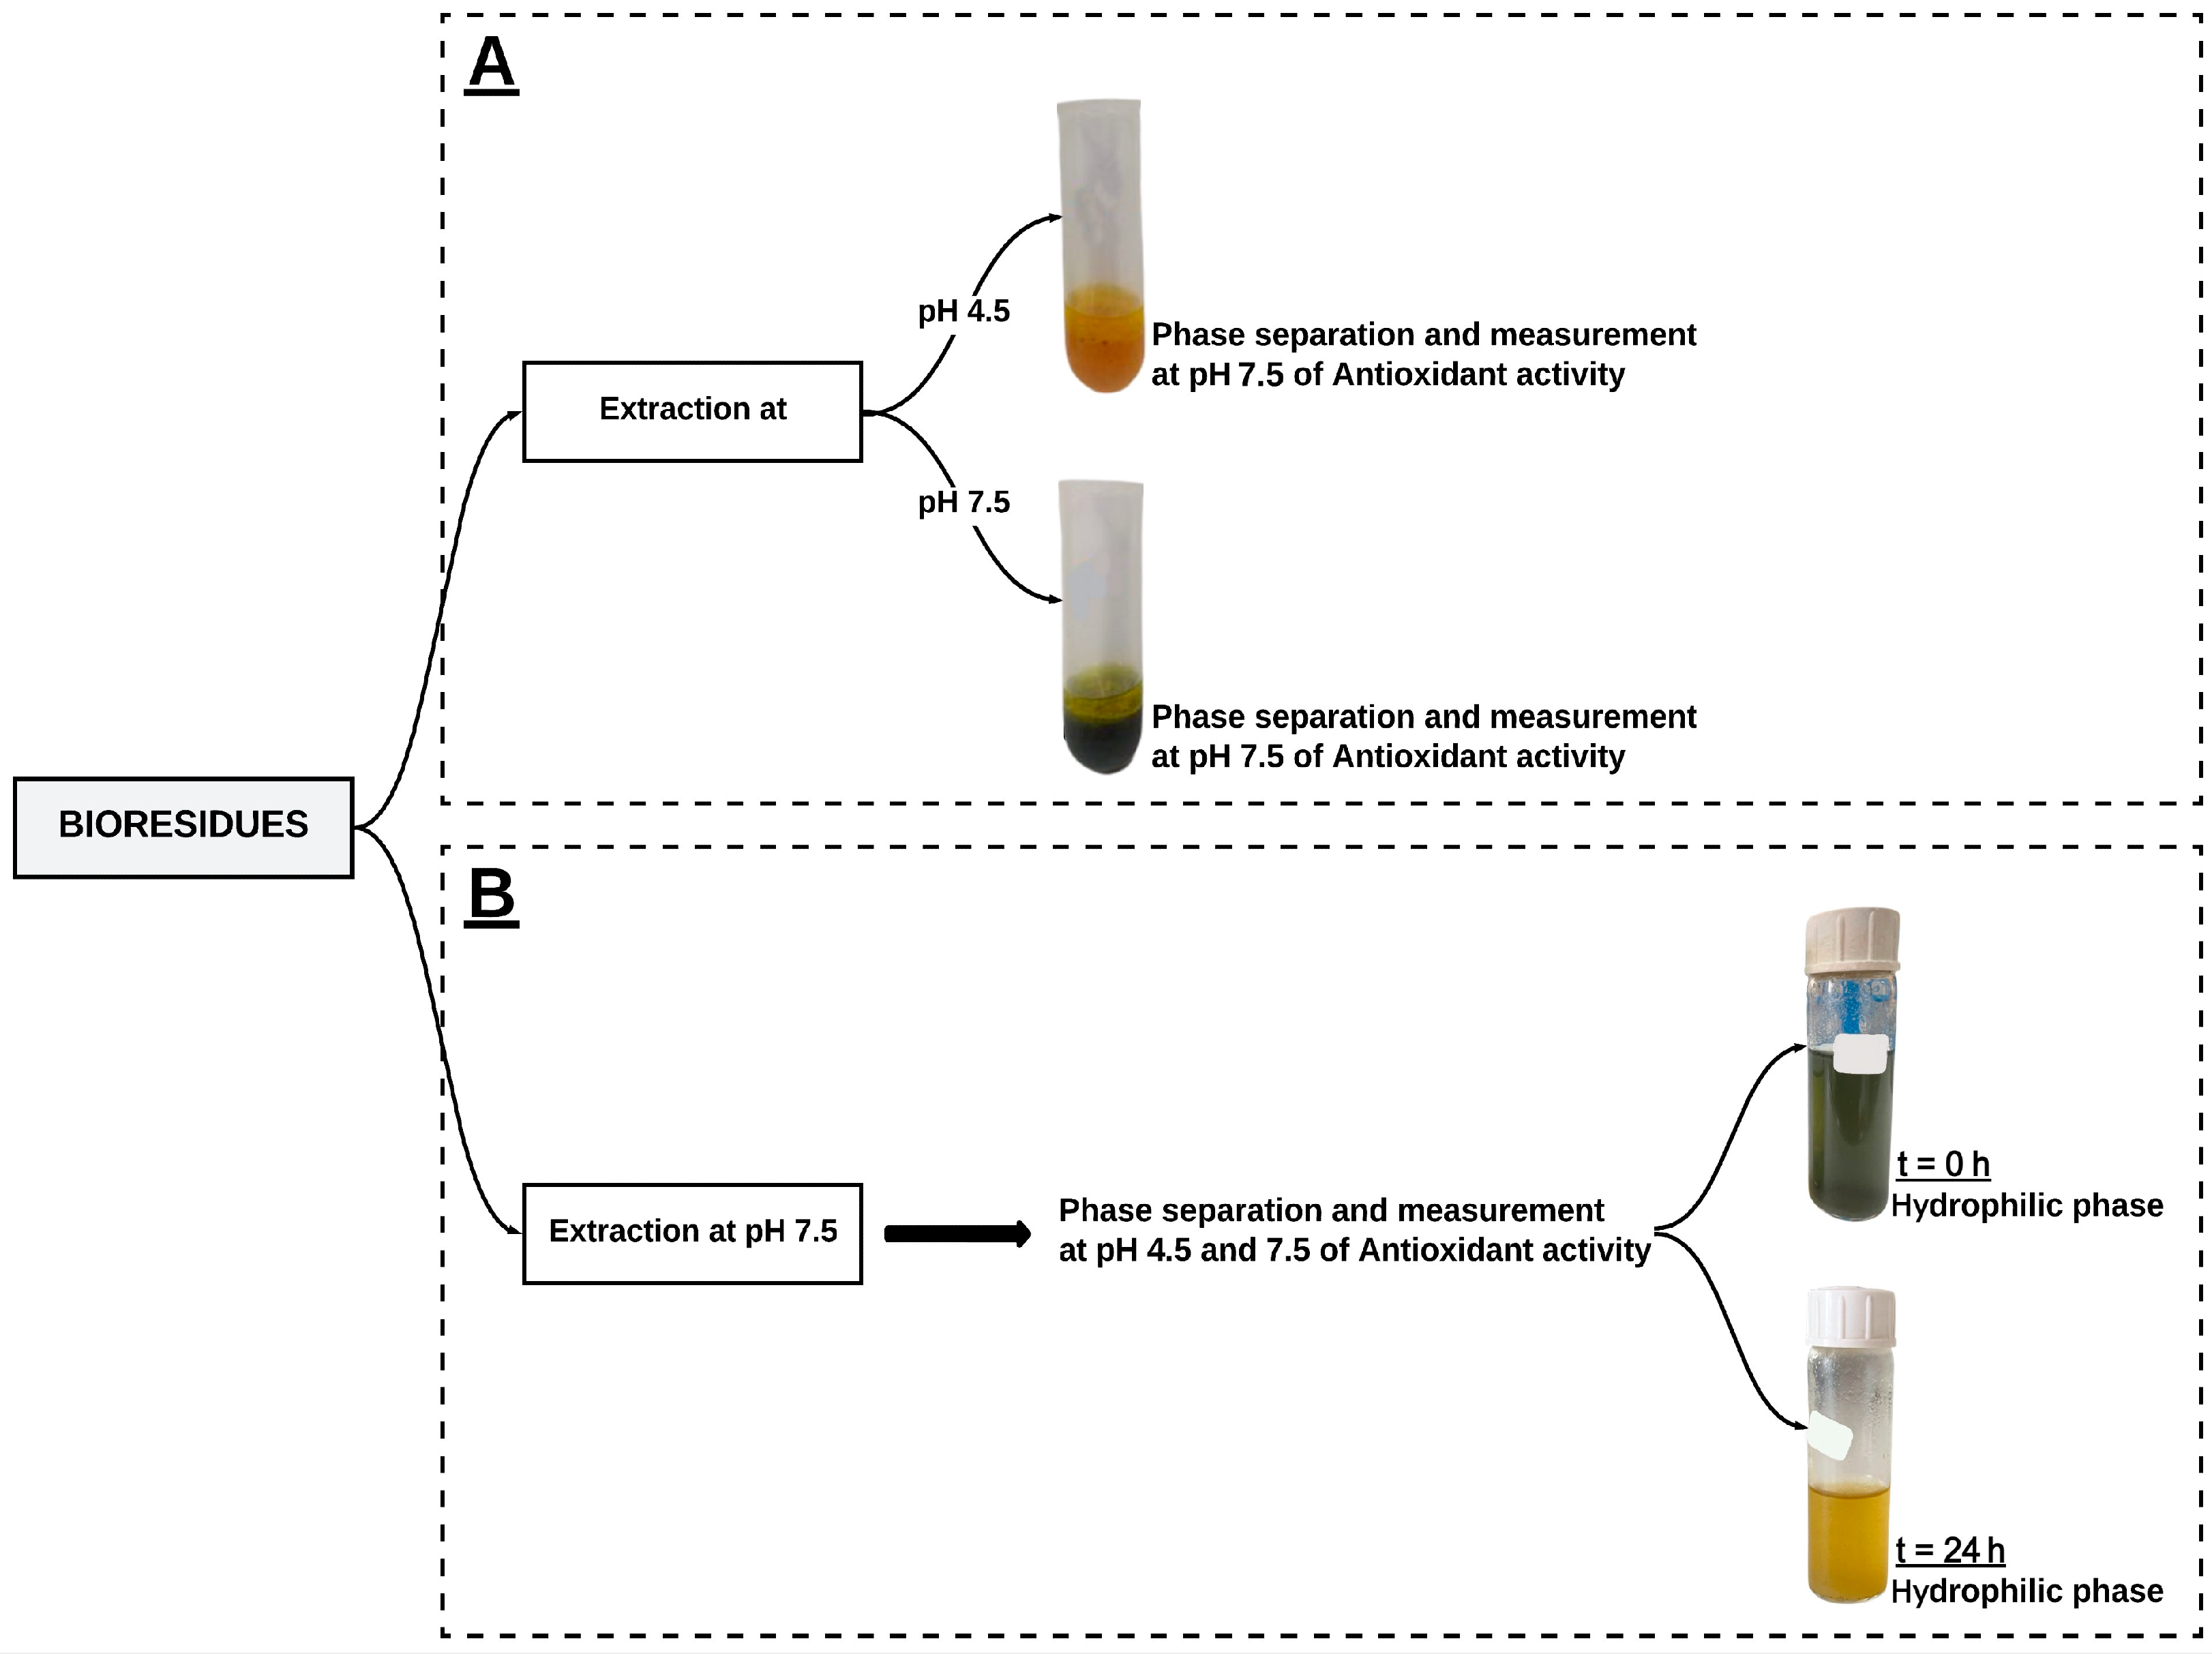
2.3. Extraction Process
2.4. Determination of Antioxidant Activity
2.4.1. Hydrophilic Antioxidant Activity
2.4.2. Lipophilic Antioxidant Activity
2.5. Determination of Total Phenolic Content
2.6. Determination of Total Flavonoid Content
2.7. Statistical Analysis
3. Results
4. Discussion
5. Conclusions
Author Contributions
Funding
Institutional Review Board Statement
Informed Consent Statement
Data Availability Statement
Conflicts of Interest
References
- Gresta, F.; Avola, G.; Lombardo, G.M.; Siracusa, L.; Ruberto, G. Analysis of Flowering, Stigmas Yield and Qualitative Traits of Saffron (Crocus sativus L.) as Affected by Environmental Conditions. Sci. Hortic. 2009, 119, 320–324. [Google Scholar] [CrossRef]
- Kianbakht, S.; Mozaffari, K. Effects of Saffron and Its Active Constituents, Crocin and Safranal, on Prevention of Indomethacin Induced Gastric Ulcers in Diabetic and Nondiabetic Rats. J. Med. Plants 2009, 8, 30–38. [Google Scholar]
- Kafi, M.; Kamili, A.N.; Husaini, A.M.; Ozturk, M.; Altay, V. An Expensive Spice Saffron (Crocus sativus L.): A Case Study from Kashmir, Iran, and Turkey. In Global Perspectives on Underutilized Crops; Ozturk, M., Hakeem, K.R., Ashraf, M., Ahmad, M.S.A., Eds.; Springer International Publishing: New York, NY, USA, 2018; pp. 109–149. [Google Scholar]
- Khan, M.; Hanif, M.A.; Ayub, M.A.; Jilani, M.I.; Shahid Chatha, S.A. Chapter 43—Saffron. In Medicinal Plants of South Asia; Hanif, M.A., Nawaz, H., Khan, M.M., Byrne, H.J., Eds.; Elsevier: Amsterdam, Netherlands, 2020; pp. 587–600. [Google Scholar]
- Smith, R.W. Saffron (Crocus sativus) Production and Processing; Kafi, M., Koocheki, A., Rashid, M.H., Nassiri, N., Eds.; Science Publishers: Enfield, NH, USA, 2006; p. 244. [Google Scholar] [CrossRef]
- Serrano-Díaz, J.; Sánchez, A.M.; Maggi, L.; Martínez-Tomé, M.; García-Diz, L.; Murcia, M.A.; Alonso, G.L. Increasing the Applications of Crocus sativus Flowers as Natural Antioxidants. J. Food Sci. 2012, 77, C1162–C1168. [Google Scholar] [CrossRef]
- Fujii, S.; Morita, Y.; Ohta, T.; Uto, T.; Shoyama, Y. Saffron (Crocus sativus L.) as a Valuable Spice and Food Product: A Narrative Review. Longhua Chin. Med. 2022, 5, 18. [Google Scholar] [CrossRef]
- Srivastava, R.; Ahmed, H.; Dixit, R.K.; Dharamveer; Saraf, S.A. Crocus sativus L.: A Comprehensive Review. Pharmacogn. Rev. 2010, 4, 200–208. [Google Scholar] [CrossRef]
- Hamidpour, M.; Hamidpour, R.; Hamidpour, S.; Shahlari, M. Chemistry, Pharmacology, and Medicinal Property of Sage (Salvia) to Prevent and Cure Illnesses Such as Obesity, Diabetes, Depression, Dementia, Lupus, Autism, Heart Disease, and Cancer. J Tradit. Complement. Med. 2014, 4, 82–88. [Google Scholar] [CrossRef] [PubMed]
- Ríos, J.L.; Recio, M.C.; Giner, R.M.; Máñez, S. An Update Review of Saffron and Its Active Constituents. Phytother. Res. 1996, 10, 189–193. [Google Scholar] [CrossRef]
- Stelluti, S.; Caser, M.; Demasi, S.; Scariot, V. Sustainable Processing of Floral Bio-Residues of Saffron (Crocus sativus L.) for Valuable Biorefinery Products. Plants 2021, 10, 523. [Google Scholar] [CrossRef] [PubMed]
- Cerdá-Bernad, D.; Costa, L.; Serra, A.T.; Bronze, M.R.; Valero-Cases, E.; Pérez-Llamas, F.; Candela, M.E.; Arnao, M.B.; Barberán, F.T.; Villalba, R.G.; et al. Saffron against Neuro-Cognitive Disorders: An Overview of Its Main Bioactive Compounds, Their Metabolic Fate and Potential Mechanisms of Neurological Protection. Nutrients 2022, 14, 5368. [Google Scholar] [CrossRef]
- Alcolea, J.F.; Cano, A.; Acosta, M.; Arnao, M.B. Hydrophilic and Lipophilic Antioxidant Activities of Grapes. Nahrung 2002, 46, 353–356. [Google Scholar] [CrossRef]
- Laufenberg, G.; Kunz, B.; Nystroem, M. Transformation of Vegetable Waste into Value Added Products: (A) the Upgrading Concept; (B) Practical Implementations. Bioresour. Technol. 2003, 87, 167–198. [Google Scholar] [CrossRef]
- Philippini, R.R.; Martiniano, S.E.; Ingle, A.P.; Franco Marcelino, P.R.; Silva, G.M.; Barbosa, F.G.; dos Santos, J.C.; da Silva, S.S. Agroindustrial Byproducts for the Generation of Biobased Products: Alternatives for Sustainable Biorefineries. Front. Energy Res. 2020, 8, 152. [Google Scholar] [CrossRef]
- Childs, R.E.; Bardsley, W.G. The Steady-State Kinetics of Peroxidase with 2,2’-Azino-Di-(3-Ethyl-Benzthiazoline-6-Sulphonic Acid) as Chromogen. Biochem. J. 1975, 145, 93–103. [Google Scholar] [CrossRef] [PubMed]
- Arnao, M.B.; Cano, A.; Acosta, M. The Hydrophilic and Lipophilic Contribution to Total Antioxidant Activity. Food Chem. 2001, 73, 239–244. [Google Scholar] [CrossRef]
- Bielski, B.H.J.; Allen, A.O. Mechanism of the Disproportionation of Superoxide Radicals. J. Phys. Chem. 1977, 81, 1048–1050. [Google Scholar] [CrossRef]
- Junta de Comunidades de Castilla—La Mancha (JCCM). Specifications for the Saffrons Protected by This Denomination of Origin, Which Includes Those Saffrons Produced in a Defined Geographical Area of the Autonomous Community of Castilla-La Mancha. 1999, pp. 1098–1112. Available online: https://docm.jccm.es/docm/verDisposicionAntigua.do?ruta=1999/02/19&idDisposicion=123061871701130333 (accessed on 2 February 2023).
- Cano, A.; Hernández-Ruíz, J.; García-Cánovas, F.; Acosta, M.; Arnao, M.B. An End-Point Method for Estimation of the Total Antioxidant Activity in Plant Material. Phytochem. Anal. 1998, 9, 196–202. [Google Scholar] [CrossRef]
- Cano, A.; Acosta, M.; Arnao, M.B. A Method to Measure Antioxidant Activity in Organic Media: Application to Lipophilic Vitamins. Redox Rep. 2000, 5, 365–370. [Google Scholar] [CrossRef] [PubMed]
- Singleton, V.L.; Rossi, J.A. Colorimetry of Total Phenolics with Phosphomolybdic-Phosphotungstic Acid Reagents. Am. J. Enol. Vitic. 1965, 16, 144–158. [Google Scholar] [CrossRef]
- El Midaoui, A.; Ghzaiel, I.; Vervandier-Fasseur, D.; Ksila, M.; Zarrouk, A.; Nury, T.; Khallouki, F.; El Hessni, A.; Ibrahimi, S.O.; Latruffe, N.; et al. Saffron (Crocus sativus L.): A Source of Nutrients for Health and for the Treatment of Neuropsychiatric and Age-Related Diseases. Nutrients 2022, 14, 597. [Google Scholar] [CrossRef]
- Woisky, R.G.; Salatino, A. Analysis of Propolis: Some Parameters and Procedures for Chemical Quality Control. J. Apic. Res. 1998, 37, 99–105. [Google Scholar] [CrossRef]
- El Mihyaoui, A.; Castillo, M.E.C.; Cano, A.; Hernandez-Ruiz, J.; Lamarti, A.; Arnao, M.B. Comparative Study of Wild Chamomile Plants from the North-West of Morocco: Bioactive Components and Total Antioxidant Activity. J. Med. Plant Res. 2021, 5, 431–441. [Google Scholar] [CrossRef]
- Cano, A.; Maestre, A.B.; Hernández-Ruiz, J.; Arnao, M.B. ABTS/TAC Methodology: Main Milestones and Recent Applications. Processes 2023, 11, 185. [Google Scholar] [CrossRef]
- Cano, A.; Arnao, M.B. ABTS/TEAC (2,2’-Azino-Bis-(3-Ethylbenzothiazoline-6-Sulfonic Acid)/Trolox®-Equivalent Antioxidant Capacity) Radical Scavenging Mixed-Mode Assay. In Measurement of Antioxidant Activity & Capacity; John Wiley & Sons, Ltd.: Hoboken, NJ, USA, 2018; pp. 117–139. [Google Scholar]
- Apak, R. Current Issues in Antioxidant Measurement. J. Agric. Food Chem. 2019, 67, 9187–9202. [Google Scholar] [CrossRef]
- Munteanu, I.G.; Apetrei, C. Analytical Methods Used in Determining Antioxidant Activity: A Review. Int. J. Mol. Sci. 2021, 22, 3380. [Google Scholar] [CrossRef]
- Prenzler, P.D.; Ryan, D.; Robards, K. Handbook of Antioxidant Methodology: Approaches to Activity Determination; Royal Society of Chemistry: Cambridge, UK, 2021. [Google Scholar]
- Alcolea, J.F.; Cano, A.; Acosta, M.; Arnao, M.B. Determination of the Hydrophilic and Lipophilic Antioxidant Activity of White- and Red Wines during the Wine-Making Process. Ital. J. Food Sci. 2003, 15, 207–214. [Google Scholar]
- Castañeda-Ovando, A.; Pacheco-Hernández, M.d.L.; Páez-Hernández, M.E.; Rodríguez, J.A.; Galán-Vidal, C.A. Chemical Studies of Anthocyanins: A Review. Food Chem. 2009, 113, 859–871. [Google Scholar] [CrossRef]
- Cerdá-Bernad, D.; Clemente-Villalba, J.; Valero-Cases, E.; Pastor, J.-J.; Frutos, M.-J. Novel Insight into the Volatile Profile and Antioxidant Properties of Crocus sativus L. Flowers. Antioxidants 2022, 11, 1650. [Google Scholar] [CrossRef] [PubMed]
- Serrano-Díaz, J.; Sánchez, A.M.; Alvarruiz, A.; Alonso, G.L. Preservation of Saffron Floral Bio-Residues by Hot Air Convection. Food Chem. 2013, 141, 1536–1543. [Google Scholar] [CrossRef]
- Abe, T.K.; Taniguchi, M. Identification of Myo-Inositol Hexakisphosphate (IP6) as a β-Secretase 1 (BACE1) Inhibitory Molecule in Rice Grain Extract and Digest. FEBS Open Bio 2014, 4, 162–167. [Google Scholar] [CrossRef] [PubMed]
- Azghandi-Fardaghi, A.; Es-haghi, A.; Feizy, J.; Lakshmipathy, R. Antioxidant Capacity and Chemical Composition of Different Parts of Saffron Flowers. J. Food Bioprocess Eng. 2021, 4, 69–74. [Google Scholar] [CrossRef]
- Zeka, K.; Ruparelia, K.C.; Continenza, M.A.; Stagos, D.; Vegliò, F.; Arroo, R.R.J. Petals of Crocus Sativus L. as a Potential Source of the Antioxidants Crocin and Kaempferol. Fitoterapia 2015, 107, 128–134. [Google Scholar] [CrossRef]


| Extraction | Antioxidant Activities (μmoles Trolox/100 g DW) | ||
|---|---|---|---|
| Fractions | HAA 2 | LAA | TAA |
| pH 4.5 | 4.63 ± 0.11 | 0.38 ± 0.07 | 5.02 ± 0.04 |
| pH 7.5 | 7.92 ± 0.11 | 0.51 ± 0.10 | 8.42 ± 0.21 |
| Sig. 1 | *** | NS | *** |
| Extraction | Total Phenolic Content (μmoles EG/100 g DW) | Total Flavonoid Content (μmoles QE/100 g DW) | ||
|---|---|---|---|---|
| Fractions | Hydrophilic | Lipophilic | Hydrophilic | Lipophilic |
| pH 4.5 | 88.89 ± 2.42 | 8.57 ± 0.06 | 99.33 ± 0.27 | 4.23 ± 0.14 |
| pH 7.5 | 95.29 ± 2.16 | 16.62 ± 0.29 | 91.91 ± 2.40 | 17.34 ± 1.28 |
| Sig. 1 | NS | *** | * | *** |
| Extraction | Hydrophilic Antioxidant Activity (μmoles Trolox/100 mg DW) | |
|---|---|---|
| pH 7.5 | pH 4.5 | |
| t = 0 h | 6.87 ± 0.42 | 3.49 ± 0.22 |
| t = 24 h | 7.04 ± 0.53 | 3.48 ± 0.29 |
| Sig. 1 | NS | NS |
| Time | Total Phenol Content (μmoles EG/100 g DW) | Total Flavonoid Content (μmoles QE/100 g DW) |
|---|---|---|
| t = 0 h | 88.6 ± 6.81 | 93.16 ± 17.5 |
| t = 24 h | 74.1 ± 8.9 | 75.92 ± 18.8 |
| Sig. 1 | NS | NS |
Disclaimer/Publisher’s Note: The statements, opinions and data contained in all publications are solely those of the individual author(s) and contributor(s) and not of MDPI and/or the editor(s). MDPI and/or the editor(s) disclaim responsibility for any injury to people or property resulting from any ideas, methods, instructions or products referred to in the content. |
© 2023 by the authors. Licensee MDPI, Basel, Switzerland. This article is an open access article distributed under the terms and conditions of the Creative Commons Attribution (CC BY) license (https://creativecommons.org/licenses/by/4.0/).
Share and Cite
Maestre-Hernández, A.-B.; Vicente-López, J.-J.; Pérez-Llamas, F.; Candela-Castillo, M.-E.; García-Conesa, M.-T.; Frutos, M.-J.; Cano, A.; Hernández-Ruiz, J.; Arnao, M.B. Antioxidant Activity, Total Phenolic and Flavonoid Contents in Floral Saffron Bio-Residues. Processes 2023, 11, 1400. https://doi.org/10.3390/pr11051400
Maestre-Hernández A-B, Vicente-López J-J, Pérez-Llamas F, Candela-Castillo M-E, García-Conesa M-T, Frutos M-J, Cano A, Hernández-Ruiz J, Arnao MB. Antioxidant Activity, Total Phenolic and Flavonoid Contents in Floral Saffron Bio-Residues. Processes. 2023; 11(5):1400. https://doi.org/10.3390/pr11051400
Chicago/Turabian StyleMaestre-Hernández, Ana-Belén, Juan-José Vicente-López, Francisca Pérez-Llamas, María-Emilia Candela-Castillo, María-Teresa García-Conesa, María-José Frutos, Antonio Cano, Josefa Hernández-Ruiz, and Marino B. Arnao. 2023. "Antioxidant Activity, Total Phenolic and Flavonoid Contents in Floral Saffron Bio-Residues" Processes 11, no. 5: 1400. https://doi.org/10.3390/pr11051400