

Multi-Objective Optimization Design and Experimental Investigation for a Prismatic Lithium-Ion Battery Integrated with a Multi-Stage Tesla Valve-Based Cold Plate

 ,
,  ,
, 
Abstract
:1. Introduction
2. Methodology
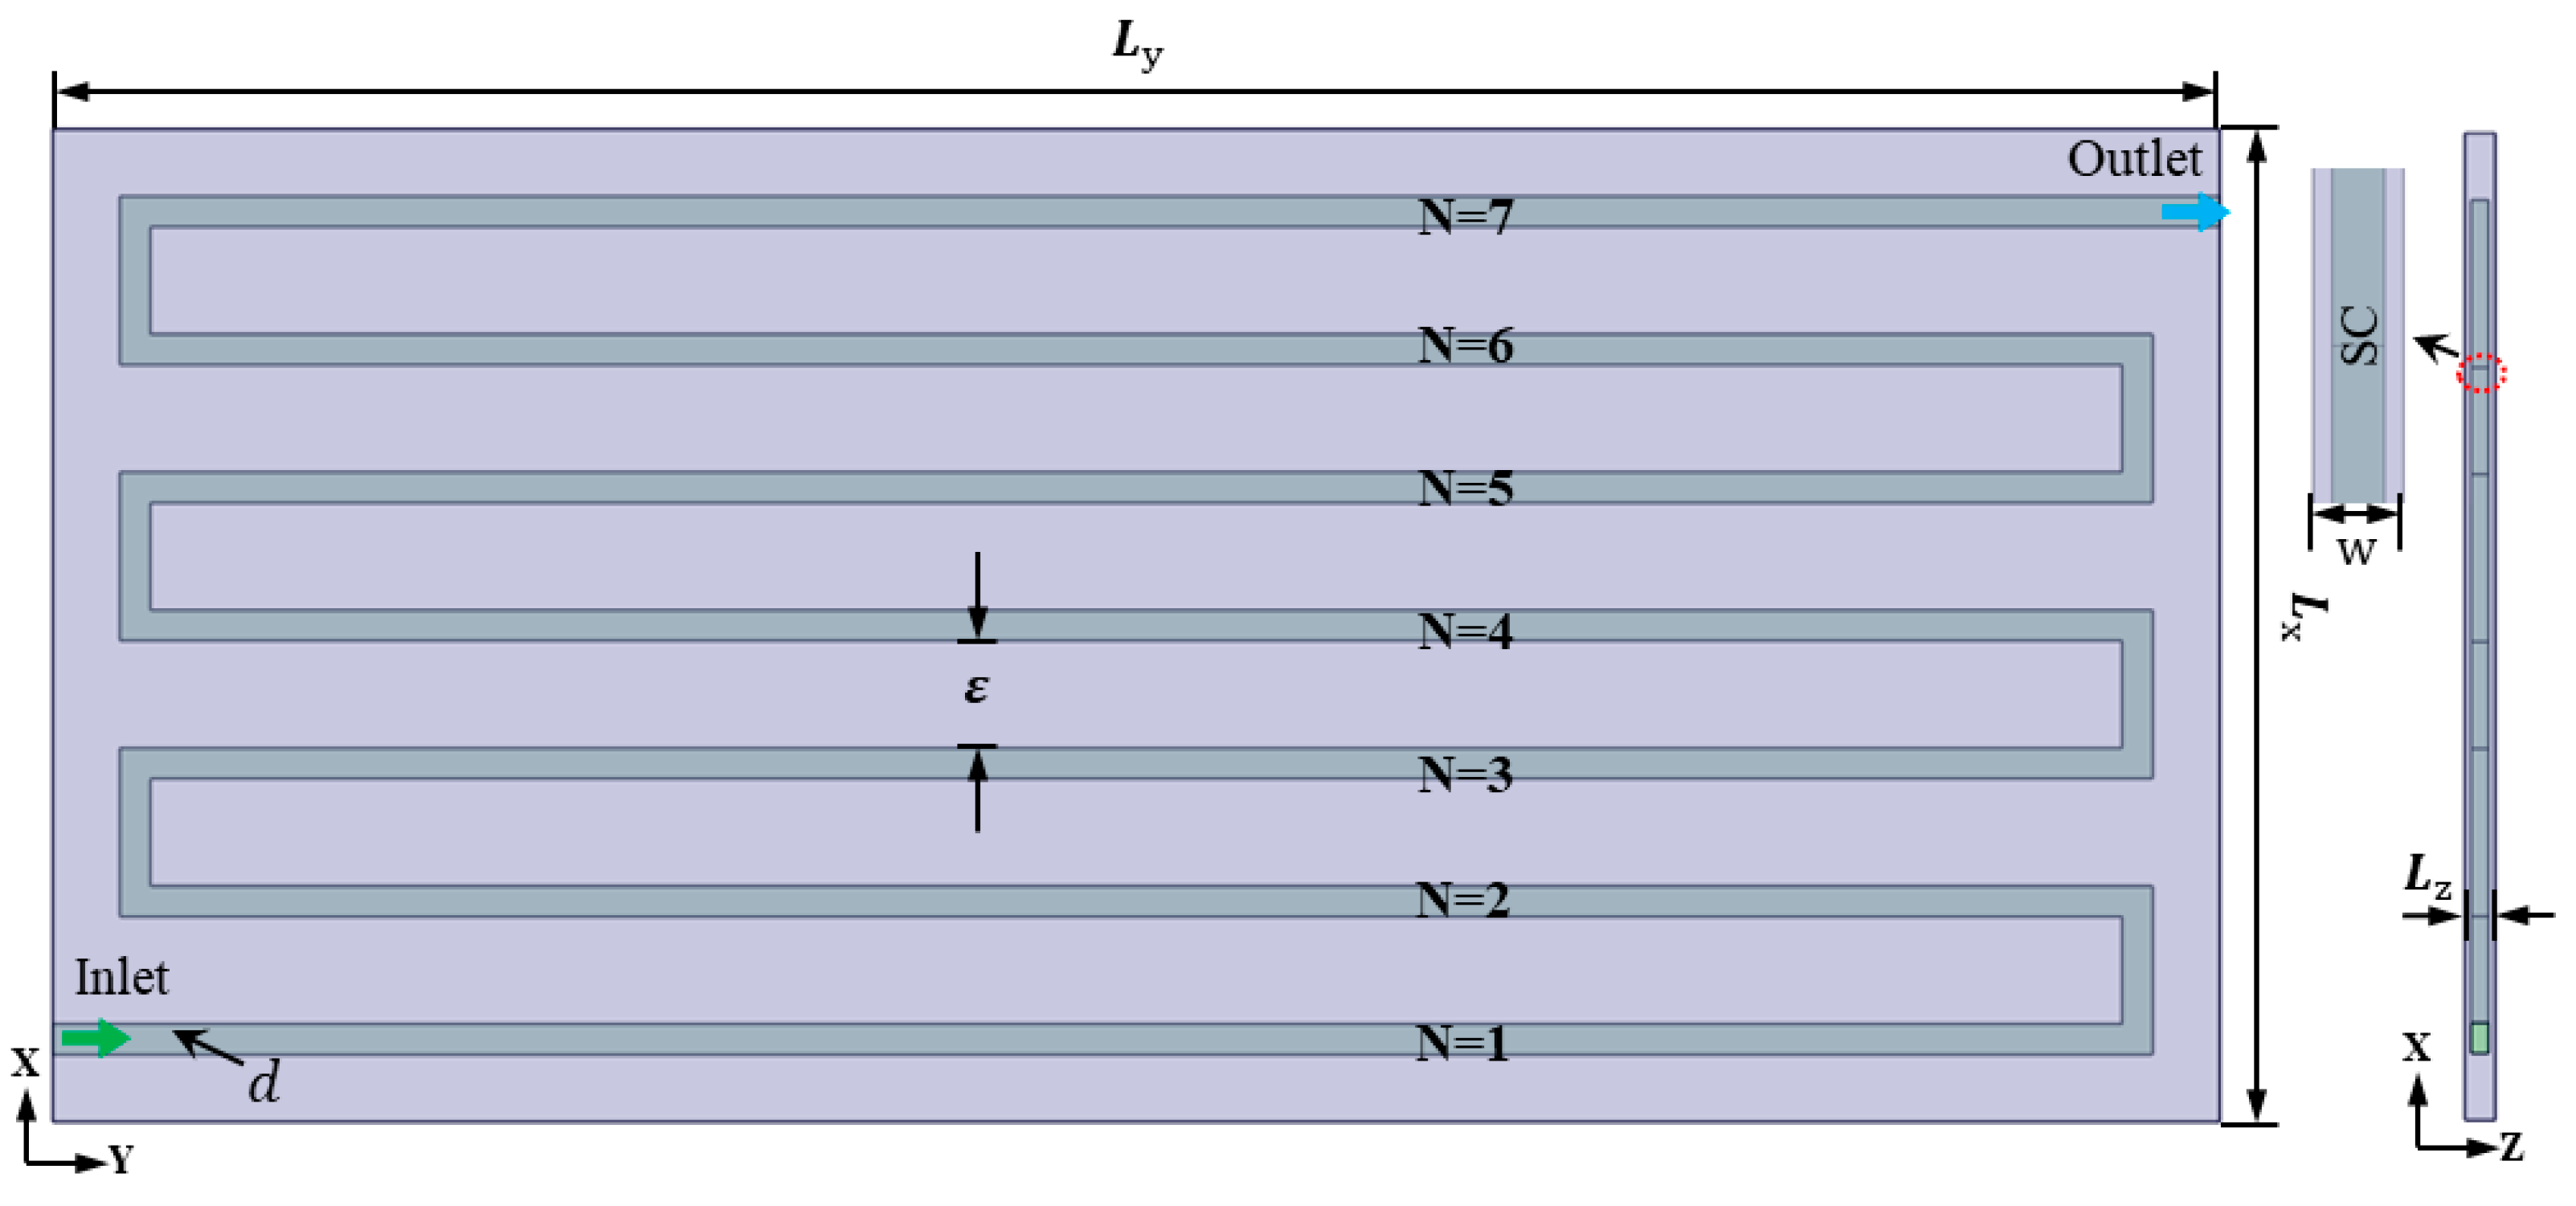
2.1. Model Description
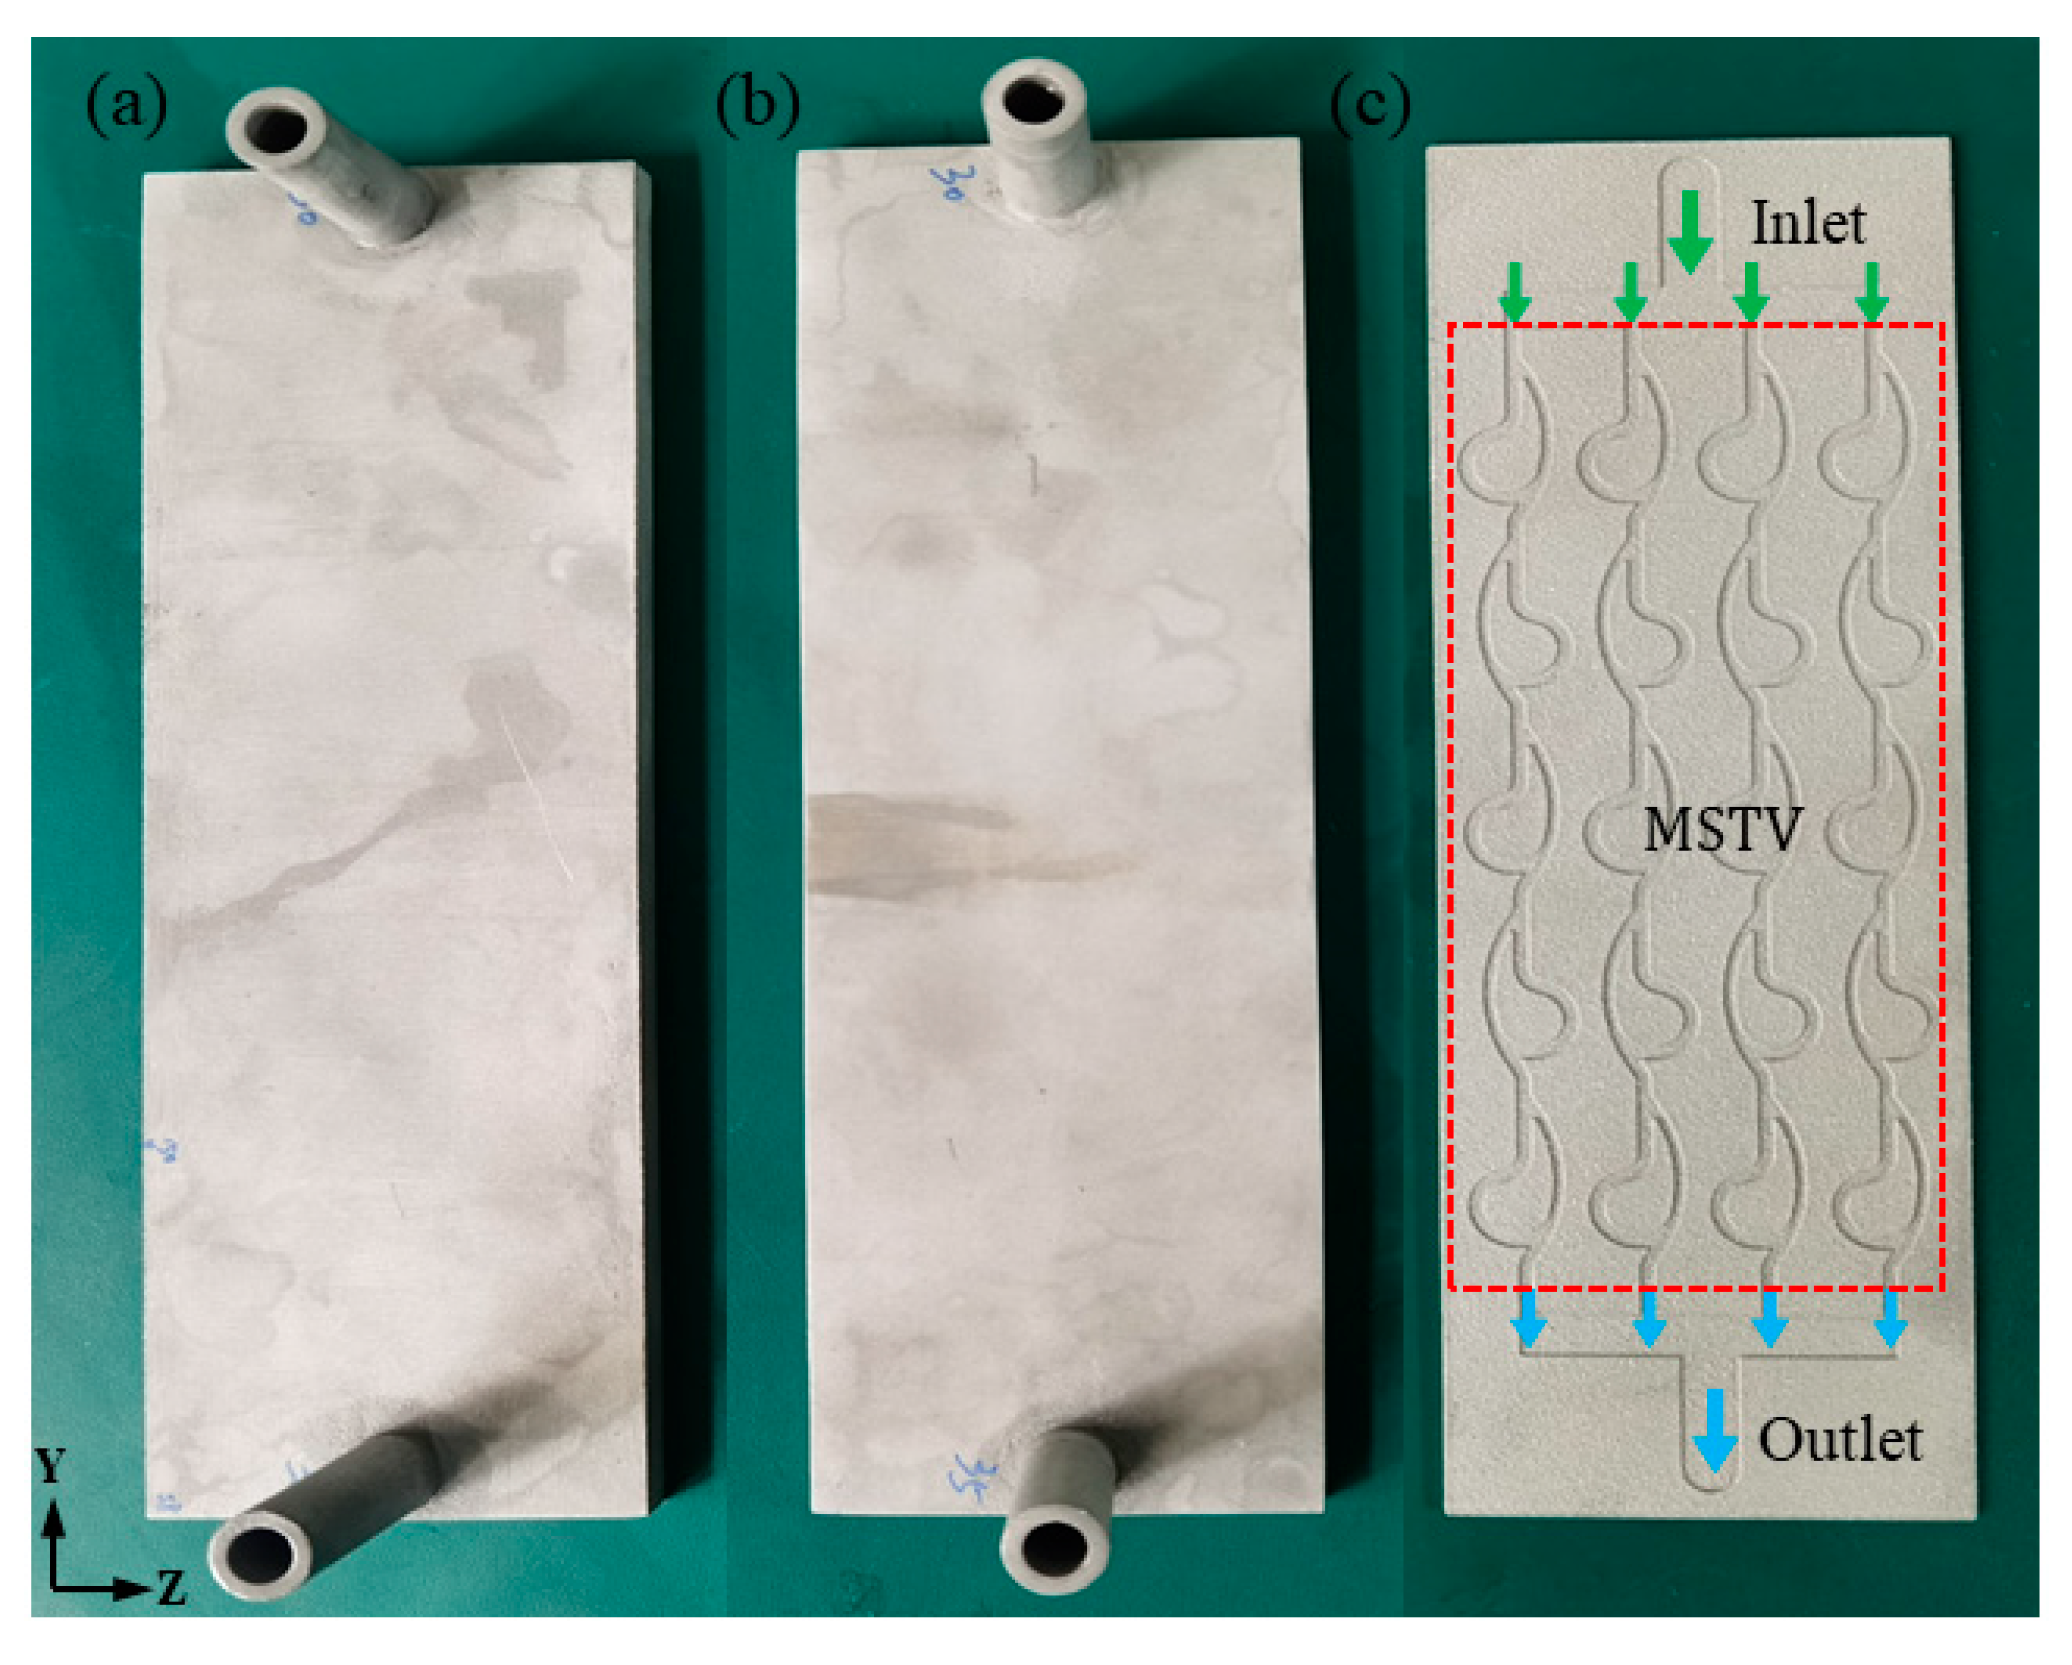
2.1.1. Geometric Structure of Cold Plates
2.1.2. Construction of the Lithium-Ion Battery Thermal Model
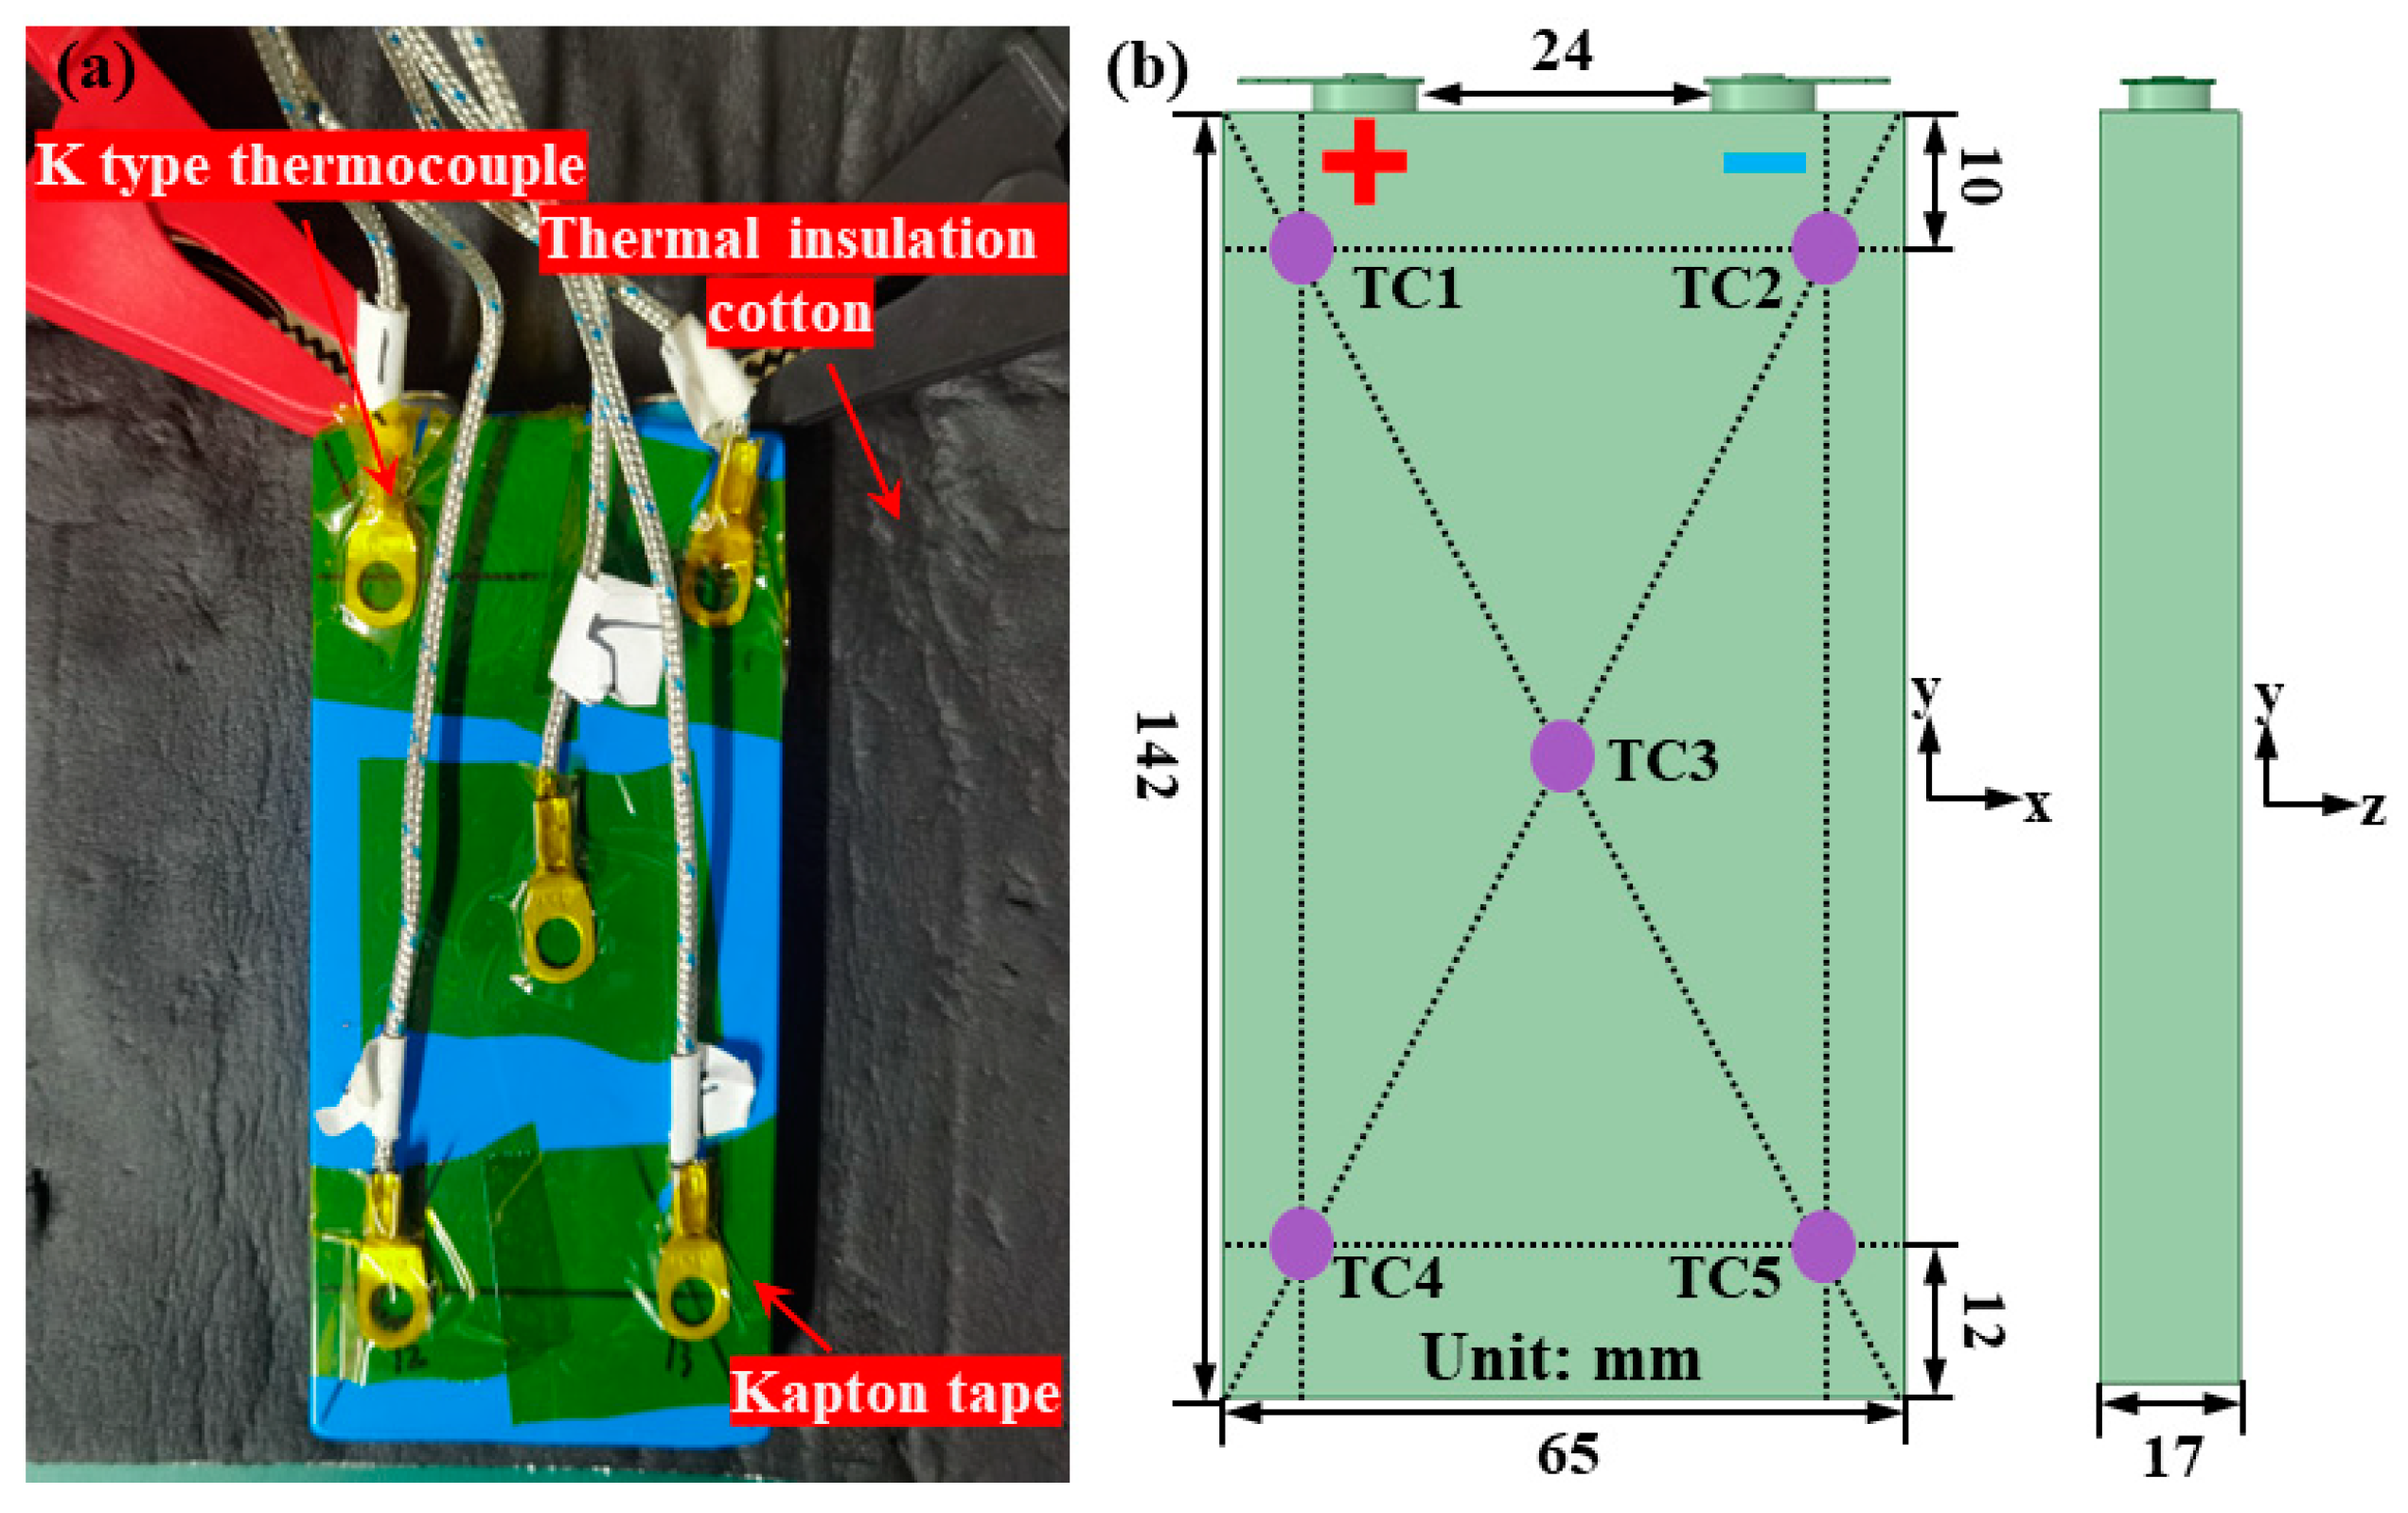
Experimental Set-Up
Obtaining the Thermodynamic Parameters of a Battery
2.2. The Governing Equations
- (1)
- For the coolant, the mass conservation is as follows:
- (2)
- In the solid region of the cold plate, the energy equation is expressed as
- (3)
- For the lithium-ion battery module, the energy conservation equation can be written as [23]
2.3. Boundary and Initial Conditions
- (1)
- Interface coupling conditions of the lithium-ion battery and liquid coolant [5]:
- (2)
- The boundary conditions of the interface between the solid area (aluminum) of the cold plate and the liquid coolant are defined as follows [23]:
- Inlet: Coolant flow rate at each inlet is defined as . The initial temperature of coolant and ambient air is maintained at 30 °C. Equation (15) provides the inlet velocity of the cross-sectional area of the coolant from 75 to 300. The definition is as follows [18]:
- Outlet: Take the environmental pressure as the reference pressure of the outlet fluid, equal to 0 Pa.
- Wall: The upper and lower walls of the cold plate close to the lithium-ion battery are conjugate heat transfer walls. The other walls are assumed to be adiabatic. According to Equation (15), the inlet Reynolds number (Re) of the cooling system is less than 300. Therefore, the fluid flow is laminar in this case [18]. The SIMPLEC algorithm is adopted for the second-order and third-order equations.
2.4. Model Rationality Demonstration
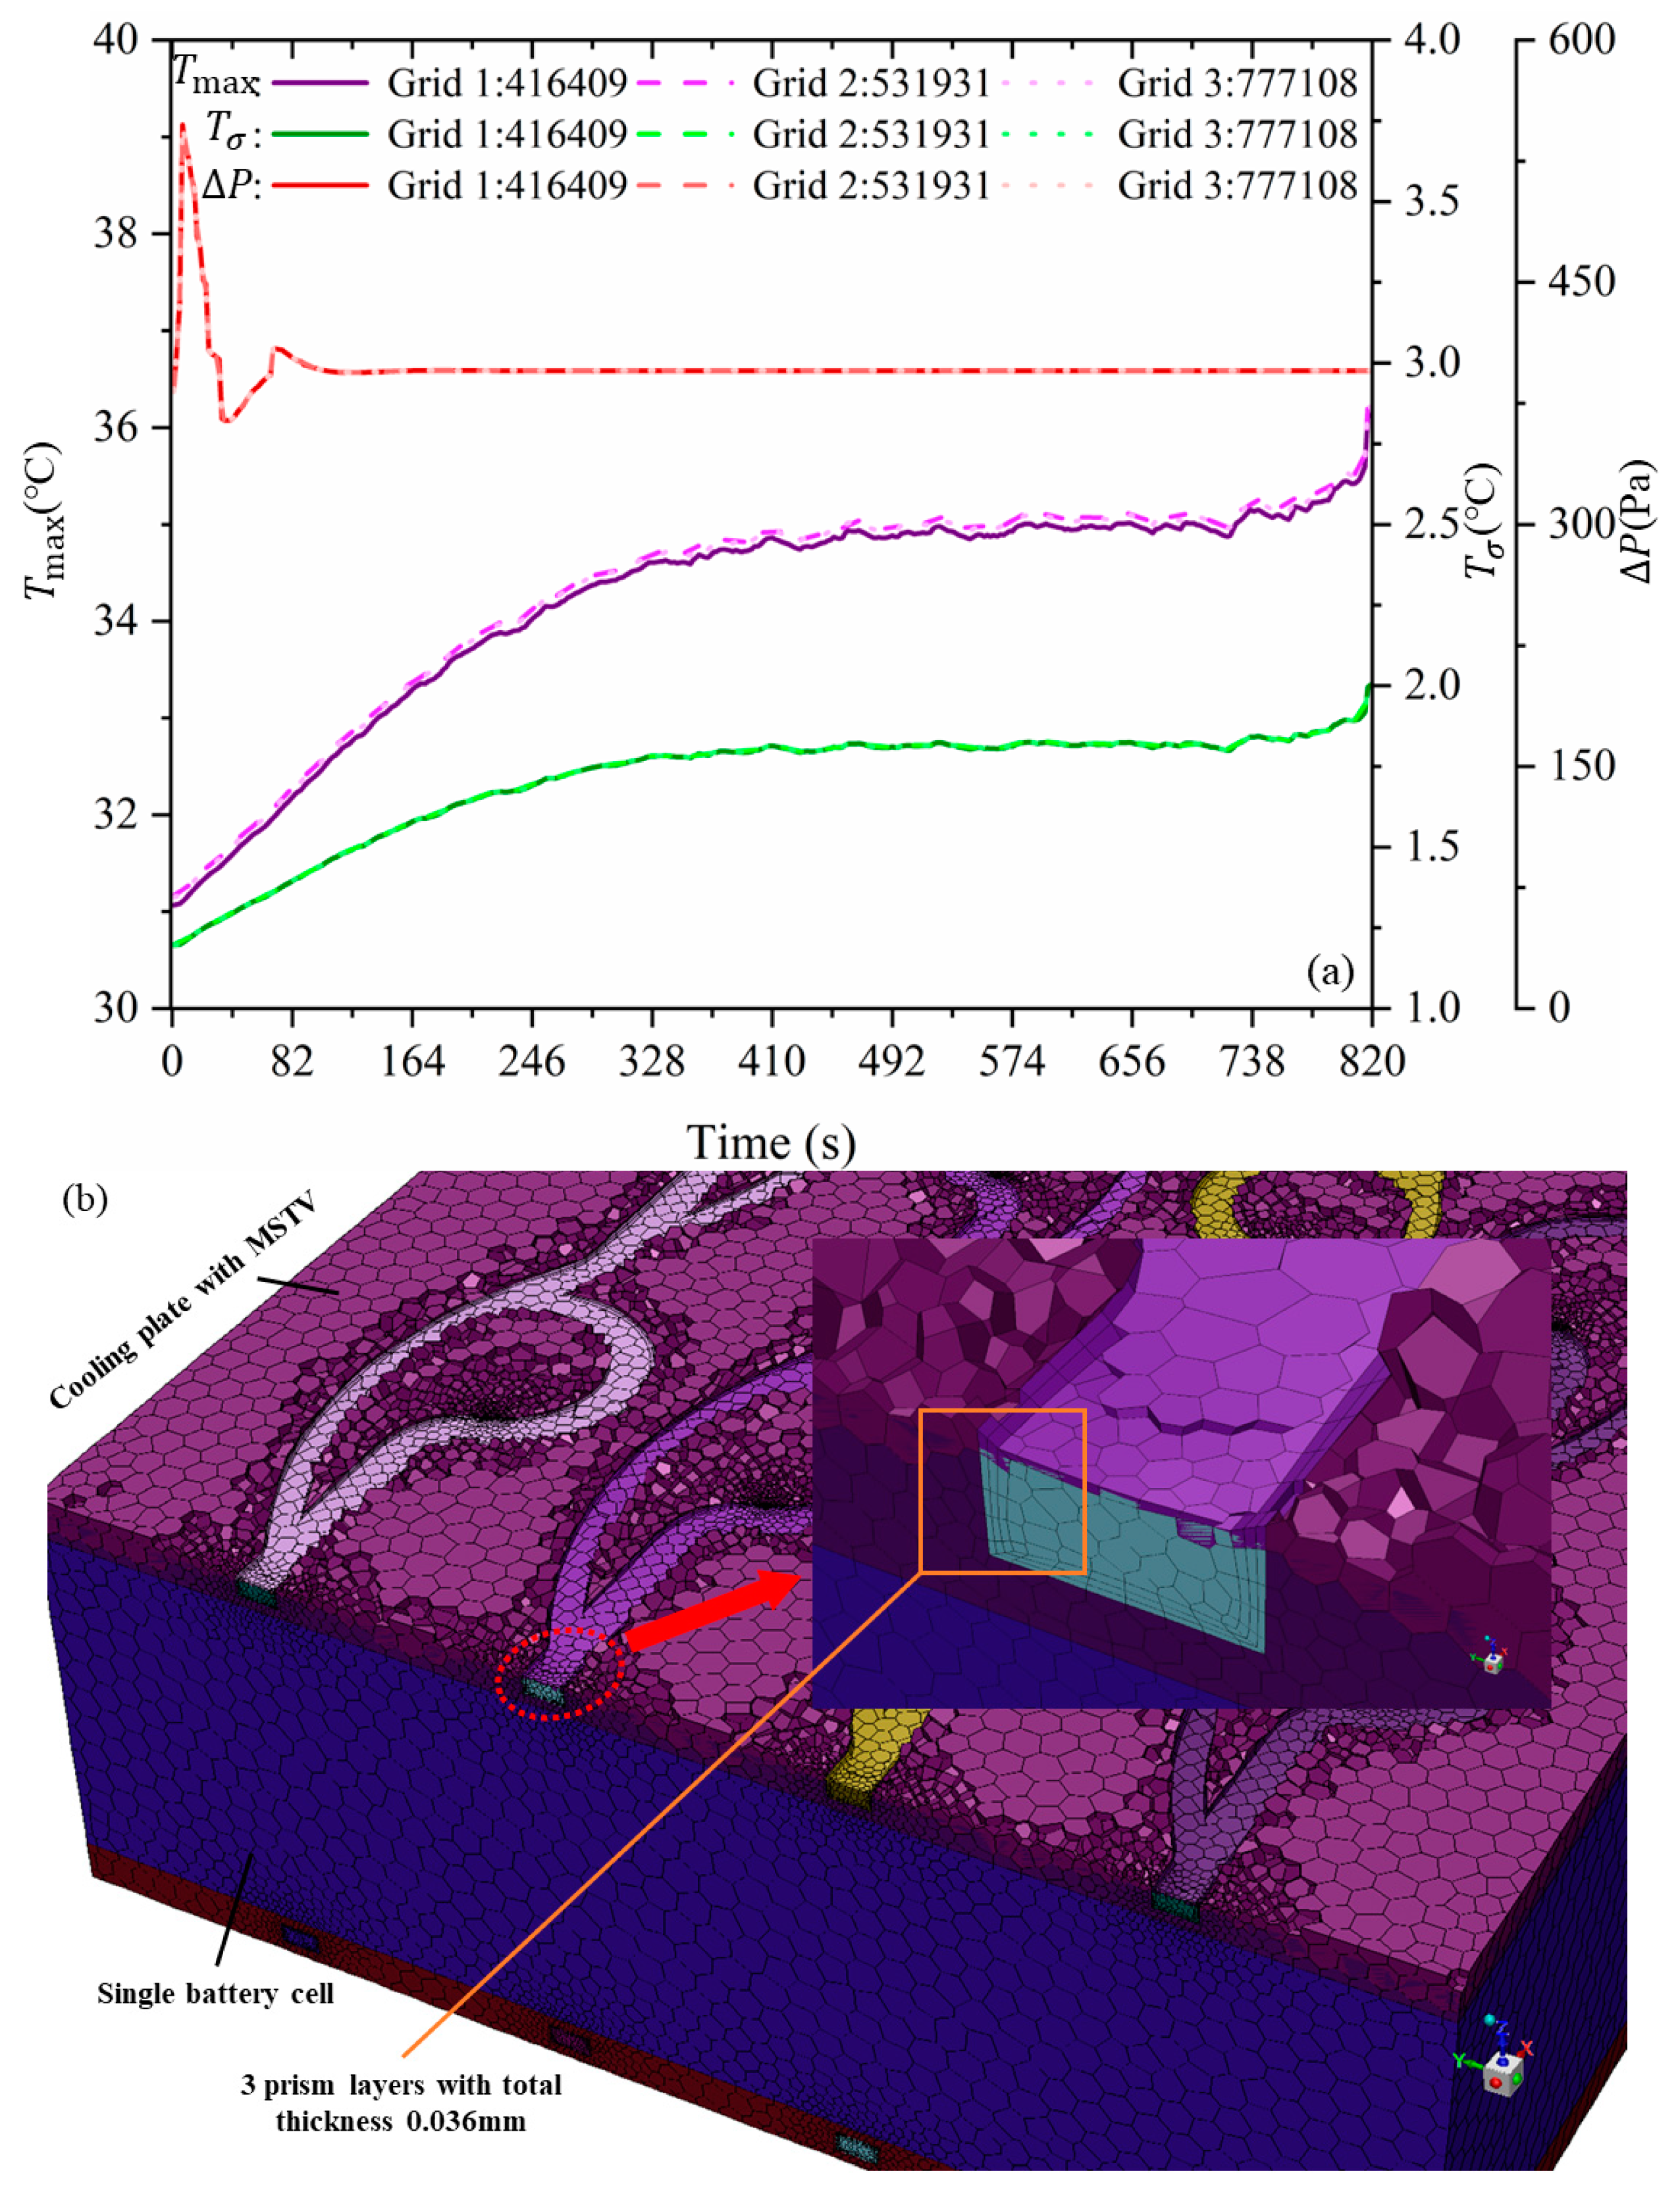
2.4.1. Grid Independence Verification
2.4.2. Model Rationality Demonstration
3. Performance Analysis of the Initial MSTV Geometry
- (1)
- The MSTV channel was formed on the basis of a single Tesla valve in series, and the initial cold plate structure was constructed. Through the finite space arrangement of the cold plate, the influence of the volume fraction of liquid coolant () and valve distance (G) on the heat removal performance of the cold plate was preset.
- (2)
- Further, we selected the multi-objective optimization (the DoE, Kriging, and NCGA optimization algorithm framework) by the liquid cooling system optimization scheme. The optimal structure of the MSTV was also explored.
- (3)
- The superiority of the MSTV structure (cooling performance, pumping energy consumption) was verified experimentally. The cooling performance was also compared with that of a conventional serpentine channel at the same heat transfer area.
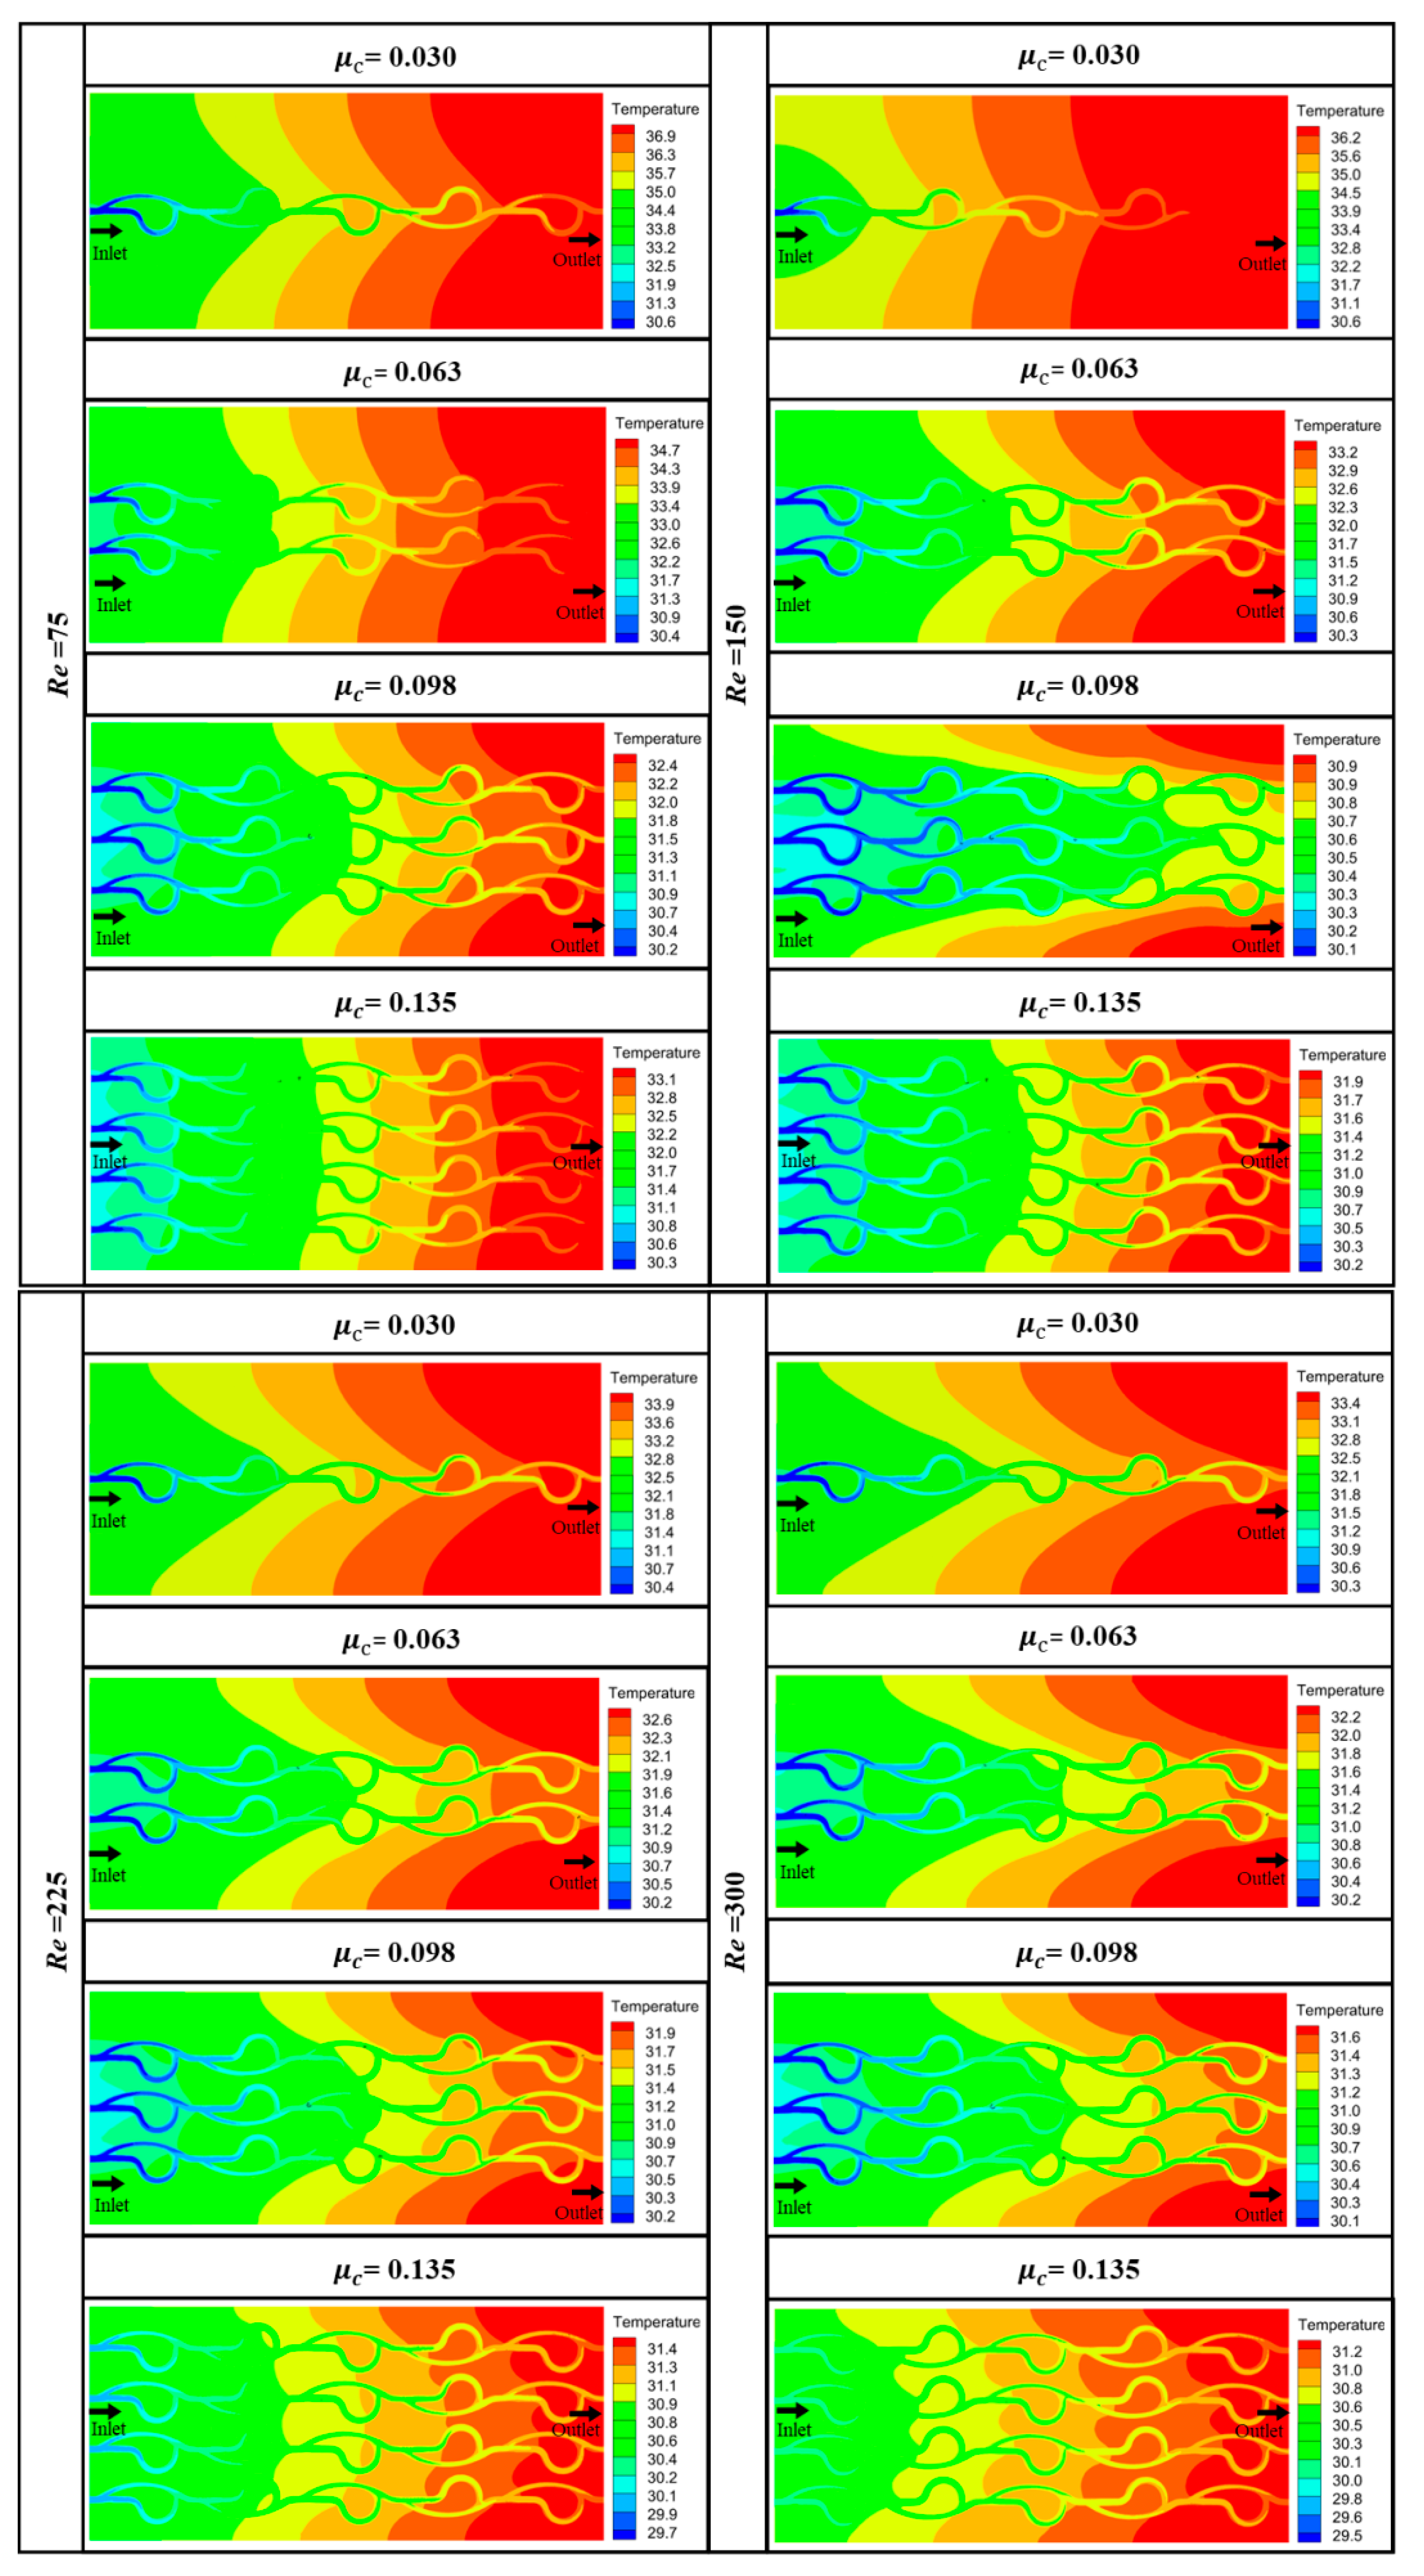
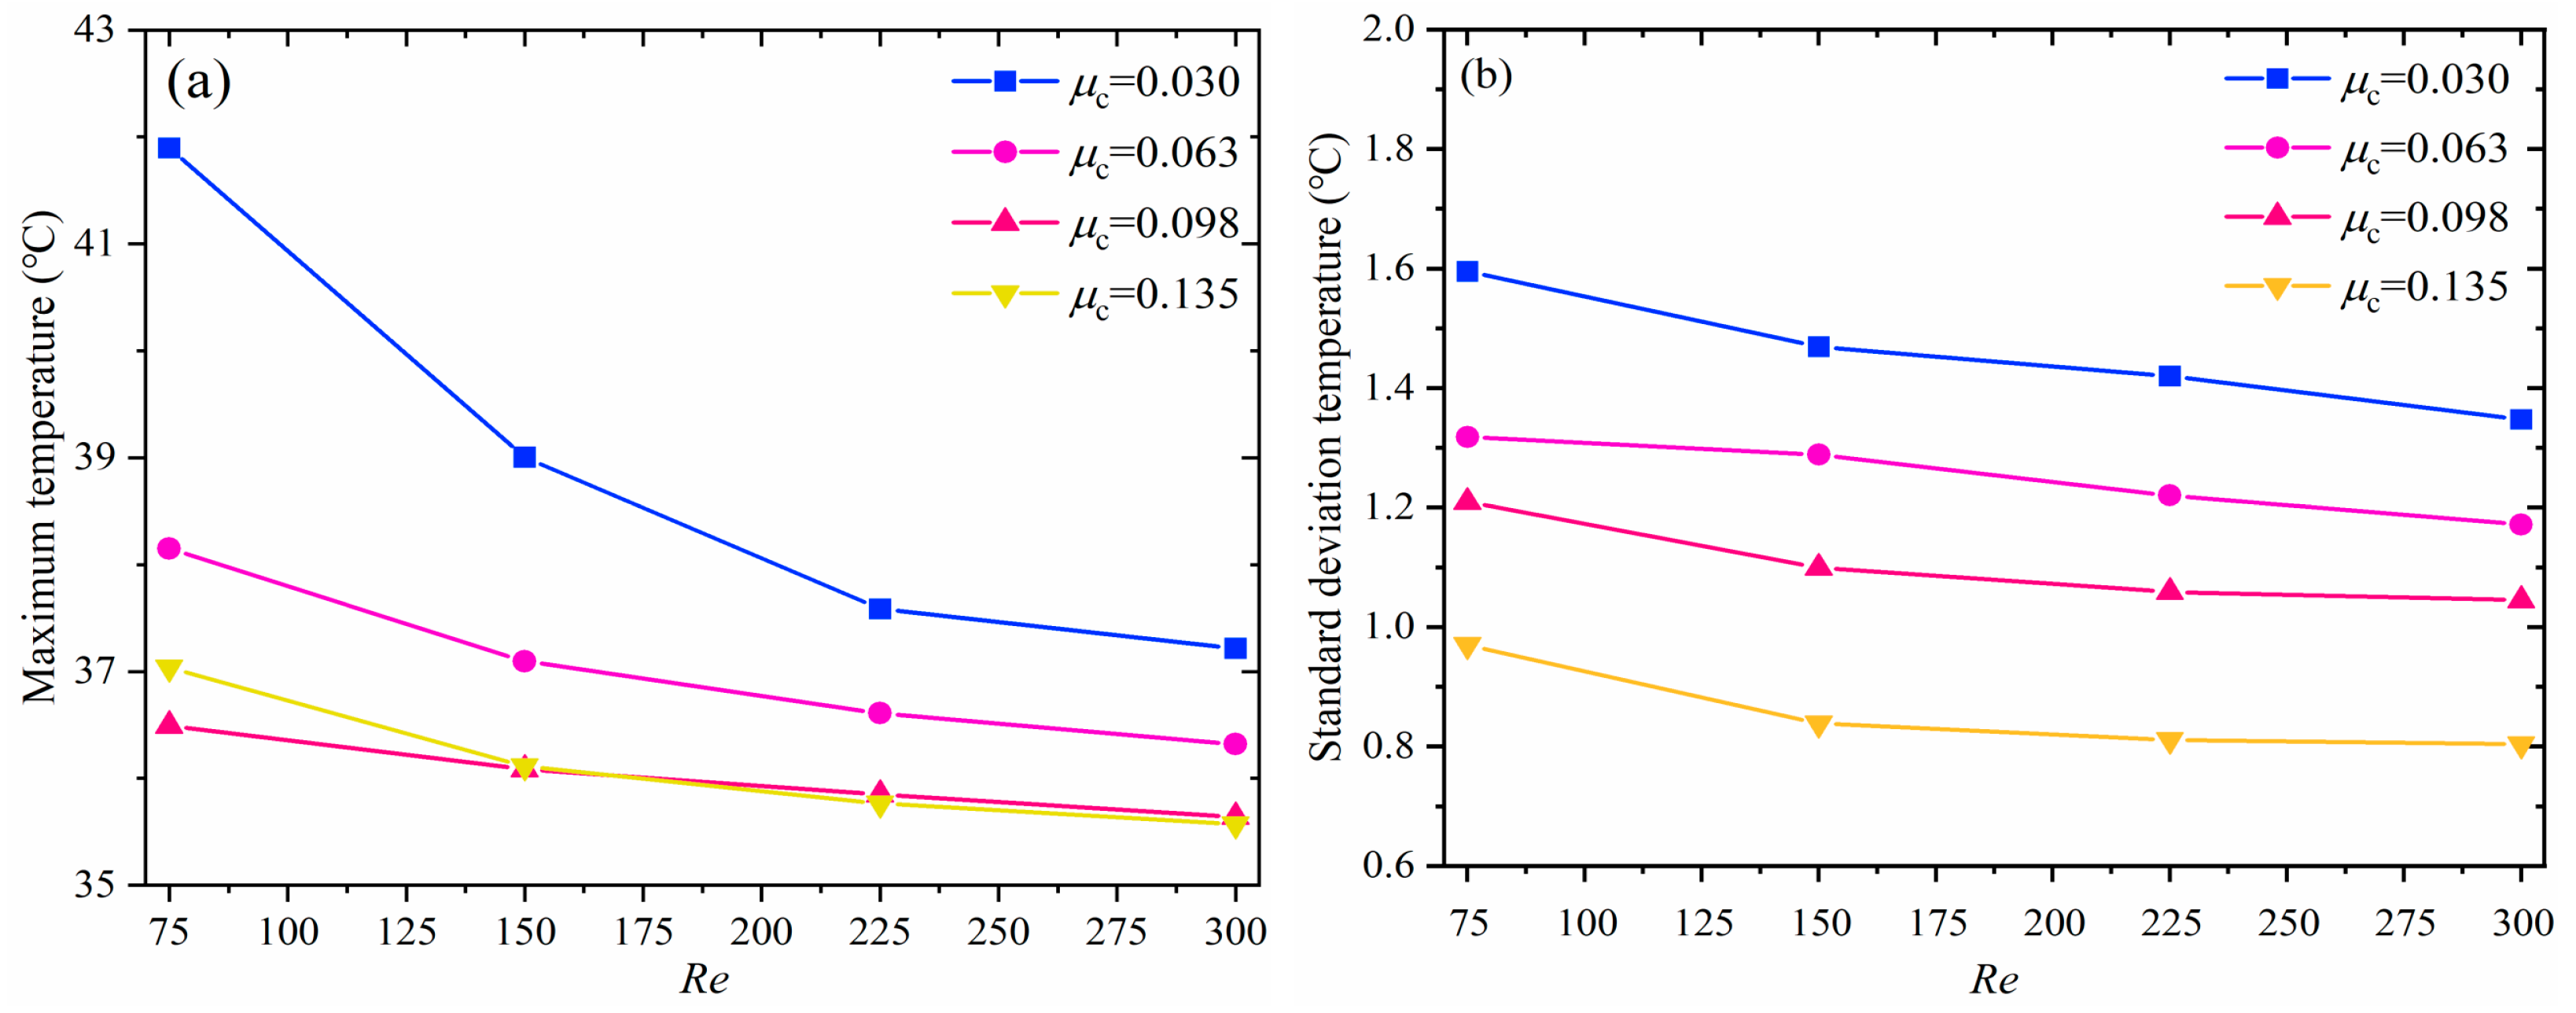
3.1. Influence of the Coolant Volume Fraction on the Cooling Performance
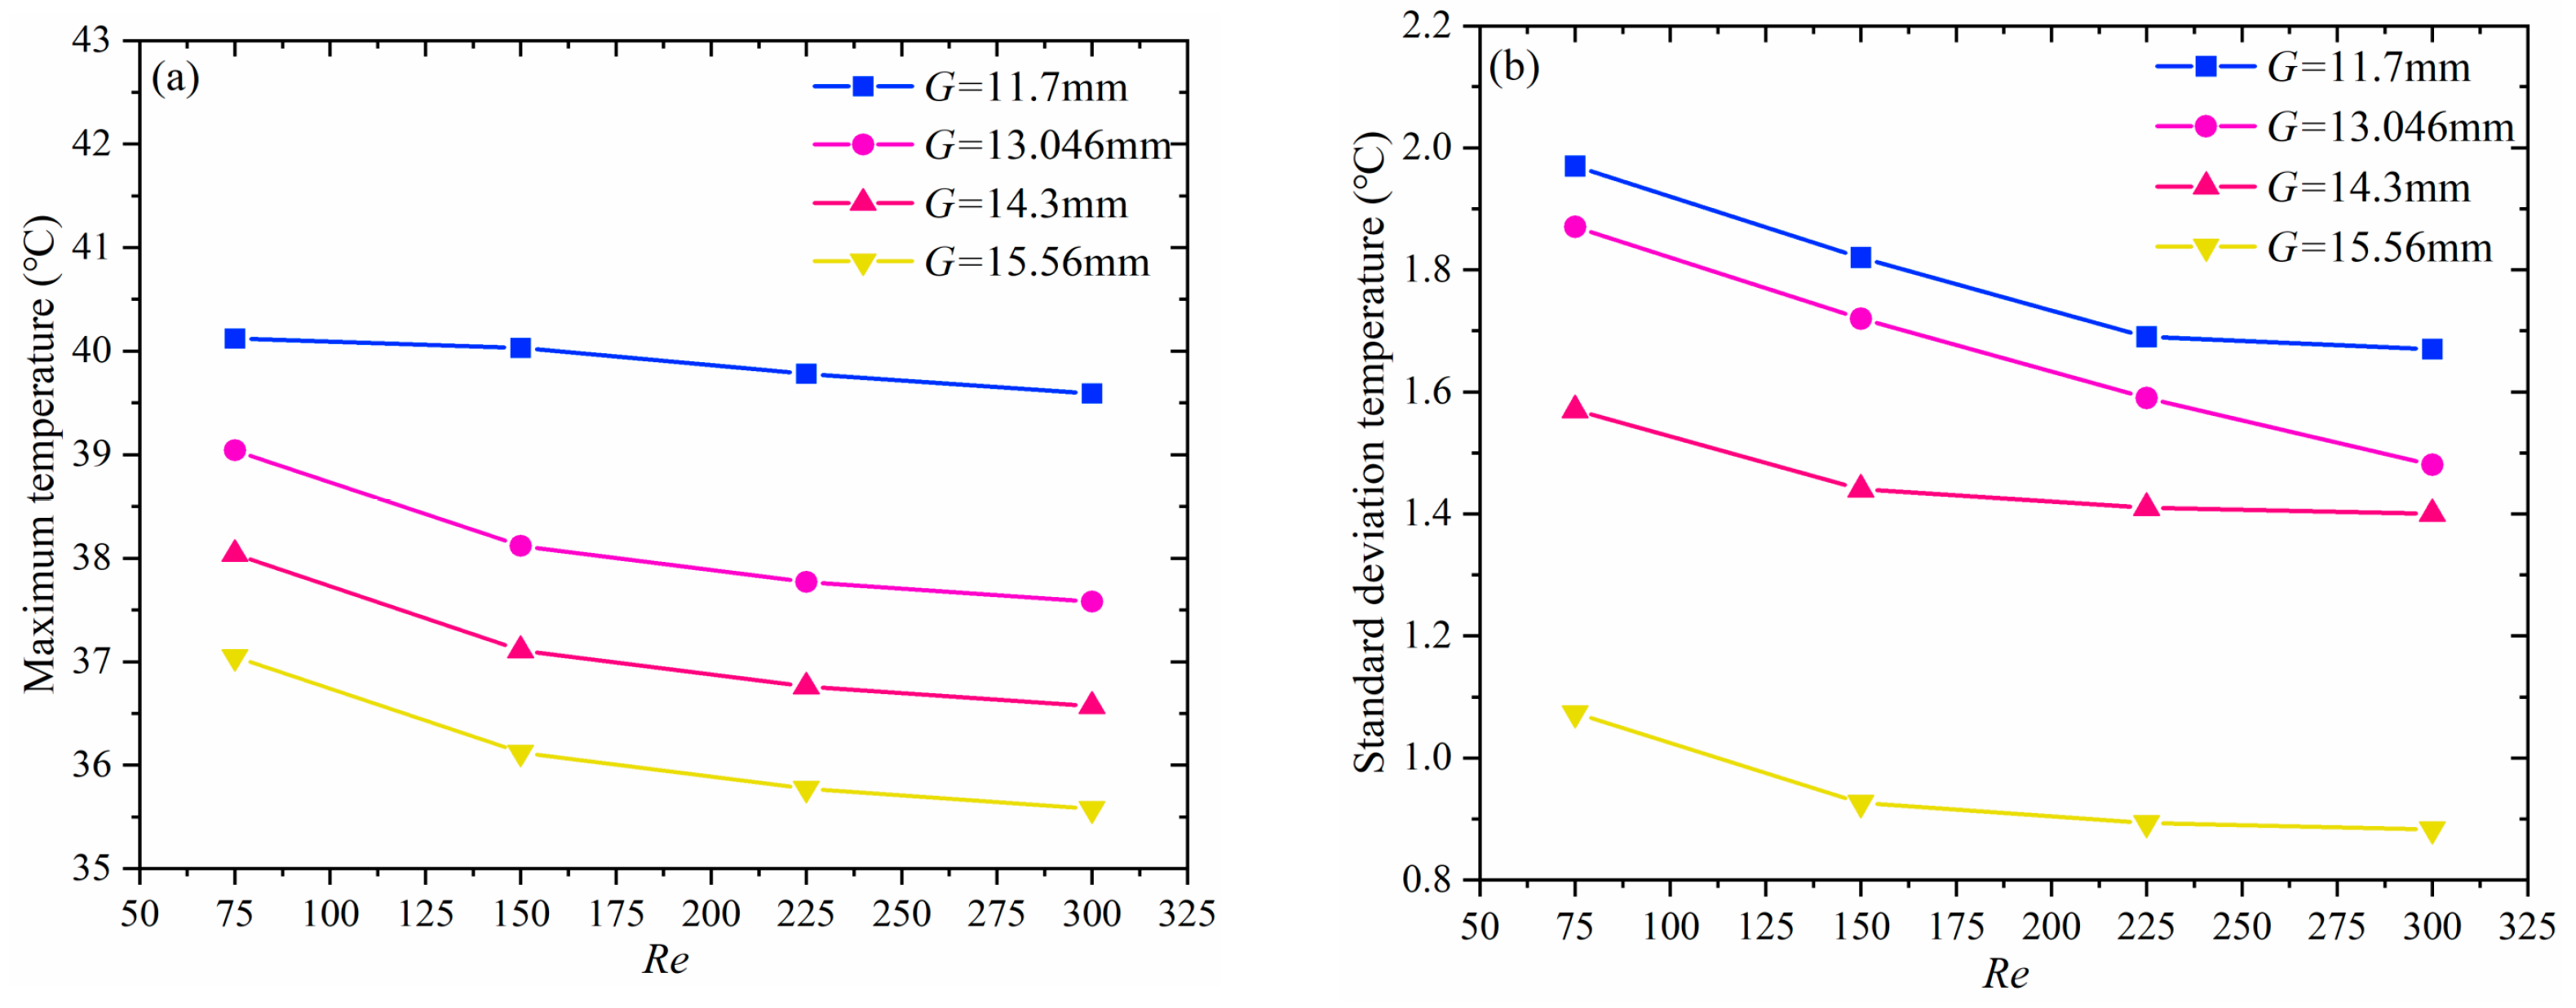
3.2. The Influence of Valve Distance on the Cooling Performance
4. Multi-Objective Optimization Design
- (1)
- Structure design of MSTV-BTMS.
- (2)
- The sample space was obtained by the DOE method and CFD numerical solution.
- (3)
- The Kriging approximation model was used to establish an approximation model between the design variables and the objective function. Moreover, the robustness of the model was further analyzed.
- (4)
- Optimal design selection using NCGA algorithms.
- (5)
- Experimental verification of the initial design and optimization design.
4.1. Optimization process of MSTV-BTMS
- (1)
- General full factorial design
- (2)
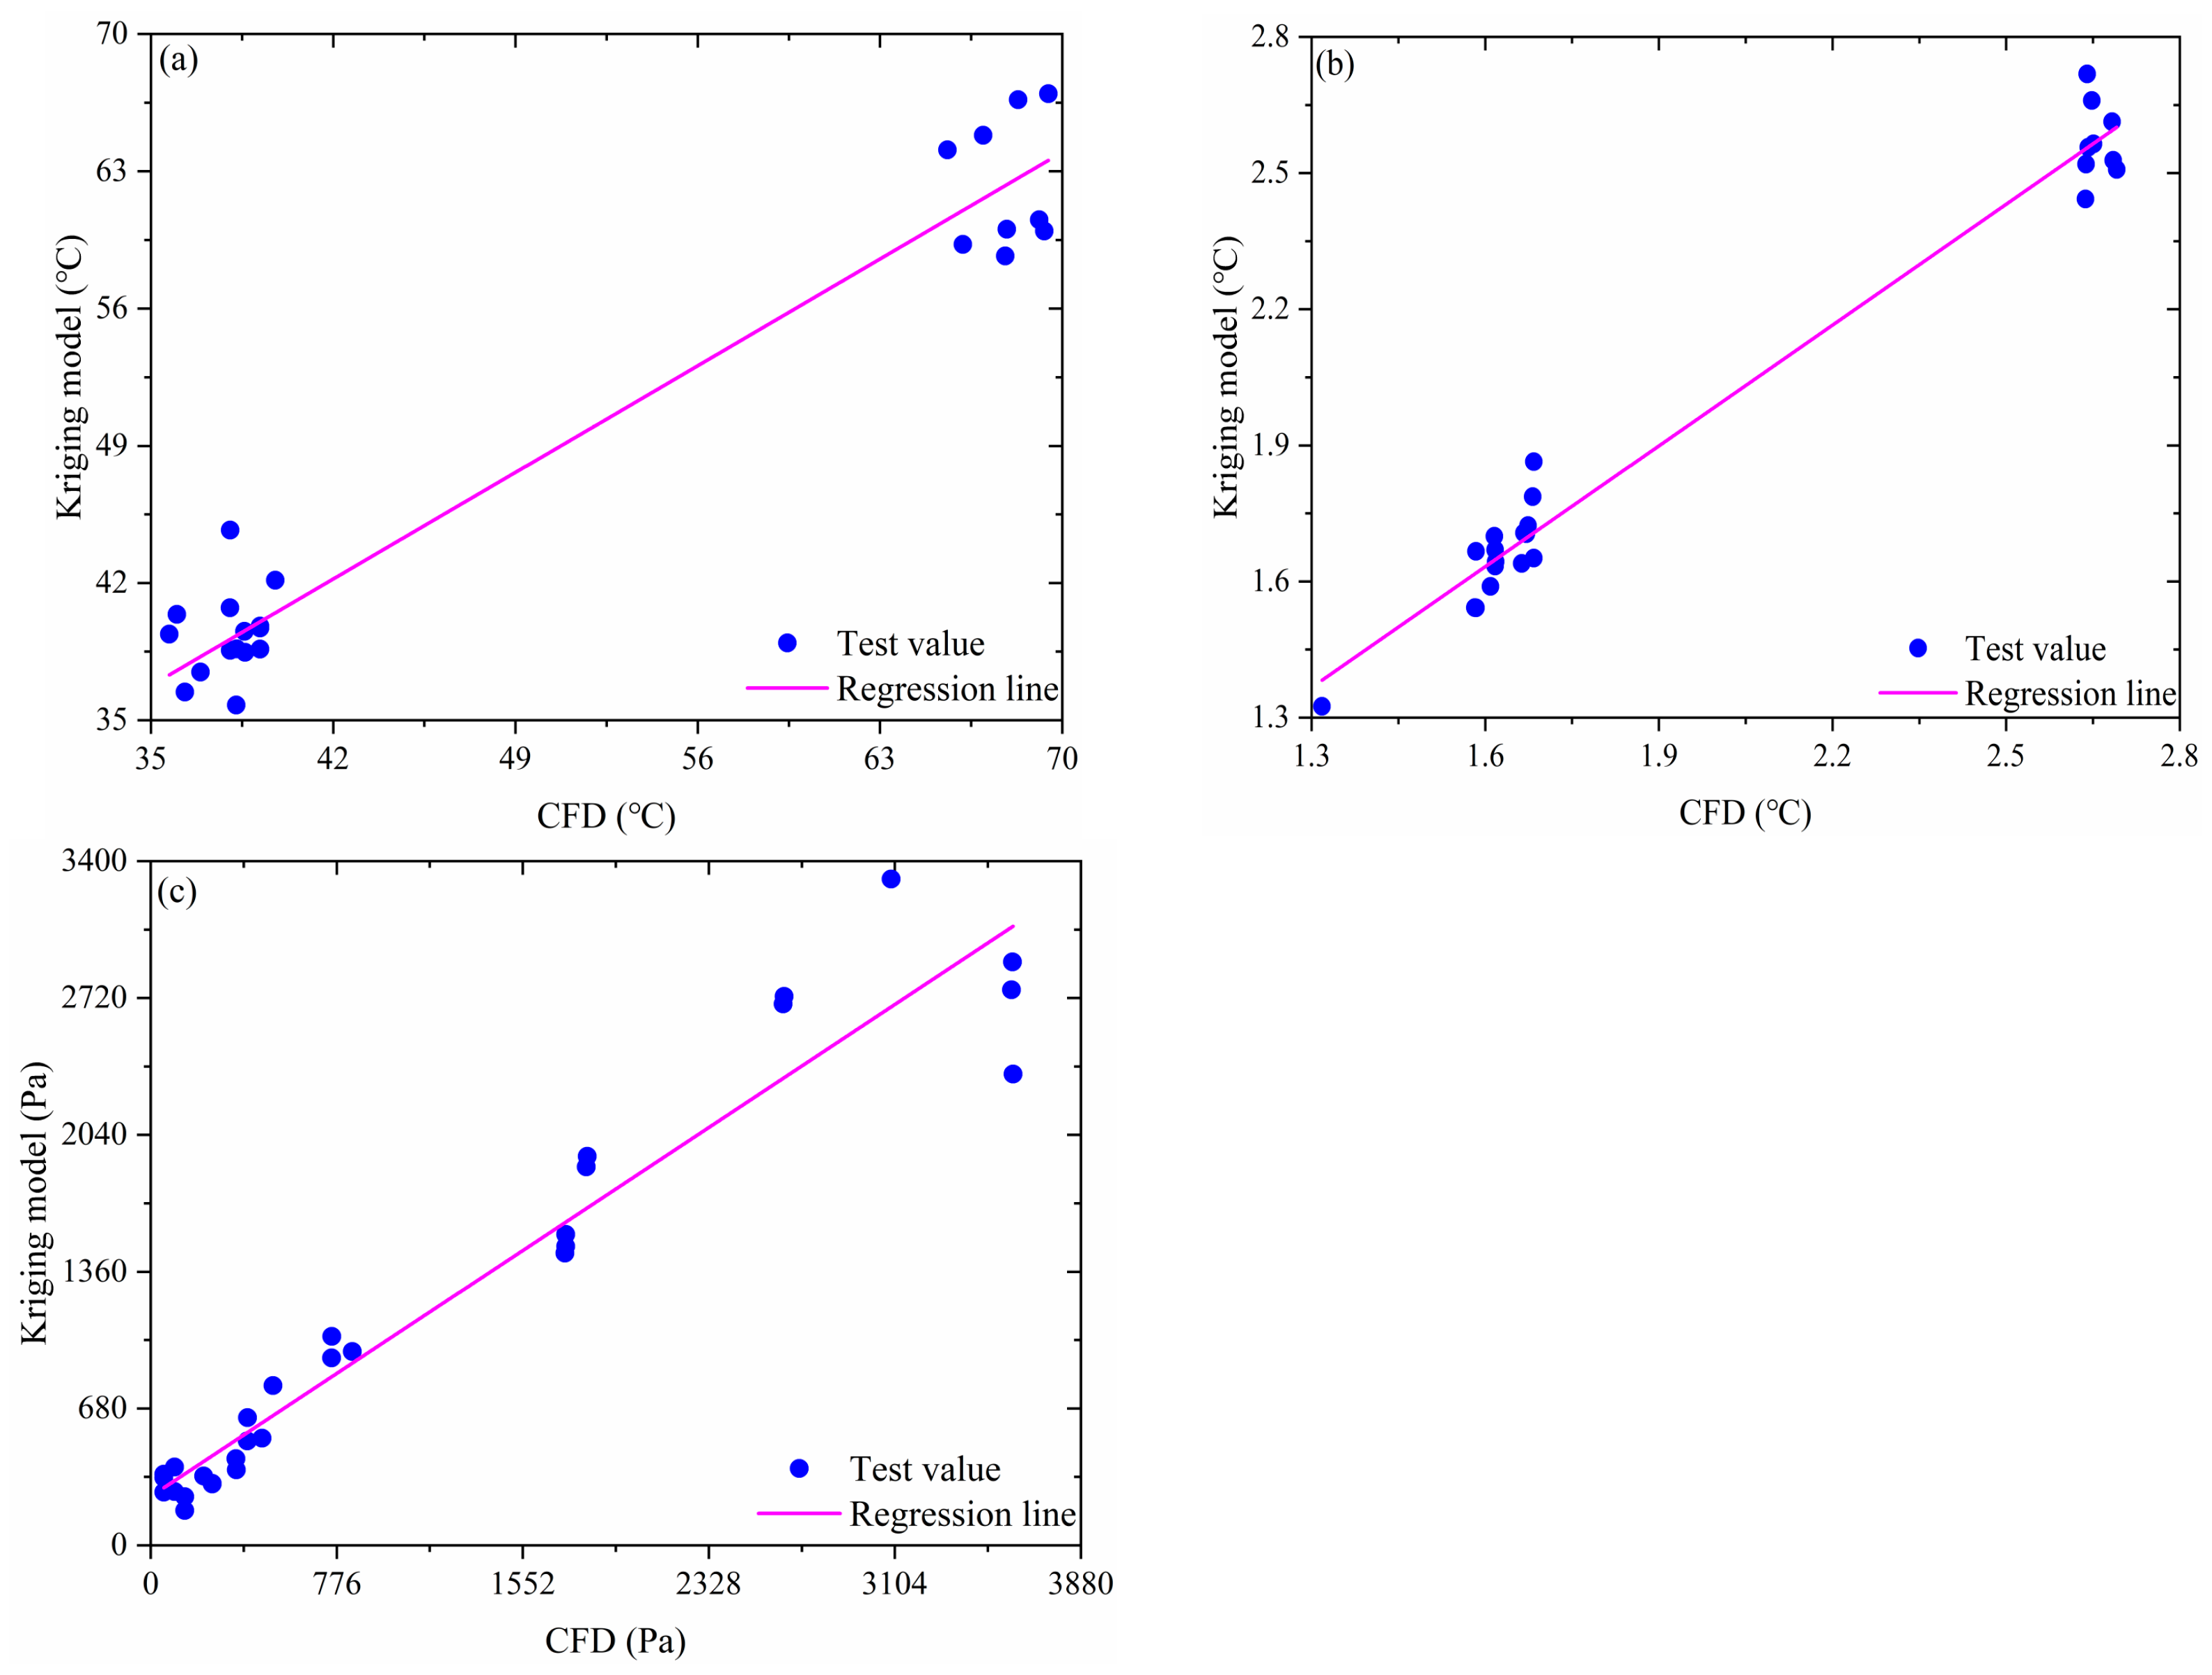
- Kriging approximation model
- (3)
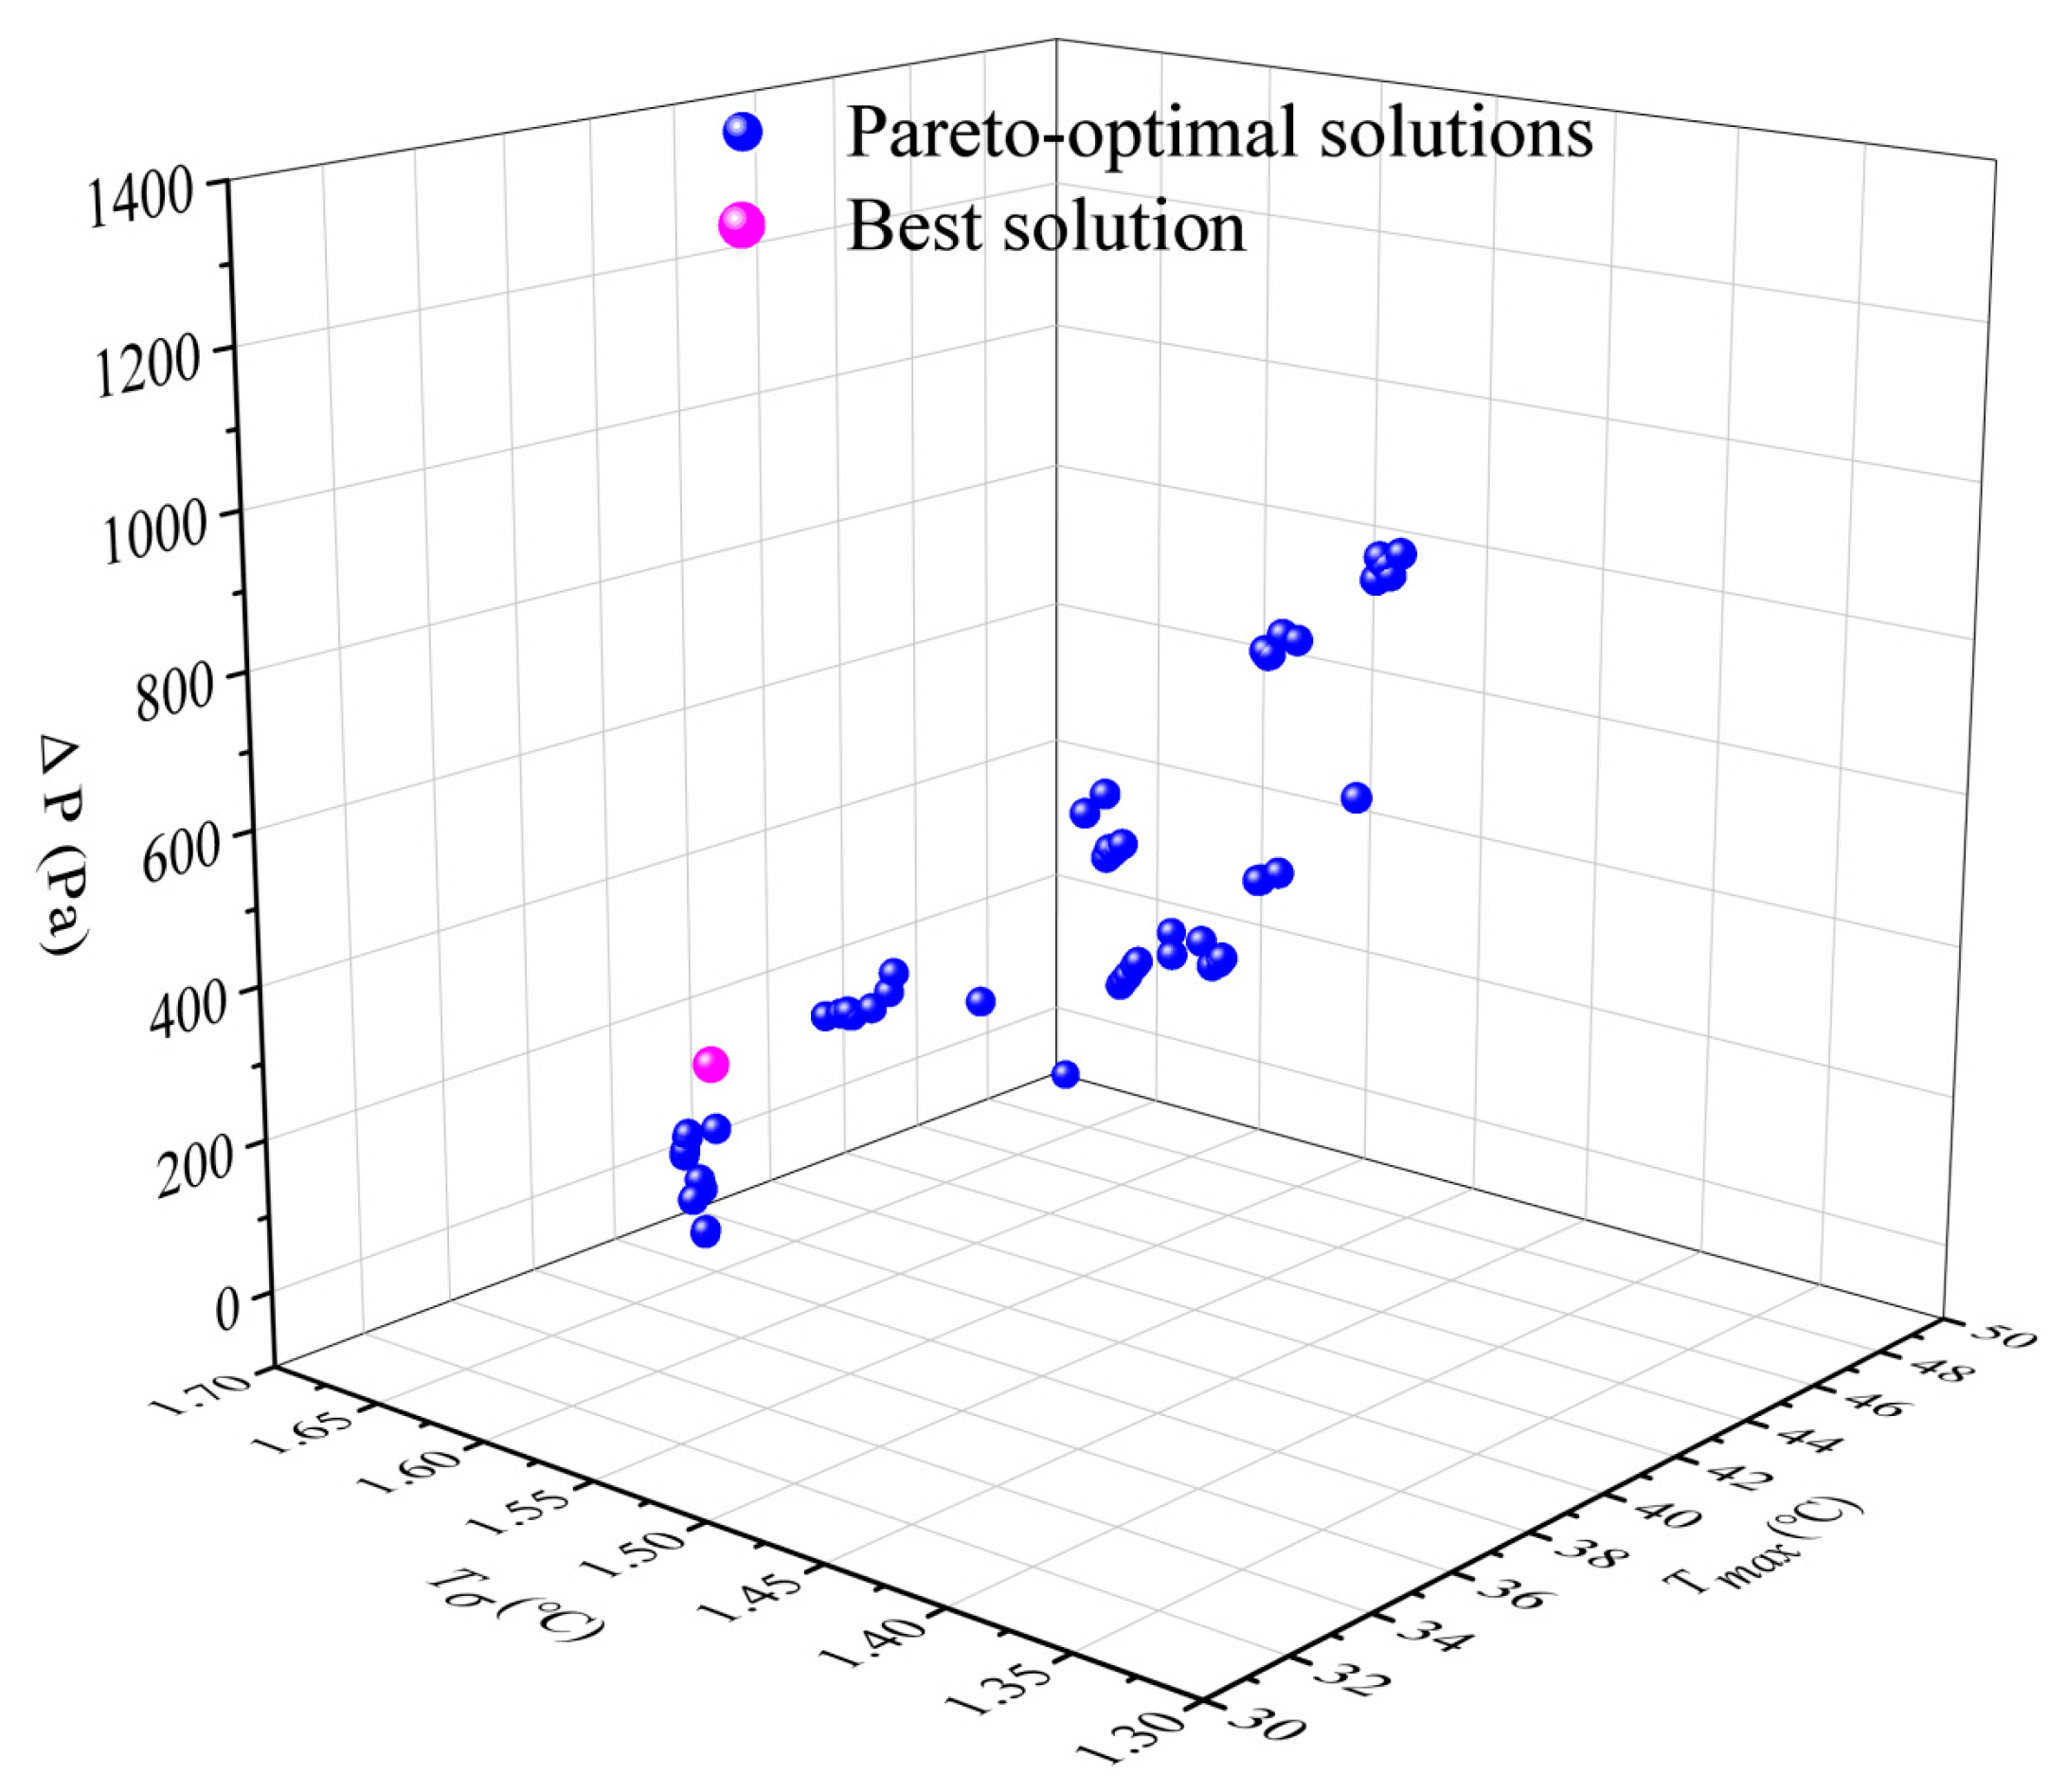
- NCGA global search
4.2. Robustness analysis of MSTV-BTMS
4.3. Optimization Design
5. Experimental Verification and Performance Evaluation
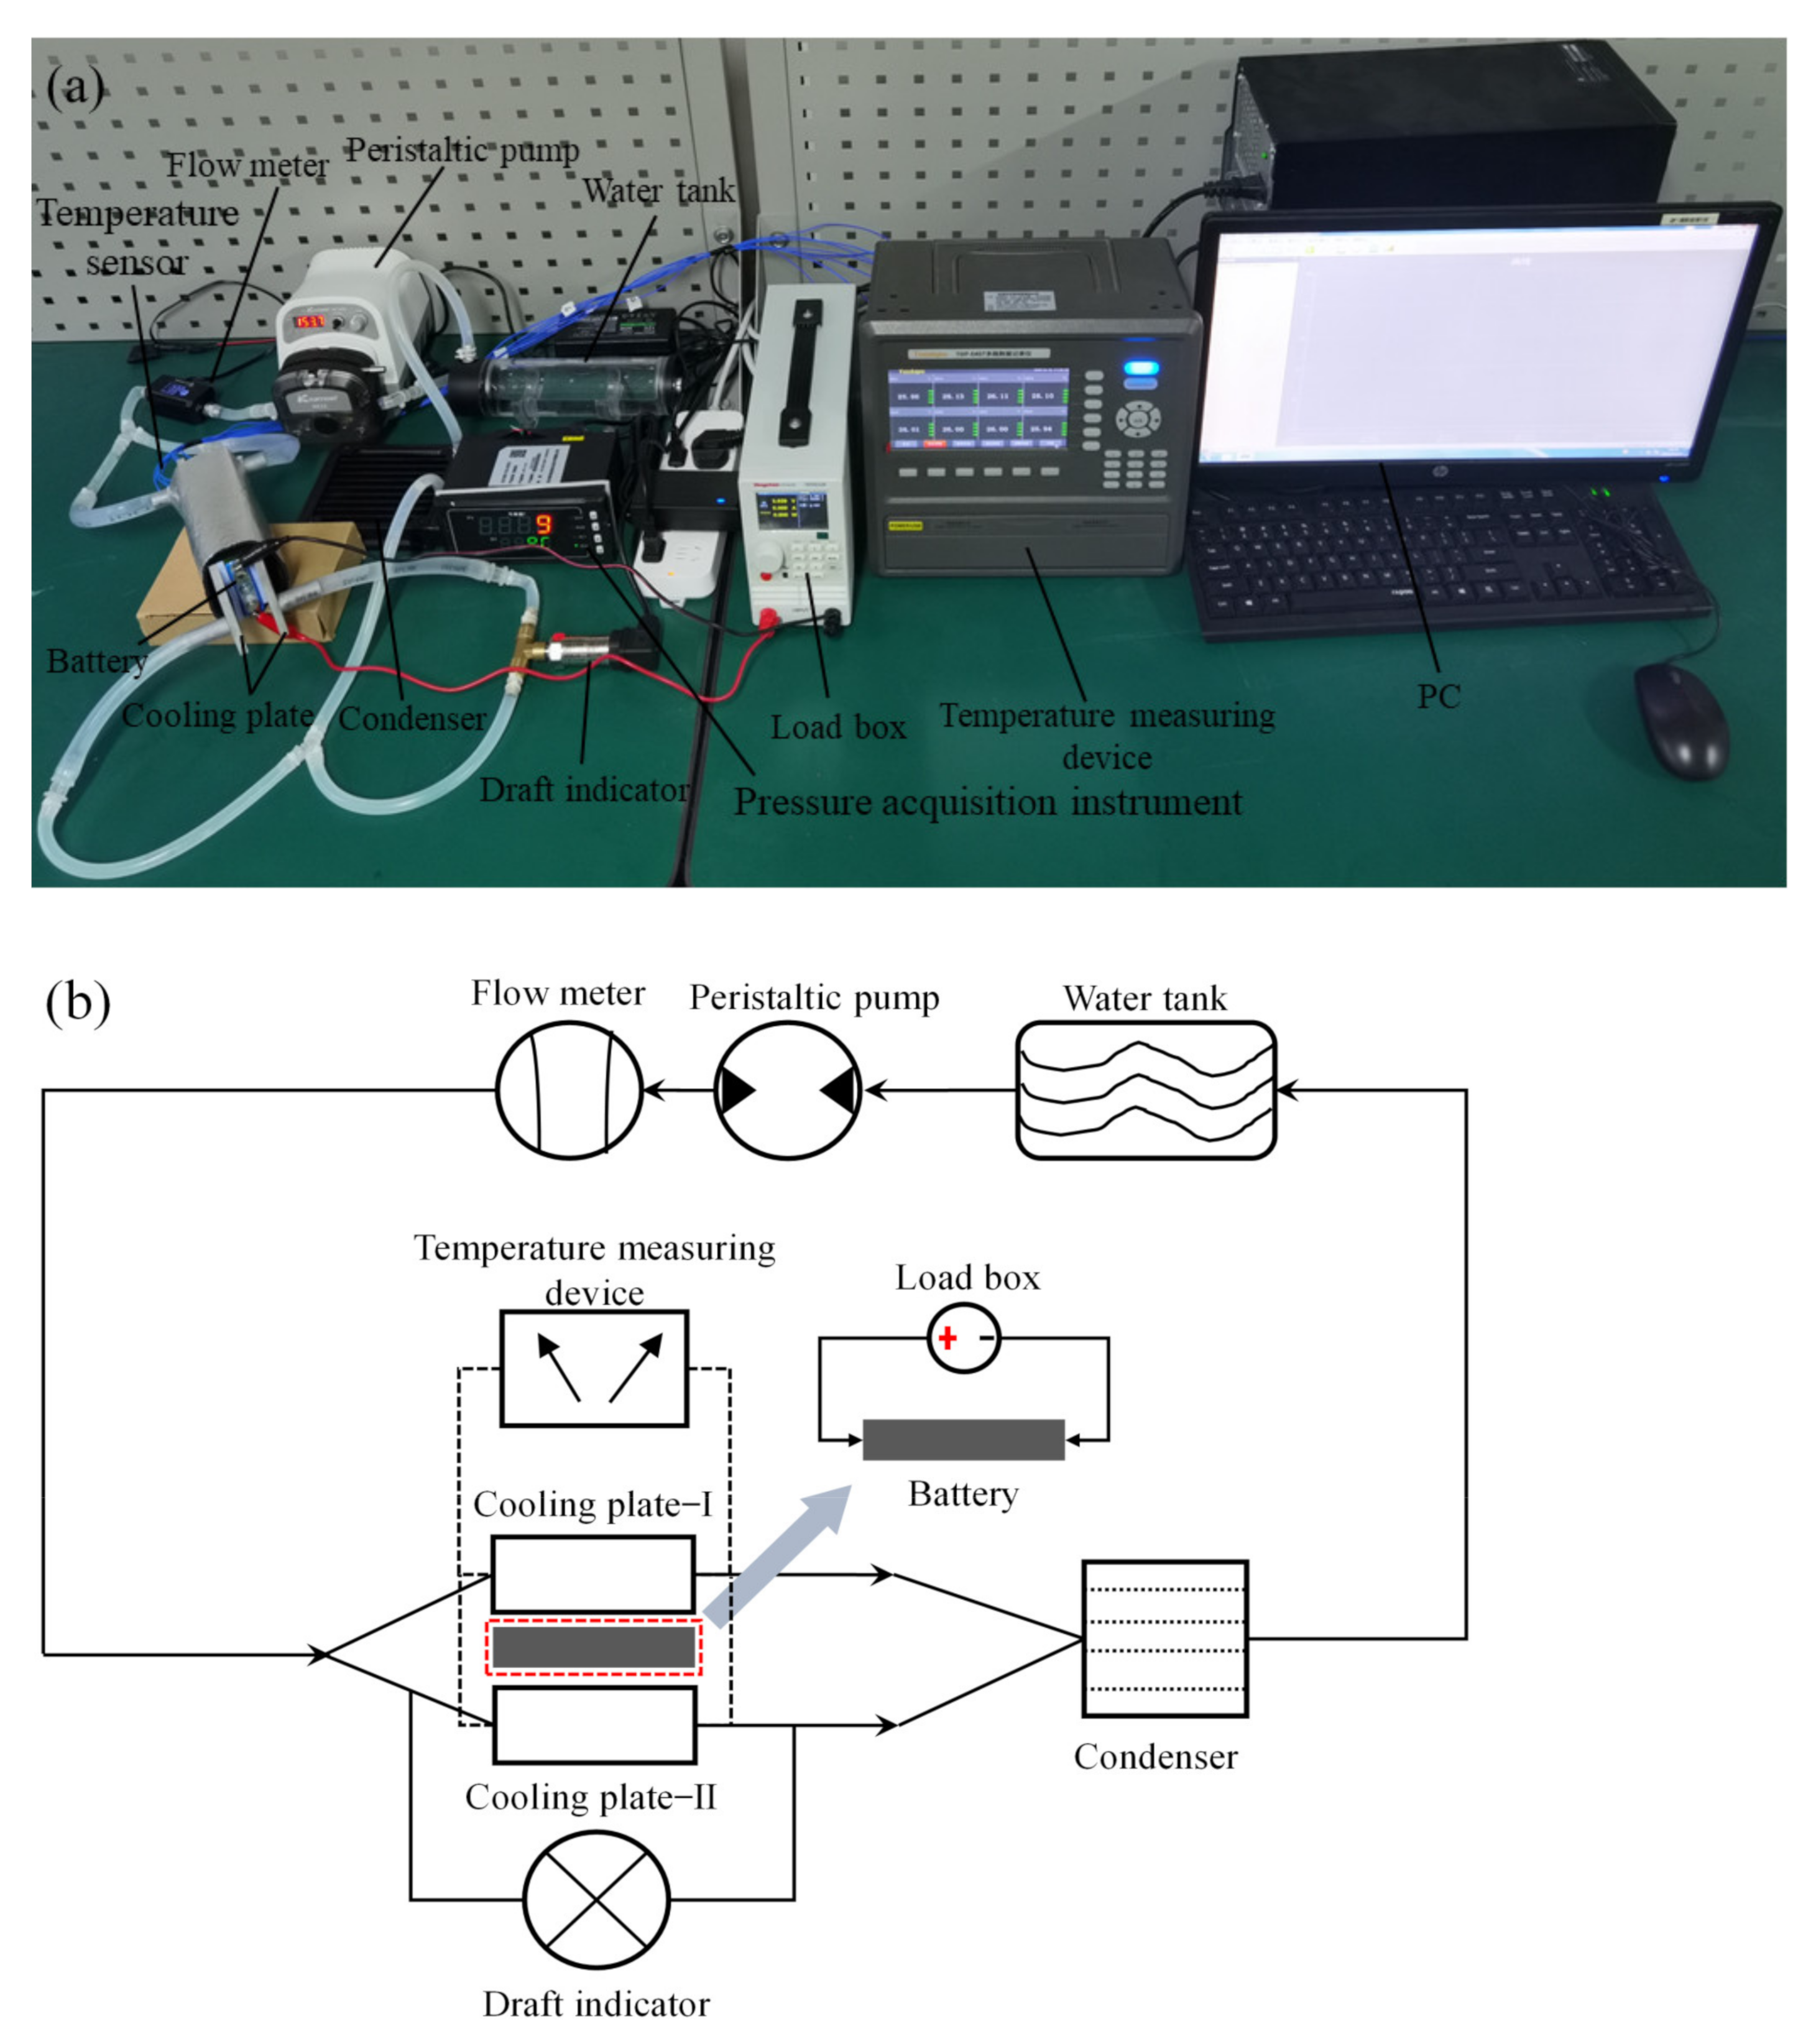
5.1. Experimental Set-Up
5.2. Performance Analysis of Optimal MSTV-BTMS
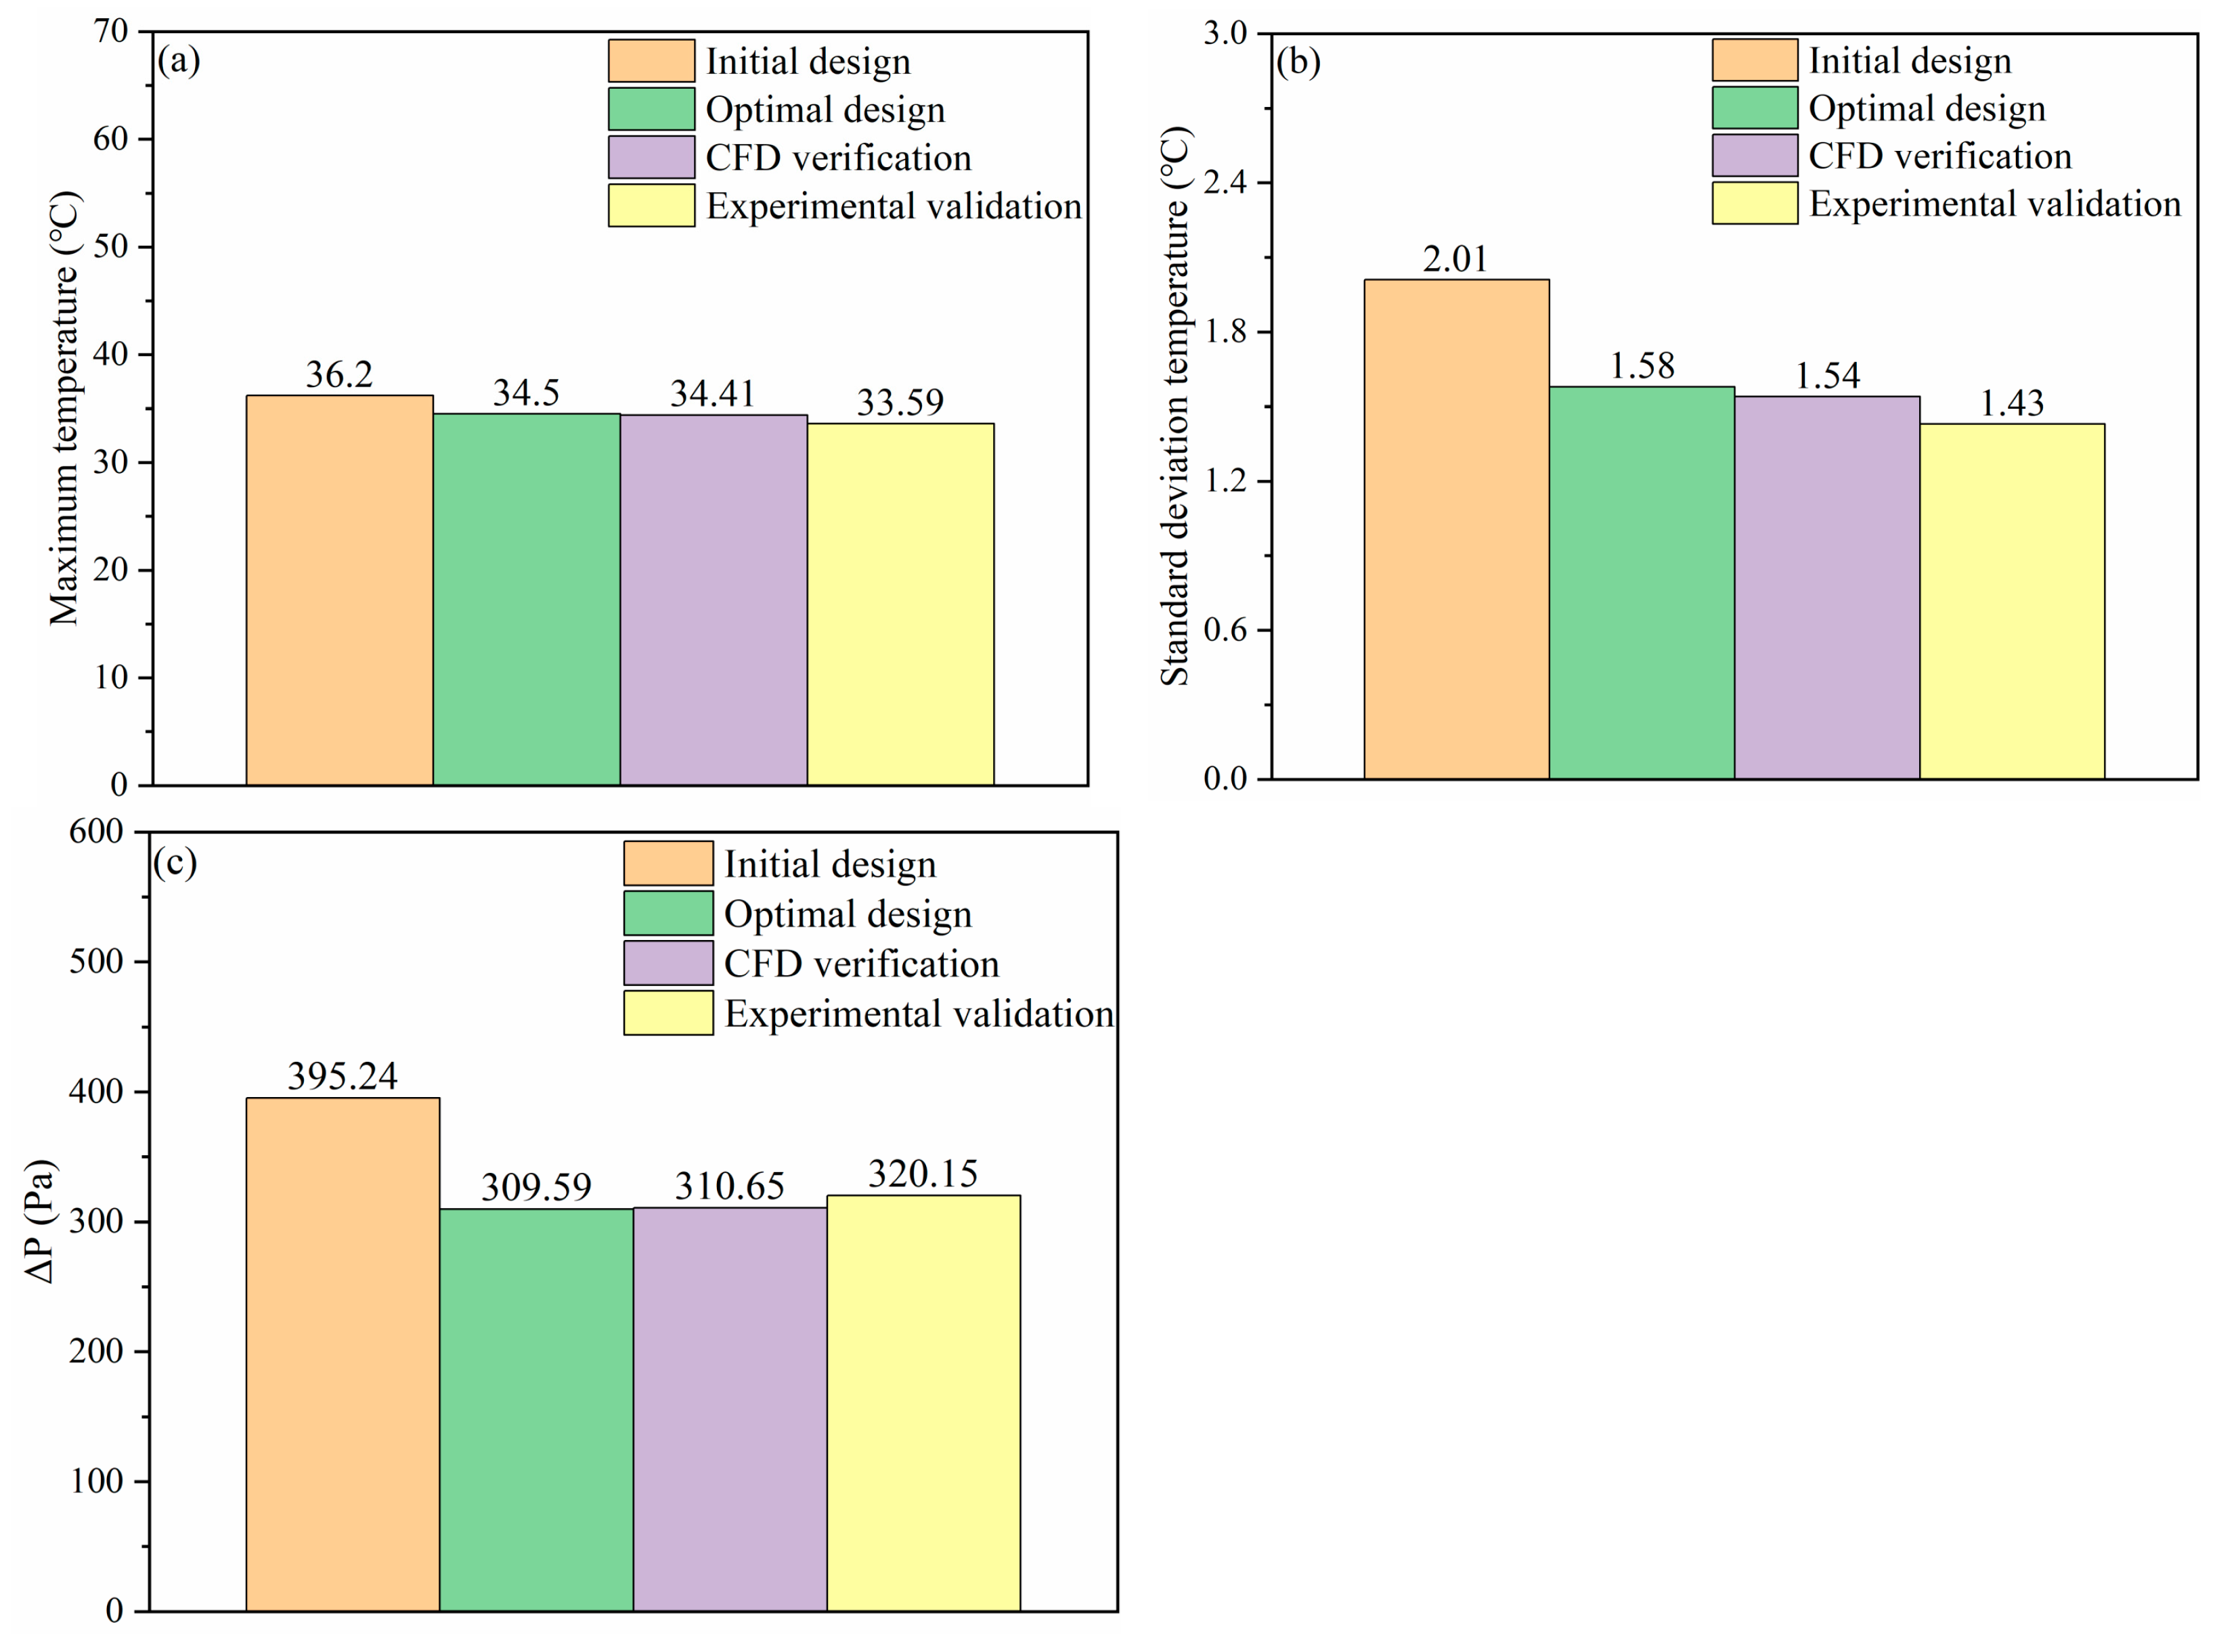
5.2.1. Comparison and Error Analysis between the Experimental Validation and Numerical Calculation
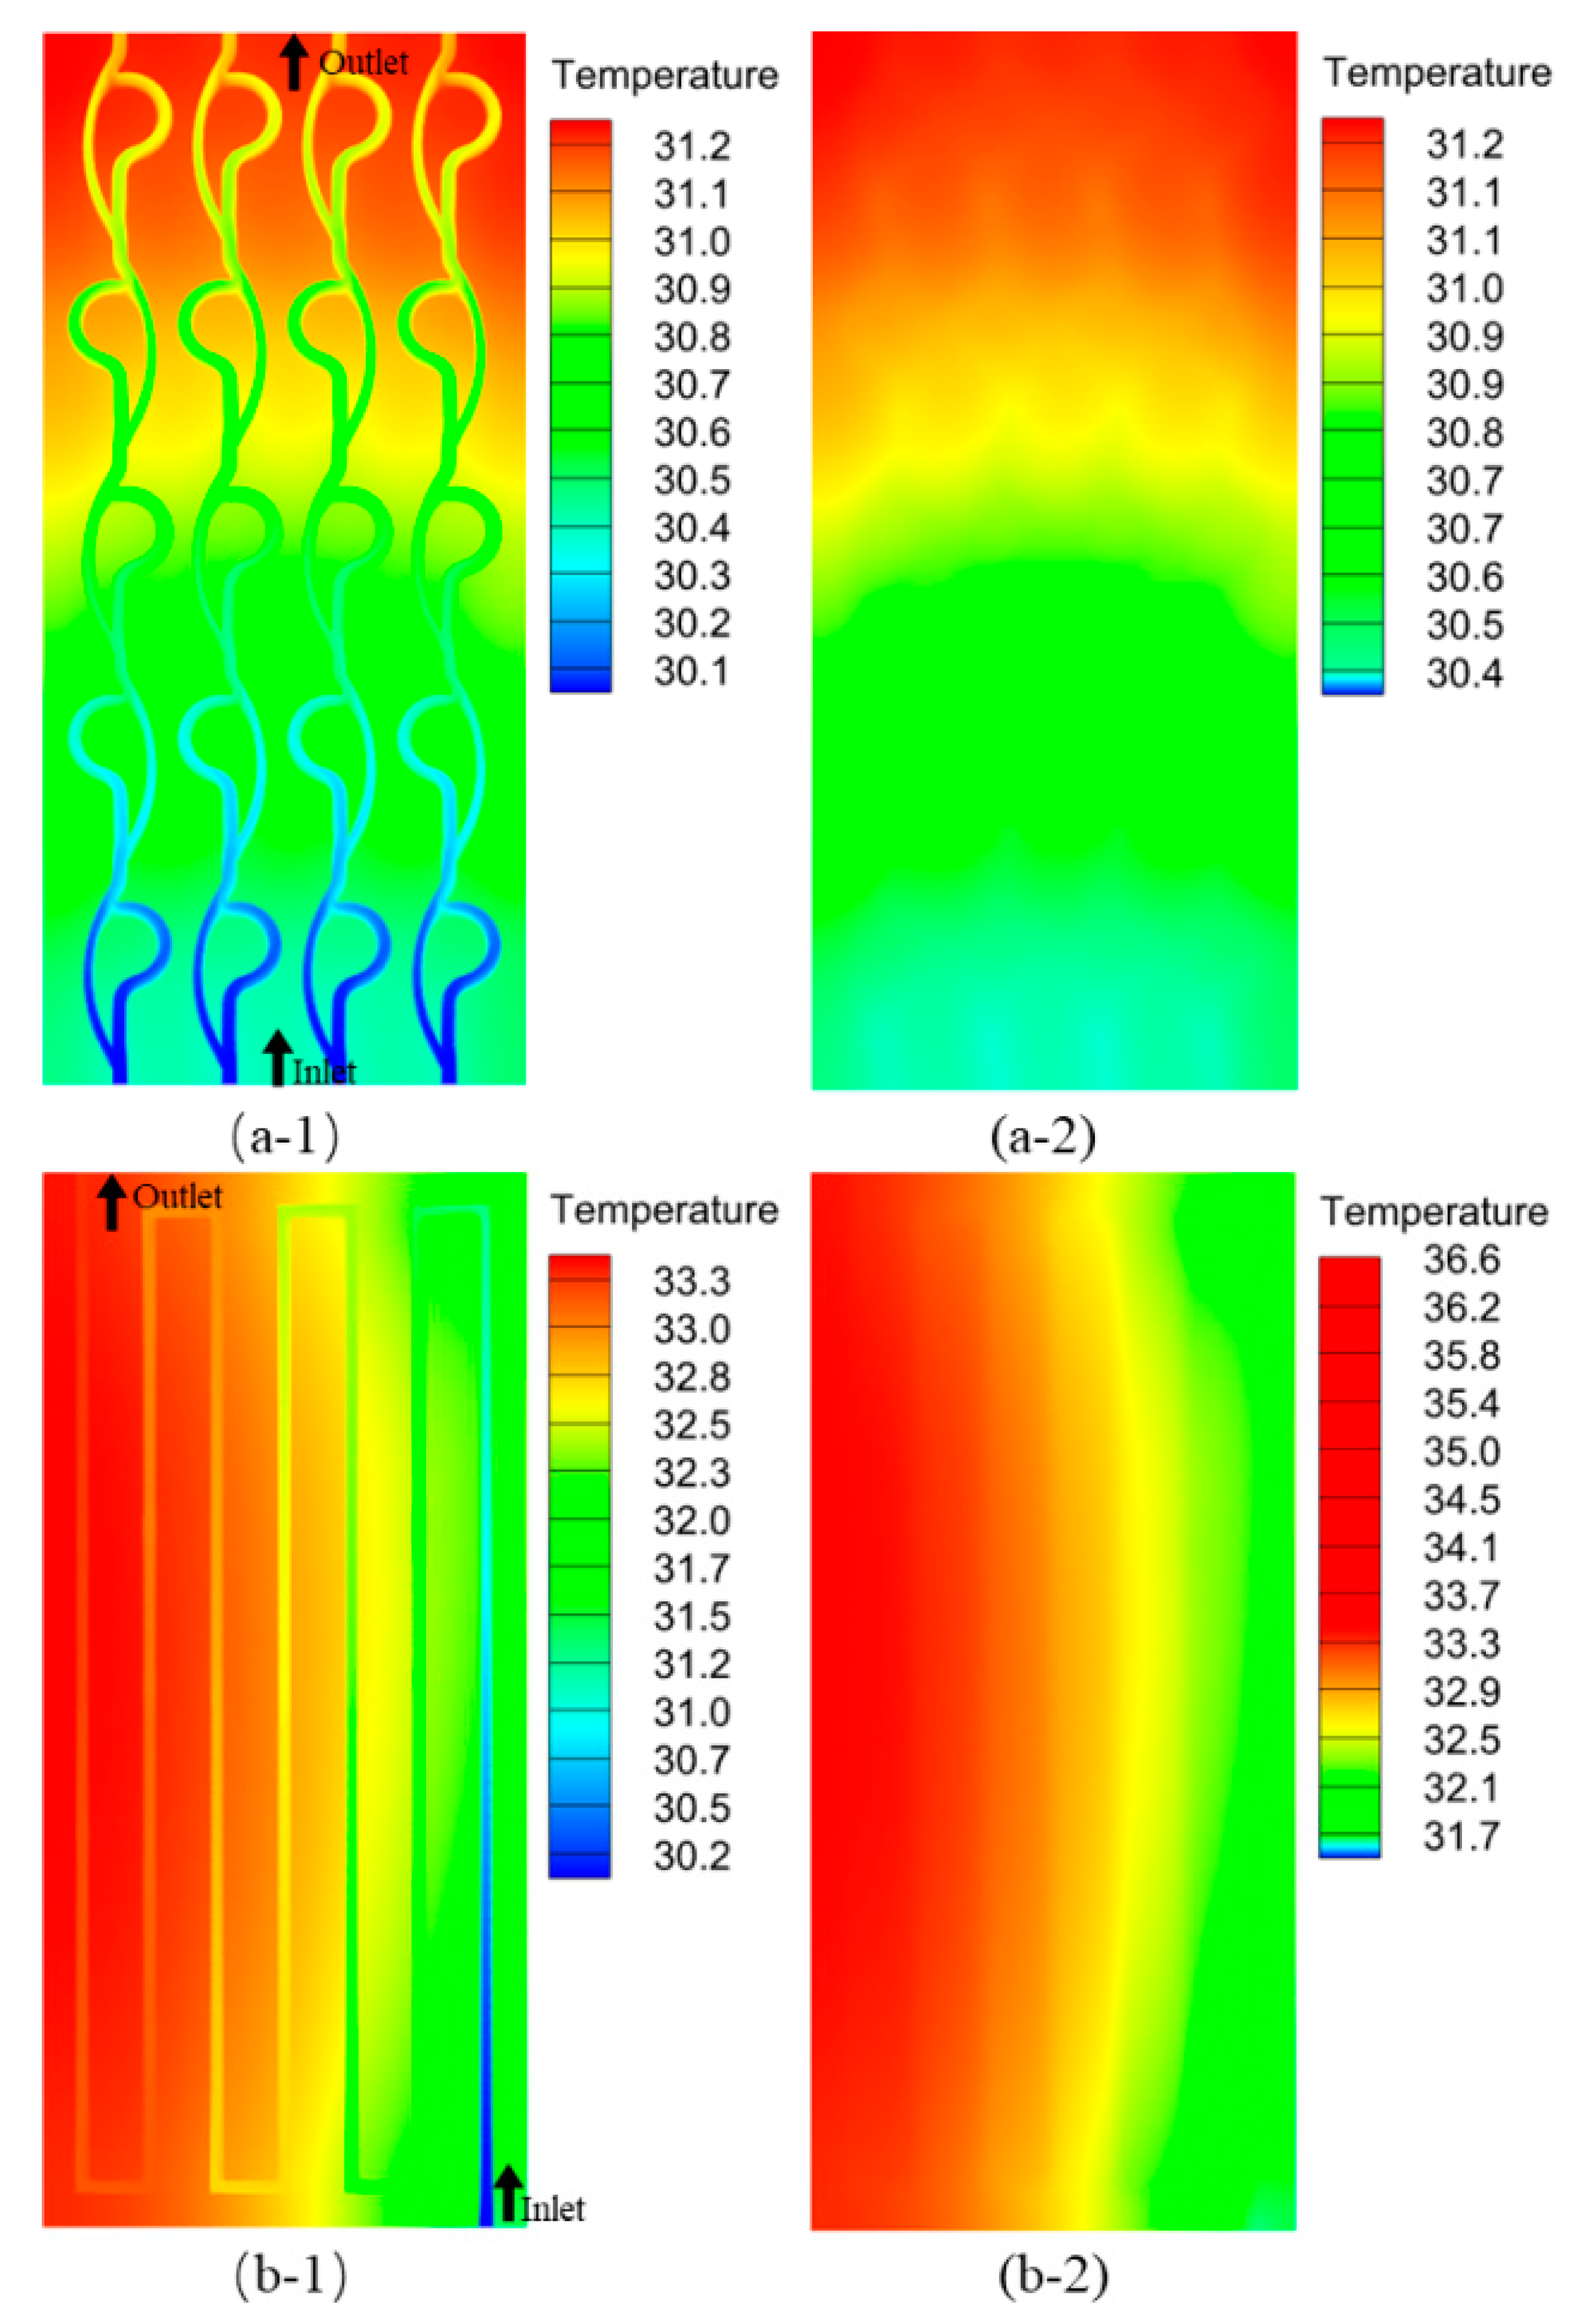
5.2.2. Comparison of Thermal Cooling Performance of Typical Liquid Cooling Channels
6. Conclusions
- (1)
- Sensitivity analysis proved that the MSTV channel had the most significant effect on the temperature distribution uniformity of the lithium-ion battery (90%) and the energy cost of the MSTV-BTMS (87%). A suitable coolant flow rate can significantly improve the maximum temperature of a lithium-ion battery (77%).
- (2)
- Through a multi-objective optimization design on the valve of the MSTV channel spacing, the thickness, and the coolant flow rate, the maximum temperature and the surface standard deviation of a lithium-ion battery can be decreased by 7.7% and 40.6%, respectively. The pump energy consumption to drive the coolant flow was reduced to 23.5%.
- (3)
- The accuracy of the model was verified by experiments, and the errors of maximum temperature difference and the surface standard deviation of a lithium-ion battery were 2.7% and 10.4%, respectively. Moreover, the energy consumption of the pump undertaken to drive the coolant flow was reduced to 23.5 %. The error was considered within the allowable range.
- (4)
- Compared to the traditional serpentine channel, the optimized MSTV-BTMS had a 17.3% better cooling performance.
- (5)
- The future work in extension of the current study would be to focus on the experimental investigations of a 12 Ah prismatic battery module integrated with the proposed liquid cooling plate. Moreover, tests carried out under real-time driving conditions in electric vehicles, such as normalized profile, can be of great interest. In addition, the effects of varying hydraulic diameter, inner curve radius in each Tesla valve, valve angle, number of valves in the MSTV structure, and corresponding optimization of the cooling plate structure can be considered the scope of future work.
Author Contributions
Funding
Data Availability Statement
Conflicts of Interest
Nomenclature
| Ach | Cross-sectional area of a channel, (m2) | Greek symbols | |
| heat capacity, (Jkg−1K−1) | density, (kgm−3) | ||
| d | channel width, (mm) | viscosity, (Pas) | |
| Dh | inlet hydraulic diameter, (m) | standard deviation | |
| G | valve distance, (mm) | channel ridge width, (mm) | |
| convection heat transfer coefficient, (Wm−1K−1) | gradient | ||
| k | thermal conductivity, (Wm−1K−1) | Subscripts | |
| N | number of stages | battery | |
| static pressure of the coolant, (Pa) | coolant | ||
| the perimeter inlet of the MSTV channel, (m2) | maximum | ||
| heat production power of the battery, (W) | min | minimum | |
| heat absorption power of the battery, (W) | Acronyms | ||
| Re | Reynolds number | BTMS | battery thermal management system |
| x direction machining limit | CFD | computational fluid dynamics | |
| T | temperature, () | DOE | design of experiments |
| the mean of bottom temperature, () | EVs | electric vehicles | |
| velocity, (ms−1) | NCGA | neighborhood cultivation genetic algorithm | |
| W | channel thickness, (mm) | MSTV | multi-stage Tesla valve |
| coolant volume fraction | SC | serpentine channel | |
| x, y, z | coordinates, (mm) | TC | thermocouple |
Appendix A
| Run | Design Variables | Objective Function | ||||
| G | W | Re | ||||
| 1 | 11.7 | 0.2 | 150 | 36.9 | 1.63 | 221.00 |
| 2 | 15.56 | 1.27 | 300 | 35.7 | 1.61 | 465.49 |
| 3 | 14.3 | 1.27 | 300 | 35.7 | 1.62 | 464.82 |
| 4 | 14.3 | 1.27 | 225 | 35.7 | 1.61 | 306.39 |
| 5 | 15.56 | 1.27 | 225 | 35.7 | 1.61 | 306.81 |
| 6 | 14.3 | 0.73 | 300 | 36.0 | 1.61 | 511.55 |
| 7 | 15.56 | 0.73 | 300 | 36.0 | 1.60 | 511.54 |
| 8 | 11.7 | 0.2 | 300 | 36.0 | 1.62 | 509.89 |
| 9 | 11.7 | 0.73 | 300 | 36.0 | 1.62 | 509.65 |
| 10 | 14.3 | 1.27 | 150 | 36.1 | 1.61 | 175.96 |
| 11 | 15.56 | 1.27 | 150 | 36.1 | 1.60 | 176.12 |
| 12 | 14.3 | 0.73 | 225 | 36.3 | 1.61 | 357.39 |
| 13 | 15.56 | 0.73 | 225 | 36.3 | 1.60 | 357.20 |
| 14 | 11.7 | 0.2 | 225 | 36.3 | 1.62 | 356.23 |
| 15 | 11.7 | 0.73 | 225 | 36.3 | 1.62 | 356.21 |
| 16 | 14.3 | 0.73 | 150 | 36.9 | 1.62 | 221.62 |
| 17 | 11.7 | 0.73 | 150 | 36.9 | 1.63 | 221.06 |
| 18 | 15.56 | 0.73 | 150 | 36.9 | 1.62 | 221.37 |
| 19 | 14.3 | 1.27 | 75 | 37.2 | 1.63 | 72.29 |
| 20 | 15.56 | 1.27 | 75 | 37.2 | 1.62 | 72.31 |
| 21 | 13.05 | 1.27 | 300 | 38.0 | 1.68 | 3594.86 |
| 22 | 13.05 | 0.2 | 300 | 38.0 | 1.68 | 3595.56 |
| 23 | 14.3 | 0.2 | 300 | 38.0 | 1.68 | 3585.91 |
| 24 | 13.05 | 0.73 | 300 | 38.0 | 1.68 | 3591.04 |
| 25 | 13.05 | 1.8 | 300 | 38.0 | 1.68 | 3597.27 |
| 26 | 15.56 | 0.2 | 300 | 38.0 | 1.68 | 3574.68 |
| 27 | 11.7 | 0.73 | 75 | 38.3 | 1.67 | 100.49 |
| 28 | 11.7 | 0.2 | 75 | 38.3 | 1.67 | 100.44 |
| 29 | 14.3 | 0.73 | 75 | 38.3 | 1.67 | 100.62 |
| 30 | 15.56 | 0.73 | 75 | 38.3 | 1.66 | 100.48 |
| 31 | 13.05 | 1.27 | 225 | 38.6 | 1.67 | 2641.39 |
| 32 | 13.05 | 0.2 | 225 | 38.6 | 1.67 | 2641.81 |
| 33 | 14.3 | 0.2 | 225 | 38.6 | 1.67 | 2635.37 |
| 34 | 15.56 | 0.2 | 225 | 38.6 | 1.67 | 2626.88 |
| 35 | 13.05 | 1.8 | 225 | 38.6 | 1.67 | 2642.74 |
| 36 | 13.05 | 0.73 | 225 | 38.6 | 1.67 | 2638.49 |
| 37 | 13.05 | 1.27 | 150 | 39.2 | 1.58 | 1731.20 |
| 38 | 13.05 | 0.2 | 150 | 39.2 | 1.58 | 1731.43 |
| 39 | 14.3 | 0.2 | 150 | 39.2 | 1.58 | 1727.55 |
| 40 | 15.56 | 0.2 | 150 | 39.2 | 1.58 | 1721.94 |
| 41 | 13.05 | 1.8 | 150 | 39.2 | 1.59 | 1732.05 |
| 42 | 13.05 | 0.73 | 150 | 39.2 | 1.59 | 1729.29 |
| 43 | 14.3 | 0.2 | 75 | 39.8 | 1.32 | 839.72 |
| 44 | 13.05 | 1.27 | 75 | 39.8 | 1.32 | 841.36 |
| 45 | 15.56 | 0.2 | 75 | 39.8 | 1.32 | 836.91 |
| 46 | 13.05 | 0.2 | 75 | 39.8 | 1.31 | 817.82 |
| 47 | 13.05 | 1.8 | 75 | 39.8 | 1.32 | 841.87 |
| 48 | 13.05 | 0.73 | 75 | 39.8 | 1.32 | 840.54 |
| 49 | 11.7 | 1.8 | 300 | 43.6 | 1.65 | 403.58 |
| 50 | 11.7 | 1.8 | 225 | 43.7 | 1.64 | 256.90 |
| 51 | 11.7 | 1.8 | 150 | 43.9 | 1.64 | 141.71 |
| 52 | 11.7 | 1.8 | 75 | 44.5 | 1.64 | 54.94 |
| 53 | 14.3 | 1.8 | 300 | 44.6 | 1.65 | 403.88 |
| 54 | 14.3 | 1.8 | 225 | 44.8 | 1.64 | 257.38 |
| 55 | 14.3 | 1.8 | 150 | 45 | 1.64 | 142.07 |
| 56 | 14.3 | 1.8 | 75 | 45.5 | 1.64 | 55.07 |
| 57 | 15.56 | 1.8 | 300 | 44.9 | 1.69 | 403.19 |
| 58 | 15.56 | 1.8 | 225 | 45.0 | 1.69 | 257.40 |
| 59 | 15.56 | 1.8 | 150 | 45.4 | 1.68 | 142.15 |
| 60 | 15.56 | 1.8 | 75 | 46.3 | 1.69 | 55.05 |
| 61 | 11.7 | 1.27 | 300 | 39.2 | 1.65 | 403.56 |
| 62 | 11.7 | 1.27 | 225 | 39.4 | 1.65 | 257.15 |
| 63 | 11.7 | 1.27 | 150 | 39.6 | 1.64 | 141.97 |
| 64 | 11.7 | 1.27 | 75 | 40.4 | 1.64 | 55.00 |
References
- Zhang, X.; Li, Z.; Luo, L.; Fan, Y.; Du, Z. A review on thermal management of lithium-ion batteries for electric vehicles. Energy 2022, 238, 121652. [Google Scholar] [CrossRef]
- Liu, H.; Wei, Z.; He, W.; Zhao, J. Thermal issues about Li-ion batteries and recent progress in battery thermal management systems: A review. Energy Convers. Manag. 2017, 150, 304–330. [Google Scholar] [CrossRef]
- Mali, V.; Saxena, R.; Kumar, K.; Kalam, A.; Tripathi, B. Review on battery thermal management systems for energy-efficient electric vehicles. Renew. Sust. Energ. Rev. 2021, 151, 111611. [Google Scholar] [CrossRef]
- Putra, N.; Sandi, A.F.; Ariantara, B.; Abdullah, N.; Mahlia, T.M.I. Performance of beeswax phase change material and heat pipe as passive battery cooling system for electric vehicles. Case Stud. Therm. Eng. 2020, 21, 100655. [Google Scholar] [CrossRef]
- Guo, R.; Li, L. Heat dissipation analysis and optimization of lithium-ion batteries with a novel parallel-spiral serpentine channel liquid cold plate. Int. J. Heat Mass Transf. 2022, 189, 122706. [Google Scholar] [CrossRef]
- Huang, Y.; Wei, C.; Fang, Y. Numerical investigation on optimal design of battery cold plate for uneven heat generation conditions in electric vehicles. Appl. Therm. Eng. 2022, 211, 118476. [Google Scholar] [CrossRef]
- Xie, J.; Wang, Y.; He, S.; Zhang, G.; Liu, X.; Yang, X. A simple cooling structure with precisely-tailored liquid cold plate for thermal management of large battery module. Appl. Therm. Eng. 2022, 212, 118575. [Google Scholar] [CrossRef]
- Li, J.; Zuo, W.; Jiaqiang, E.; Zhang, Y.; Li, Q.; Sun, K.; Zhou, K.; Zhang, G. Multi-objective optimization of mini U-channel cold plate with SiO2 nanofluid by RSM and NSGA-II. Energy 2022, 242, 123039. [Google Scholar] [CrossRef]
- Zhai, Y.; Xia, G.; Li, Z.; Wang, H. A novel flow arrangement of staggered flow in double-layered microchannel heat sinks for microelectronic cooling. Int. Commun. Heat Mass Transf. 2016, 79, 98–104. [Google Scholar] [CrossRef]
- Larrañaga-Ezeiza, M.; Vertiz, G.; Arroiabe, P.F.; Martinez-Agirre, M.; Berasategi, J. A novel direct liquid cooling strategy for electric vehicles focused on pouch type battery cells. Appl. Therm. Eng. 2022, 216, 118869. [Google Scholar] [CrossRef]
- Murray, C.D. The physiological principle of minimum work: II. Oxygen exchange in capillaries. Proc. Natl. Acad. Sci. USA 1926, 12, 299–304. [Google Scholar] [CrossRef] [PubMed]
- Bejan, A.; Lorente, S. Constructal theory of generation of configuration in nature and engineering. J. Appl. Phys. 2006, 100, 5. [Google Scholar] [CrossRef]
- He, P.; Lu, H.; Fan, Y.; Ruan, H.; Wang, C.; Zhu, Y. Numerical investigation on a lithium-ion battery thermal management system utilizing a double-layered I-shaped channel liquid cold plate exchanger. Int. J. Therm. Sci. 2023, 187, 108200. [Google Scholar] [CrossRef]
- Qi, W.; Huang, W.; Niu, J.; Chen, F.; Chen, B.; Chen, Y. Thermal management of power battery based on flexible Swiss roll type liquid cooling micro-channel. Appl. Therm. Eng. 2023, 219, 119491. [Google Scholar] [CrossRef]
- Wu, X.; Mo, C.; Li, X.; Li, C.; Lin, R.; Zeng, Y.; Cao, J.; Liu, X. Experiment investigation on optimization of cylinder battery thermal management with microchannel flat tubes coupled with composite silica gel. J. Power Sources 2022, 56, 105871. [Google Scholar] [CrossRef]
- Gamboa, A.R.; Morris, C.J.; Forster, F.K. Improvements in fixed-valve micropump performance through shape optimization of valves. J. Fluids Eng. 2005, 127, 339–346. [Google Scholar] [CrossRef]
- Tuckerman, D.B.; Pease, R.F.W. High-performance heat sinking for VLSI. IEEE Electron Device Lett. 1981, 2, 126–129. [Google Scholar] [CrossRef]
- Monika, K.; Chakraborty, C.; Roy, S.; Sujith, R.; Datta, S.P. A numerical analysis on multi-stage Tesla valve based cold plate for cooling of pouch type Li-ion batteries. Int. J. Heat Mass Transf. 2021, 177, 121560. [Google Scholar] [CrossRef]
- Rui, Z.; Zhao, F.; Sun, H.; Sun, L.; Peng, H. Experimental research on flow boiling thermal-hydraulic characteristics in novel microchannels. Exp. Therm. Fluid Sci. 2023, 140, 110755. [Google Scholar] [CrossRef]
- Sun, L.; Li, J.; Xu, H.; Ma, J.; Peng, H. Numerical study on heat transfer and flow characteristics of novel microchannel heat sinks. Int. J. Therm. Sci. 2022, 176, 107535. [Google Scholar] [CrossRef]
- Bao, Y.; Wang, H. Numerical study on flow and heat transfer characteristics of a novel Tesla valve with improved evaluation method. Int. J. Heat Mass Transf. 2022, 187, 122540. [Google Scholar] [CrossRef]
- Li, X.; Zhang, X.; Li, W.; Wang, Z.; Zhang, X.; Zhao, Y. The 3D Tesla Valve Manifold Two-Phase Cold plate for the SiC Power Device Module. In Proceedings of the 2022 21st IEEE Intersociety Conference on Thermal and Thermomechanical Phenomena in Electronic Systems (iTherm), San Diego, CA, USA, 31 May–1 June 2022; pp. 1–8. [Google Scholar] [CrossRef]
- Fan, Y.; Wang, Z.; Xiong, X.; Zhu, J.; Gao, Q.; Wang, H.; Wu, H. Novel concept design of low energy hybrid battery thermal management system using PCM and multistage Tesla valve liquid cooling. Appl. Therm. Eng. 2023, 220, 119680. [Google Scholar] [CrossRef]
- Porwal, P.R.; Thompson, S.M.; Walters, D.K.; Jamal, T. Heat transfer and fluid flow characteristics in multistaged Tesla valves. Numer. Heat Transf. Part A Appl. 2018, 73, 347–365. [Google Scholar] [CrossRef]
- De Vries, S.F.; Florea, D.; Homburg, F.G.A.; Frijns, A.J.H. Design and operation of a Tesla-type valve for pulsating heat pipes. Int. J. Heat Mass Transf. 2017, 105, 1–11. [Google Scholar] [CrossRef]
- Liang, L.; Zhao, Y.; Diao, Y.; Ren, R.; Zhang, L.; Wang, G. Optimum cooling surface for prismatic lithium-ion battery with metal shell based on anisotropic thermal conductivity and dimensions. J. Power Sources 2021, 506, 230182. [Google Scholar] [CrossRef]
- Drake, S.J.; Wetz, D.A.; Ostanek, J.K.; Miller, S.P.; Heinzel, J.M.; Jain, A. Measurement of anisotropic thermophysical properties of cylindrical Li-ion cells. J. Power Sources 2014, 252, 298–304. [Google Scholar] [CrossRef]
- Chen, S.; Zhang, G.; Zhu, J.; Feng, X.; Wei, X.; Ouyang, M.; Dai, H. Multi-objective optimization design and experimental investigation for a parallel liquid cooling-based lithium-ion battery module under fast charging. Appl. Therm. Eng. 2022, 211, 118503. [Google Scholar] [CrossRef]
- Sheng, L.; Su, L.; Zhang, H. Experimental determination on thermal parameters of prismatic lithium-ion battery cells. Int. J. Heat Mass Transf. 2019, 139, 231–239. [Google Scholar] [CrossRef]
- Bernardi, D.; Pawlikowski, E.; Newman, J. A general energy balance for battery systems. J. Electrochem. Soc. 1985, 132, 5. [Google Scholar] [CrossRef]
- Peng, X.; Ma, C.; Garg, A.; Bao, N.; Liao, X. Thermal performance investigation of an air-cooled lithium-ion battery pack considering the inconsistency of battery cells. Appl. Therm. Eng. 2019, 153, 596–603. [Google Scholar] [CrossRef]
- Panchal, S. Experimental Investigation and Modeling of Lithium-Ion Battery Cells and Packs for Electric Vehicles. Ph.D. Thesis, Ontario Tech University, Oshawa, ON, Canada, 2016. Available online: https://hdl.handle.net/10155/747 (accessed on 1 January 2016).
- Fan, Y.; Wang, Z.; Fu, T.; Wu, H. Numerical investigation on lithium-ion battery thermal management utilizing a novel tree-like channel liquid cold plate exchanger. Int. J. Heat Mass Transf. 2022, 183, 122143. [Google Scholar] [CrossRef]
- Bahiraei, F.; Fartaj, A.; Nazri, G.A. Electrochemical-thermal modeling to evaluate active thermal management of a lithium-ion battery module. Electrochim. Acta 2017, 254, 59–71. [Google Scholar] [CrossRef]
- Huang, H.; Wang, H.; Gu, J.; Wu, Y. High-dimensional model representation-based global sensitivity analysis and the design of a novel thermal management system for lithium-ion batteries. Energy Convers. Manag. 2019, 190, 54–72. [Google Scholar] [CrossRef]
- Zhao, R.; Gu, J.; Liu, J. Optimization of a phase change material based internal cooling system for cylindrical Li-ion battery pack and a hybrid cooling design. Energy 2017, 135, 811–822. [Google Scholar] [CrossRef]
- Ghaedamini, H.; Salimpour, M.R.; Campo, A. Constructal design of reverting microchannels for convective cooling of a circular disc. Int. J. Therm. Sci. 2011, 50, 1051–1061. [Google Scholar] [CrossRef]
- Hung, T.C.; Yan, W.M.; Wang, X.D.; Huang, Y.X. Optimal design of geometric parameters of double-layered microchannel heat sinks. Int. J. Heat Mass Transf. 2012, 55, 3262–3272. [Google Scholar] [CrossRef]
- Kechagias, J.D.; Aslani, K.E.; Fountas, N.A.; Vaxevanidis, N.M.; Manolakos, D.E. A comparative investigation of Taguchi and full factorial design for machinability prediction in turning of a titanium alloy. Measuremen 2020, 151, 107213. [Google Scholar] [CrossRef]
- Kleijnen, J.P. Kriging metamodeling in simulation: A review. Eur. J. Oper. Res. 2009, 192, 707–716. [Google Scholar] [CrossRef]
- Ulaganathan, S.; Couckuyt, I.; Deschrijver, D.; Laermans, E.; Dhaene, T. A Matlab toolbox for Kriging metamodelling. Procedia Comput. Sci. 2015, 51, 2708–2713. [Google Scholar] [CrossRef]
- Watanabe, S.; Hiroyasu, T.; Miki, M. Neighborhood cultivation genetic algorithm for multi-objective optimization problems. In Proceedings of the 4th Asia-Pacific Conference on Simulated Evolution and Learning (SEAL-2002), Singapore, 18–22 November 2002; pp. 198–202. [Google Scholar] [CrossRef]
- Bagherzadeh, S.A.; D’Orazio, A.; Karimipour, A.; Goodarzi, M.; Bach, Q.V. A novel sensitivity analysis model of EANN for F-MWCNTs–Fe3O4/EG nanofluid thermal conductivity: Outputs predicted analytically instead of numerically to more accuracy and less costs. Phys. A 2019, 521, 406–415. [Google Scholar] [CrossRef]
- Alrashed, A.A.; Gharibdousti, M.S.; Goodarzi, M.; de Oliveira, L.R.; Safaei, M.R.; Bandarra Filho, E.P. Effects on thermophysical properties of carbon based nanofluids: Experimental data, modelling using regression, ANFIS and ANN. Int. J. Heat Mass Transf. 2018, 125, 920–932. [Google Scholar] [CrossRef]
- Kandlikar, S.G.; Grande, W.J. Evolution of microchannel flow passages--thermohydraulic performance and fabrication technology. Heat Transf. Eng. 2003, 24, 3–17. [Google Scholar] [CrossRef]
- Lee, J.; Darges, S.J.; Mudawar, I. Experimental investigation and analysis of parametric trends of instability in two-phase micro-channel heat sinks. Int. J. Heat Mass Transf. 2021, 170, 120980. [Google Scholar] [CrossRef]


| Parameter | Value | Parameter | Value |
|---|---|---|---|
| Nominal capacity (Ah) | 12 | Discharge cut-off voltage (V) | 2.75 |
| Nominal voltage (V) | 3.65 | Over-charge protection voltage (V) | 4.2 |
| Length (mm) | 142 | Max discharge current (A) | 20 |
| Width (mm) | 65 | Operating temperature (°C) | 0–45 |
| Thickness (mm) | 17 | Storage temperature (°C) | −20–60 |
| Weight (g) | 320 | Circle life at room temperature (°C) | 1000 |
| Internal resistance (mΩ) | 4 |
| Specification | Value |
|---|---|
| Liquid cold plate | - |
| Plate length (mm) | 142 |
| Plate width (mm) | 65 |
| Plate thickness (mm) | 2 |
| D-valve dimensions [25] | - |
| Channel width, (mm) | 2 |
| Channel thickness, (mm) | 0.2–1.8 |
| Valve distance, (mm) | 11.7–15.56 |
| Number of stages, | 5 |
| Density of aluminum channel (kgm−3) | 2700 |
| Heat capacity of aluminum channel (Jkg−1K−1) | 900 |
| Thermal conductivity of aluminum channel (Wm−1K−1) | 238 |
| Experimental Instruments | Range | Accuracy |
|---|---|---|
| Temperature measuring device (TAD-6407) | −200∼600 °C | ±0.2% FS |
| Battery management system (EVTS-LNR-60V-100A-4ch) | 2∼60 V 0∼100 A | ±0.1% FS |
| Temperature control box (KCS-8900B) | −43~120 °C 1 m 1 m 1 m | ±0.5 °C |
| Temperature sensor (k-type) | −50∼260 °C | ±0.15 °C |
| Parameter | Value |
|---|---|
| 2220.8 | |
| (Wm−1K−1) | 0.63 [29] (Plane direction; Thickness direction: Negligible) |
| 1399.1 |
| Design | ||||
|---|---|---|---|---|
| (°C) | 37.0 | 36.1 | 35.8 | 35.5 |
| (°C) | 1.07 | 0.92 | 0.89 | 0.88 |
| Level | Design Variables | ||
|---|---|---|---|
| 1 | 11.7 | 0.2 | 75 |
| 2 | 13.046 | 0.73 | 150 |
| 3 | 14.3 | 1.27 | 225 |
| 4 | 15.56 | 1.8 | 300 |
| Parameters | Values |
|---|---|
| Population size | 10 |
| Number of generations | 20 |
| Crossover type | 1 |
| Crossover rate | 1.0 |
| Mutation rate | 0.01 |
| Gene size | 20 |
| Max failed runs | 5 |
| Failed run penalty value | 1.0 × 1030 |
| Failed run objective value | 1.0 × 1030 |
| Experimental Instruments | Range | Accuracy |
|---|---|---|
| Peristaltic pump (DIP1500-S183) | 0∼1500 mLmin−1 | ±5% |
| Flow meter (AI-DFT-V01) | −20∼110 °C; 5∼200 mL·min−1 | ±2.5% |
| Draft indicator (SIN-P300-B) | −0.1∼60 MPa | ±0.1% FS |
| Load box (DCL8006A) | 0∼500 V; 0∼30 A | 0.1% + 5 mV, 0.1% + 10 mA |
| Temperature-measuring device (TAD-6407) | −200∼600 °C | ±0.2% FS |
| Temperature sensor (k-type) | −50∼260 °C | ±0.15 °C |
| Water tank (ART27) | 14.4 L; 5∼100 °C | ±0.5 °C |
| Condenser (PT3600) | 25∼70 °C | ±1 °C |
| Optimal design vs. initial design (%) | 7.7 | 40.6 | 23.5 |
Disclaimer/Publisher’s Note: The statements, opinions and data contained in all publications are solely those of the individual author(s) and contributor(s) and not of MDPI and/or the editor(s). MDPI and/or the editor(s) disclaim responsibility for any injury to people or property resulting from any ideas, methods, instructions or products referred to in the content. |
© 2023 by the authors. Licensee MDPI, Basel, Switzerland. This article is an open access article distributed under the terms and conditions of the Creative Commons Attribution (CC BY) license (https://creativecommons.org/licenses/by/4.0/).
Share and Cite
Fan, Y.; Wang, Z.; Xiong, X.; Panchal, S.; Fraser, R.; Fowler, M. Multi-Objective Optimization Design and Experimental Investigation for a Prismatic Lithium-Ion Battery Integrated with a Multi-Stage Tesla Valve-Based Cold Plate. Processes 2023, 11, 1618. https://doi.org/10.3390/pr11061618
Fan Y, Wang Z, Xiong X, Panchal S, Fraser R, Fowler M. Multi-Objective Optimization Design and Experimental Investigation for a Prismatic Lithium-Ion Battery Integrated with a Multi-Stage Tesla Valve-Based Cold Plate. Processes. 2023; 11(6):1618. https://doi.org/10.3390/pr11061618
Chicago/Turabian StyleFan, Yiwei, Zhaohui Wang, Xiao Xiong, Satyam Panchal, Roydon Fraser, and Michael Fowler. 2023. "Multi-Objective Optimization Design and Experimental Investigation for a Prismatic Lithium-Ion Battery Integrated with a Multi-Stage Tesla Valve-Based Cold Plate" Processes 11, no. 6: 1618. https://doi.org/10.3390/pr11061618