
Low-Carbon and Energy-Saving Path Optimization Scheduling of Material Distribution in Machining Shop Based on Business Compass Model

1
School of Computer and Information, Qiannan Normal University for Nationalities, Duyun 558000, China
2
Key Laboratory of Complex Systems and Intelligent Optimization of Guizhou Province, Duyun 558000, China
3
Key Laboratory of Complex Systems and Intelligent Optimization of Qiannan, Duyun 558000, China
4
College of Mechanical and Electrical Engineering, Xinjiang Agricultural University, Wulumuqi 830052, China
5
College of Management, China West Normal University, Nanchong 637002, China
*
Author to whom correspondence should be addressed.
Processes 2023, 11(7), 1960; https://doi.org/10.3390/pr11071960
Submission received: 23 May 2023
/
Revised: 12 June 2023
/
Accepted: 25 June 2023
/
Published: 28 June 2023
(This article belongs to the Special Issue Smart Manufacturing & Automation Control Systems for Industry 4.0/5.0)
Abstract
:In order to reduce carbon emission and energy consumption in the process of raw material distribution, the workshop material distribution management model was established based on the business compass model; it can help guide enterprises to manage workshop production. Based on the raw material distribution equipment, a path calculation model considering the carbon emission and energy consumption in the process of raw material distribution was established. The dung beetle optimizer was selected for the optimization calculation. The dung beetle optimizer has the characteristics of fast convergence and high solution accuracy. The material distribution of an engine assembly workshop was taken as an example; the results showed that the optimized scheduling model could effectively optimize the material distribution route and reduce energy consumption and carbon emission in the distribution process on the basis of meeting the distribution demand.
1. Introduction
The development of industrial enterprises has promoted the social economy but, at the same time, brought troubling environmental problems. Environmental and energy problems have become the focus of social development [1,2,3]. For manufacturing enterprises, each link has a large amount of carbon emissions, among which transportation is a link of concentrated energy consumption, and the transportation process generates a large amount of carbon dioxide [4]. An optimized transportation route plan can greatly reduce the transportation distance of production materials and reduce carbon emissions and energy consumption [5], which is of great significance for the optimization of the workshop material distribution path.
Workshop material distribution route optimization problem refers to that under certain constraints, according to the material requirements of the station, the distribution path of the car is planned so that it can carry out material distribution according to the planned path and achieve certain optimization objectives [6,7]. At present, due to the limited space in the line inventory area of some enterprises, the production of different products leads to the doubling of the types and quantities of parts, and the distribution staff distributes materials based on their experience, which leads to the unreasonable arrangement of the number of distribution cars and routes, which affects the delivery punctuality and increases the distribution cost and carbon emissions in the distribution process [8,9].
Many scholars have studied it. Yan et al. [10] took a pickup truck production assembly workshop as an example and established a material distribution optimization model with a fuzzy soft time window based on the average satisfaction of stations with the material arrival time, which improved the timeliness and accuracy of the material distribution in the workshop. Tong et al. [11] proposed a bidirectional material distribution strategy that could reflect the urgency of material demand at stations and proposed a hybrid genetic taboo search algorithm. The simulation is verified by an example of a machine parts processing workshop. Goel et al. [12] proposed a new algorithm combining firefly optimization and ant colony system algorithm for vehicle routing problems. The algorithm has been tested against two well-known routing problems, namely, the capacitated vehicle routing problem and the vehicle routing problem with a time window. Zhu et al. [13] established a distribution route optimization model with time window constraints and adopted a genetic algorithm based on tabu search to solve it. Taking a refrigerator assembly line as an example, the feasibility and effectiveness of the proposed method were verified. Erdodu et al. [14] studied the green vehicle routing problem, aiming to minimize the total distance and the total fuel consumption of all vehicle routes. The adaptive large neighborhood search was hybridized with two new local search heuristic methods, which were verified by comparison with other similar literature. Jie et al. [15] established a vehicle routing problem model considering the addition of a soft time window and random factors and proposed a hybrid algorithm combining a scanning algorithm and an improved particle swarm optimization algorithm to solve the problem. Tarhini et al. [16] proposed and tested a super heuristic algorithm based on evolutionary cuckoo search considering customer priority and required vehicle routing. Ren et al. [17] studied the green vehicle routing problem of a mixed energy fleet with a time window, aiming to reduce the total emissions of air pollutants and the total delay time of all vehicles, and developed different emission functions for each air pollutant.
The above studies provide a large number of solving ideas for workshop material distribution problems from distribution methods, distribution models, and algorithm models, and most of them use mathematical models combined with intelligent algorithms to optimize distribution. Although the above research has made some progress, there are still some problems, such as poor solution quality, easy falls into local optimal, and no consideration of environmental factors. Therefore, this paper combined the management of business compass philosophy and analysis of workshop path planning of various elements. The workshop material distribution management model based on the business compass was established to provide guidance for workshop production management. Considering the environmental issues of material distribution, carbon emissions, and energy consumption in the transportation process were taken as objectives, a multi-objective workshop material distribution route optimization model was established. The dung beetle algorithm was used to solve the problem, which has higher accuracy and stronger searchability. An engine assembly workshop was selected as an example for verification, three algorithms DBO, non-dominated sorting genetic algorithm-II (NSGA-II), and genetic algorithm (GA), were used to solve the problem, and the optimal path was obtained by comparison. The results showed that the model could reduce carbon emissions and energy consumption in the process of material transportation more effectively.
2. Workshop Material Distribution Based on Business Compass
2.1. Business Compass
Business compass is an enterprise sustainable development top-level design model that integrates Chinese and Western management thinking [18]. Management compass integrates Chinese philosophy and Western management science organically. Based on the people-oriented development concept and the five elements of ”wood, fire, earth, gold and water” in ancient Chinese philosophy [19], it puts forward five core elements of ”trend, path, skill, tool and profit” for the sustainable development of enterprises, as shown in Figure 1, and progressive construction of policy, industry, market, mission, vision, values, strategy, tactics, organization, technology, products, services, internal profit, external profit, society, and other 15 plates.
Business compass consists of five elements of “trend, path, skill, tool and profit”. The “trend” of the business compass refers to the situation faced by the enterprise, which mainly includes the relevant laws and regulations, economic development trends, and market demand changes. “Trend” has an important impact on the development of enterprises. Only by conforming to the changes in the situation can enterprises seize new development opportunities. The “path” of the business compass refers to the development direction of the enterprise. According to the changes in the situation, the enterprise timely adjusts the development direction and carries out internal reform. The “skill” of the business compass is a series of tactics and strategies put forward by enterprises according to the direction of development. The “tool” of the business compass means the new products and technologies developed by enterprises. Innovation is the primary productive force, and only by mastering core technologies can we achieve further development. The “profit” of the business compass refers to the profit distribution and responsibility distribution of the enterprise. A good profit distribution system can stimulate the enthusiasm of employees and better serve the enterprise [20,21,22].
Because the continuous distribution and circulation of “profit” will form a game between those with vested interests and those with new needs of interests and then produce a new external environment, that is, the formation of new potential. Just like the relationship between “wood, fire, earth, metal and water” among the five elements of Chinese philosophy, the five elements of “trend, path, skill, tool and profit” of business compass also form a circular ecological relationship with each other, influencing and promoting each other.
2.2. Workshop Material Distribution Management Based on Business Compass
It is of great significance for enterprises to reasonably plan the quantity and path of material transportation, ensure the timely supply of materials, and reduce transportation costs and carbon emissions. As the guiding concept of enterprise management, a business compass can provide guidance for the material distribution route planning of enterprises. Combined with the concept of the business compass, this paper proposes an optimization management model of workshop material distribution, as shown in Figure 2. The optimal management model of workshop material distribution takes enterprise management as the core and pays attention to the production management of enterprise production. The model consists of five elements, “business compass, operation management, workshop production, material distribution model, and distribution path plan”. As a top-level design model of enterprise sustainable development, the business compass can provide a guiding ideology for enterprise management. The operation department is responsible for the operation management and production arrangement of the enterprise. Workshop production includes production plans, production equipment, and distribution equipment. The workshop arranges workshop work according to production plan requirements, reasonably plans various resources, and arranges related work of workshop equipment management. For material distribution, it is necessary to design the material distribution model according to the production situation of the workshop, determine the optimization objective, and use the optimization method to optimize the calculation of the material distribution model. Finally, the optimal route plan for material distribution in the workshop is obtained, which includes distribution vehicle, distribution time, distribution path.
3. Material Distribution Calculation Model
In this chapter, the energy consumption and loading performance of vehicles in distribution are considered comprehensively, and the comprehensive emission model is used to calculate related factors such as energy consumption and carbon emission of vehicles.
3.1. Calculation Model of Energy Consumption
In this paper, the comprehensive emission model is used to calculate vehicle energy consumption from the micro point of view. On a path (i, j) with a length of d and a vehicle speed of V, the energy consumption of the vehicle driving on the road is calculated [23,24].
where represents the mass ratio of fuel and air, k represents the friction coefficient of the engine, represents the rotational speed of the vehicle engine, represents the vehicle displacement, is a constant, represents the total power required per vehicle mileage (), which is calculated as shown in the formula without considering the loss of power.
where is the total traction power of the vehicle per unit driving time. represents the efficiency of the vehicle’s drivetrain. The simplification is shown below,
where v is the actual driving speed of the vehicle (m/s), and Q is the total weight of the current vehicle (kg, dead weight, loaded weight). Under the condition of considering the path angle of 0, , among them, a is the acceleration (m/s2), , is the road angle, A is the vehicle in front of the surface area (m2), g is the gravitational constant (), is the air drag coefficient, is rolling resistance coefficient, and is air density (kg/m3). The energy consumption (unit, J) of the vehicle in the path (i,j) is obtained, and the specific calculation is shown as follows
where are constants, represents the conversion factor of energy from g/s to 1/s. is the path length, is the average speed, and the load of the vehicle is , where is the dead weight of the vehicle and is the load of the vehicle on the path (i, j).
It can be seen from Formula (4) that vehicle energy consumption consists of three parts, the first part is cylinder energy consumption, the second part is mass energy consumption, which is influenced by the driving speed and load, and the third part is air resistance energy consumption. The first and third parts are affected by running time and speed, while the second part is affected by load and running time. The relevant data on diesel engines quoted in this paper are shown in Table 1 [25].
3.2. Carbon Emissions Calculation Model
Vehicle carbon emissions are generally directly related to vehicle energy consumption. In addition to CO2, methyl burning (CH4) and nitrogen oxide (N2O) also have a great impact on climate. In order to accurately calculate the number of greenhouse gases emitted by vehicles, all greenhouse gases generated in the process of vehicle speech should be converted into CO2 equivalent according to a certain conversion factor for calculation [26,27].
In this paper, emissions are calculated by fuel consumption. Direct conversion of fuel to CO2 equivalent only requires multiplying the amount of fuel consumed by the vehicle with the corresponding conversion factor.
where is the corresponding emission factor of fuel, is the amount of fuel used. All the vehicles used in this paper are diesel-powered cars, and the carbon emission is CO2 equivalent calculated comprehensively, including concentrated greenhouse gases. The conversion coefficient of diesel based on IPCC2006 is 2.73 KgCO2/L.
3.3. Model Assumptions and Constraints
When establishing the multi-objective balance model, it is necessary to list some assumptions that make the model valid: (1) there is only one material distribution center; (2) the location of the material distribution center and each working place is known; (3) the demand for materials in each working place is known; (4) the vehicle is of one type, and the loading capacity is known; the vehicle shall not exceed its loading capacity when distributed to the working place; (5) the needs of each workplace must be met.
According to the above assumptions, the decision variables for multi-objective optimization of the material distribution route are set as follows: , which means that vehicle (deliverer) m arrives from the required work place i to the required work place j; , indicating that the vehicle (distribution personnel) m did not arrive from the demand work place i to the demand work place j. The constraints of multi-objective optimization of the material distribution path are as follows:
- (1)
- There is only one vehicle for distribution in each required working place.
- (2)
- The material demand on each path should not exceed the carrying weight of the vehicle.
- (3)
- Distribution vehicles (distribution personnel) leave from the distribution center.
- (4)
- The distribution vehicles (distribution personnel) return to the distribution center after finishing the distribution.
4. Dung Beetle Optimizer
Dung beetles feed on the dung of animals. The dung beetle likes to roll feces into balls, roll them to reliable places to hide, and then slowly eat them. Dung beetles can roll a ball of dung much larger than themselves and use celestial bodies (the sun, moon, etc.) to navigate, making the ball roll in a straight line. When left in total darkness, however, the beetle’s path is no longer straight but curved and sometimes rounded. Many other factors, such as uneven ground and wind, can cause the beetles to deviate from their original direction. In addition, dung beetles are likely to encounter obstacles as they roll, preventing them from moving forward. To do this, dung beetles usually climb on top of the dung ball and dance (involving a series of spins and pauses), which determines their direction of travel [28,29].
Dung beetles can be observed in the way of life for dung has the following two main purposes: (1) some dung is used to lay their eggs and raise the next generation; (2) the rest is used for food. Specifically, dung beetles bury balls of dung in which females lay their eggs. It is important to note that the dung ball is not only a place for the larvae to grow but also provides the food necessary for the larvae to survive. Therefore, dung balls play an irreplaceable role in the survival of dung beetles. In addition, some dung beetles steal dung balls from other dung beetles, called thieves, which is also a common phenomenon in nature. Researchers mainly proposed a dung beetle optimizer (DBO) for global search and local utilization based on the above living habits of dung beetles and inspired by their rolling, dancing, foraging, stealing, and reproduction behaviors [30].
4.1. Dung Beetles Roll a Ball
- (1)
- When there is no obstacle in front of dung beetles, dung beetles will navigate according to the light source during dung ball rolling. Assuming that the intensity of the light source will affect the position of dung beetles, the position of dung beetles during dung ball rolling will be updated as follows:
- (2)
- When a dung beetle has an obstacle in front of it, it needs to dance to realign itself to get a new route. The tangent function is used to simulate the dancing behavior so as to obtain a new rolling direction, which is only considered between [0, π]. Once the beetle has successfully determined its new direction, it should continue to roll the ball backward. The beetle’s position is updated as follows:
4.2. Dung Beetle Reproduction
Female dung beetles provide a safe environment for their offspring by rolling the ball to a safe place to lay eggs and hiding it. Inspired by this, we proposed a boundary selection strategy that mimics the area where females lay their eggs:
where represents the current optimal position, and represent the lower limit and upper limit of the spawning area, respectively, represents the maximum number of iterations, , , and represent the lower limit and upper limit of the optimization problem, respectively.
Once female dung beetles have identified a spawning area, they choose that area to raise their young and lay eggs. Each female dung beetle produced only one egg in each iteration. It can be seen that the boundary range of the spawning area was dynamic and mainly determined by the R-value. Therefore, the position of the brood ball is also dynamic during iteration, which is defined as follows:
where represents the position information of the ith brood ball in the t iteration, b1 and b2 are 1 × D random vectors, and D represents the dimension of the optimization problem.
4.3. Dung Beetle Foraging
The eggs laid by females will gradually grow, and some mature young dung beetles will come out of the ground in search of food. The optimal feeding area of young dung beetles is modeled as follows:
where represents the global optimal location, and represent the lower limit and upper limit of the optimal foraging area, respectively.
The position of the young beetle is updated as follows:
where represents the position of the ith young dung beetle in the t iteration, is a random number obeying normal distribution, and is a random vector (0, 1).
4.4. Dung Beetle Stealing
Some dung beetles steal dung balls from other dung beetles. The location of the thief dung beetle is updated as follows:
where represents the position of the ith thief dung beetle in the t iteration, g is a 1 × D random vector obeying normal distribution, and S is a constant.
The population was divided into different roles according to the ratio of 6:6:7:11. The proportion of rolling dung beetles is 6, that of breeding dung beetles is 6, that of young dung beetles is 7, and that of thieves is 11.
As a novel swarm intelligent optimization algorithm, DBO mainly has six steps:
- (1)
- Initialize the parameters of the dung beetle population and DBO;
- (2)
- Calculate the fitness values of all target agents according to the objective function;
- (3)
- Update the position of all dung beetles;
- (4)
- Determine whether each target agent exceeds the boundary;
- (5)
- Update the current optimal solution and its fitness value;
- (6)
- Repeat the above steps until t meets the termination criteria, and output the optimal global solution and its fitness value.
DBO is based on subpopulations, each of which performs a different search. Unlike snake optimization (SO) and Ephemera algorithm (MA), the DBO algorithm is not based on two populations but on multiple subpopulations, four of which are divided by the authors. Different regional search strategies (including spawning areas and optimal foraging areas) can promote the utilization behavior of the DBO algorithm. The algorithm pursues a stronger search ability to avoid falling into local optimal. The DBO flow chart is shown in Figure 3.
The process of DBO includes initializing the dung beetle population, calculating the fitness value, and updating the position of all dung beetles. The update of dung beetle location is the focus of the algorithm, and DB is divided into four subgroups based on the dung beetle’s ball-rolling, foraging, stealing, and reproduction behaviors, each of which performs a different search method based on their behavior. Because of its unique population division and search method, the DBO algorithm takes into account both global exploration and local development and has the characteristics of fast convergence and high solution accuracy.
5. Case Study
5.1. Material Distribution in Workshop
An enterprise is an engine assembly manufacturing enterprise. The materials needed for the production of the workshop are stored in a warehouse center, with a total of eight stations responsible for production. Table 2 shows the distance from the material storage warehouse to each station and the distance between each station. Table 3 shows the material demand list of each station, including the service time of vehicles at each station in the process of material distribution, the time waiting for loading and unloading of materials, and the time window limit of each station. It is stipulated that the maximum load of the vehicle responsible for material distribution is 70, and the maximum speed is not more than 50. Matlab programming is used to solve the above model.
5.2. Optimization Results and Analysis
This paper takes the workshop of discrete manufacturing enterprises as the research object, takes the minimum carbon emission and energy consumption of material distribution as the optimization goal, and establishes the optimization model of the workshop logistics distribution route. DBO is used to solve the model. The algorithm parameters are set as follows: the initial population size N is 30, the number of iterations is 300, and the control parameters K = 0.1, b = 0.3, and S = 0.5. In order to verify the effectiveness of DBO, three algorithms, namely DBO, non-dominated sorting genetic algorithm-II (NSGA-II), and genetic algorithm (GA), were used to solve the distribution route, respectively, and the solution results of three different algorithms were compared and analyzed. Among them, the population number of GA and NSGA-II is 60, the crossover rate is 0.9, the variation rate is 0.1, and the iteration times of the algorithm are 300 [31,32,33]. Figure 4, Figure 5, Figure 6, Figure 7, Figure 8 and Figure 9 show the algorithm iteration process.
Figure 4, Figure 5 and Figure 6 show the iterative process of energy consumption of the three algorithms. As can be seen from the figure, as the number of iterations increases, the algorithm begins to optimize the path, and the energy consumption in the distribution process gradually decreases until it becomes stable. In the simulation results, energy consumption after DBO optimization is 115.32 J; energy consumption after NSGA-II optimization is 117.78 J; energy consumption after GA optimization is 119.86 J. In the iterative process, the energy consumption of the objective function value obtained by the DBO solution is the lowest, the second is NSGA-II, and the last is GA. The number of iterations used by the DBO algorithm to achieve stable optimal energy consumption is about 125 times, which is significantly improved compared with NSGA and GA, and DBO has a faster iteration speed.
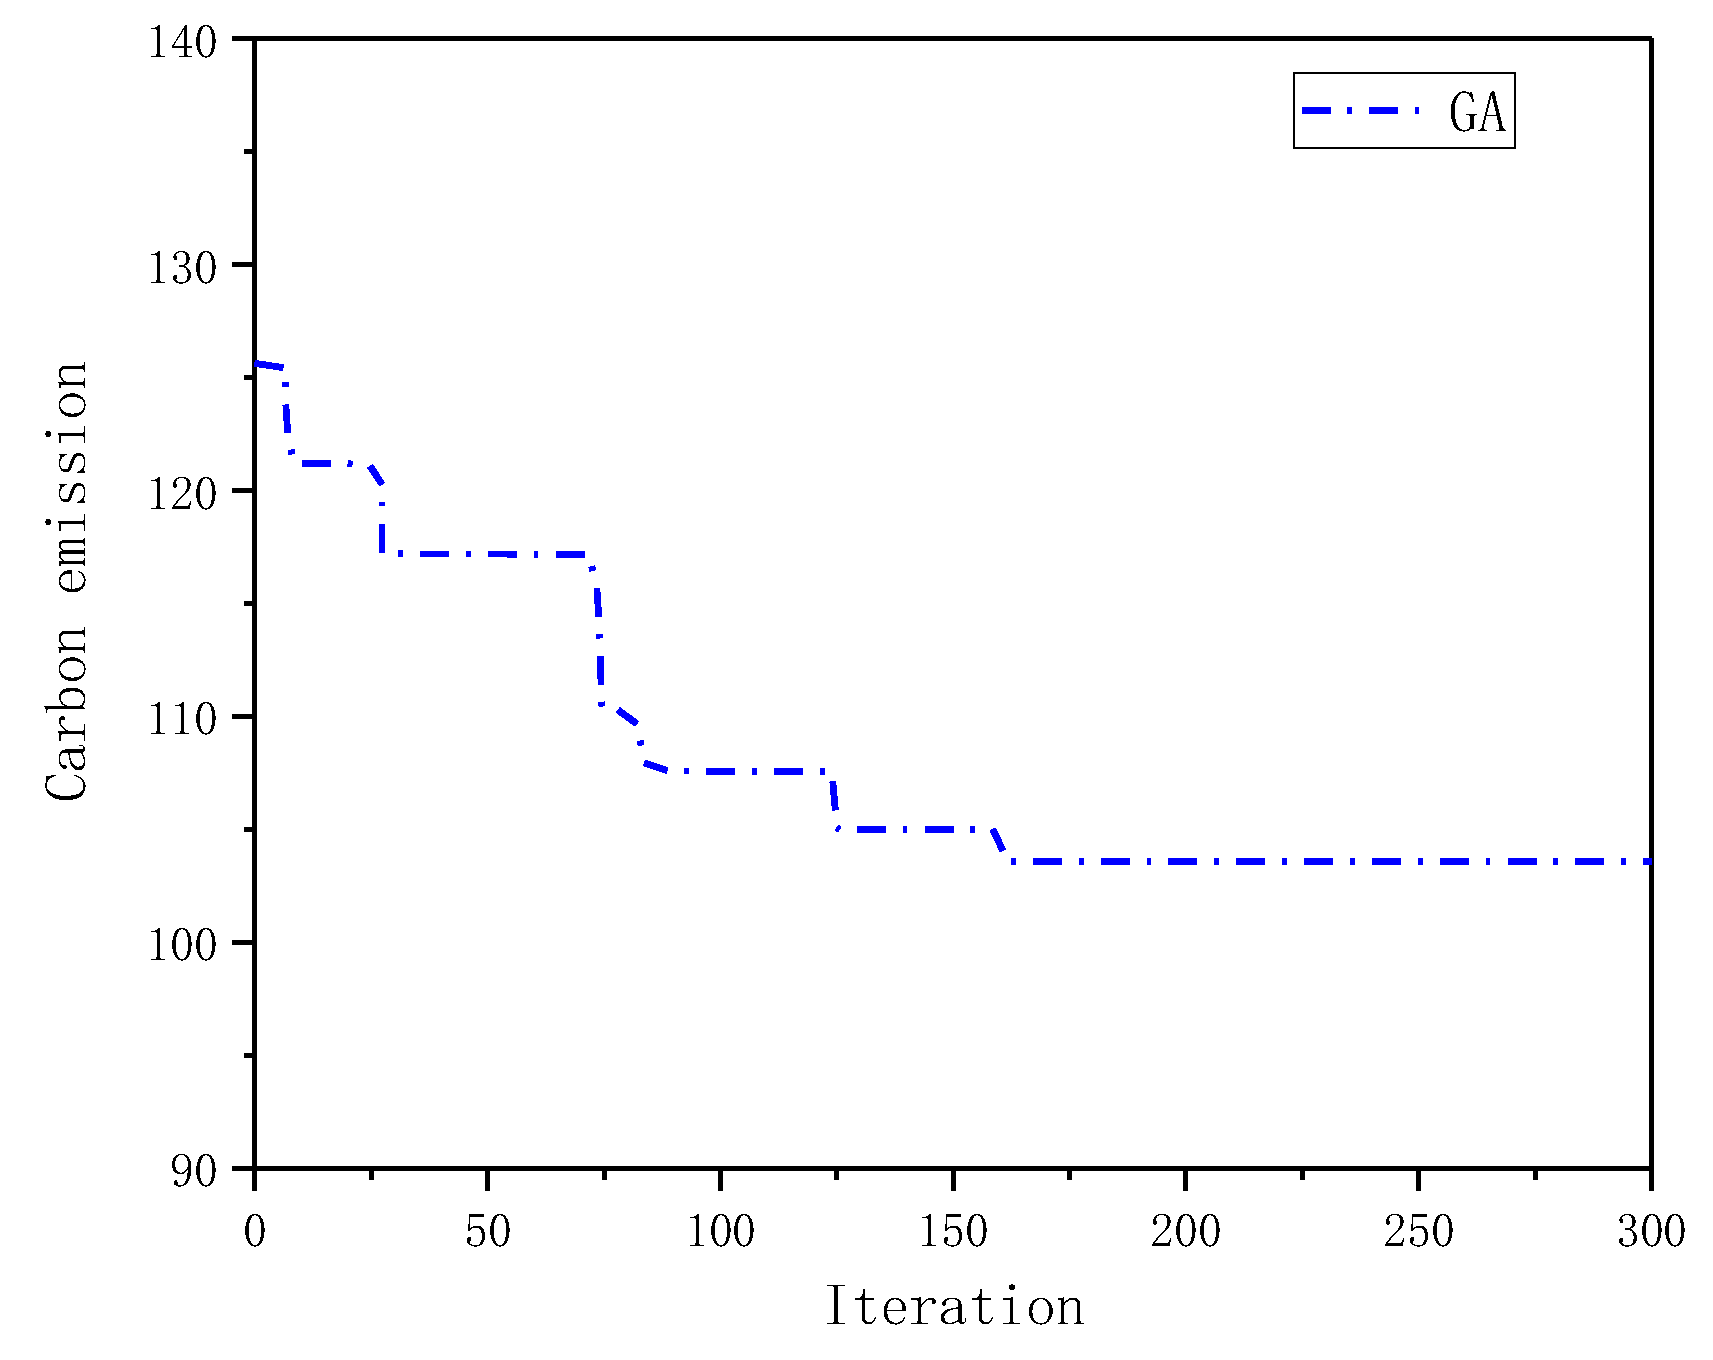
Figure 7, Figure 8 and Figure 9 show the iterative process of carbon emission of the three algorithms. As can be seen from the figure, as the number of iterations increases, the algorithm begins to optimize the path, and the carbon emission iteration in the distribution process gradually decreases until it becomes stable. In the simulation results, the carbon emission after DBO optimization is 98.62 kg; the carbon emission after NSGA-II optimization is 101.36 kg; and the carbon emission after GA optimization is 103.58 kg. In the iterative process, the objective function value obtained by the solution of DBO has the lowest carbon emission result, the second is NSGA-II, and the last is GA. The number of iterations used by the DBO algorithm to achieve stable optimal carbon emission is about 120 times, which is significantly improved compared with NSGA and GA, and DBO has a faster iteration speed. The above results show the effectiveness of the DBO algorithm proposed in this paper. The algorithm can expand the search range of solutions, improve the search speed of solutions, and improve search accuracy.
The optimized distribution path is shown in Table 4; the optimal distribution route calculated by DBO includes three distribution vehicles. The material distribution route of vehicle 1 is 0-3-52-5, the load factor is 86%, and the distance to complete one distribution is 5.8 km. The material distribution route of vehicle 2 is 0-6-4-0, the load rate is 53%, and the distance to complete distribution is 3.9 km. The material distribution route of vehicle 3 is 0-8-7-1-0, the load rate is 78%, and the distance to complete one distribution is 7.3 km. After the optimization of DBO, the material distribution distance is 17, the energy consumption in the distribution process is 115.32, and the carbon emission is 98.62. From the above simulation results and analysis, it can be seen that the optimized path of the DBO algorithm covers a shorter distance, and the distribution generates less energy consumption and carbon emissions, which is conducive to improving the production efficiency of enterprises.
5.3. Comparison with Previous Literature
The literature [10,11,12,13,14,15,16,17] provides a large number of solution ideas for workshop material distribution problems from the distribution method, distribution model, and algorithm model. Although the above research has made some progress, there are still problems, such as poor solution quality, easy falls into local optimal, and no consideration of environmental factors. Therefore, based on the enterprise management philosophy of management compass, this paper analyzes the elements of enterprise logistics distribution and takes distribution carbon emission and energy consumption as targets to establish a multi-objective optimization model of workshop material distribution route. DBO was used to solve the model with higher accuracy and stronger searching ability.
6. Conclusions
Workshop material distribution route planning is an important part of workshop product production decision-making, which is of great significance to workshop production management. Aiming at the environmental problems caused by the material distribution path in the manufacturing workshop, this paper makes the following research on the workshop material distribution path.
- Based on the model of the business compass, the workshop material distribution management model was established, and the enterprise management process to realize the material distribution was analyzed.
- A material distribution calculation model based on energy consumption and carbon emission was established.
- Using DBO to solve this problem model, the comparison of DBO, NSGA- II, and GA shows the advantages of DBO; the algorithm has good global search ability and high search accuracy and can effectively optimize the material distribution route of manufacturing workshops. The effectiveness of the algorithm was verified by a case of material distribution in an engine assembly workshop.
The simulation results show this method can obtain the low carbon and low energy distribution path of workshop materials, which realizes the material delivery on time with the least energy consumption and carbon emission. In order to further adapt to the increasingly complex machine shop production environment, the author will study the dynamic material demand and the workshop material distribution path planning under different material types.
Author Contributions
Conceptualization, Y.X. and H.Z.; methodology, Y.X. and R.W.; software, Y.X.; validation, R.W.; formal analysis, Y.X. and R.W.; investigation, Y.X. and H.Z.; writing—original draft preparation, Y.X. and H.Z.; writing—review and editing, Y.X. and H.Z.; visualization, Y.X. All authors have read and agreed to the published version of the manuscript.
Funding
This research was funded by the reform project of teaching content and curriculum system of higher education in Guizhou Province in 2022, grant number: GZJG20220331.
Institutional Review Board Statement
Not applicable.
Informed Consent Statement
Informed consent was obtained from all subjects involved in the study.
Data Availability Statement
Not applicable.
Conflicts of Interest
The authors declare no conflict of interest.
References
- Ai, X.F.; Jiang, Z.G.; Zhang, H.; Wang, Y. Low-carbon product conceptual design from the perspectives of technical system and human use. J. Clean. Prod. 2020, 244, 118819. [Google Scholar] [CrossRef]
- Xia, T.; An, X.; Yang, H.; Jiang, Y.; Xu, Y.; Zheng, M.; Pan, E. Efficient Energy Use in Manufacturing Systems—Modeling, Assessment, and Management Strategy. Energies 2023, 16, 1095. [Google Scholar] [CrossRef]
- Liu, H.; Fan, L.; Shao, Z. Threshold effects of energy consumption, technological innovation, and supply chain management on enterprise performance in China’s manufacturing industry. J. Environ. Manag. 2021, 300, 113687. [Google Scholar] [CrossRef] [PubMed]
- Fatemeh, F.; Afshar, N.B. A bi-objective green location-routing model and solving problem using a hybrid metaheuristic algorithm. Int. J. Logist. Syst. Manag. 2018, 30, 366–385. [Google Scholar]
- Xu, L.A.; Wang, N.A.; Ling, X.B. Study on Conflict-free AGVs Path Planning Strategy for Workshop Material Distribution Systems. Procedia CIRP 2021, 104, 1071–1076. [Google Scholar]
- Li, S.; Zhao, H. Optimization of Material Distribution Path of Manufacturing Workshop Based on IPSO Algorithm. Mach. Des. Manuf. 2019, 10, 209–212. [Google Scholar]
- Farooq, B.; Bao, J.; Raza, H.; Sun, Y.; Ma, Q. Flow-shop path planning for multi-automated guided vehicles in intelligent textile spinning cyber-physical production systems dynamic environment. J. Manuf. Syst. 2021, 59, 98–116. [Google Scholar] [CrossRef]
- Wang, C.L.; Wang, Y.; Zeng, Z.Y.; Lin, C.Y.; Yu, Q.L. Research on Logistics Distribution Vehicle Scheduling Based on Heuristic Genetic Algorithm. Complexity 2021, 2021, 8275714. [Google Scholar] [CrossRef]
- Liu, S.; Zhang, Y.; Liu, Y.; Wang, L.; Wang, X.V. An ‘Internet of Things’ enabled dynamic optimization method for smart vehicles and logistics tasks. J. Clean. Prod. 2019, 215, 806–820. [Google Scholar] [CrossRef] [Green Version]
- Yan, Z.; Meu, F.; Ge, M. Path optimization method of workshop logistics based on fuzzy soft time windows. Comput. Integr. Manuf. Syst. 2015, 21, 2760–2767. [Google Scholar]
- Tong, F.; Xu, J. Two-way material distribution path planning for intelligent workshops considering workstation priority. J. Mech. Electr. Eng. 2021, 38, 1465–1471. [Google Scholar]
- Goel, R.; Maini, R. A hybrid of Ant Colony and firefly algorithms (HAFA) for solving vehicle routing problems. J. Comput. Sci. 2018, 25, 28–37. [Google Scholar] [CrossRef]
- Zhu, F.; Cao, T. Optimization Method of Material Delivery Path in Workshop Based on Time Window Constraints. Mach. Des. Manuf. 2023, 1, 136–139. [Google Scholar]
- Erdodu, K.; Karabulut, K. Bi-objective green vehicle routing problem. Int. Trans. Oper. Res. 2022, 29, 1602–1626. [Google Scholar] [CrossRef]
- Jie, K.W.; Liu, S.Y.; Sun, X.J. A hybrid algorithm for time-dependent vehicle routing problem with soft time windows and stochastic factors. Eng. Appl. Artif. Intell. 2022, 109, 104606. [Google Scholar] [CrossRef]
- Tarhini, A.; Danach, K.; Harfouche, A. Swarm intelligence-based hyper-heuristic for the vehicle routing problem with prioritized customers. Ann. Oper. Res. 2022, 308, 549–570. [Google Scholar] [CrossRef]
- Ren, X.; Huang, H.; Feng, S.; Liang, G. An improved variable neighborhood search for bi-objective mixed-energy fleet vehicle routing problem. J. Clean. Prod. 2020, 275, 124155. [Google Scholar] [CrossRef]
- Wang, R.P. Business Compass; Science Press China: Beijing, China, 2020. [Google Scholar]
- Sun, X.P. Taoism Naturalistic Technology Views. Stud. Dialectics Nat. 2022, 38, 42–47. [Google Scholar]
- Xiao, Y.; Wang, R.; Yan, W. Optimum Design of Blank Dimensions Guided by a Business Compass in the Machining Process. Processes 2021, 9, 1286. [Google Scholar] [CrossRef]
- Wang, R.P.; Yi, J. Characteristics and Mission of Management Thinking with Chinese Characteristics Based on the Business Compass Perspective. In Proceedings of the 8th International Symposium on Project Management (ISPM 2020), Beijing, China, 4–5 July 2020. [Google Scholar]
- Xiao, Y.; Zhou, J.; Wang, R.; Zhu, X.; Zhang, H. Energy-Saving and Efficient Equipment Selection for Machining Process Based on Business Compass Model. Processes 2022, 10, 1846. [Google Scholar] [CrossRef]
- Xiao, Y.; Zhao, R.; Yan, W. Analysis and Evaluation of Energy Consumption and Carbon Emission Levels of Products Produced by Different Kinds of Equipment Based on Green Development Concept. Sustainability 2022, 14, 7631. [Google Scholar] [CrossRef]
- Zhang, X.; Wang, L. Optimization of apparel material distribution route based on carbon emission. J. Text. Res. 2020, 41, 5. [Google Scholar]
- Demir, E. An adaptive large neighborhood search heuristic for the Pollution-Routing Problem. Eur. J. Oper. Res. 2012, 223, 346–359. [Google Scholar] [CrossRef]
- Zhan, X.L.; Zhang, C.Y.; Meng, L. Low Carbon modeling and optimization of milling parameters based on improved gravity search algorithm. China Mech. Eng. 2020, 31, 11. [Google Scholar]
- Chen, J.; Liao, W.; Yu, C. Route optimization for cold chain logistics of front warehouses based on traffic congestion and carbon emission. Comput. Ind. Eng. 2021, 161, 107663. [Google Scholar] [CrossRef]
- Dacke, M.; Baird, E.; El, J.B.; Warrant, E.J.; Byrne, M. How dung beetles steer straight. Annu Rev Entomol. 2021, 66, 243–256. [Google Scholar] [CrossRef]
- Yin, Z.; Zinn-Björkman, L. Simulating rolling paths and reorientation behavior of ball-rolling dung beetles. J Theor Biol. 2020, 486, 110106. [Google Scholar] [CrossRef]
- Xue, J.; Shen, B. Dung beetle optimizer: A new meta-heuristic algorithm for global optimization. J. Supercomput. 2022, 79, 7305–7336. [Google Scholar] [CrossRef]
- Su, Y.; Sun, W. Analyzing a Closed-Loop Supply Chain Considering Environmental Pollution Using the NSGA-II. IEEE Trans. Fuzzy Syst. 2018, 27, 1066–1074. [Google Scholar] [CrossRef]
- Xu, T.; Yao, L.; Xu, L.; Chen, Q.; Yang, Z. Image Segmentation of Cucumber Seedlings Based on Genetic Algorithm. Sustainability 2023, 15, 3089. [Google Scholar] [CrossRef]
- Guo, W.; Lei, Q.; Song, Y.; Lyu, X. A learning interactive genetic algorithm based on edge selection encoding for assembly job shop scheduling problem. Comput. Ind. Eng. 2021, 109, 107455. [Google Scholar] [CrossRef]
Figure 1.
Business compass diagram.

Figure 2.
Workshop material distribution management model based on business compass.

Figure 3.
DBO flow chart.
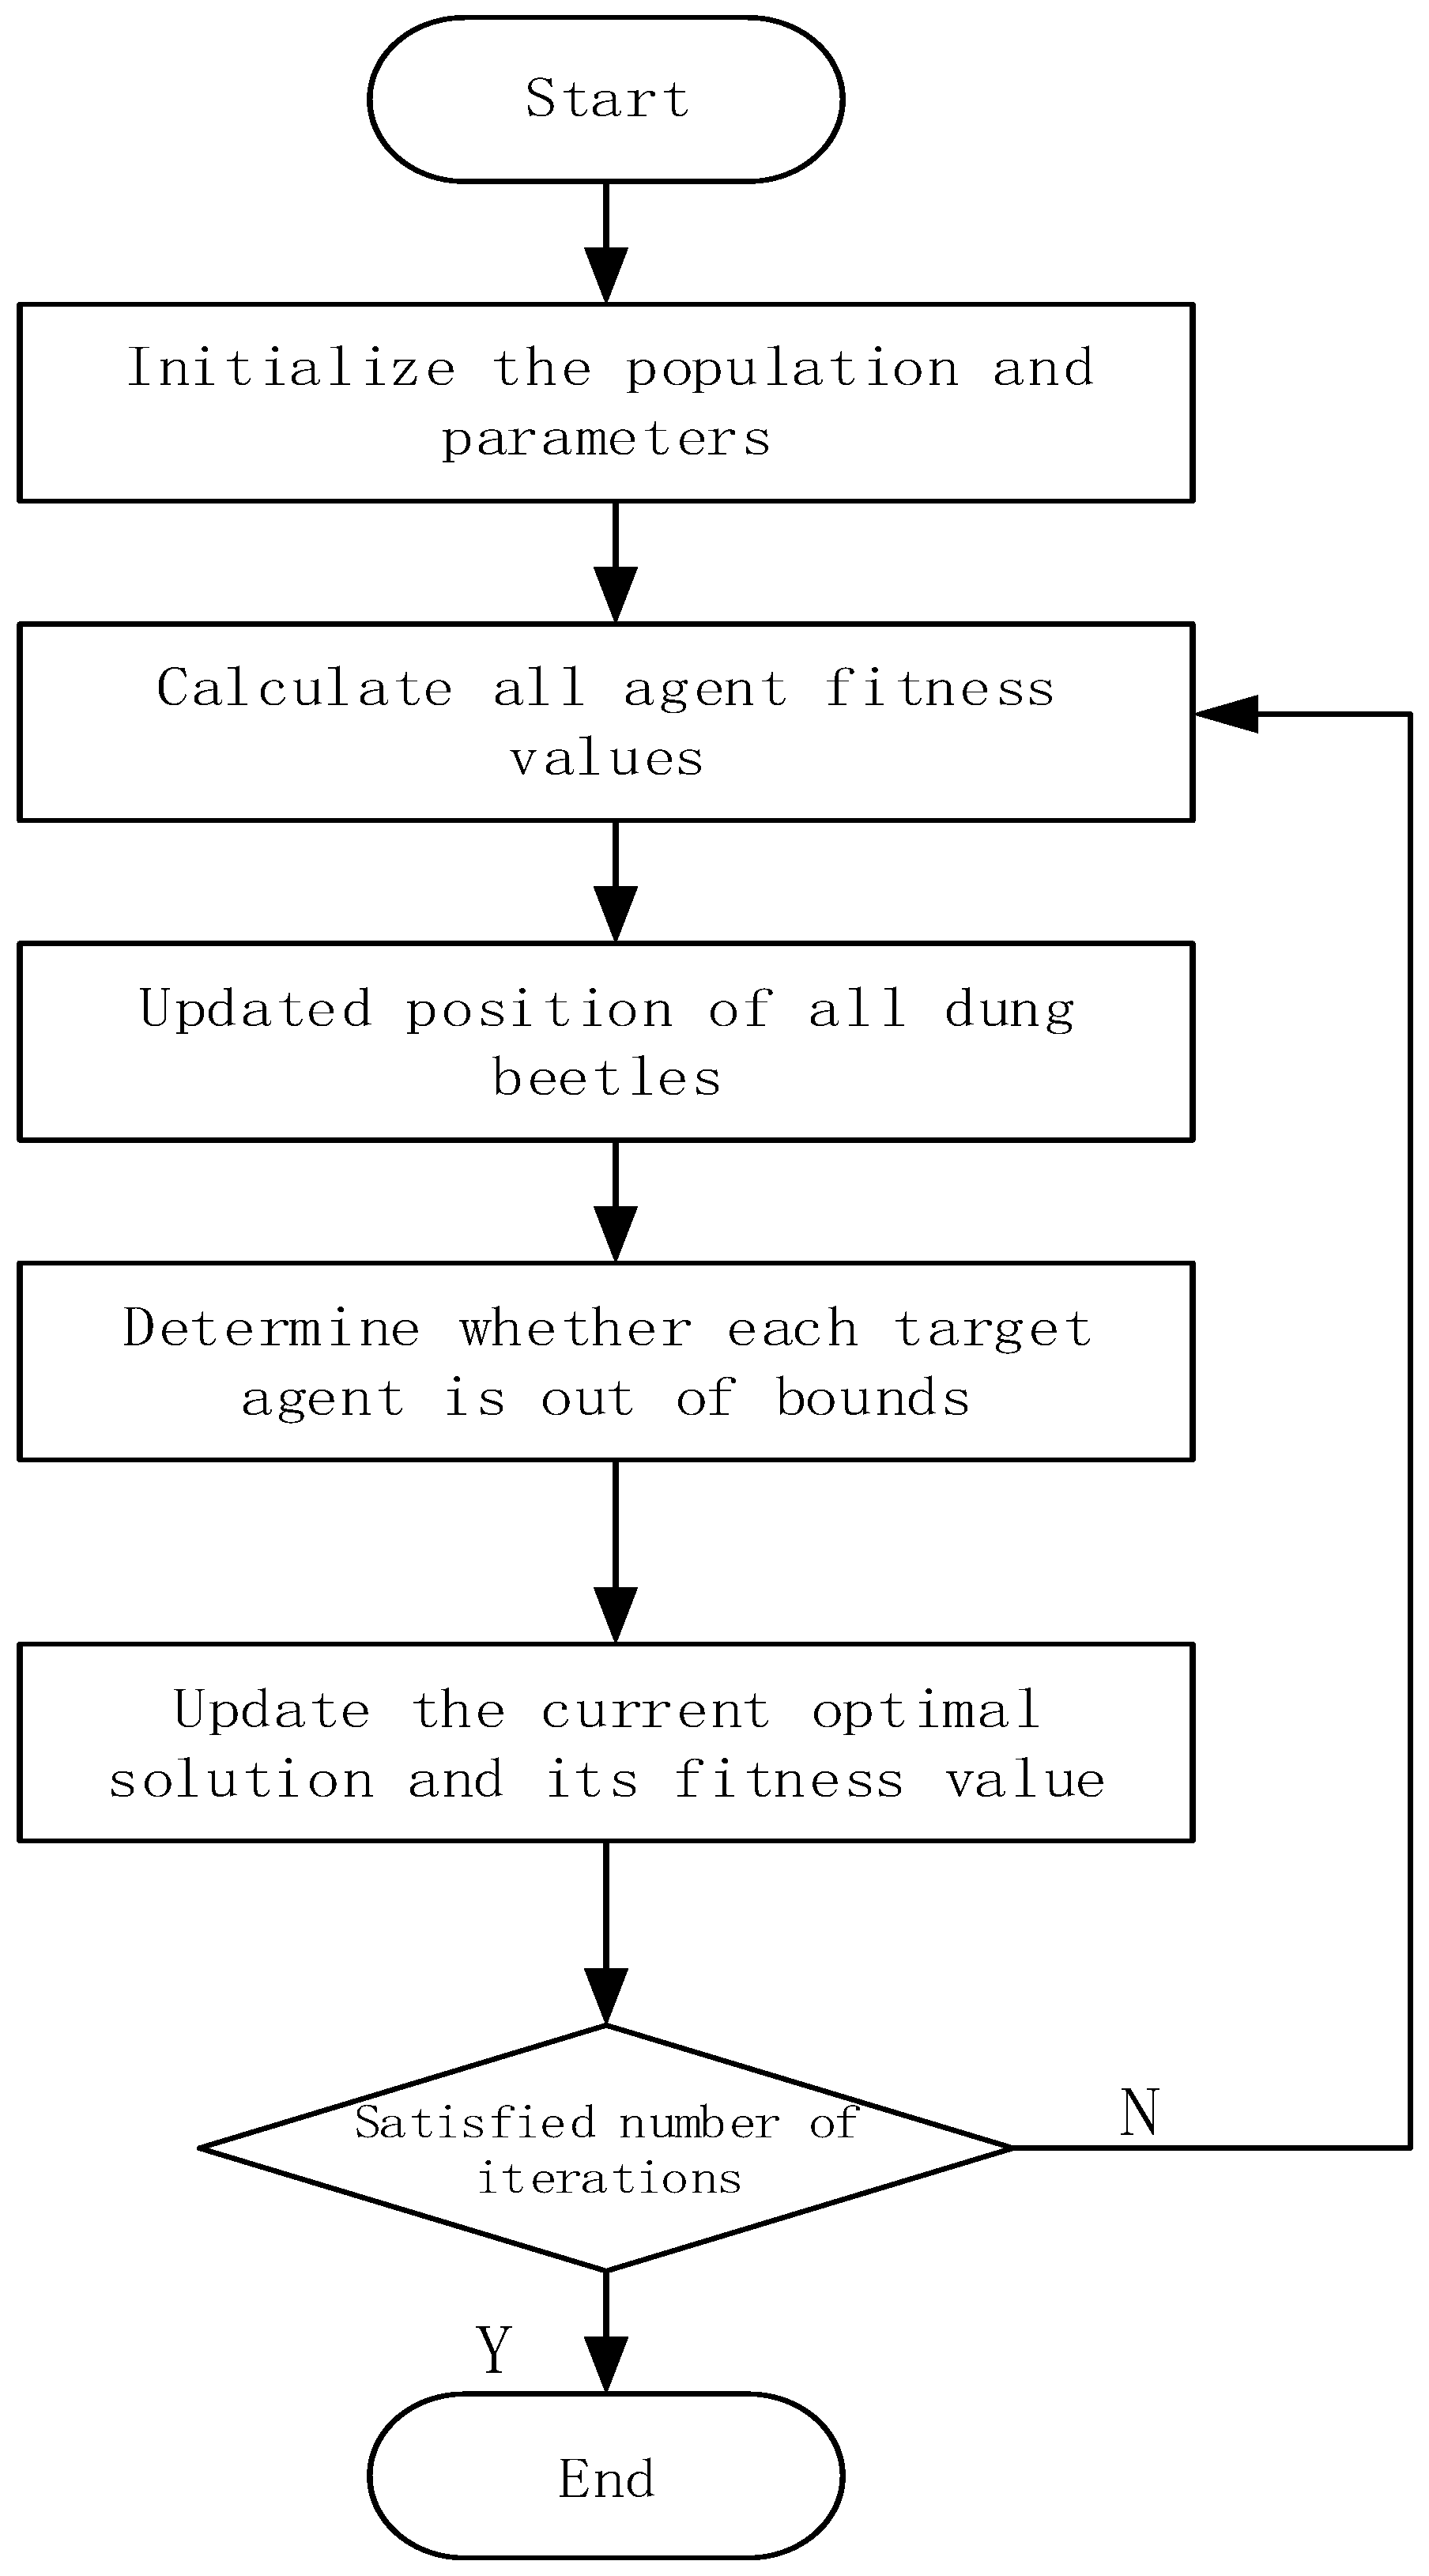
Figure 4.
Energy consumption iteration diagram of DBO.
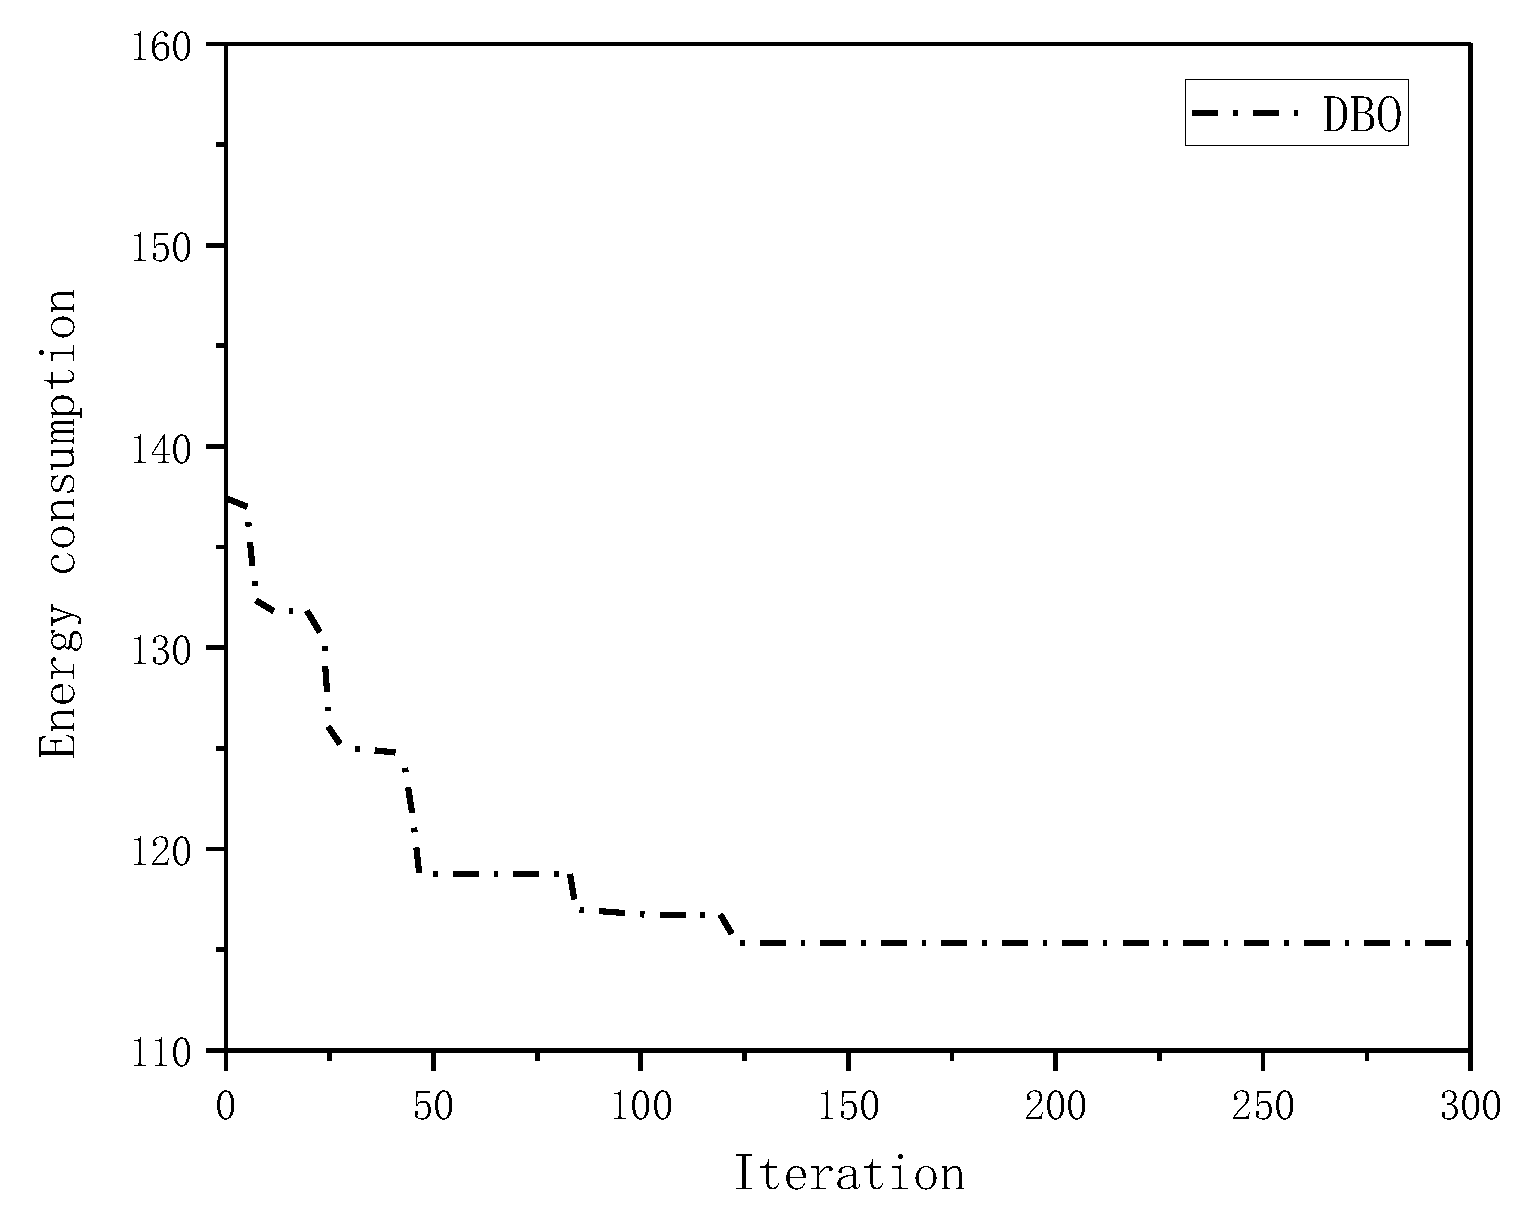
Figure 5.
Energy consumption iteration diagram of NSGA-II.
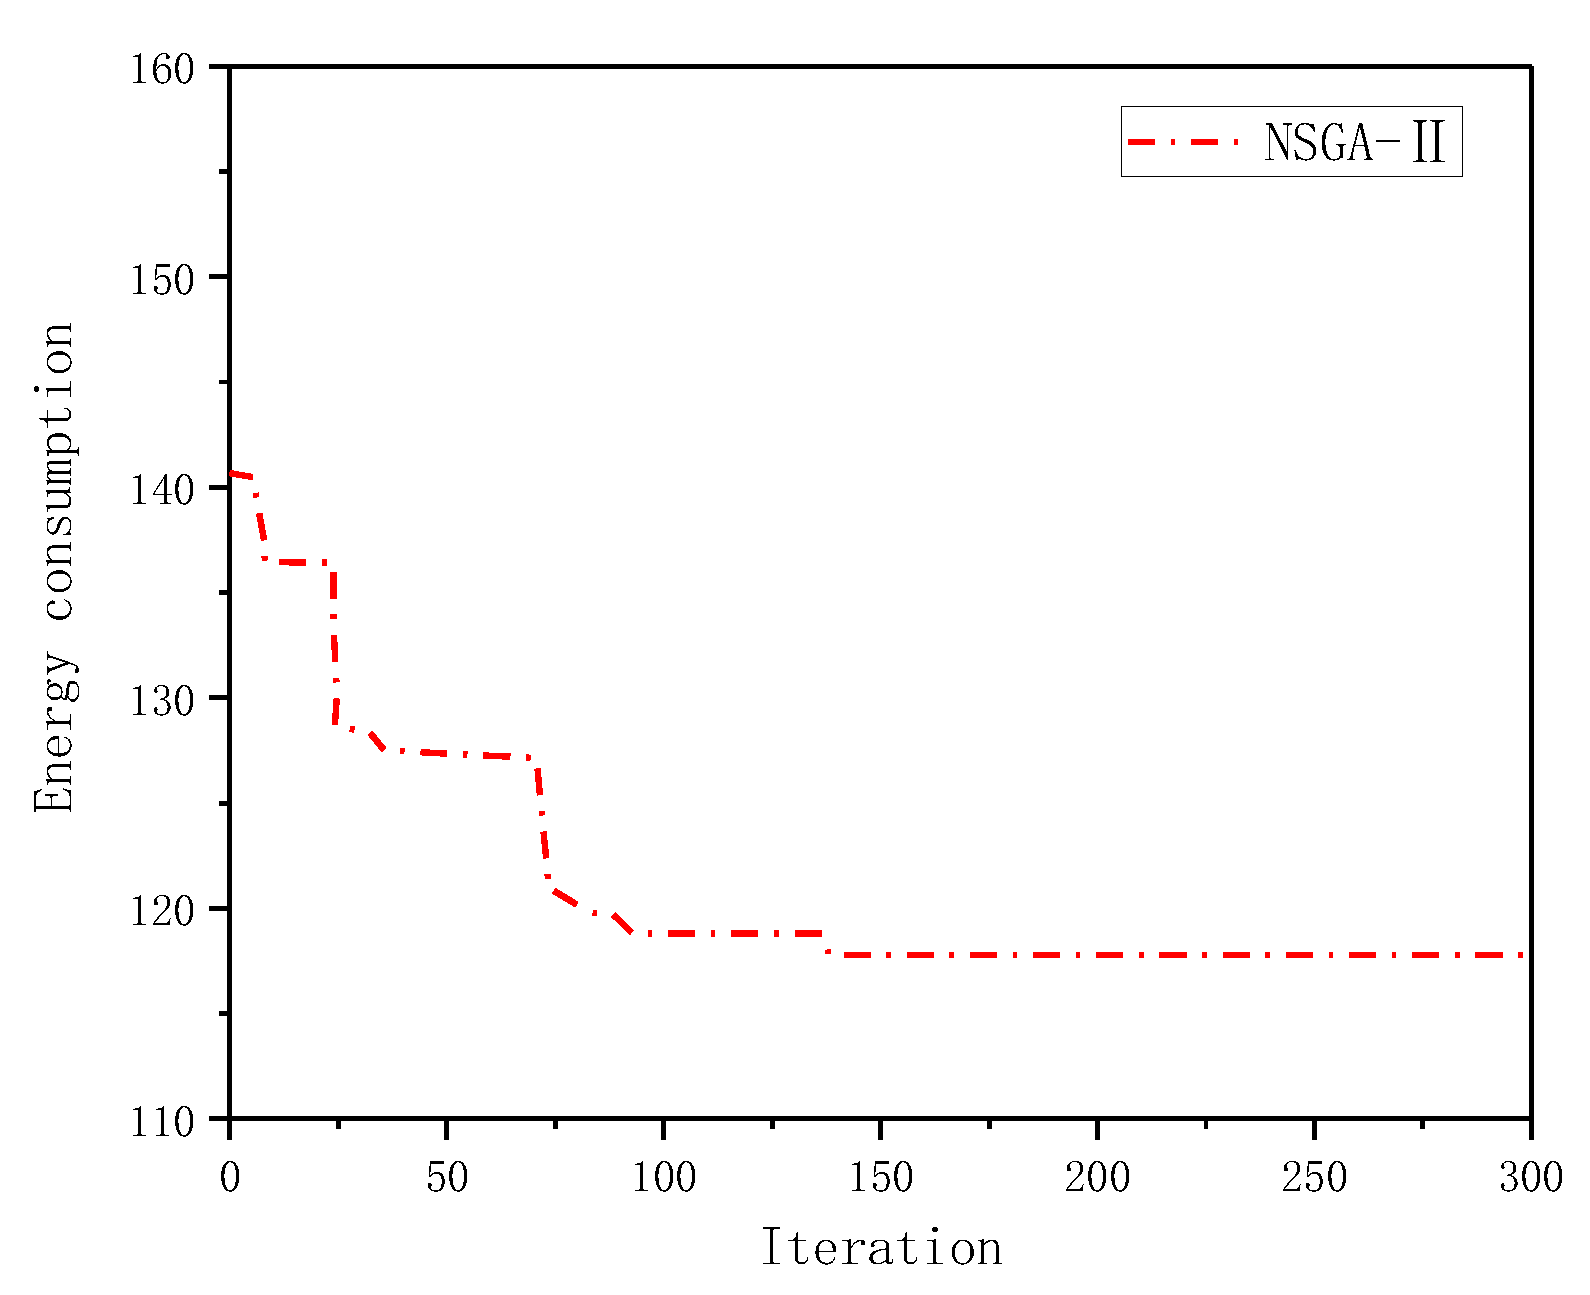
Figure 6.
Energy consumption iteration diagram of GA.
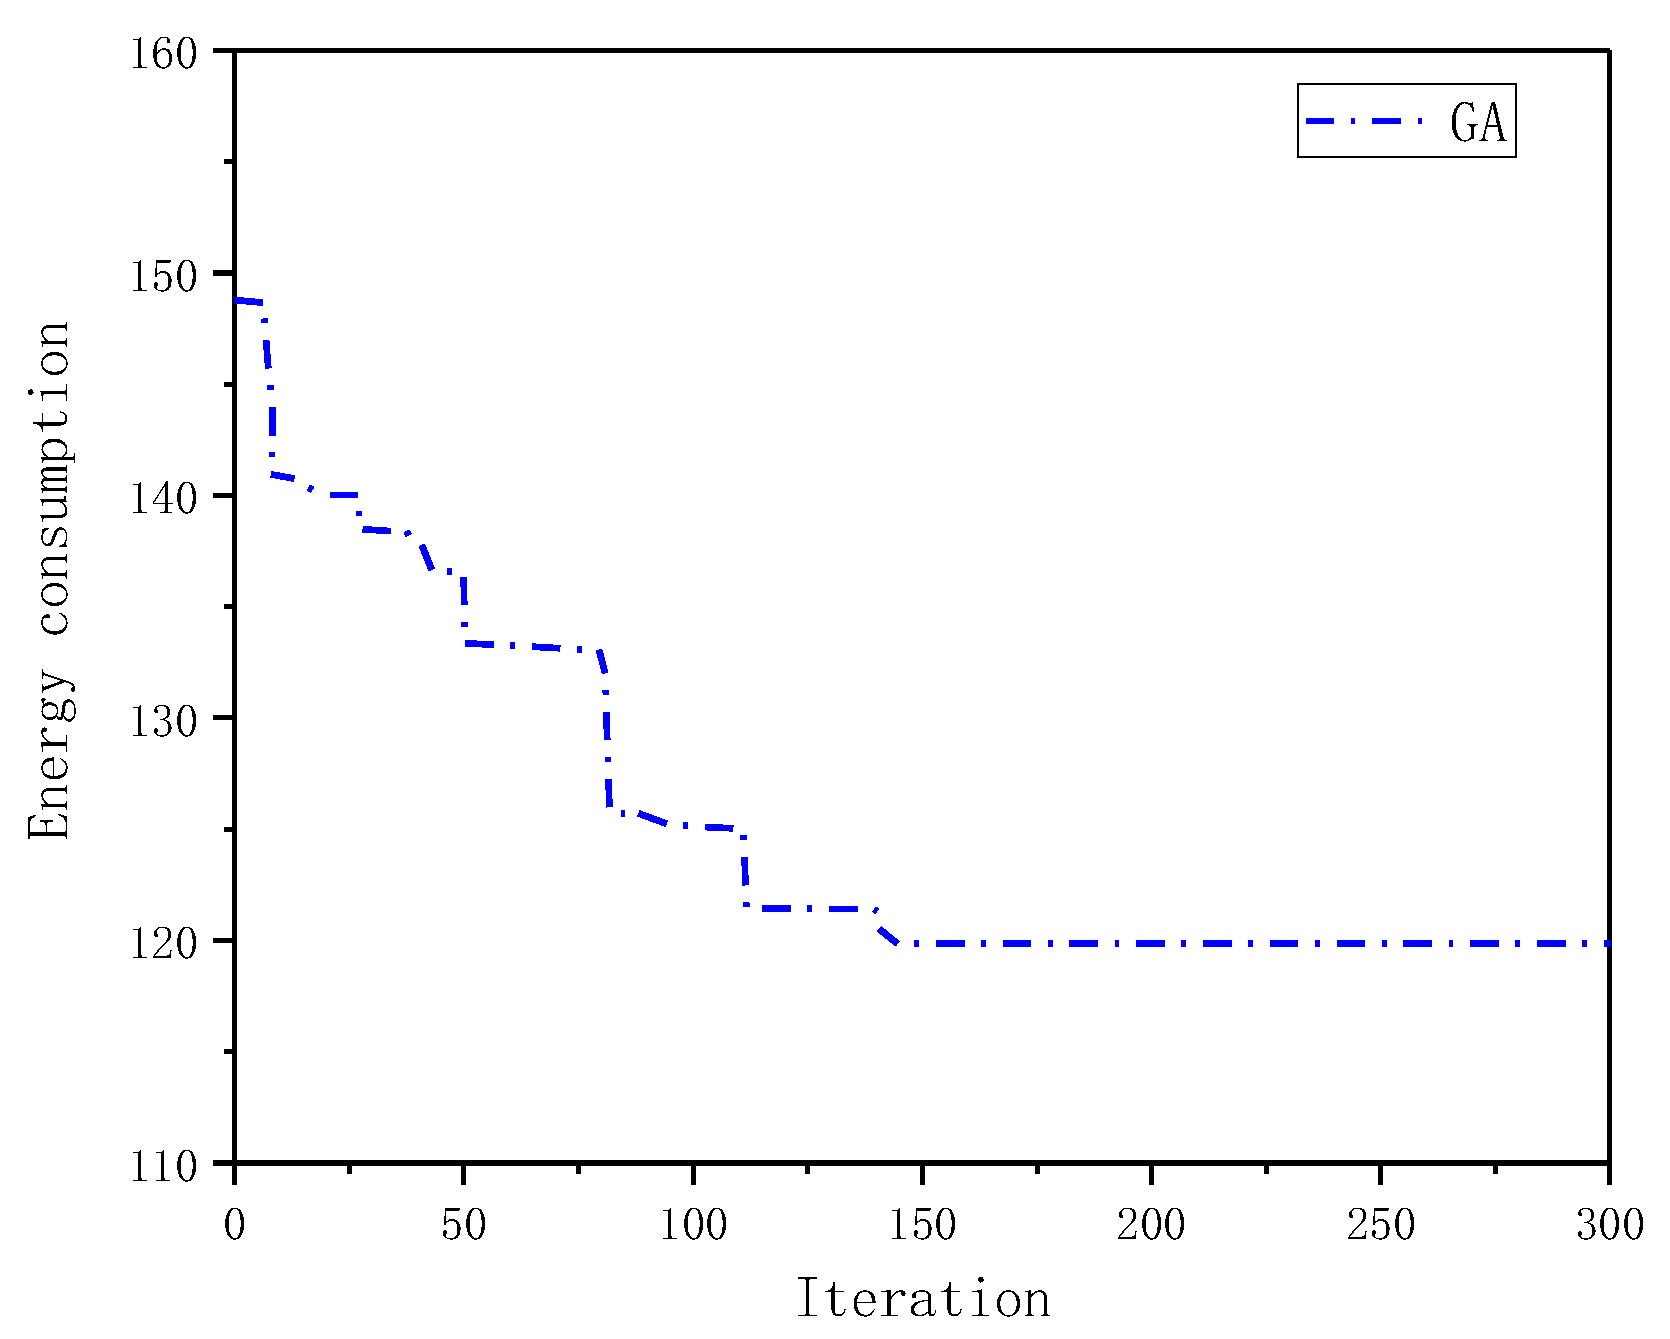
Figure 7.
Carbon emission iteration diagram of DBO.
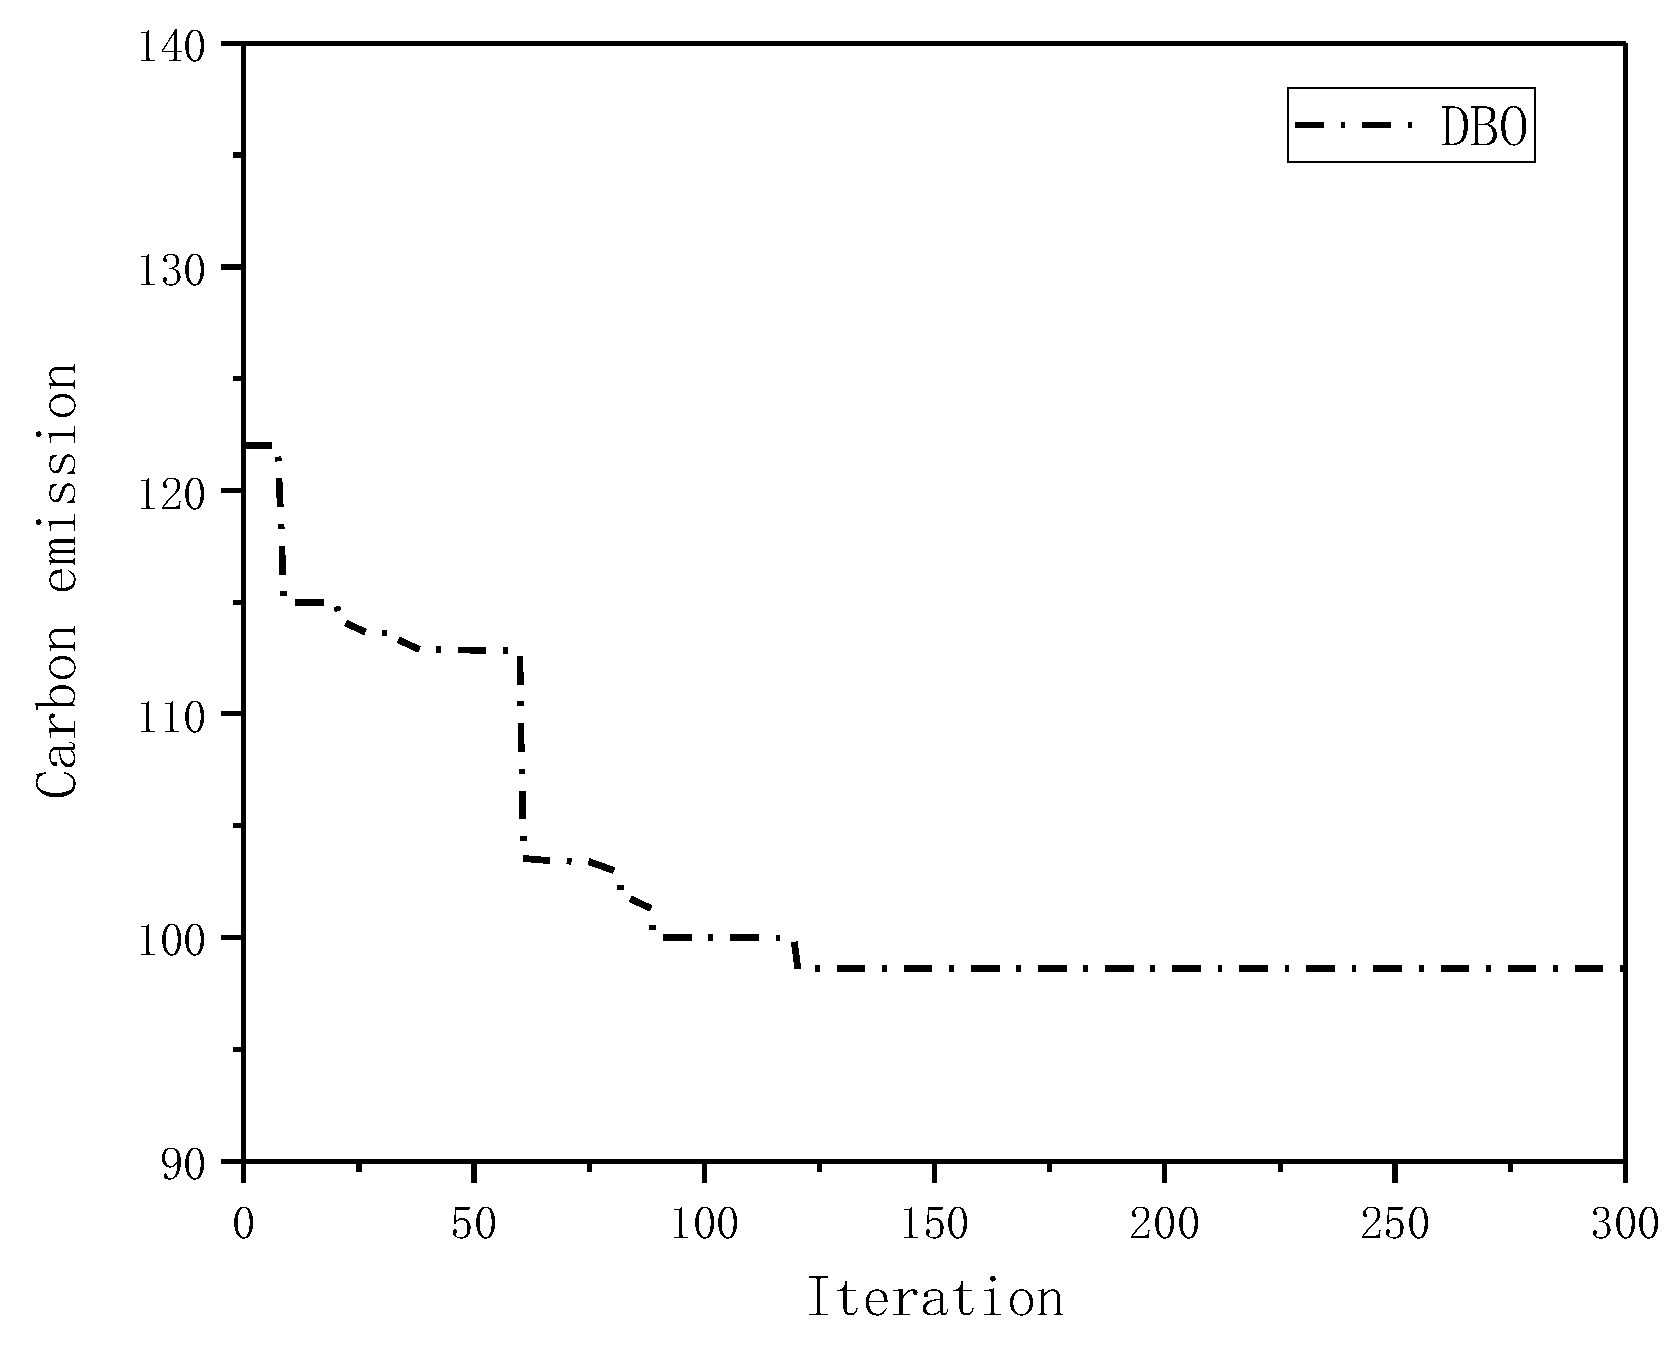
Figure 8.
Carbon emission iteration diagram of NSGA-II.
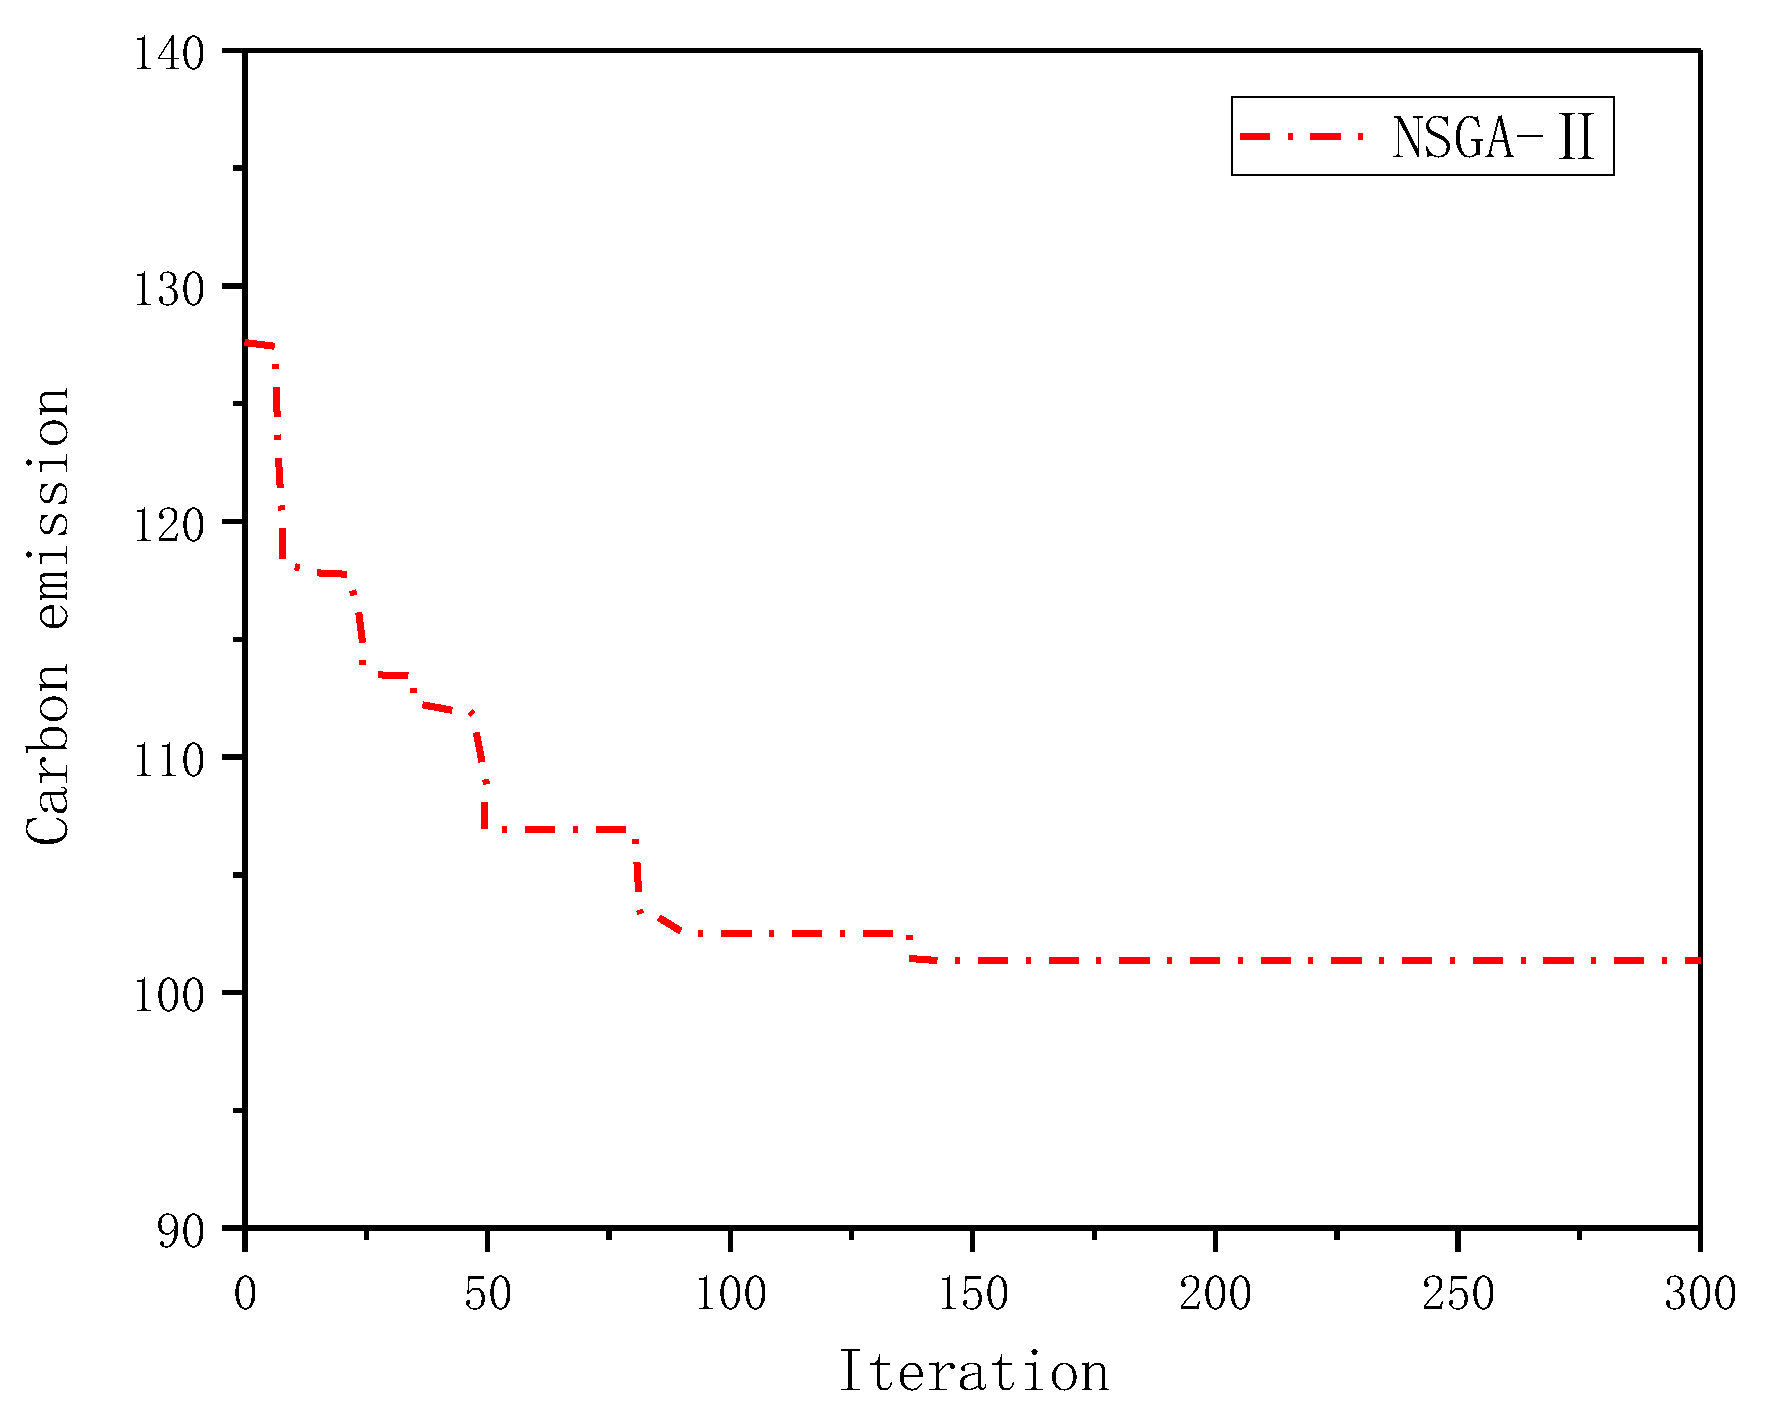
Figure 9.
Carbon emission iteration diagram of GA.

Table 1.
Datasheet related to diesel-powered vehicles.
| Symbol | Description | Reference Value |
|---|---|---|
| fuel–air mass ratio | 1 | |
| engine friction coefficient | 0.2 | |
| g | weight constant | 9.8 |
| air drag coefficient | 0.7 | |
| air density | 1.2041 | |
| rolling resistance coefficient | 0.01 | |
| vehicle drivetrain efficiency | 0.4 | |
| diesel engine efficiency parameters | 0.9 | |
| road angle | 0 | |
| unit fuel and CO2 emission costs | 7.99 | |
| diesel fuel calorific value | 44 | |
| conversion coefficient | 737 |
Table 2.
Distance between stations and between stations and material supermarket.
| Station Number | 0 | 1 | 2 | 3 | 4 | 5 | 6 | 7 | 8 |
|---|---|---|---|---|---|---|---|---|---|
| 0 | 0 | 40 | 60 | 75 | 90 | 200 | 100 | 160 | 80 |
| 1 | 40 | 0 | 65 | 40 | 100 | 50 | 75 | 110 | 100 |
| 2 | 60 | 65 | 0 | 75 | 100 | 100 | 75 | 75 | 75 |
| 3 | 75 | 40 | 75 | 0 | 100 | 50 | 90 | 90 | 150 |
| 4 | 90 | 100 | 100 | 100 | 0 | 100 | 75 | 75 | 100 |
| 5 | 200 | 50 | 100 | 50 | 100 | 0 | 70 | 90 | 75 |
| 6 | 100 | 75 | 75 | 90 | 75 | 70 | 0 | 70 | 100 |
| 7 | 160 | 110 | 75 | 90 | 75 | 90 | 70 | 0 | 100 |
| 8 | 80 | 100 | 75 | 150 | 100 | 75 | 100 | 100 | 0 |
Table 3.
Station material requirement list.
| Distribution Requirement | Station Number | |||||||
|---|---|---|---|---|---|---|---|---|
| 1 | 2 | 3 | 4 | 5 | 6 | 7 | 8 | |
| Material requirement | 20 | 25 | 15 | 23 | 16 | 32 | 20 | 10 |
| Service time | 1 | 0.5 | 1 | 1 | 1 | 1.5 | 1 | 0.8 |
| Waiting time | 0.8 | 0.9 | 1 | 0.5 | 0.5 | 1 | 0.8 | 0.9 |
| Time window | [6, 7] | [5, 7] | [1, 3] | [4, 7] | [3, 5] | [2, 5] | [4, 6] | [1.5, 4] |
Table 4.
Results of vehicle route planning using DBO.
| Distribution Vehicles | Distribution Path | Loading Rate | Delivery Distance (km) | Is It within the Time Window? |
|---|---|---|---|---|
| 1 | 0-3-2-5-0 | 86% | 5.8 | Yes |
| 2 | 0-6-4-0 | 53% | 3.9 | Yes |
| 3 | 0-8-7-1-0 | 78% | 7.3 | Yes |
Disclaimer/Publisher’s Note: The statements, opinions and data contained in all publications are solely those of the individual author(s) and contributor(s) and not of MDPI and/or the editor(s). MDPI and/or the editor(s) disclaim responsibility for any injury to people or property resulting from any ideas, methods, instructions or products referred to in the content. |
© 2023 by the authors. Licensee MDPI, Basel, Switzerland. This article is an open access article distributed under the terms and conditions of the Creative Commons Attribution (CC BY) license (https://creativecommons.org/licenses/by/4.0/).
Share and Cite
MDPI and ACS Style
Xiao, Y.; Zhang, H.; Wang, R. Low-Carbon and Energy-Saving Path Optimization Scheduling of Material Distribution in Machining Shop Based on Business Compass Model. Processes 2023, 11, 1960. https://doi.org/10.3390/pr11071960
AMA Style
Xiao Y, Zhang H, Wang R. Low-Carbon and Energy-Saving Path Optimization Scheduling of Material Distribution in Machining Shop Based on Business Compass Model. Processes. 2023; 11(7):1960. https://doi.org/10.3390/pr11071960
Chicago/Turabian StyleXiao, Yongmao, Hao Zhang, and Ruping Wang. 2023. "Low-Carbon and Energy-Saving Path Optimization Scheduling of Material Distribution in Machining Shop Based on Business Compass Model" Processes 11, no. 7: 1960. https://doi.org/10.3390/pr11071960
Note that from the first issue of 2016, this journal uses article numbers instead of page numbers. See further details here.