Article

A Simple Strategy for the Simultaneous Determination of Dopamine, Uric Acid, L-Tryptophan and Theophylline Based on a Carbon Nano-Onions Modified Electrode

Department of Chemistry, Renmin University of China, Beijing 100872, China
*
Author to whom correspondence should be addressed.
Processes 2023, 11(9), 2547; https://doi.org/10.3390/pr11092547
Submission received: 17 July 2023 / Revised: 15 August 2023 / Accepted: 23 August 2023 / Published: 25 August 2023
(This article belongs to the Special Issue Chemical Process Modelling and Simulation)

Abstract

:
In this work, carbon nano-onions (CNOs) with particle sizes of 5–10 nm were prepared by the multi-potential step method. High-resolution transmission electron microscopy, infrared spectroscopy and Raman spectroscopy characterize the effective synthesis of CNOs. CNOs/GCEs were prepared by depositing the prepared CNOs onto glassy carbon electrodes (GCEs) by a drop-coating method. Examination of the electrocatalytic activity of the CNOs/GCE sensor by simultaneously detecting dopamine (DA), uric acid (UA), L-tryptophan (Trp) and theophylline (TP) using a differential pulse voltammetry technique. The results showed that the linear ranges of DA, UA, Trp and TP were DA 0.01–38.16 μM, UA 0.06–68.16 μM, Trp 1.00–108.25 μM, and TP 8.16–108.25 μM, and the detection limits (S/N = 3) were 0.0039 μM, 0.0087 μM, 0.18 μM and 0.35 μM, respectively. The CNOS/GCE sensor had good stability and could be used for the detection of actual samples.

Graphical Abstract

1. Introduction

There are a variety of biomolecules in the human body, and the concentration data of specific biomolecules can provide crucial reference values in the initial diagnosis of diseases. Dopamine (DA) in the central nervous system is an excitatory neurotransmitter belonging to the monoamine class and plays a critical role in human physiological functions [1]. The imbalance of dopamine concentration will affect the normal operation of the human central nervous system and hormone system, which will lead to Parkinson’s disease, schizophrenia, Tourette’s syndrome, Attention Deficit Hyperactivity Syndrome and pituitary tumourigenesis [2,3]. Uric acid (UA) is a protein metabolite found in human urine, blood and other biological fluids and is a human health hazard [4]. Abnormal UA levels in the body can cause hypertension, metabolic syndrome, kidney injury, and other diseases [5]. L-tryptophan (Trp), one of the 20 amino acids essential for protein biosynthesis, has major effects on human metabolism, including nitrogen balance, muscle mass, and weight maintenance [6]. Theophylline (TP) is a natural alkaloid that can produce various physiological effects, such as relaxing bronchial muscles, secreting gastric acid, and stimulating the central nervous system. It is effective in treating bronchial asthma in clinics due to its ability to relax smooth muscle [7]. DA, UA, Trp and TP co-exist in human serum. Since the detection of these four biomolecules is of great importance not only in diagnostics and pathology research but also in biomedicine and neurochemistry, their efficient simultaneous identification and characterization are becoming more and more popular and critical in many different fields.
Due to the importance of these four biomolecules, there are various materials used for the study of the electrochemical analysis of these four biomolecules, but the main focus is on the differentiation of two or more of DA, UA, Trp and TP at different electrodes. One of the most widely used methods to solve this problem is the use of chemically modified electrodes. These include metal nanoparticle-modified electrodes [8,9,10], polymer-modified electrodes [11,12], carbon nanotubes and their complex-modified electrodes [13] and graphene and its complex-modified electrodes [14,15].
Zhang et al. [16] produced nitrogen-doped graphene by thermal depolymerization (p-phenylenediamine) complexes, and nitrogen-doped graphene showed excellent sensing performance for the simultaneous detection of DA, AA and UA. Yang et al. used ferrocene derivatives functionalized with AuNP/CNOs nanocomposites and graphene to differentiate ascorbic acid (AA), DA, UA and acetaminophen [17]. Chen et al. modified poly(β-cyclodextrin) and CNOs on GCE to effectively detect DA, UA and Trp simultaneously [18]. Sun et al. reported a biosensor composed of Au nanoparticle/TiO2 nanoparticle/carbon nanotube, which can simultaneously detect AA, UA, DA and Trp with high sensitivity [19]. Priyatharshni et al. [20] determined AA, DA and UA simultaneously in pH 4 using an ABO3-type LaCoO3 chalcogenide material with high sensitivity for all three substances. Wang et al. modified carbon dots on GCE by drop coating and successfully assembled a biosensor capable of distinguishing between DA, UA, Trp and TP [21]. The detection of their precursors or metabolites of these analytes, such as phenylalanine [22,23], tyrosine [24,25], le xanthine [26,27] and serotonin [28,29], were also reported.
Carbon nano-onions (CNOs) are an important class of zero-dimensional materials with a large specific surface area, good electrical conductivity, good thermal and a closed and stable π–π conjugated structure. As a result, CNOs are expected to be widely used in optoelectronic, magnetic and wear-reducing material [30], especially in electrochemistry, as they have been reported to have promising applications as electrode materials, catalysts and biosensor building blocks in electrochemistry [31,32,33]. CNOs can promote electron transfer rates better than carbon nanotubes and show good electrocatalytic activity for some biomolecules [34,35]. However, studies on the application of CNOs as electrode modification materials in electrochemical sensors are relatively scarce and, therefore, have a very large scope for exploration. Ozoemena group investigated the electrochemical sensing of DA using onion-like carbons [36]. Plonska-Brzezinska and Echegoyen et al. determined DA in the presence of UA and AA using a carbon nano-onion and poly(diallyldimethylammonium chloride) composite [37]. To our knowledge, there is no report on the simultaneous detection of DA, UA, Trp and TP utilizing CNOs. As a result, the use of CNOs on modified electrodes as electrochemical sensors is of great importance.
In this work, structurally complete and high-purity CNOs were prepared by an organic electrochemical synthesis method, which had the advantages of mild reaction conditions, high product purity, easy operation and low environmental pollution [38]. The modified CNOs/GCE on the surface of glassy carbon electrodes were used for electrochemical studies of DA, UA, Trp and TP. Figure 1 is a schematic diagram of the CNOs/GCE analysis and calibration process. The results show that the CNOs/GCE sensor has excellent stability and can be used for real sample detection. This expands its application in the field of electrochemistry and has important research significance.

2. Experimental

2.1. Materials and Reagents

Toluene, sulfuric acid and hydrogen peroxide (aqueous solution) were purchased from Xilong Chemical Co., Ltd. (Tianjin, China). Acetonitrile was from Thermo Fisher Scientific Co., Ltd. (Waltham, MA, USA). Tetrabutylammonium perchlorate (TBAP), benzene and 1,2-dimethylbenzene were from Sigma-Aldrich (Saint Louis, MO, USA). DA and UA were from Sigma-Aldrich LLC. Trp was from Bio Basic (Toronto, ON, Canada). TP was from Aladdin Industries (Shanghai, China). Phosphate buffer solution (PBS, 0.1 M) was prepared using KH2PO4 and Na2HPO4. Human serum samples were provided by the Affiliated Hospital of Renmin University. All chemicals were of analytical-reagent grade. All aqueous solutions were prepared with Milli-Q water (18.2 MΩ·cm).

2.2. Apparatus

Electrochemical analysis measurements such as cyclic voltammetry (CV) and differential pulse voltammetry (DPV) were carried out using a conventional three-electrode system on a CHI660D workstation in Shanghai Chenhua, China. The purification process was carried out using a muffle furnace (SX2-4-10N) to remove uncharacterized carbon and an ultrasonic generator (SB-2800) to ultrasonically disperse the fired samples, followed by a centrifuge (TG16-WS) to remove the platinum particles. The Raman spectra for the synthesized and purified CNOs were obtained by a Raman spectrometer (Xplora plus). The morphology of the CNOs was obtained by field emission high-resolution transmission electron microscopy (HRTEM) (JEM-2100F) and X-ray powder diffraction (XRD) (D8 Discover, Bruker (Massachusetts, MA, USA)).

2.3. Fabrication of the CNOs

The entire electrochemical synthesis processes were performed at a CHI660D electrochemical workstation. To avoid the influence of air, the experiments needed to be carried out not only at room temperature but also in a nitrogen environment, so the final choice was made to carry out the experiments in a glove box (VG1200/750TS, Vigor (Suzhou, China)). Platinum plate electrodes (30 × 30 × 0.1 mm) were used for both working and counter electrodes, and an Ag/AgCl electrode with a porous ceramic tube that prevents silver nanoparticles from entering the system was used as the reference electrode. Synthesize CNOs using 30 mL acetonitrile, 0.1 M TBAP and 5 mM toluene in a maximum capacity cell of 50 mL. The breakdown potential was 2.2 V to −1.6 V, the breakdown time was 10 s, z and the number of cycles was 2000 times [38].
The impurities in the CNOs prepared by the above method mainly contained amorphous carbon and Pt nanoparticles. After scraping the product off the electrode, the product was first rinsed with acetonitrile to remove TBAP, followed by removing amorphous carbon in a muffle furnace for 10 h. An abrupt reduction in sample mass could be observed in this step. The heat-treated samples were dispersed in CHP for sonication and then centrifuged at a gradient of 6000 r/min to 10,000 r/min for 20 min, with CNOs collected at 10,000 r/min. The final CNO dispersion was prepared for subsequent experiments by centrifugation of a mixture of ethanol and water (ethanol/water = 1:1) [38].

2.4. Fabrication of the CNOs/GCE

2.0 mg of purified CNOs were dispersed with the aid of ultrasonic agitation in 20 mL of N,N-dimethylformamide (DMF) to give a 0.1 mg/mL black suspension. The GC electrode was first abraded with emery paper (No. 1500) and polished with 0.3 μm alumina slurry, then washed ultrasonically in distilled water and ethanol, respectively. Then, the GC electrode was coated by gradually casting 10 μL of the CNO suspension prepared above and then dried under an infrared lamp.

3. Results and Discussion

3.1. Surface Characterization of the CNOs

Figure 2A,B show TEM images of CNOs. The hollow polyhedron morphology of CNOs was observed by TEM, and the distribution was relatively uniform, containing abundant nanoparticles. The distribution of the outer diameter (outer size) of nanoparticles was about 5–10 nm, and the inner diameter was about 2–3 nm. There were 6–8 unequal layers evenly distributed between the inner shell layers, and the layer spacing was approximately equal to the graphite layer spacing of 0.336 nm. At the same time, the carbon nano-onion molecules also appeared to “adhere” to each other, which might be due to the introduction of surfactants during the separation and purification, resulting in a serious aggregation phenomenon. Some nanoparticles had edge defects and a non-spherical polygon state.
The X-ray diffraction technique was particularly suitable for the analysis of single and polycrystalline structures. Figure 2C shows the characterization results of XRD of CNOs produced by electrochemical synthesis. CNOs showed sharp diffraction peaks around 2θ = 26° and 2θ = 44°, close to those of graphite [002] at 26.4° on the crystal plane and graphite [101] at 44.6° on the crystal plane, where the layer spacing was altered due to the graphite layers curling to form a carbon onion and the tensile stress between the layers changing [39,40]. The more pointed peak shape and narrower half-peak width suggested that the nanoparticles in CNOs had a high degree of graphitization, corresponding to sp2-hybridized carbon atoms.
Raman spectroscopy is a commonly used technique for characterizing the structure of carbon materials. Figure 2D shows the Raman spectrum of CNOs between 1200 and 1800 cm−1, from which it could be seen that the results showed strong and clear G (graphitic) and D (disorder) bands, similar to those reported in the literature for CNOs obtained by nanodiamond powder heated to 1650 °C and annealing at room temperature [41], indicating that the CNOs were very small in size. The Raman spectral peak G mode of CNOs (at 1575 cm−1) had a narrower peak width and higher intensity, thus indicating that the CNOs had a chemical structure similar to that of graphitic carbon atomic layers, where the particle structure was well-oriented and crystalline, which was highly consistent with the results obtained from previous XRD tests. Also visible in the figure is the strong spectral peak D modeled at 1359 cm−1. This is about the same intensity as the G mode, indicating that CNOs contain more graphitized carbon onions but also more structural defects [42].
This was mainly due to the uneven size distribution of the carbon onion and the introduction of pentagons into the hexagonal graphite layer, which increased the spheroidal bond length and induced tension within the crystal, resulting in a frequency shift of the Raman scattering peak relative to 1582 cm−1. The bending of carbon atomic layers in graphite crystals inevitably leads to defects or layer defects, destroying the integrity of the six-membered carbon atom ring network and generating D-mode near 1346 cm−1 [43].
Therefore, the XRD and Raman test results indicated that the degree of graphitization and orderliness of the nanocarbon material products synthesized by electrochemical synthesis was high, which facilitated the study of their properties.

3.2. Electrochemical Reactivity of the CNOs/GCE Electrode

Electrochemical impedance spectroscopy is a common method for studying electron transfer between electrodes. The larger the diameter of the curved semicircle, the greater the transfer resistance (Rct) of the electrode surface. Figure 3A shows the EIS spectra of GCE (black) and CNOs/GCE (red) in 5 mM [Fe(CN)6]3−/4− and 0.1 M KCl solutions. The GCE had low arcing [44,45] in the high-frequency range and a charge transfer resistance (Rct) of approximately 293 Ω. After modifying CNOs on the surface of GCE, the Nyquist diagram of the modified electrode was changed, and the Rct value of the modified electrode was increased to 327.9 Ω, indicating the modification of CNOs on GCE, and the increase of CNOs/GCE Rct should be related to the formation of the CNOs layer [46]. Rs stood for the resistance of the solution, Cd represented double-layer capacitance, Rct represented the interfacial charge transfer reaction, Zw stood for Warburg diffusion and Cp and Rp represented the dielectric properties and the resistance of the inner layer of the electrode.
To confirm that CNOs can facilitate electron transfer better than GCE, their electrochemical behavior at both electrodes was characterized using [Fe(CN)6]3− as a redox probe. Figure 3B shows CV diagrams of CNOs/GCE and GCE in 0.1 mM [Fe(CN)6]3− a solution containing 0.1 M KCl. The Ipa and Ipc at GCE were 123 μA and 124 μA, while the Ipa and Ipc at CNOs/GCE were 260 μA and 278 μA. Furthermore, the potential difference (ΔEp) of the redox peak on the GCE was 89 mV, while the ΔEp on the CNOs/GCE electrode was reduced to 83 mV. In addition, the electrochemically active surface area (Ae) of the electrode was calculated using the Randles–Sevcik equation:
Ipa = 2.69 × 10⁵Aen3/2D01/2C0V1/2
In the formula, n is the electron transfer number, D0 is the diffusion coefficient of [Fe(CN)6]3− in an aqueous solution (6.3 × 10⁻⁶ cm2/s), V is the sweep speed, and C0 is the volume concentration. The calculated Ae values for GCE and CNOs/GCE were 0.36 and 0.77 cm2, respectively, proving that the electrode modified with carbon nano-onion had significantly improved electron transport capacity and enhanced electrochemical response.

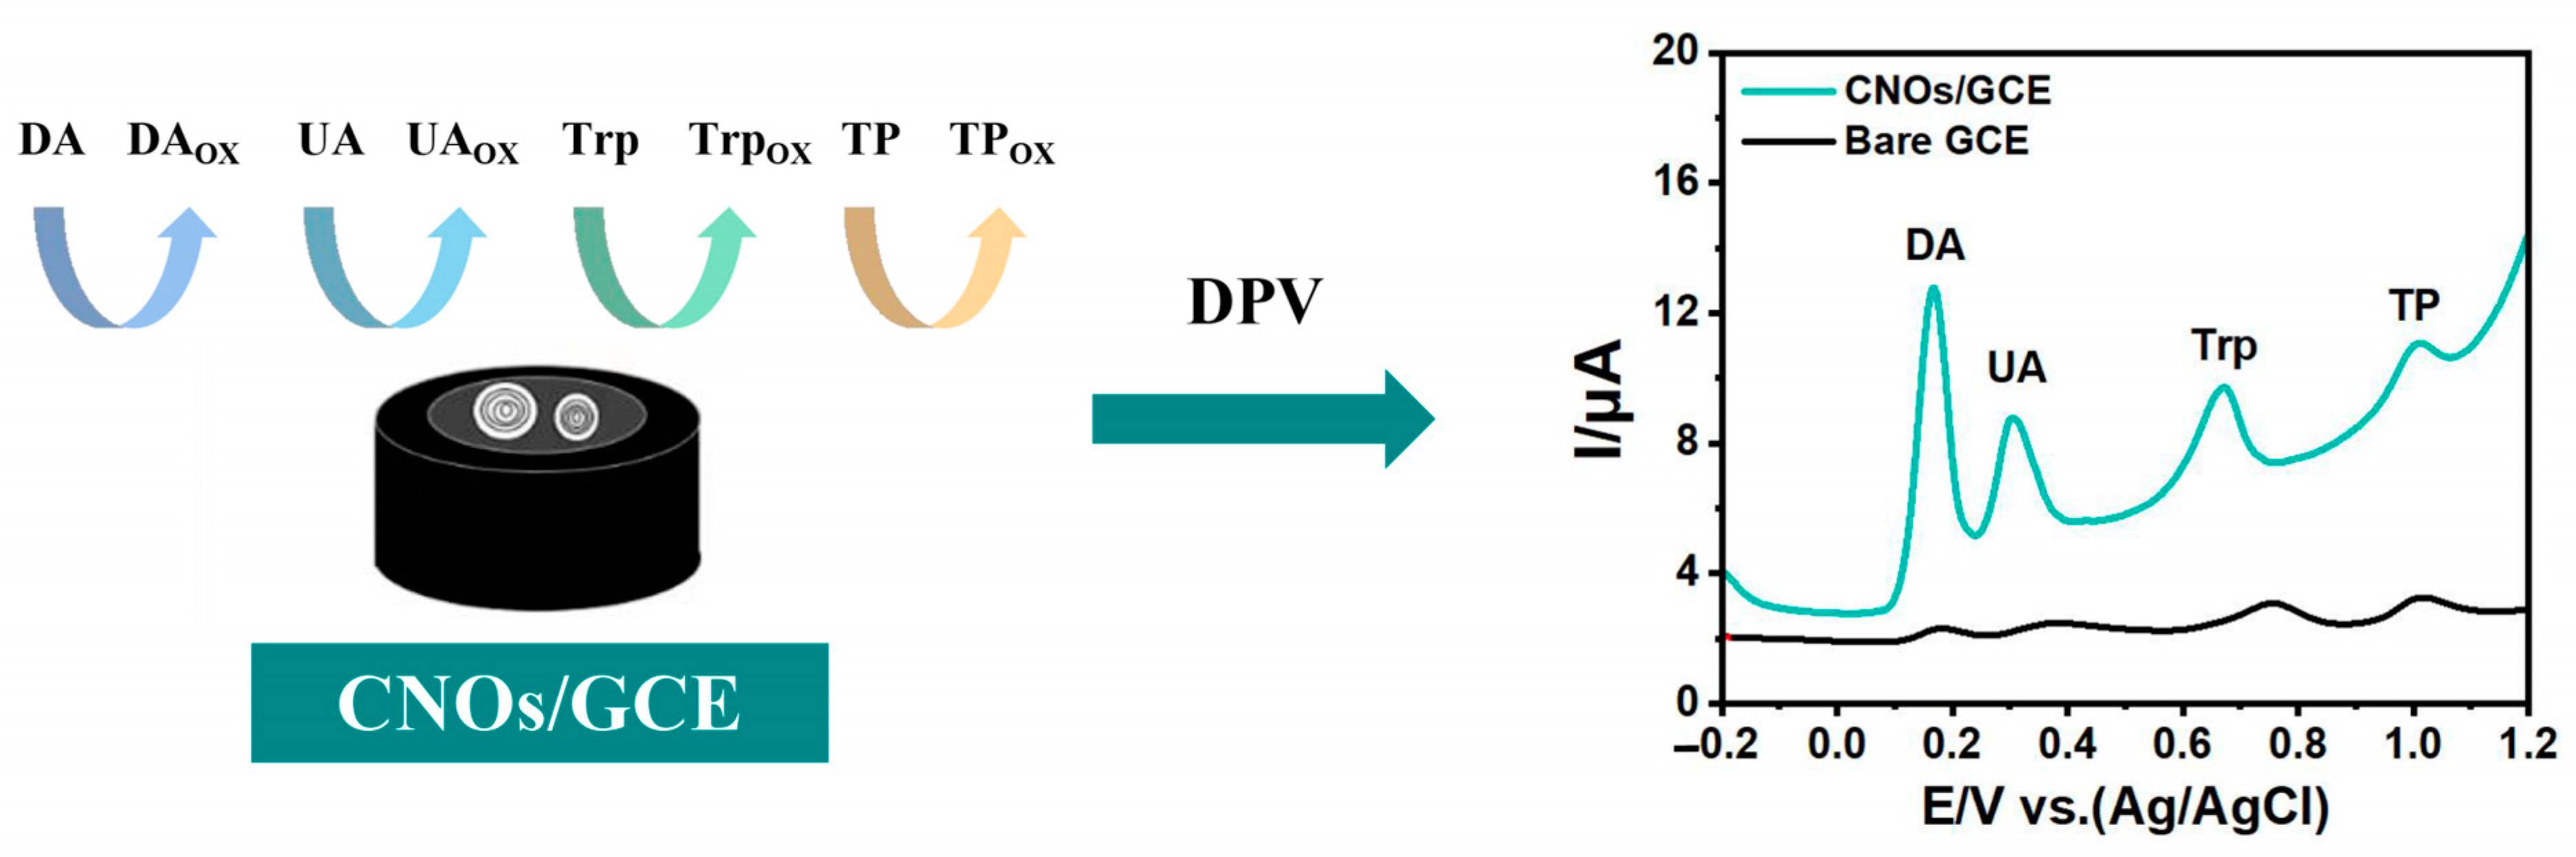
3.3. Electrochemical Performance of CNOs/GCE for DA, UA, Trp and TP

To compare the electrochemical performance of GCE and CNOs/GCE, DA, UA, Trp and TP were simultaneously detected by differential pulse voltammetry (DPV). Figure 4 shows the DPV plots of the four substances on GCE and CNOs/GCE, respectively. On GCE, distinct oxidation peaks were observed for DA, UA, Trp and TP with peak potentials of 0.184 V, 0.34 V, 0.756 V and 1.016 V, respectively, while on CNOs/GCE, four distinct oxidation peaks were observed for DA, UA, Trp and TP at 0.164 V, 0.312 V, 0.672 V and 1.008 V, respectively. The oxidation peak potentials were all negatively shifted. The peak potential separations were 148 mV for DA and UA, 360 mV for UA and Trp, and 336 mV for Trp and TP. The peak oxidation currents of DA, UA, Trp and TP on CNOs/GCE increased significantly by a factor of about 10, 9, 3 and 2, respectively. This indicated that CNOs/GCE had a sufficient resolution for the potential difference of the mixed four substances to determine the mixed four substances simultaneously.

3.4. Optimization of Parameters

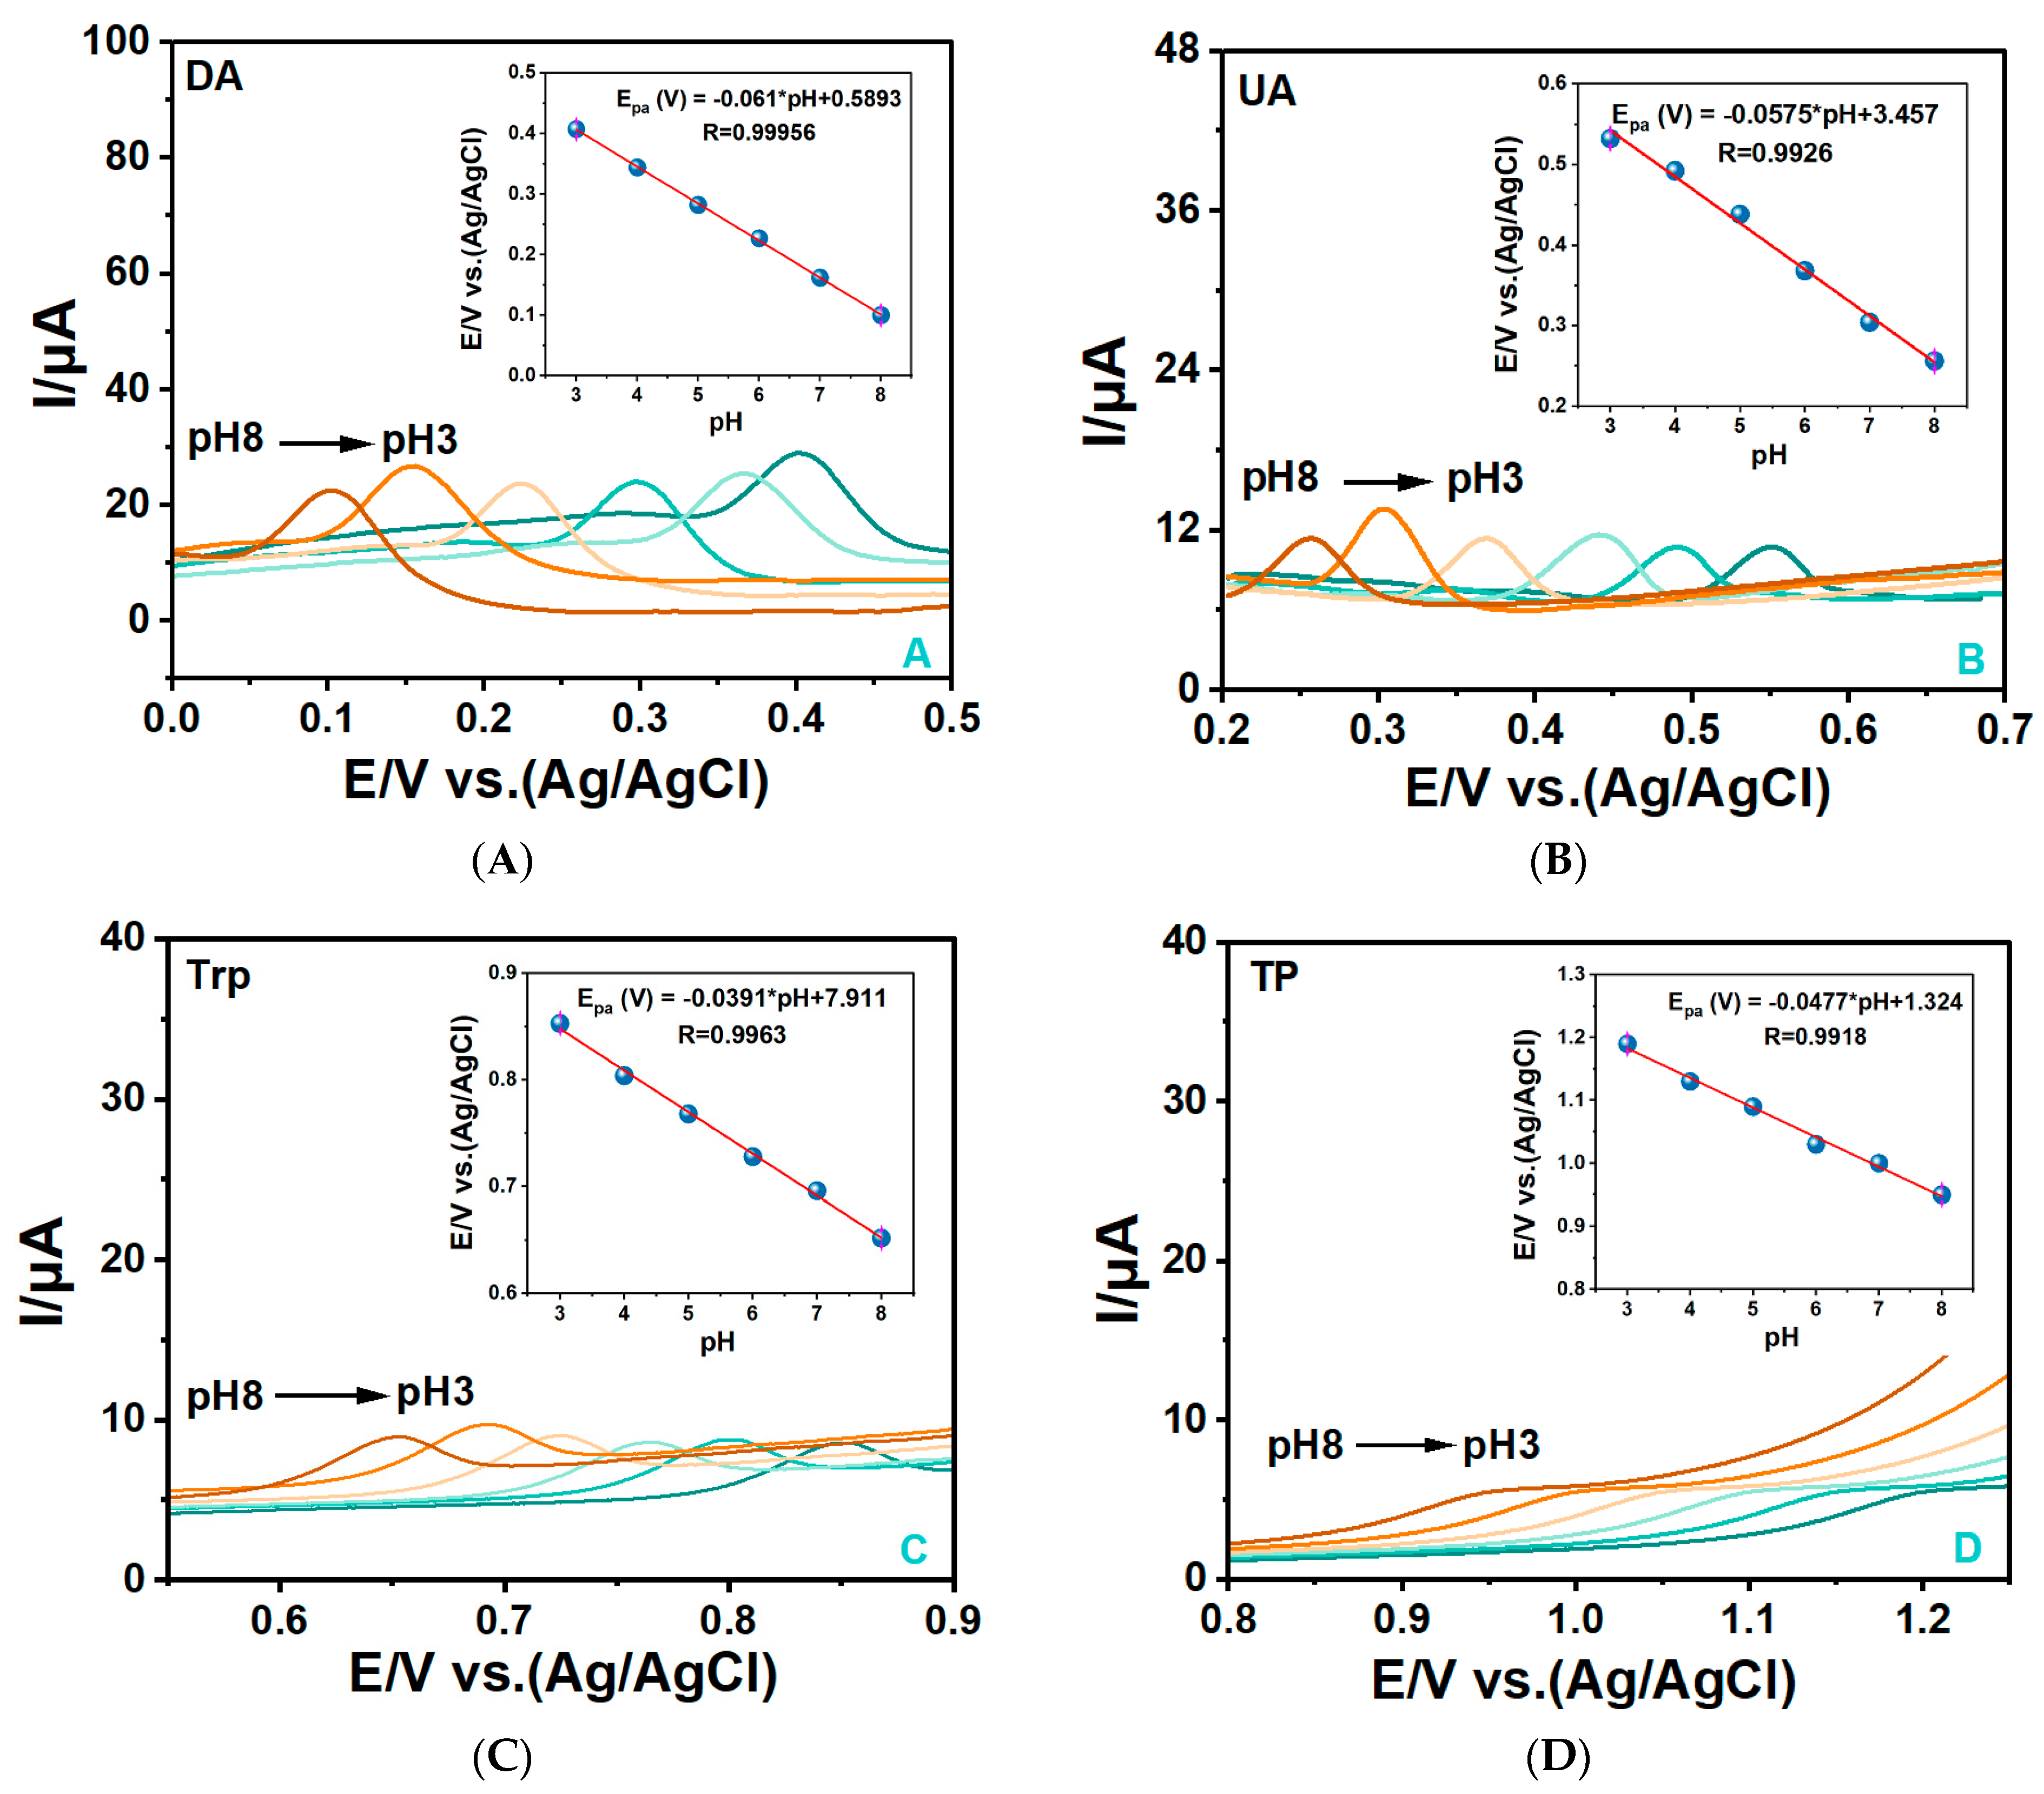
3.4.1. Investigation of the pH Effects

Optimize the pH of the buffer and observe the effects of different pH (3.0, 4.0, 5.0, 6.0, 7.0 and 8.0) solutions on the oxidation peak currents and peak potential differences of DA, UA, Trp and TPon CNOs/GCE using DPV method for analysis. The result is shown in Figure 5. The DPV plots for DA, UA, Trp and TP are given in Figure 5A–D, respectively, where the corresponding oxidation peak potentials were negatively linear with pH. The linear regression equation corresponding to DA was Ep (V) = −0.0610 pH + 0.5893 (R = 0.9996), the linear regression equation corresponding to UA was Ep (V) = −0.0575 pH + 3.457 (R = 0.9926), with the slope of the linear regression line for DA and UA closed to 59 mV·pH−1 (theoretical value), which indicated that the electrooxidation reaction involved the same amount of proton and electron transfer. The linear regression equation corresponding to Trp was Ep (V) = −0.0391 pH + 7.911 (R = 0.9963), and the linear regression equation corresponding to TP was Ep (V) = −0.0477 pH + 1.324 (R = 0.9918). The slopes of the linear regression lines for Trp and TP were both approximately 1/2 the theoretical value, indicating that the number of protons transferred during the reaction was 1/2 the number of electrons transferred.
Figure 6A shows the variation of oxidation peak currents for DA, UA, Trp and TP as affected by pH. It could be seen that the largest oxidation peak currents appeared at pH 7 for DA, UA and TP and pH 4 for Trp, respectively. Figure 6B depicts the variation of oxidation peak difference between DA, UA, Trp and TP as affected by pH, where the UA-DA oxidation peak separation increased slowly with increasing pH, with a minimum value at pH 3 and a larger value at pH 7 and 8. The Trp-UA oxidation peak separation tended to decrease and then increase with increasing pH, with a minimum value at pH 4 and a larger value at pH 7 and 8. The TP-Trp oxidation peak separation showed a slight decrease with increasing pH, with larger values at pH 3 and 4. The TP-DA oxidation peak separation changed little at pH 3–8.
Therefore, pH 7 showed that the oxidation peak potential separation of UA-DA, Trp-UA and TP-DA was larger, and the corresponding response currents of DA, UA and TP oxidation peaks were higher, and this pH value was comparable to the human physiological pH environment, so this experiment selected pH 7 as the best detection condition.

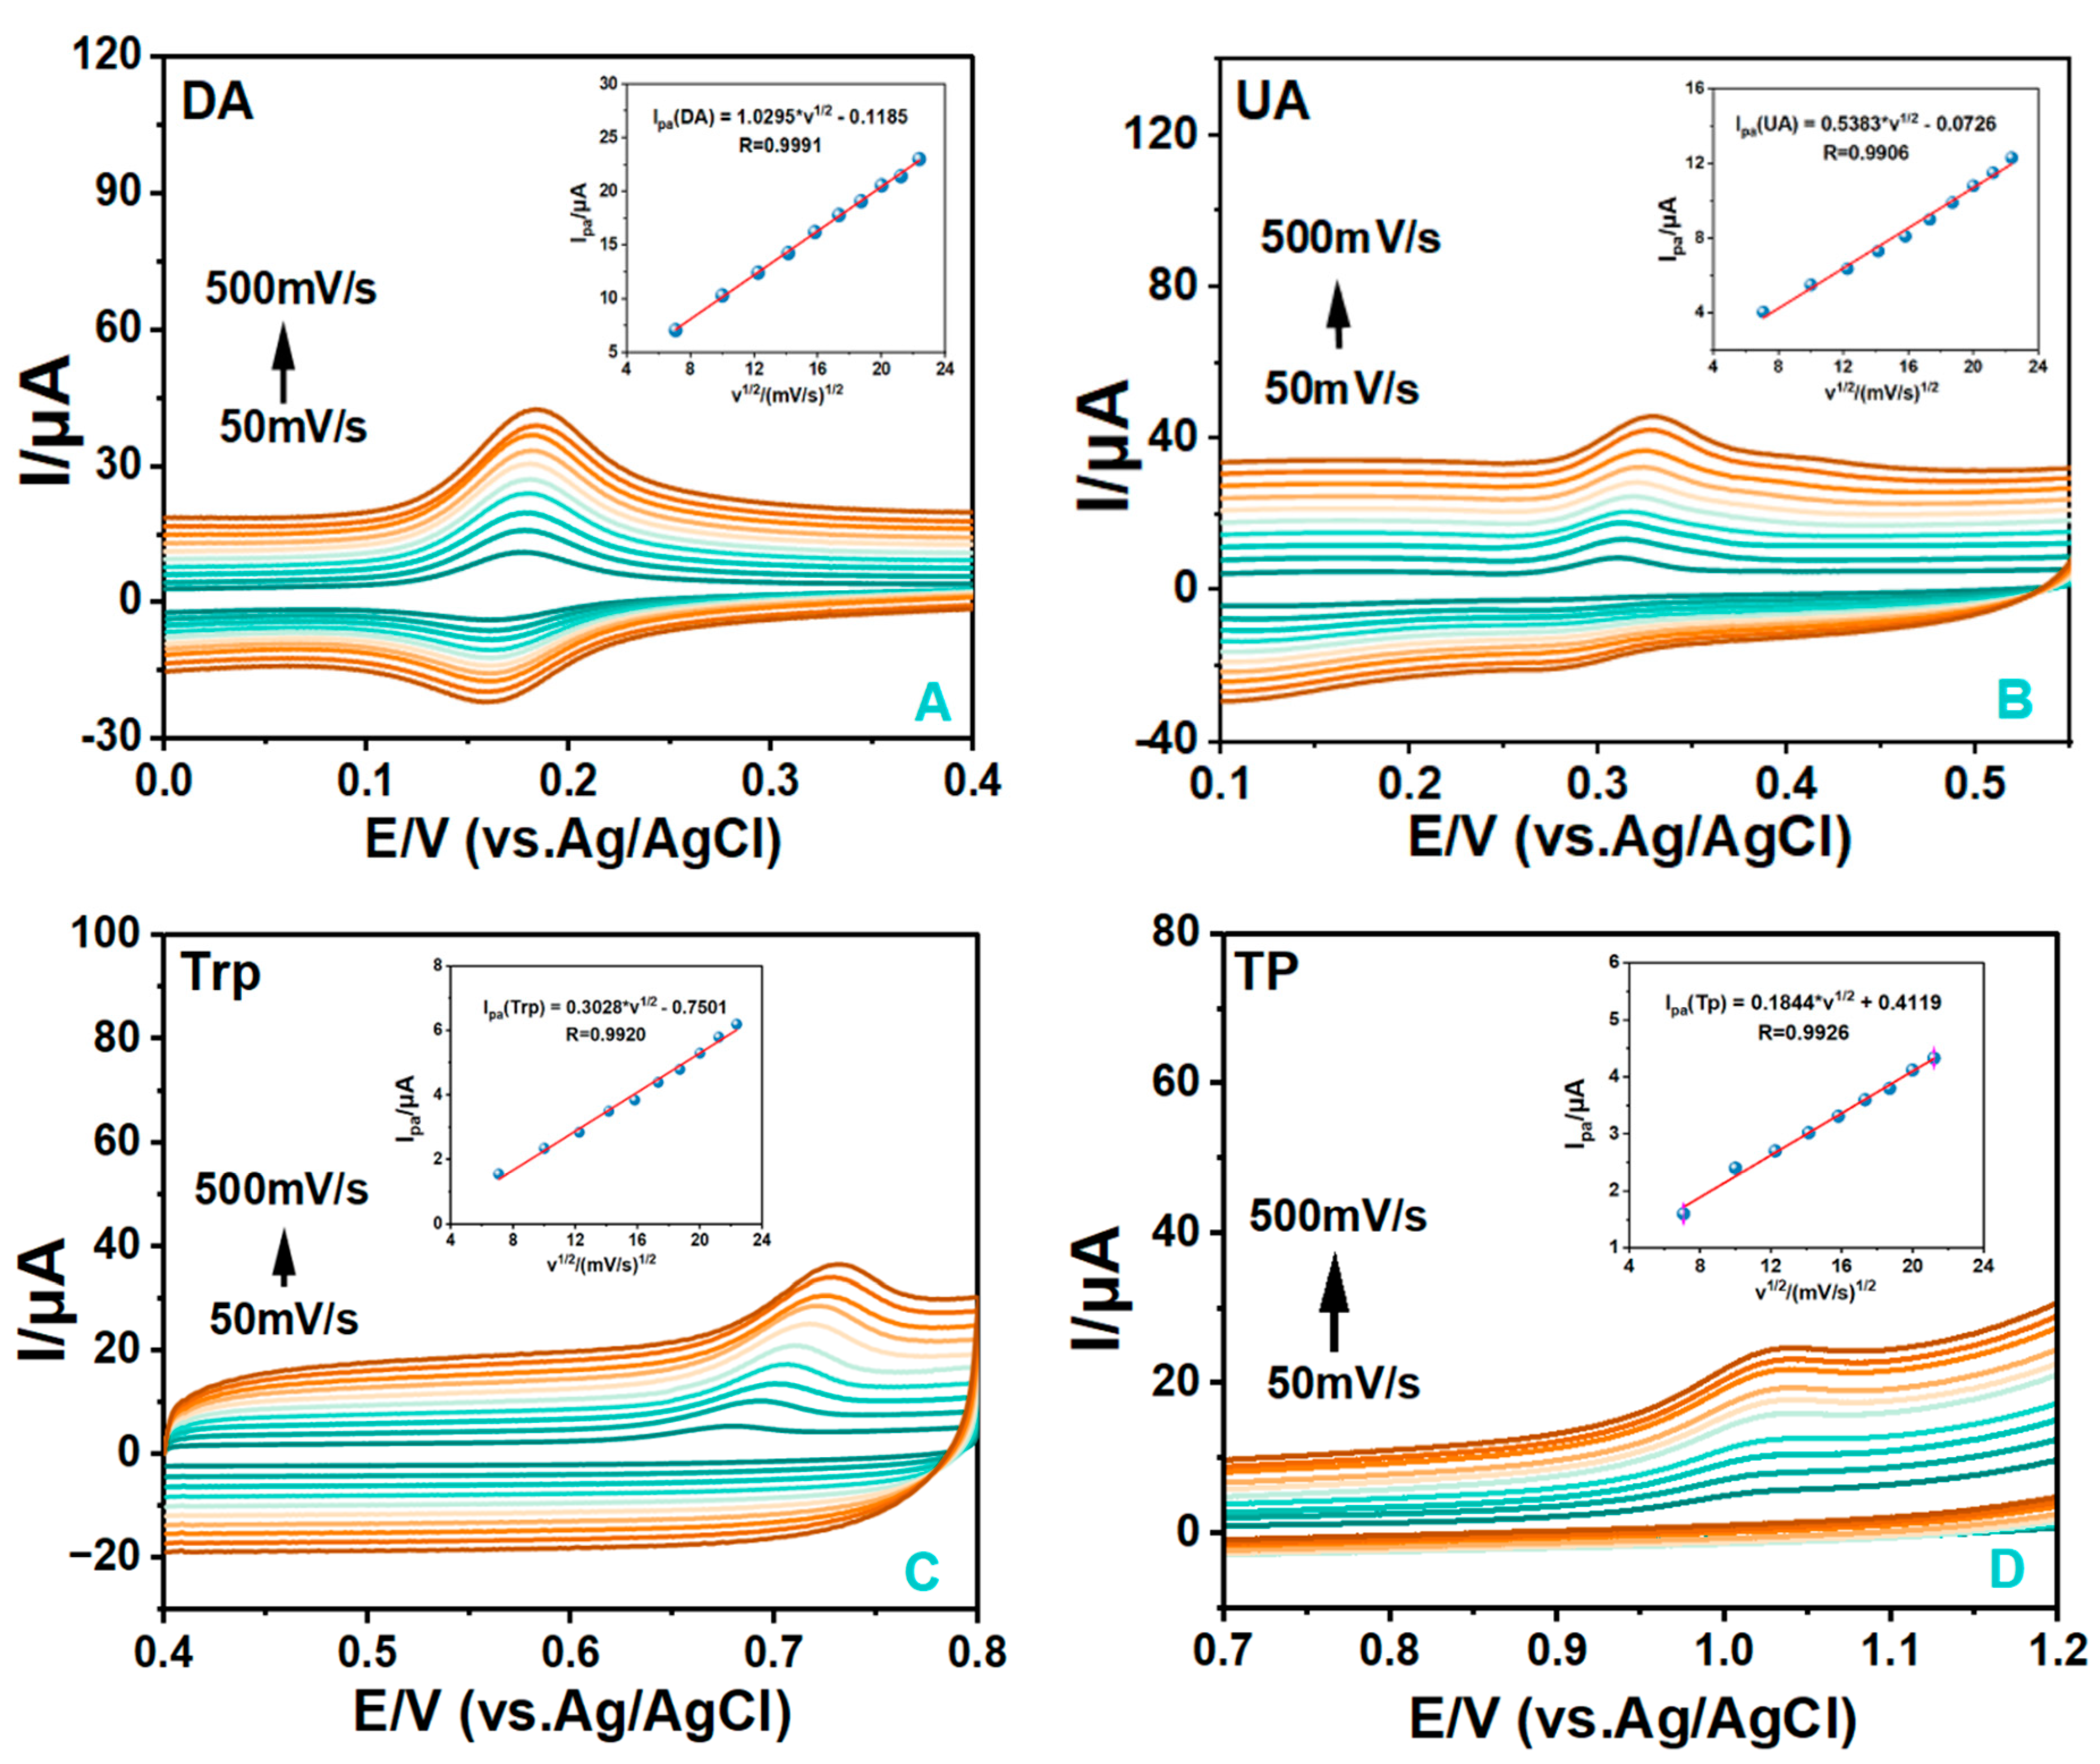
3.4.2. The Effect of Scan Rates

The effect of scan rate (50–500 mV/s) on the peak anodic current of DA, UA, Trp and TP detected by CNOs/GCE was investigated using cyclic voltammetry, as shown in Figure 7. The peak oxidation currents of the four substances were linearly related to the square root of the scanning rate, indicating that the electrooxidation reactions of the four substances on CNOs/GCE were diffusion-controlled processes, following linear regression equations:
Ipa(DA) = 1.0295v1/2 − 0.1185, R = 0.9991
Ipa(UA) = 0.5383v1/2 − 0.0726, R = 0.9906
Ipa(Trp) = 0.3028v1/2 − 0.7501, R = 0.9920
Ipa(TP) = 0.1844v1/2 + 0.4119, R = 0.9926

3.4.3. Individual and Simultaneous Determination of DA, UA, Trp and TP

The different DPV responses of DA, UA, Trp and TP were recorded under the condition of 0.1 M PBS (pH 7.0), where the concentration of one substance was varied while the concentrations of the other three substances remained unchanged (Figure 8A–D). The results showed that when the four substances were tested simultaneously, the peak oxidation currents of the substances with individually varying concentrations increased linearly with increasing concentration, whereas the peak currents of the three remaining substances whose concentrations were kept constant remained almost unchanged. Based on the linear results, the regression equations for DA, UA, Trp and TP were as follows:
IDA (μA) = 0.0671 + 0.9963 CDA (μM), R = 0.9938
IUA(μA) = 0.0364 + 0.1078 CUA (μM), R = 0.9988
ITrp(μA) = 0.0070 + 0.0802 CTrp (μM), R = 0.9977
ITP(μA) = 0.1069 + 0.0469 CTP (μM), R = 0.9981
The results showed that CNOs/GCE was resistant to interference in the detection system and could detect DA, UA, Trp and TP simultaneously on CNOs/GCE. The detection limit of DA was 0.0039 μM/L (S/N = 3), and the relative standard deviation was ±1.4% (n = 10). Similarly, the detection limits of UA, Trp and TP were 0.0087 μM/L (S/N = 3), 0.18 μM/L (S/N = 3) and 0.35 μM/L (S/N = 3), respectively, with RSD of ±1.05% (n = 10), ±2.00 (n = 10) and ±1.33% (n = 10), respectively. Table 1 lists the sensing performances of the CNOs/GCE compared with other related sensors reported in recent literature. Actually, the CNOs/GCE showed better performances than other electrodes, especially the wide linear ranges and low detection limits.

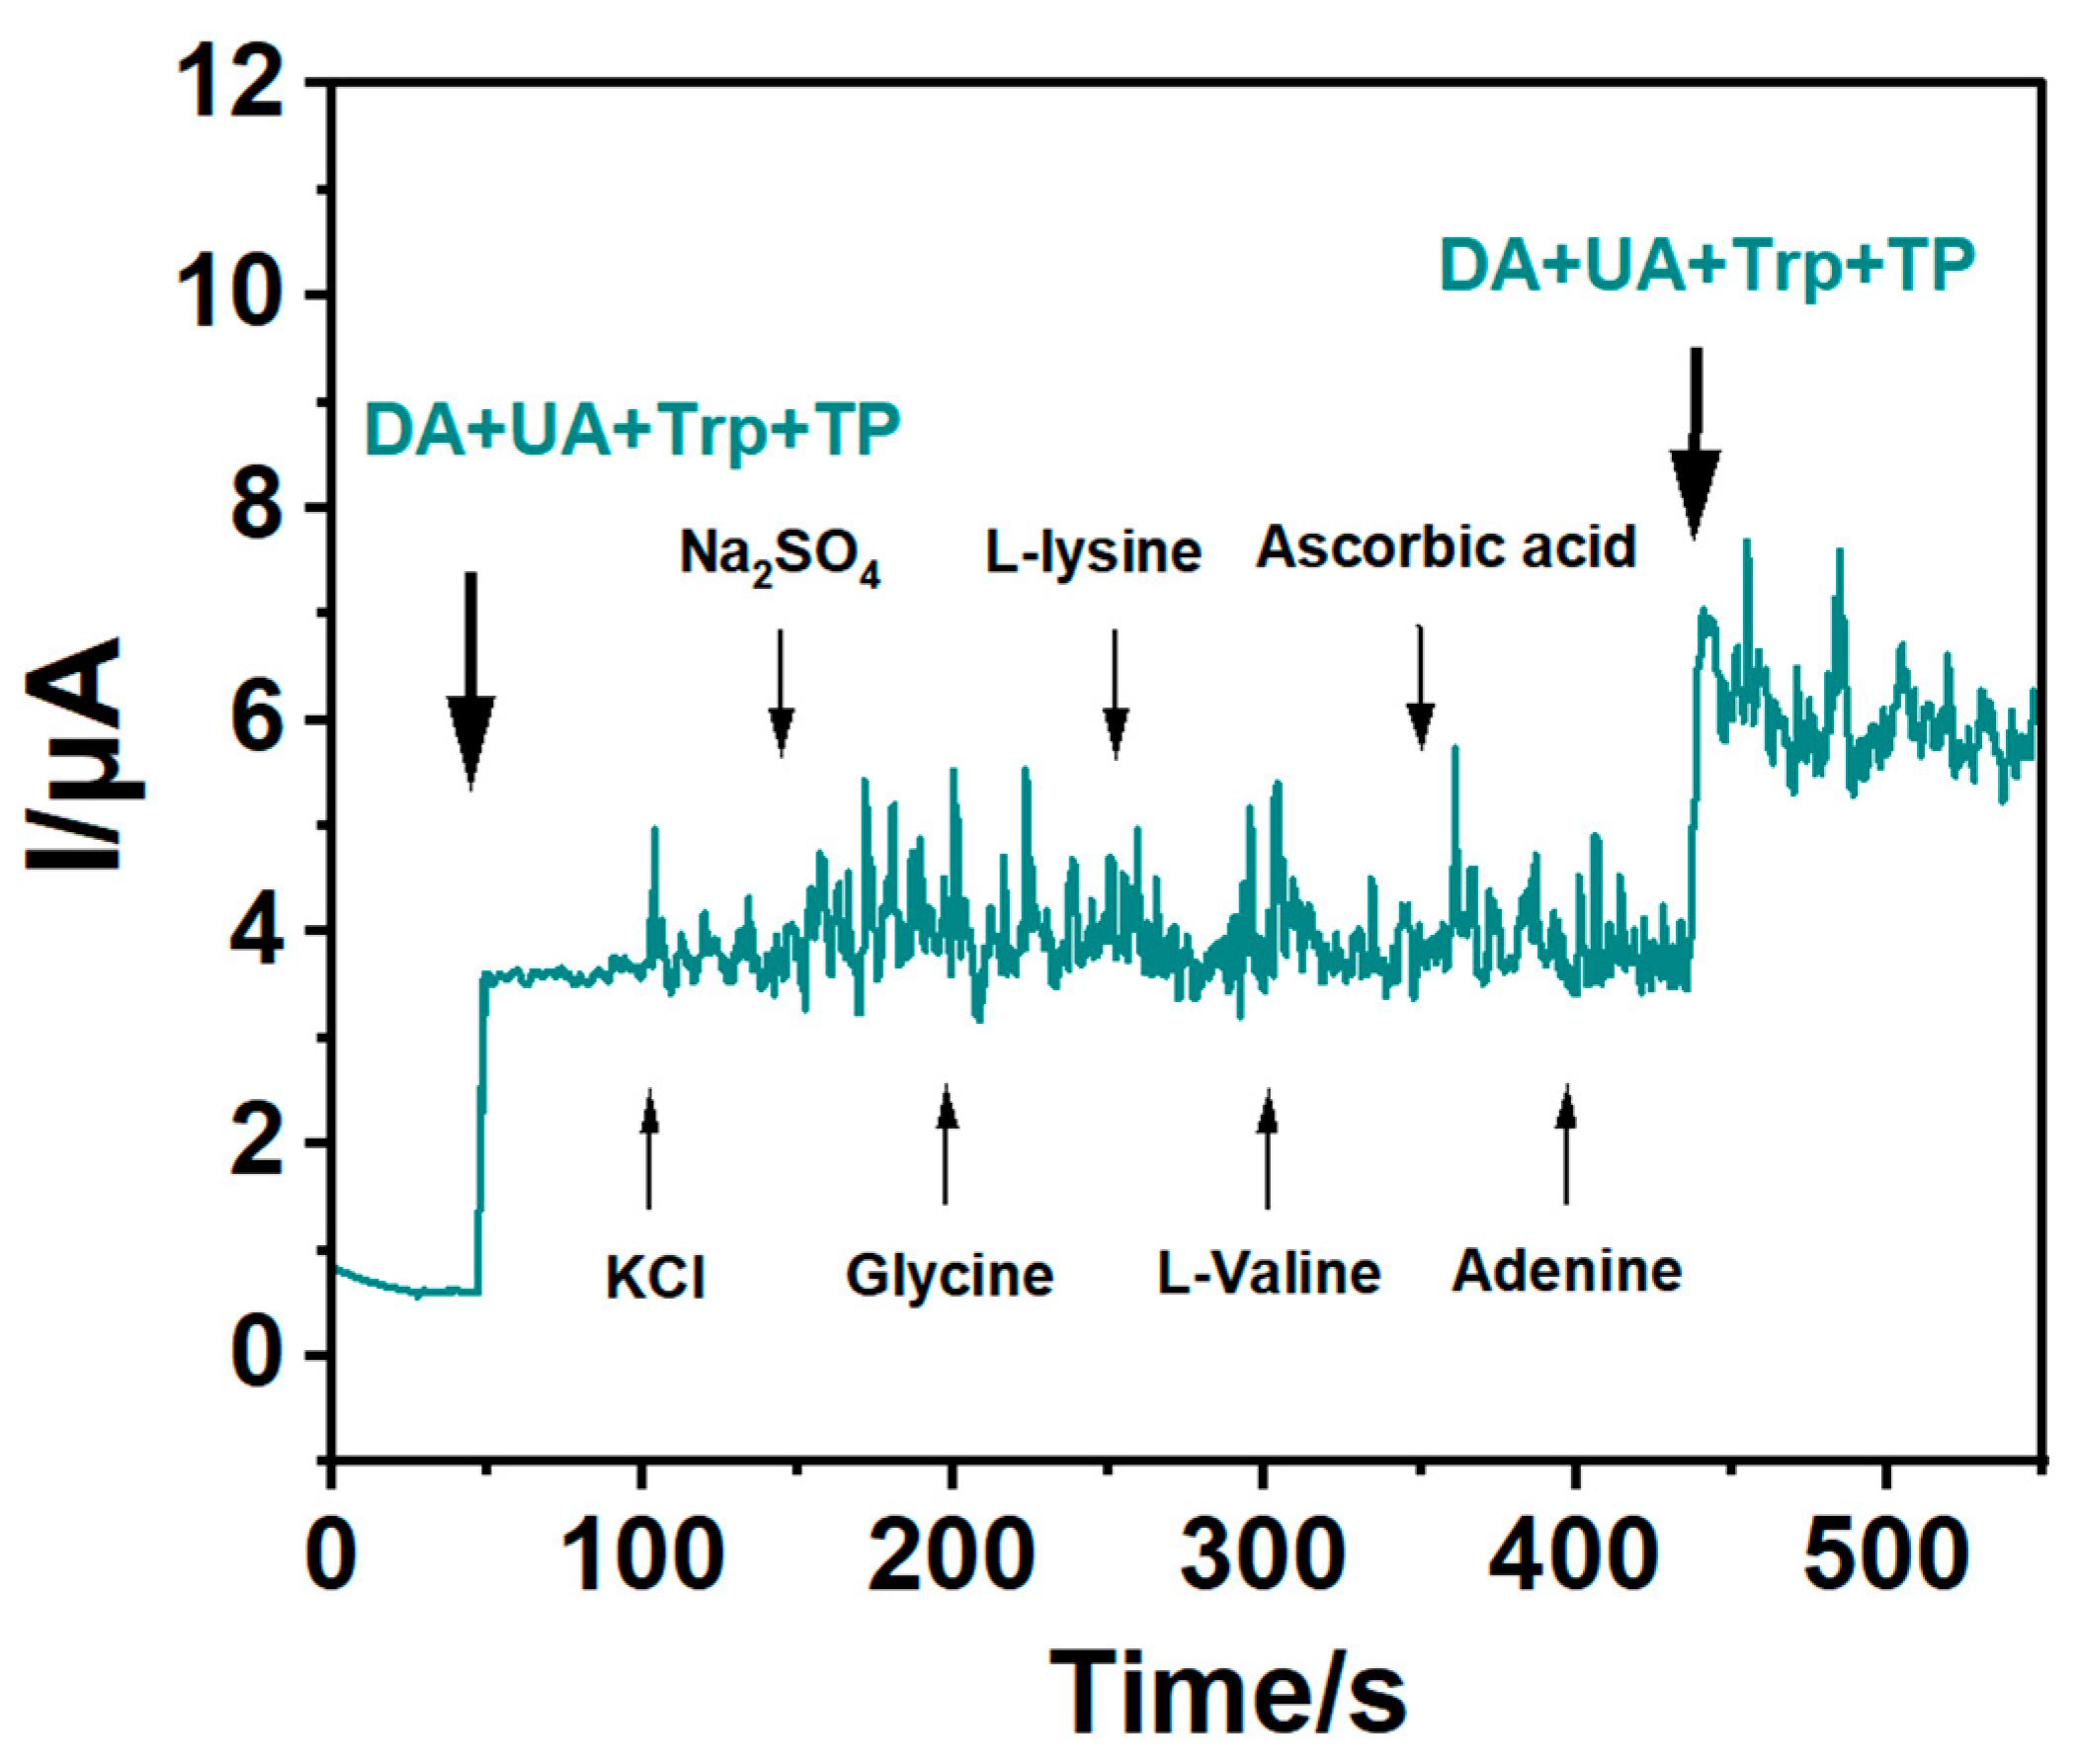
3.5. Interference Studies

To investigate the anti-interference ability of CNOs/GCE as a DA, UA, Trp and TP sensor, the amperometric responses of CNOs/GCE were continuously measured in a solution containing 5 μM DA, 20 μM UA, 20 μM Trp and 20 μM TP. Prepare a mixed solution in 0.1 M PBS at pH 7.0 containing potentially interfering species, including 50 mM Cl, SO42−, K+ and 100 mM Na+ inorganic ions, 5 mM glycine, L-lysine, L-valine, adenine and 50 μM ascorbic acid (Figure 9). It can be seen that the addition of the interfering substance did not cause a significant change in the current response to it. And this stable current signal was somewhat diminished during the experiment as the interfering substance solutions were continuously added to increase the overall solution volume, causing small decreases in DA, UA, Trp and TP concentrations. Nevertheless, upon re-addition of 5 μM DA, 20 μM UA, 20 μM Trp and 20 μM TP, the actual response was prominent. These results indicated that the CNOs/GCE has a certain degree of anti-interference ability in the detection system, which provides prospects for the potential application of CNOs/GCE in the field of non-enzymatic detection.

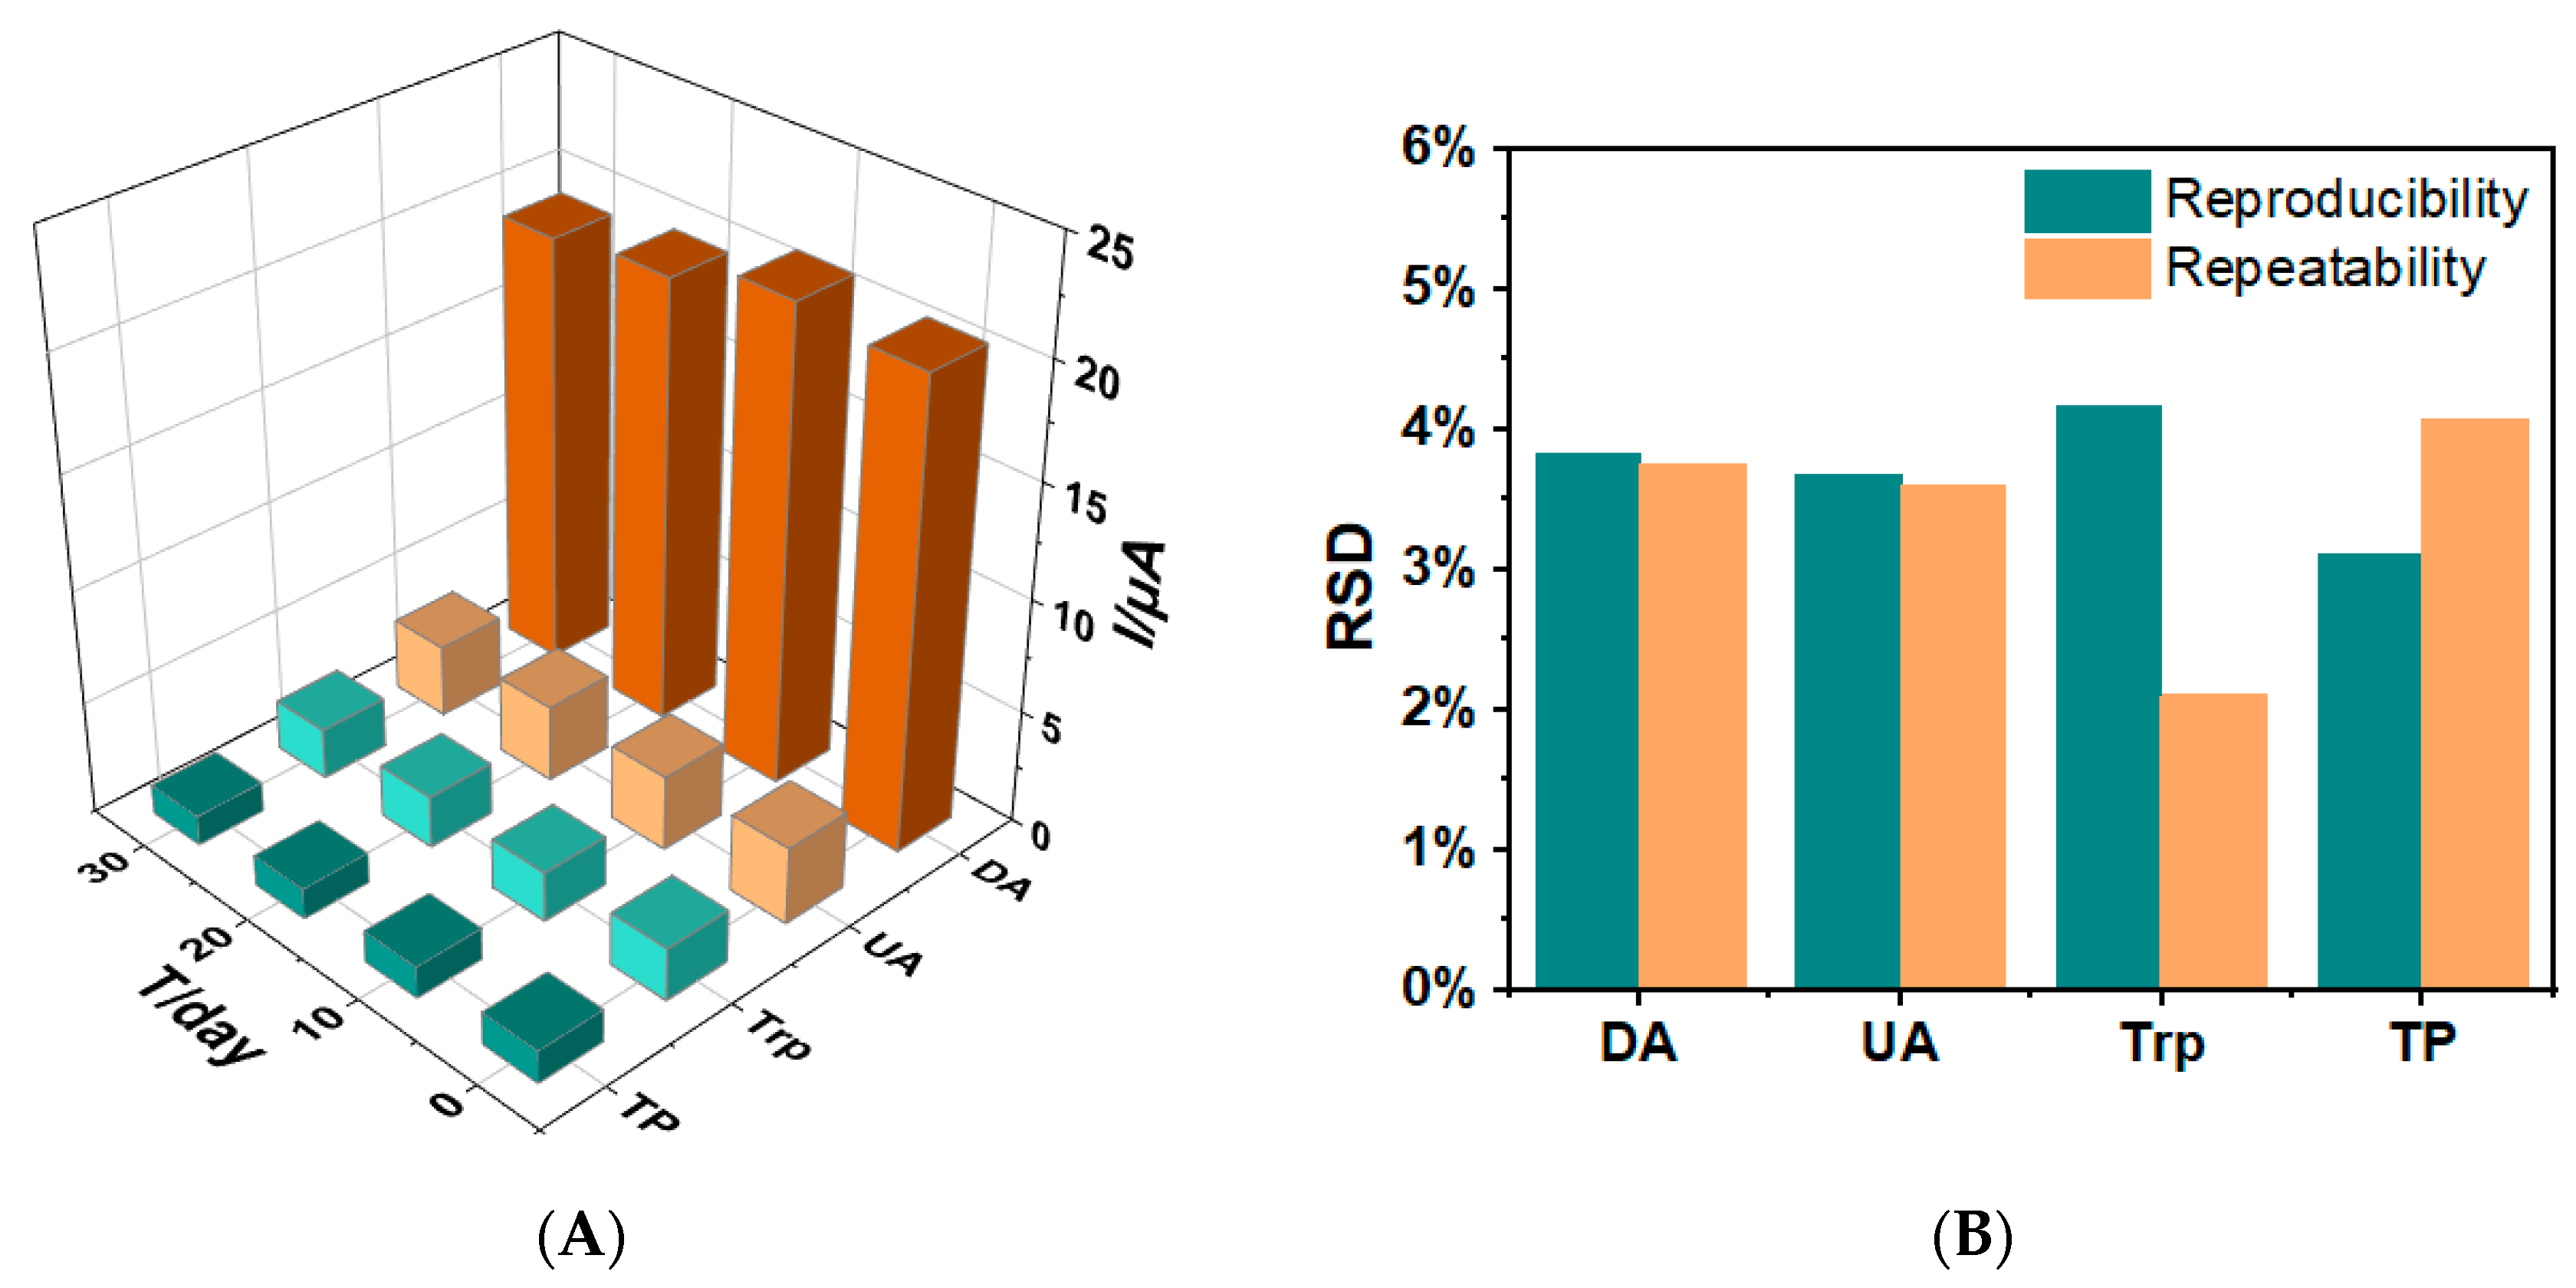
3.6. Reproducibility, Repeatability and Stability Studies

The stability of CNOs/GCE was assessed every 10 days in PBS solution (pH 7.0) containing 20 μM DA and 30 μM UA, Trp and TP (Figure 10). After 30 days, the current response of the modified electrode to DA, UA, Trp and TP was 91.56%, 95.84%, 93.91% and 93.24% of the initial values, respectively, with the placed electrode. The performance of the placed electrodes decreased but maintained the detection status, indicating that the electrodes have good stability.
Then, prepare 6 CNOs/GCEs by the same method and check the reproducibility in PBS (pH 7.0) containing 30 μM DA, UA, Trp and TP, respectively. The reproducibility relative standard deviations (RSD) of DA, UA, Trp and TP were 3.82%, 3.67%, 4.16% and 3.10%, respectively.
On the other hand, the same sensor was used for nine consecutive measurements at the same time. The RSDs of DA, UA, Trp and TP were 3.75%, 3.59%, 2.1% and 4.07%, respectively, with good reproducibility. Studies have shown that CNOs/GCE had good reproducibility, repeatability and stability in the simultaneous determination of DA, UA, Trp and TP.

3.7. Real Samples Analysis

The standard addition method was applied in the environment of human serum to further evaluate the effectiveness of CNOs/GCE for the detection of DA, UA, Trp and TP. Also, the DPV technology was used in the process. Before the measurement, dilute 1.0 mL of the original serum solution with 0.1 M PBS (pH 7.0) to 10.0 mL, and add the recoveries of various DA, UA, Trp and TP standard solutions into the blood sample solution (Table 2). The results showed that CNOs/GCE responded well to real samples of DA, UA, Trp and TP with satisfactory recoveries, confirming the good catalytic activity of CNOs/GCE for the clinical diagnosis of DA, UA, Trp and TP.

4. Conclusions

In this study, carbon nano-onions (CNOs) were fabricated via a stepwise multi-potential method and were dropped onto glassy carbon electrodes (GCEs) for immobilization. A novel simple and highly sensitive electrochemical biosensor was developed to simultaneously measure DA, UA, Trp and TP. The sensor has high sensitivity, low detection limit, good repeatability and good test stability. In addition, the CNOs/GCE sensor exhibits excellent anti-interference ability against a variety of common species and has potential applications in the determination of DA, UA, Trp and TP in human serum.

Author Contributions

Conceptualization, R.A.,T.M. and H.L.; methodology, R.A.; software, Z.L.; validation, R.A.; formal analysis, R.A.; investigation, R.A.; resources, R.A.; data curation, W.K. and Z.L.; writing—original draft preparation, R.A. and H.L.; writing—review and editing, R.A., T.M. and H.L.; visualization, R.A.; supervision, H.L.; project administration, R.A., T.M. and H.L.; funding acquisition, T.M. and H.L. All authors have read and agreed to the published version of the manuscript.

Funding

This study was supported by the National Natural Science Foundation of China (No.22073112).

Institutional Review Board Statement

Not applicable.

Informed Consent Statement

Not applicable.

Data Availability Statement

The data presented in this study are available on request from the corresponding author.

Conflicts of Interest

The authors declare no conflict of interest.

References

  1. Armstrong, M.; Okun, M. Diagnosis and Treatment of Parkinson Disease: A Review. JAMA 2020, 323, 548–560. [Google Scholar] [CrossRef] [PubMed]
  2. Dhanasekaran, T.; Padmanaban, A.; Gnanamoorthy, G.; Manigandan, R.; Kumar, S.P.; Stephen, A.; Narayanan, V. Recent Advances in Polymer Supporting Layered Double Hydroxides Nanocomposite for Electrochemical Biosensors. Mater. Res. Express 2018, 5, 014011. [Google Scholar] [CrossRef]
  3. Howes, O.D.; McCutcheon, R.; Owen, M.J.; Murray, R.M. The Role of Genes, Stress, and Dopamine in the Development of Schizophrenia. Biol. Psychiatry 2017, 81, 9–20. [Google Scholar] [CrossRef]
  4. Dutta, A.; Gautam, R.; Chatterjee, S.; Ariese, F.; Sikdar, S.K.; Umapathy, S. Ascorbate Protects Neurons against Oxidative Stress: A Raman Microspectroscopic Study. ACS Chem. Neurosci. 2015, 6, 1794–1801. [Google Scholar] [CrossRef] [PubMed]
  5. Wang, Q.-L.; Niu, C.; Chen, Q. Structure and component analysis of uratoma around joint. J. Reg. Anat. Oper. Surg. 2019, 28, 6–9. [Google Scholar]
  6. Shaidarova, L.G.; Chelnokova, I.A.; Il’ina, M.A.; Leksina, Y.A.; Budnikov, H.C. Amperometric Detection of Tryptophane and Pyridoxine on a Dual Screen-Printed Electrode Modified by Gold Nanoparticles in a Flow-Injection System. J. Anal. Chem. 2019, 74, 584–590. [Google Scholar] [CrossRef]
  7. Tajik, S.; Taher, M.A.; Beitollahi, H. Application of a New Ferrocene-Derivative Modified-Graphene Paste Electrode for Simultaneous Determination of Isoproterenol, Acetaminophen and Theophylline. Sens. Actuators B Chem. 2014, 197, 228–236. [Google Scholar] [CrossRef]
  8. Luo, X.; Chen, L.; Yang, J.; Li, S.; Li, M.; Mo, Q.; Li, Y.; Li, X. Electrochemically Simultaneous Detection of Ascorbic Acid, Sulfite and Oxalic Acid on Pt-Pd Nanoparticles/Chitosan/Nitrogen Doped Graphene Modified Glassy Carbon Electrode: A Method for Drug Quality Control. Microchem. J. 2021, 169, 106623. [Google Scholar] [CrossRef]
  9. Bettazzi, F.; Ingrosso, C.; Sfragano, P.S.; Pifferi, V.; Falciola, L.; Curri, M.L.; Palchetti, I. Gold Nanoparticles Modified Graphene Platforms for Highly Sensitive Electrochemical Detection of Vitamin C in Infant Food and Formulae. Food Chem. 2021, 344, 128692. [Google Scholar] [CrossRef]
  10. Huang, H.; Yue, Y.; Chen, Z.; Chen, Y.; Wu, S.; Liao, J.; Liu, S.; Wen, H. Electrochemical Sensor Based on a Nanocomposite Prepared from TmPO4 and Graphene Oxide for Simultaneous Voltammetric Detection of Ascorbic Acid, Dopamine and Uric Acid. Microchim. Acta 2019, 186, 189. [Google Scholar] [CrossRef]
  11. Taei, M.; Jamshidi, M.S. A Voltammetric Sensor for Simultaneous Determination of Ascorbic Acid, Noradrenaline, Acetaminophen and Tryptophan. Microchem. J. 2017, 130, 108–115. [Google Scholar] [CrossRef]
  12. Shi, L.; Wu, N.; Liu, W.; Yang, G.; Wang, Z. Electrochemical Determination of Ascorbic Acid, Dopamine and Uric Acid at Polyaniline-Graphene Nanocomposites Modified Electrode. Int. J. Electrochem. Sci. 2021, 16, 210556. [Google Scholar] [CrossRef]
  13. Peng, X.; Xie, Y.; Du, Y.; Song, Y.; Chen, S. Simultaneous Detection of Ascorbic Acid, Dopamine and Uric Acid Based on Vertical N-Doped Carbon Nanosheets/Three-Dimensional Porous Carbon. J. Electroanal. Chem. 2022, 904, 115850. [Google Scholar] [CrossRef]
  14. Jiang, Y.; Xiao, X.; Li, C.; Luo, Y.; Chen, S.; Shi, G.; Han, K.; Gu, H. Facile Ratiometric Electrochemical Sensor for In Vivo/Online Repetitive Measurements of Cerebral Ascorbic Acid in Brain Microdiaysate. Anal. Chem. 2020, 92, 3981–3989. [Google Scholar] [CrossRef] [PubMed]
  15. Jiang, J.; Ding, D.; Wang, J.; Lin, X.; Diao, G. Three-Dimensional Nitrogen-Doped Graphene-Based Metal-Free Electrochemical Sensors for Simultaneous Determination of Ascorbic Acid, Dopamine, Uric Acid, and Acetaminophen. Analyst 2021, 146, 964–970. [Google Scholar] [CrossRef] [PubMed]
  16. Zhang, H.; Liu, S. Electrochemical Sensors Based on Nitrogen-Doped Reduced Graphene Oxide for the Simultaneous Detection of Ascorbic Acid, Dopamine and Uric Acid. J. Alloys Compd. 2020, 842, 155873. [Google Scholar] [CrossRef]
  17. Yang, L.; Huang, N.; Lu, Q.; Liu, M.; Li, H.; Zhang, Y.; Yao, S. A Quadruplet Electrochemical Platform for Ultrasensitive and Simultaneous Detection of Ascorbic Acid, Dopamine, Uric Acid and Acetaminophen Based on a Ferrocene Derivative Functional Au NPs/Carbon Dots Nanocomposite and Graphene. Anal. Chim. Acta 2016, 903, 69–80. [Google Scholar] [CrossRef]
  18. Chen, J.; He, P.; Bai, H.; He, S.; Zhang, T.; Zhang, X.; Dong, F. Poly(β-Cyclodextrin)/Carbon Quantum Dots Modified Glassy Carbon Electrode: Preparation, Characterization and Simultaneous Electrochemical Determination of Dopamine, Uric Acid and Tryptophan. Sens. Actuators B Chem. 2017, 252, 9–16. [Google Scholar] [CrossRef]
  19. Sun, L.; Li, H.; Li, M.; Li, P.; Li, C.; Yang, B. Simultaneous Determination of Small Biomolecules and Nitrite Using an Au/TiO2 /Carbon Nanotube Composite-Modified Electrode. J. Electrochem. Soc. 2016, 163, B567–B572. [Google Scholar] [CrossRef]
  20. Priyatharshni, S.; Tamilselvan, A.; Viswanathan, C.; Ponpandian, N. LaCoO3 Nanostructures Modified Glassy Carbon Electrode for Simultaneous Electrochemical Detection of Dopamine, Ascorbic Acid and Uric Acid. J. Electrochem. Soc. 2017, 164, B152. [Google Scholar] [CrossRef]
  21. Wang, Z.; An, R.; Dai, Y.; Luo, H. A Simple Strategy for the Simultaneous Determination of Dopamine, Uric Acid, L-Tryptophan and Theophylline Based on a Carbon Dots Modified Electrode. Int. J. Electrochem. Sci. 2021, 16, 210450. [Google Scholar] [CrossRef]
  22. Ferlazzo, A.; Espro, C.; Iannazzo, D.; Neri, G. Determination of Phenylalanine by a Novel Enzymatic PHD/SPE Biosensor. IEEE Trans. Instrum. Meas. 2023, 72, 1–8. [Google Scholar] [CrossRef]
  23. Gan, A.W.; Seah, G.E.K.K.; Kwek, L.H.; Goh, S.S. Ion Transfer Voltammetry of Amino Acids with an All-solid-state Ion-selective Electrode for Non-destructive Phenylalanine Sensing. Electroanalysis 2023, 35, e202200501. [Google Scholar] [CrossRef]
  24. Ferlazzo, A.; Espro, C.; Iannazzo, D.; Bonavita, A.; Neri, G. Yttria-Zirconia Electrochemical Sensor for the Detection of Tyrosine. Mater. Today Commun. 2023, 35, 106036. [Google Scholar] [CrossRef]
  25. Xu, Z.; Qiao, X.; Tao, R.; Li, Y.; Zhao, S.; Cai, Y.; Luo, X. A Wearable Sensor Based on Multifunctional Conductive Hydrogel for Simultaneous Accurate PH and Tyrosine Monitoring in Sweat. Biosens. Bioelectron. 2023, 234, 115360. [Google Scholar] [CrossRef]
  26. Zhang, L.; Li, C.; Li, F.; Li, S.; Ma, H.; Gu, F. A Sensing Platform Based on Cu-MOF Encapsulated Dawson-Type Polyoxometalate Crystal Material for Electrochemical Detection of Xanthine. Microchim. Acta 2023, 190, 24. [Google Scholar] [CrossRef]
  27. Kodakat, K.; Girish Kumar, K. Fabrication of a Selective and Sensitive Electro-Synthesized Molecularly Imprinted Polymer-Based Electrochemical Sensor for the Determination of Xanthine. J. Appl. Electrochem. 2023. [Google Scholar] [CrossRef]
  28. Xu, Q.-Q.; Luo, L.; Liu, Z.-G.; Guo, Z.; Huang, X.-J. Highly Sensitive and Selective Serotonin (5-HT) Electrochemical Sensor Based on Ultrafine Fe3O4 Nanoparticles Anchored on Carbon Spheres. Biosens. Bioelectron. 2023, 222, 114990. [Google Scholar] [CrossRef]
  29. Han, J.; Stine, J.M.; Chapin, A.A.; Ghodssi, R. A Portable Electrochemical Sensing Platform for Serotonin Detection Based on Surface-Modified Carbon Fiber Microelectrodes. Anal. Methods 2023, 15, 1096–1104. [Google Scholar] [CrossRef]
  30. Mykhailiv, O.; Zubyk, H.; Plonska-Brzezinska, M.E. Carbon Nano-Onions: Unique Carbon Nanostructures with Fascinating Properties and Their Potential Applications. Inorganica Chim. Acta 2017, 468, 49–66. [Google Scholar] [CrossRef]
  31. Sun, W.; Zhang, X.; Jia, H.; Zhu, Y.; Guo, Y.; Gao, G.; Li, Y.; Wu, F. Water-Dispersible Candle Soot–Derived Carbon Nano-Onion Clusters for Imaging-Guided Photothermal Cancer Therapy. Small 2019, 15, 1804575. [Google Scholar] [CrossRef] [PubMed]
  32. Bobrowska, D.M.; Castro, E.; Echegoyen, L.; Plonska-Brzezinska, M.E. Carbon Nano-Onion and Zinc Oxide Composites as an Electron Transport Layer in Inverted Organic Solar Cells. ChemNanoMat 2020, 6, 248–257. [Google Scholar] [CrossRef]
  33. Yan, X.; Duan, P.; Zhang, F.; Li, H.; Zhang, H.; Zhao, M.; Zhang, X.; Xu, B.; Pennycook, S.J.; Guo, J. Stable Single-Atom Platinum Catalyst Trapped in Carbon Onion Graphitic Shells for Improved Chemoselective Hydrogenation of Nitroarenes. Carbon 2019, 143, 378–384. [Google Scholar] [CrossRef]
  34. Yang, J.; Zhang, Y.; Kim, D.Y. Electrochemical Sensing Performance of Nanodiamond-Derived Carbon Nano-Onions: Comparison with Multiwalled Carbon Nanotubes, Graphite Nanoflakes, and Glassy Carbon. Carbon 2016, 98, 74–82. [Google Scholar] [CrossRef]
  35. Borgohain, R.; Yang, J.; Selegue, J.P.; Kim, D.Y. Controlled Synthesis, Efficient Purification, and Electrochemical Characterization of Arc-Discharge Carbon Nano-Onions. Carbon 2014, 66, 272–284. [Google Scholar] [CrossRef]
  36. Ozoemena, O.C.; Shai, L.J.; Maphumulo, T.; Ozoemena, K.I. Electrochemical Sensing of Dopamine Using Onion-like Carbons and Their Carbon Nanofiber Composites. Electrocatalysis 2019, 10, 381–391. [Google Scholar] [CrossRef]
  37. Breczko, J.; Plonska-Brzezinska, M.E.; Echegoyen, L. Electrochemical Oxidation and Determination of Dopamine in the Presence of Uric and Ascorbic Acids Using a Carbon Nano-Onion and Poly(Diallyldimethylammonium Chloride) Composite. Electrochim. Acta 2012, 72, 61–67. [Google Scholar] [CrossRef]
  38. Bian, Y.; Liu, L.; Liu, D.; Zhu, Z.; Shao, Y.; Li, M. Electrochemical Synthesis of Carbon Nano Onions. Inorg. Chem. Front. 2020, 7, 4404–4411. [Google Scholar] [CrossRef]
  39. Choucair, M.; Stride, J.A. The Gram-Scale Synthesis of Carbon Onions. Carbon 2012, 50, 1109–1115. [Google Scholar] [CrossRef]
  40. Kroto, H.W. Carbon Onions Introduce New Flavour to Fullerene Studies. Nature 1992, 359, 670–671. [Google Scholar] [CrossRef]
  41. Tang, H.; Yuan, X.; Yu, P.; Hu, Q.; Wang, M.; Yao, Y.; Wu, L.; Zou, Q.; Ke, Y.; Zhao, Y.; et al. Revealing the Formation Mechanism of Ultrahard Nanotwinned Diamond from Onion Carbon. Carbon 2018, 129, 159–167. [Google Scholar] [CrossRef]
  42. Dickinson, E.J.F.; Streeter, I.; Compton, R.G. Theory of Chronoamperometry at Cylindrical Microelectrodes and Their Arrays. J. Phys. Chem. C 2008, 112, 11637–11644. [Google Scholar] [CrossRef]
  43. Sun, Y.-P.; Zhou, B.; Lin, Y.; Wang, W.; Fernando, K.A.S.; Pathak, P.; Meziani, M.J.; Harruff, B.A.; Wang, X.; Wang, H.; et al. Quantum-Sized Carbon Dots for Bright and Colorful Photoluminescence. J. Am. Chem. Soc. 2006, 128, 7756–7757. [Google Scholar] [CrossRef] [PubMed]
  44. Noor, A.M.; Shahid, M.M.; Rameshkumar, P.; Huang, N.M. A Glassy Carbon Electrode Modified with Graphene Oxide and Silver Nanoparticles for Amperometric Determination of Hydrogen Peroxide. Microchim. Acta 2016, 183, 911–916. [Google Scholar] [CrossRef]
  45. Bolzán, A.E. Electrodeposition of Copper on Glassy Carbon Electrodes in the Presence of Picolinic Acid. Electrochim. Acta 2013, 113, 706–718. [Google Scholar] [CrossRef]
  46. Jiang, G.; Jiang, T.; Zhou, H.; Yao, J.; Kong, X. Preparation of N-Doped Carbon Quantum Dots for Highly Sensitive Detection of Dopamine by an Electrochemical Method. RSC Adv. 2015, 5, 9064–9068. [Google Scholar] [CrossRef]
  47. Arroquia, A.; Acosta, I.; Armada, M.P.G. Self-Assembled Gold Decorated Polydopamine Nanospheres as Electrochemical Sensor for Simultaneous Determination of Ascorbic Acid, Dopamine, Uric Acid and Tryptophan. Mater. Sci. Eng. C 2020, 109, 110602. [Google Scholar] [CrossRef]
  48. Yao, W.; Guo, H.; Liu, H.; Li, Q.; Wu, N.; Li, L.; Wang, M.; Fan, T.; Yang, W. Highly Electrochemical Performance of Ni-ZIF-8/ N S-CNTs/CS Composite for Simultaneous Determination of Dopamine, Uric Acid and L-Tryptophan. Microchem. J. 2020, 152, 104357. [Google Scholar] [CrossRef]
  49. Yang, Y.J.; Guo, L.; Zhang, W. The Electropolymerization of CTAB on Glassy Carbon Electrode for Simultaneous Determination of Dopamine, Uric Acid, Tryptophan and Theophylline. J. Electroanal. Chem. 2016, 768, 102–109. [Google Scholar] [CrossRef]
  50. Jesny, S.; Girish Kumar, K. Non-Enzymatic Electrochemical Sensor for the Simultaneous Determination of Xanthine, Its Methyl Derivatives Theophylline and Caffeine as Well as Its Metabolite Uric Acid. Electroanalysis 2017, 29, 1828–1837. [Google Scholar] [CrossRef]
  51. Gao, Y.; Wang, H.; Guo, L. Simultaneous Determination of Theophylline and Caffeine by Large Mesoporous Carbon/Nafion Modified Electrode. J. Electroanal. Chem. 2013, 706, 7–12. [Google Scholar] [CrossRef]
  52. Guo, H.; Wang, M.; Zhao, L.; Youliwasi, N.; Liu, C. The Effect of Co and N of Porous Carbon-Based Materials Fabricated via Sacrificial Templates MOFs on Improving DA and UA Electrochemical Detection. Microporous Mesoporous Mater. 2018, 263, 21–27. [Google Scholar] [CrossRef]
  53. Ghanbari, M.H.; Norouzi, Z.; Etzold, B.J.M. Increasing Sensitivity and Selectivity for Electrochemical Sensing of Uric Acid and Theophylline in Real Blood Serum through Multinary Nanocomposites. Microchem. J. 2023, 191, 108836. [Google Scholar] [CrossRef]
  54. Wang, J.; Cheng, W.; Meng, F.; Yang, M.; Pan, Y.; Miao, P. Hand-in-Hand RNA Nanowire-Based Aptasensor for the Detection of Theophylline. Biosens. Bioelectron. 2018, 101, 153–158. [Google Scholar] [CrossRef] [PubMed]
  55. Setoudeh, N.; Jahani, S.; Kazemipour, M.; Foroughi, M.M.; Hassani Nadiki, H. Zeolitic Imidazolate Frameworks and Cobalt-Tannic Acid Nanocomposite Modified Carbon Paste Electrode for Simultaneous Determination of Dopamine, Uric Acid, Acetaminophen and Tryptophan: Investigation of Kinetic Parameters of Surface Electrode and Its Analytical Performance. J. Electroanal. Chem. 2020, 863, 114045. [Google Scholar] [CrossRef]
  56. Zhu, D.; Bai, X.; Zhang, P.; Li, X. An Electrochemical Sensor Based on Boron/Nitrogen Co-Doped Honeycomb-like Porous Carbon Encapsulation Molybdenum Trioxides for the Simultaneous Detection of Xanthine, Uric Acid and Dopamine. Colloids Surf. A Physicochem. Eng. Asp. 2022, 655, 130304. [Google Scholar] [CrossRef]
  57. Mounesh; Malathesh, P.; Praveen Kumara, N.Y.; Jilani, B.S.; Mruthyunjayachari, C.D.; Venugopala Reddy, K.R. Synthesis and Characterization of Tetra-Ganciclovir Cobalt (II) Phthalocyanine for Electroanalytical Applications of AA/DA/UA. Heliyon 2019, 5, e01946. [Google Scholar] [CrossRef]
  58. Mohiuddin, A.K.; Yasmin, S.; Jeon, S. CoxNi1−x Double Hydroxide Decorated Graphene NPs for Simultaneous Determination of Dopamine and Uric Acid. Sens. Actuators A Phys. 2023, 355, 114314. [Google Scholar] [CrossRef]
Figure 1. Schematic diagram of the modification and analysis procedure of CNOs/GCE for the simultaneous determination of DA, UA, Trp and TP.
Processes 11 02547 g001
Figure 2. (A,B) TEM images of CNOs; (C) the XRD of the CNOs; (D) the Raman shift of the CNOs.
Processes 11 02547 g002
Figure 3. (A) Nyquist plots of CNOs/GCE and GCE at 0.1 mM [Fe(CN)6]3−/4− in 0.1 M KCl; (B) CV obtained at the CNOs/GCE and GCE at 0.1 mM [Fe(CN)6]3− in 0.1 M KCl.
Processes 11 02547 g003
Figure 4. DPV was obtained at GCE and CNOs/GCE in 0.1 M PBS (pH 7.0) of 10 μM DA, 20 μM UA, 20 μM Trp and 20 μM TP. Scan rate: 50 mV/s.
Processes 11 02547 g004
Figure 5. DPVs of 10 μM DA (A), 40 μM UA (B), 40 μM Trp (C) and 40 μM TP (D) on CNOs/GCE in PBS with different pH values (3.0–8.0), Scan rate: 100 mV/s; Insets: The linear relationships of PH and peak potential at CNOs/GCE of DA, UA, Trp and TP.
Processes 11 02547 g005
Figure 6. Effects of pH values on peak current (A) and peak potential (B) of 10 μM/L DA, 20 μM/L UA, 20 μM/L Trp and 20 μM/L TP on CNOs/GCE.
Processes 11 02547 g006
Figure 7. CVs of 10 μM DA (A), 40 μM UA (B), 40 μM Trp (C) and 40 μM TP (D) on CNOs/GCE in PBS (pH 7.0) at different scan rates (50–500 mV/s); Insets: the linear relationships of v1/2 (mV/s) vs. Ipa (μA) for DA, UA, Trp and TP on CNOs/GCE.
Processes 11 02547 g007
Figure 8. DPV under CNOs/GCE in 0.1 M PBS (pH 7.0) containing (A) 20 μM UA, 20 μM Trp and 20 μM TP and different concentrations of DA (0.01 μM–38.16 μM); (B) 10 μM DA, 20 μM Trp and 20 μM TP in 0.1 M PBS (pH 7.0) and different concentrations of UA (0.06 μM–68.16 μM) in DPV under CNOs/GCE; (C) 10 μM DA, 20 μM UA and 20 μM TP in 0.1 M PBS (pH 7.0) and different concentrations of Trp (1.00 μM–108.25 μM) in DPV under CNOs/GCE; (D) 10 μM DA, 20 μM UA and 20 μM Trp in 0.1 M PBS (pH 7.0) and different concentrations of TP (8.16 μM–108.25 μM) at DPV under CNOs/GCE. Insets: the calibration plots of DA, UA, Trp and TP peak currents versus concentration, respectively.
Processes 11 02547 g008
Figure 9. Interference test of CNOs/GCE in 0.1M PBS (pH 7.0) solution in the working potential of 0.81 V with 5 μM DA, 20 μM UA, 20 μM Trp, 20 μM TP and other interfering substances (50 mM Cl, SO42−, K+ and 100 mM Na+ inorganic ions, 5 mM glycine (Gly), L-lysine (L-Lys), L-valine (L-val), adenine and 50 μM ascorbic acid (AA)).
Processes 11 02547 g009
Figure 10. (A) Electrochemical responses of CNOs/GCE to 20 μM DA, 30 μM UA, Trp and TP every ten days. (B) RSD data for reproducibility and repeatability of CNOs/GCE for 30 μM DA, UA, Trp and TP.
Processes 11 02547 g010
Table 1. Comparison of the CNOs/GCE sensor with other modified electrodes for the determination of DA, UA, Trp and TP.
BiosensorsLinear Range (μM)Detection Limit (μM)Ref.
DAUATrpTPDAUATrpTP
(Au-PDNs)/GCE1–160
160–350
1–120
120–350
1.0–160
160–280
\0.00010.00010.0001\[47]
Ni-ZIF-8/N S-CNTs/CS/GCE8–500 1–6001–600\0.930.410.69\[48]
poly(CTAB)/GCE0.5–10001–10001–10000.5–10000.110.330.440.11[49]
pPABSA/GCE\\\0.9–100\\\7.02[50]
β-CD/CQDs/GCE4–2200.3–2005–270\0.140.010.16\[18]
LMC/Nafion/GCE\\\0.8–180.0\\\0.37[51]
CDs/GCE0.5–503–28.5
28.5–75
1–6510–2000.0070.0110.110.33[21]
Nitrogen-doped graphene/GCE0.5–1700.1–20\\0.250.045\\[13]
NCCNPs/GCE0.002–0.06950.005–0.192\\0.340.98\\[52]
1,4-BBFT/ Carbon paste\\\0.06–700\\\0.012[7]
PAMT/AuNPs/TiO2@CuO-B/RGO/GCE\0.0005–10\0.001–10\0.00018\0.00036[53]
Hand-in-hand RNA nanowire\\\0.5–70\\\0.05[54]
ZIF-8@CoTA/CPE0.02–0.440.02–0.440.02–0.44\0.00120.00670.0051\[55]
MoO3@B/N-PC0.079–104.10.086–102.5\\0.0690.078\\[56]
CoTGPc/GCE2–102–10\\0.030.1\\[57]
CoxNi1−x(OH)2/G0.1–7500.25–925\\0.0430.097\\[58]
CNOs/GCE0.01–38.160.06–68.161.00–108.255.16–108.250.00390.00870.180.35This work
Table 2. Testing data of human serum.
SampleSerum (μM)Added (μM)Founded (μM)Recovery (%)
DAUATrpTPDAUATrpTPDAUATrpTPDAUATrpTP
1010.932.5903.5206353.3129.78.0533.6194.5796.0293.7196.03
2012.813.2404.52512554.2735.8114.5254.9894.8994.7195.2899.96
3010.661.1305.53018755.3338.7418.4774.1996.9195.2896.5598.92
Disclaimer/Publisher’s Note: The statements, opinions and data contained in all publications are solely those of the individual author(s) and contributor(s) and not of MDPI and/or the editor(s). MDPI and/or the editor(s) disclaim responsibility for any injury to people or property resulting from any ideas, methods, instructions or products referred to in the content.

