
A Numerical Simulation Study into the Effect of Longitudinal and Transverse Pitch on Deposition of Zhundong Coal Ash on Tube Bundles
Abstract
:1. Introduction
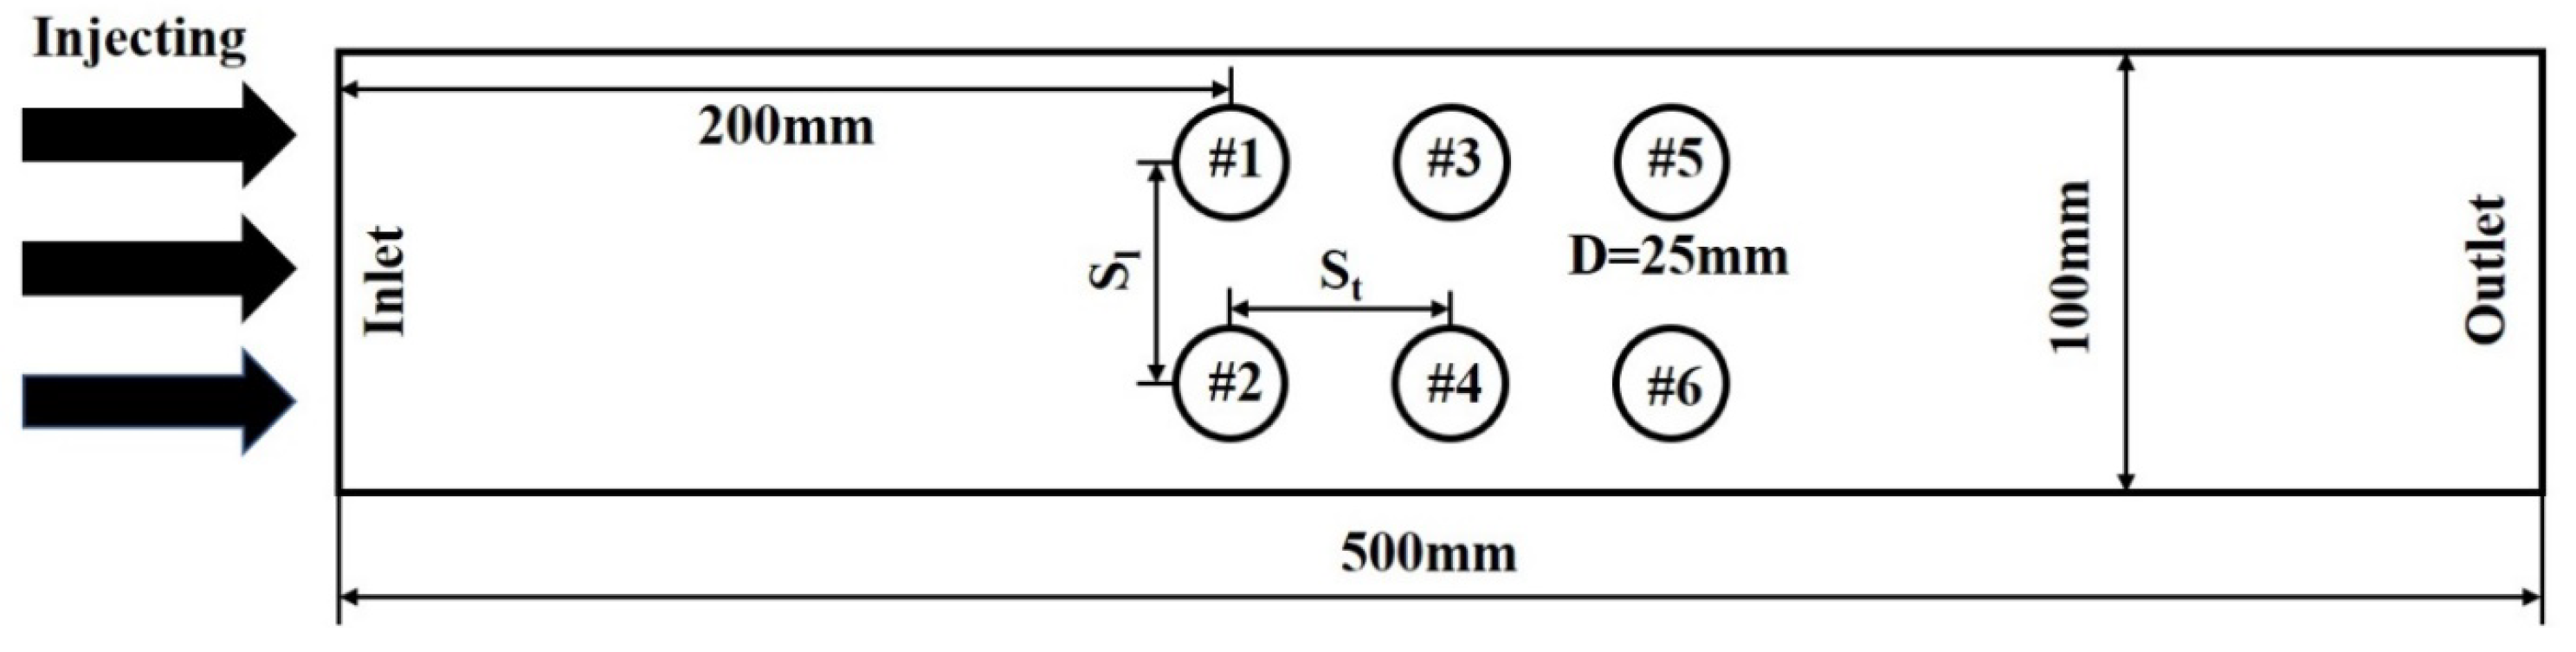
2. Physical Models
3. Deposition Models and Mathematic Solutions
3.1. Discrete Phase Model
3.2. Deposition Model
3.3. Dynamic Mesh
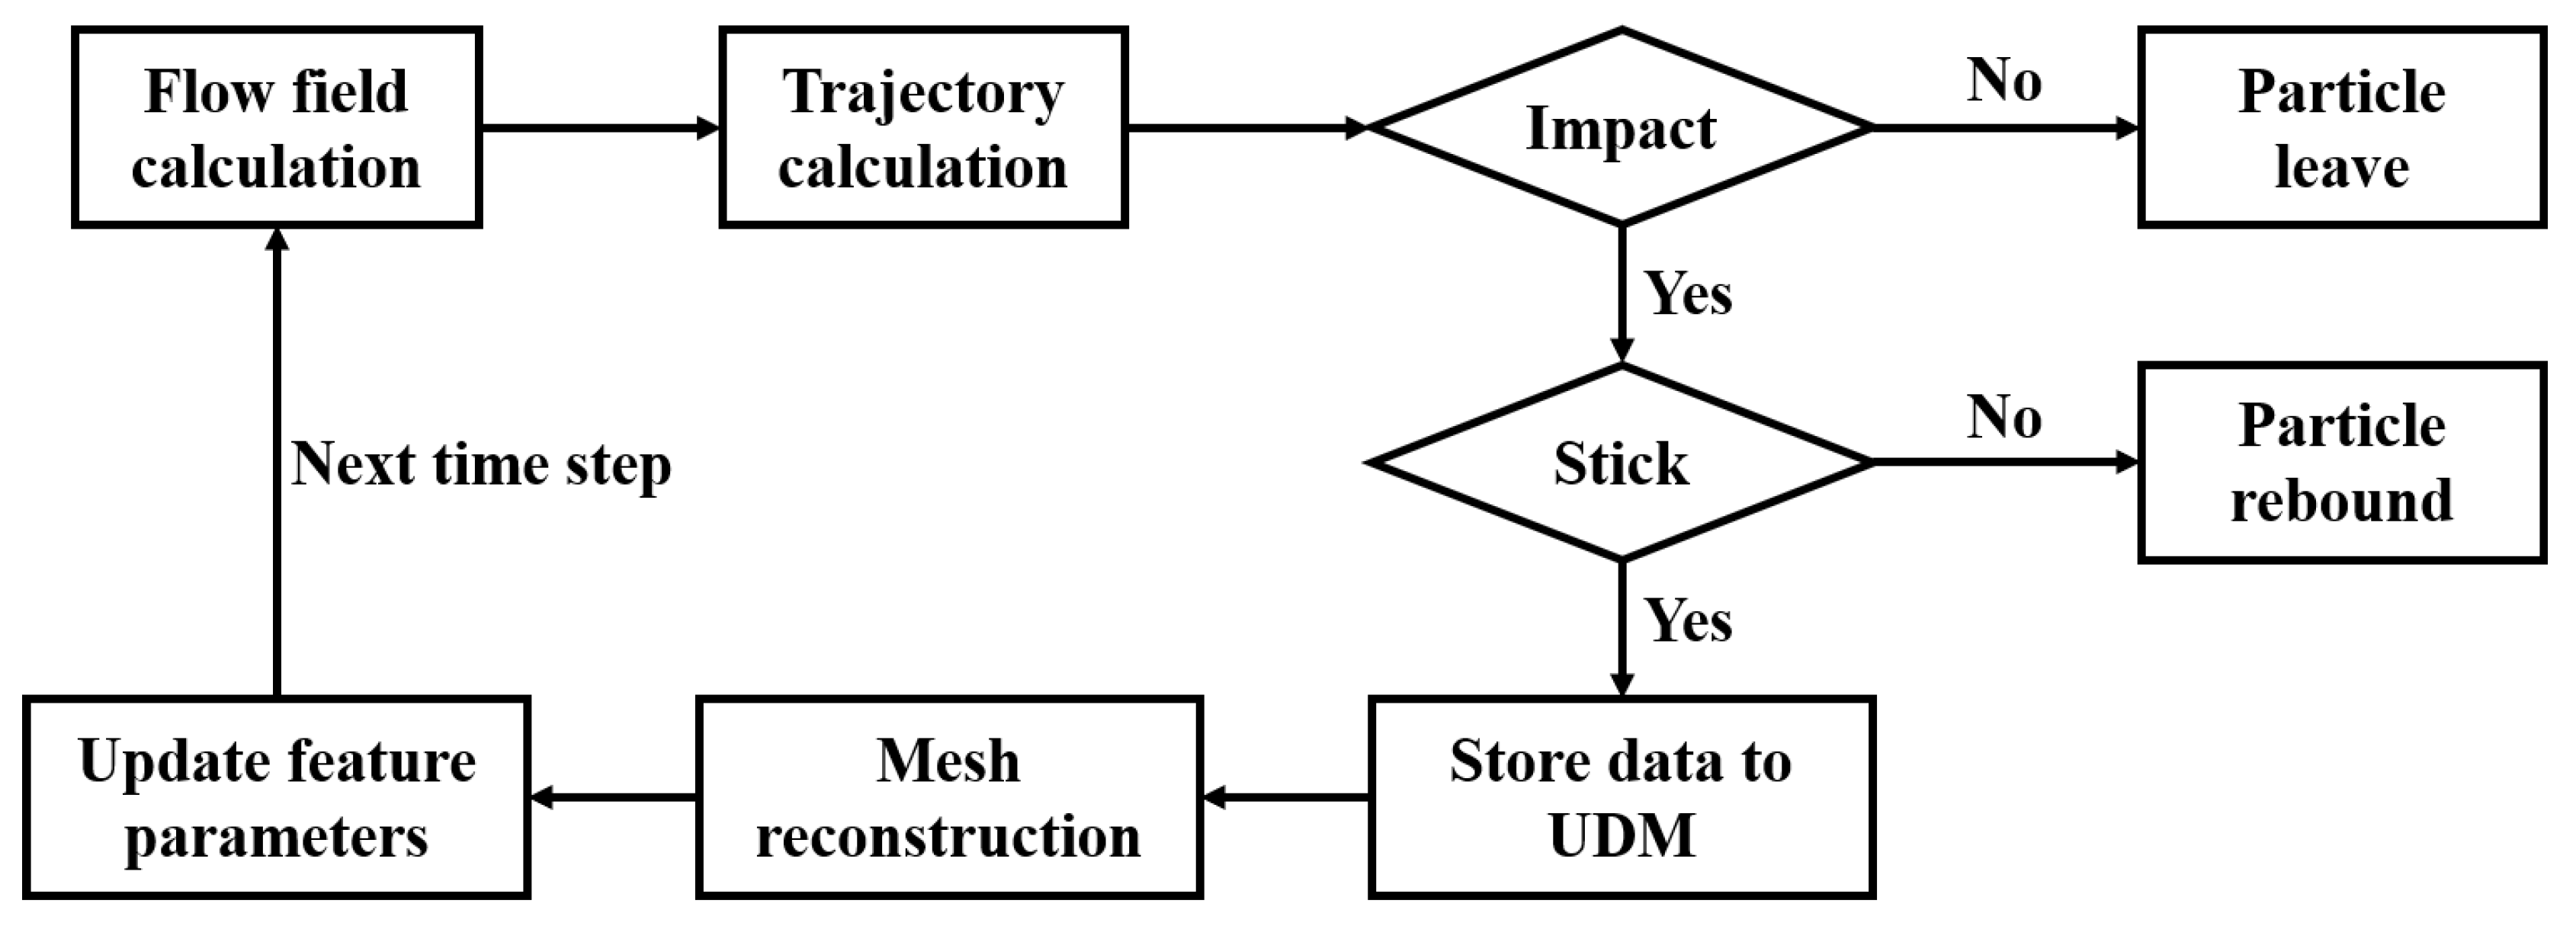
3.4. Solution Procedure
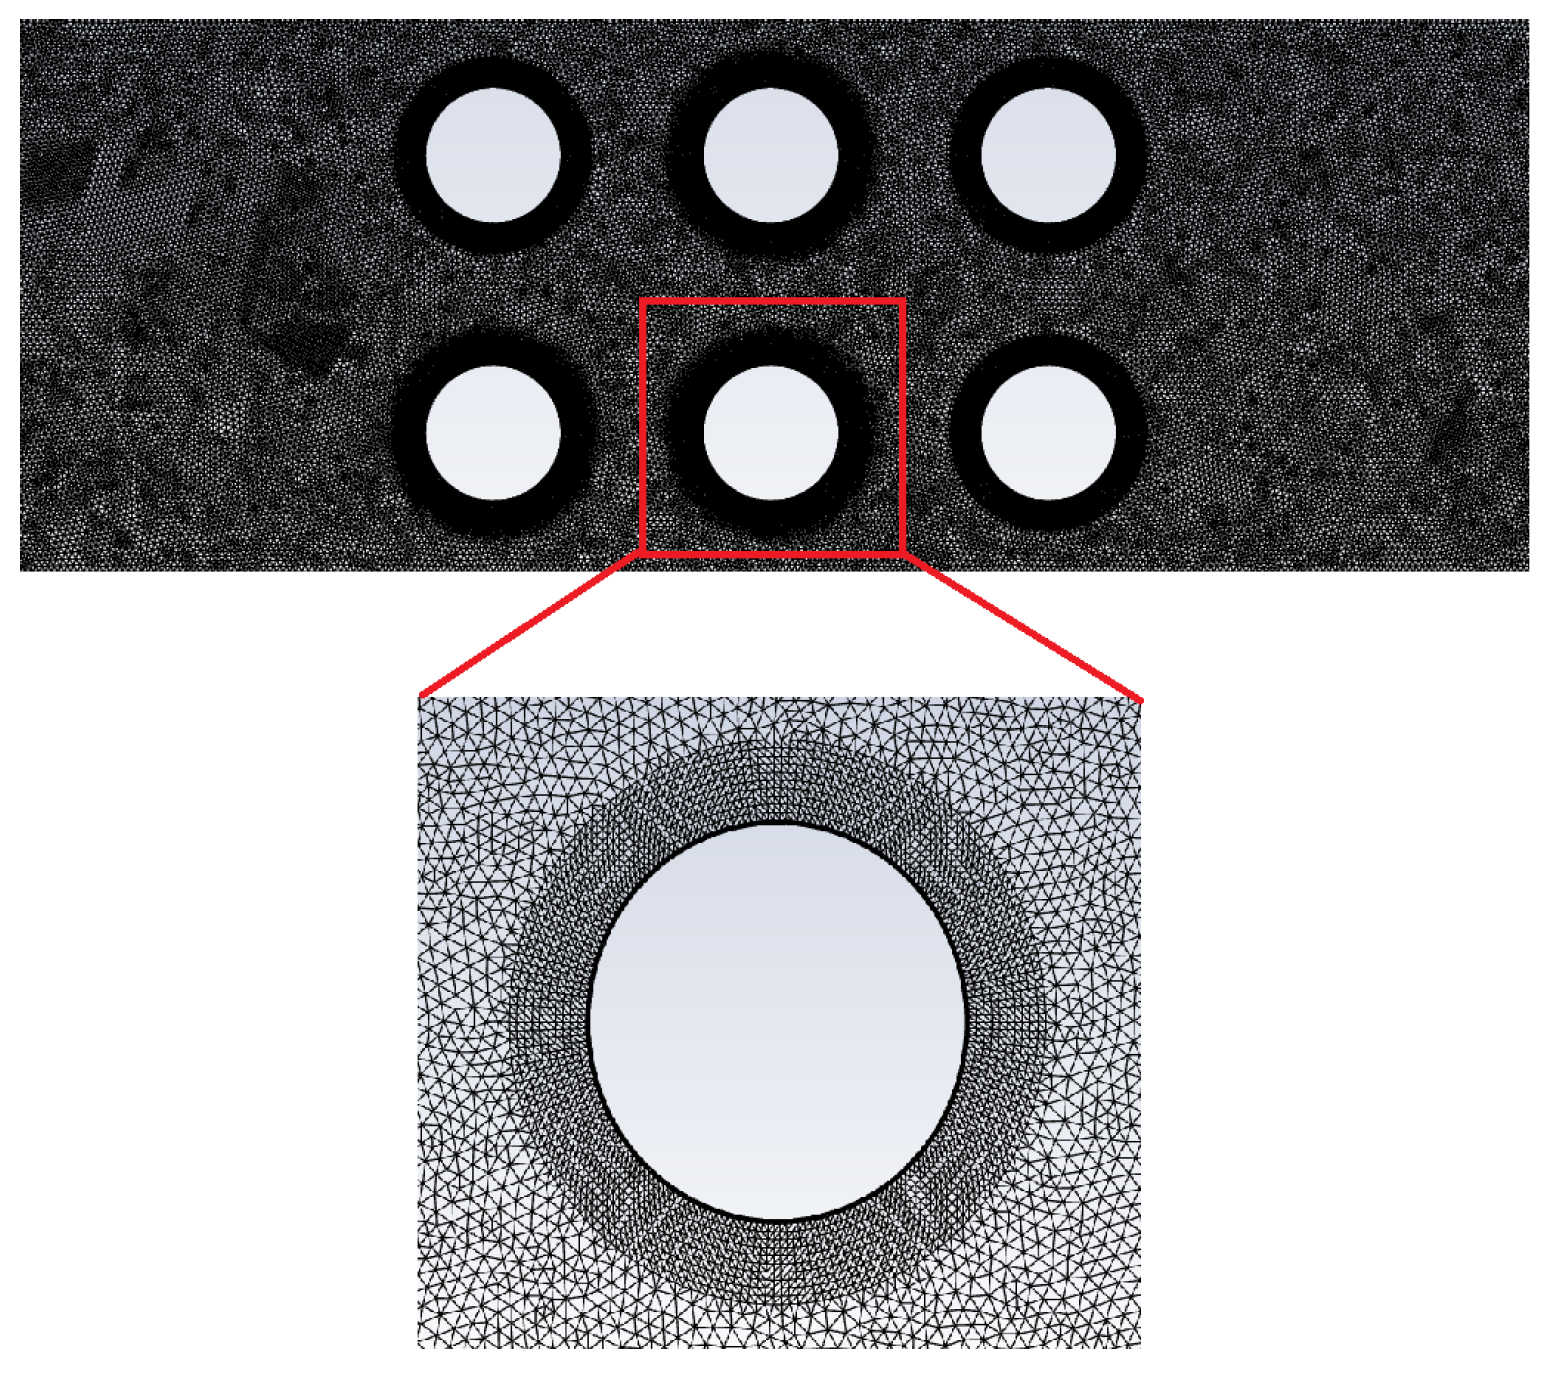
3.5. Mesh Independence Analysis
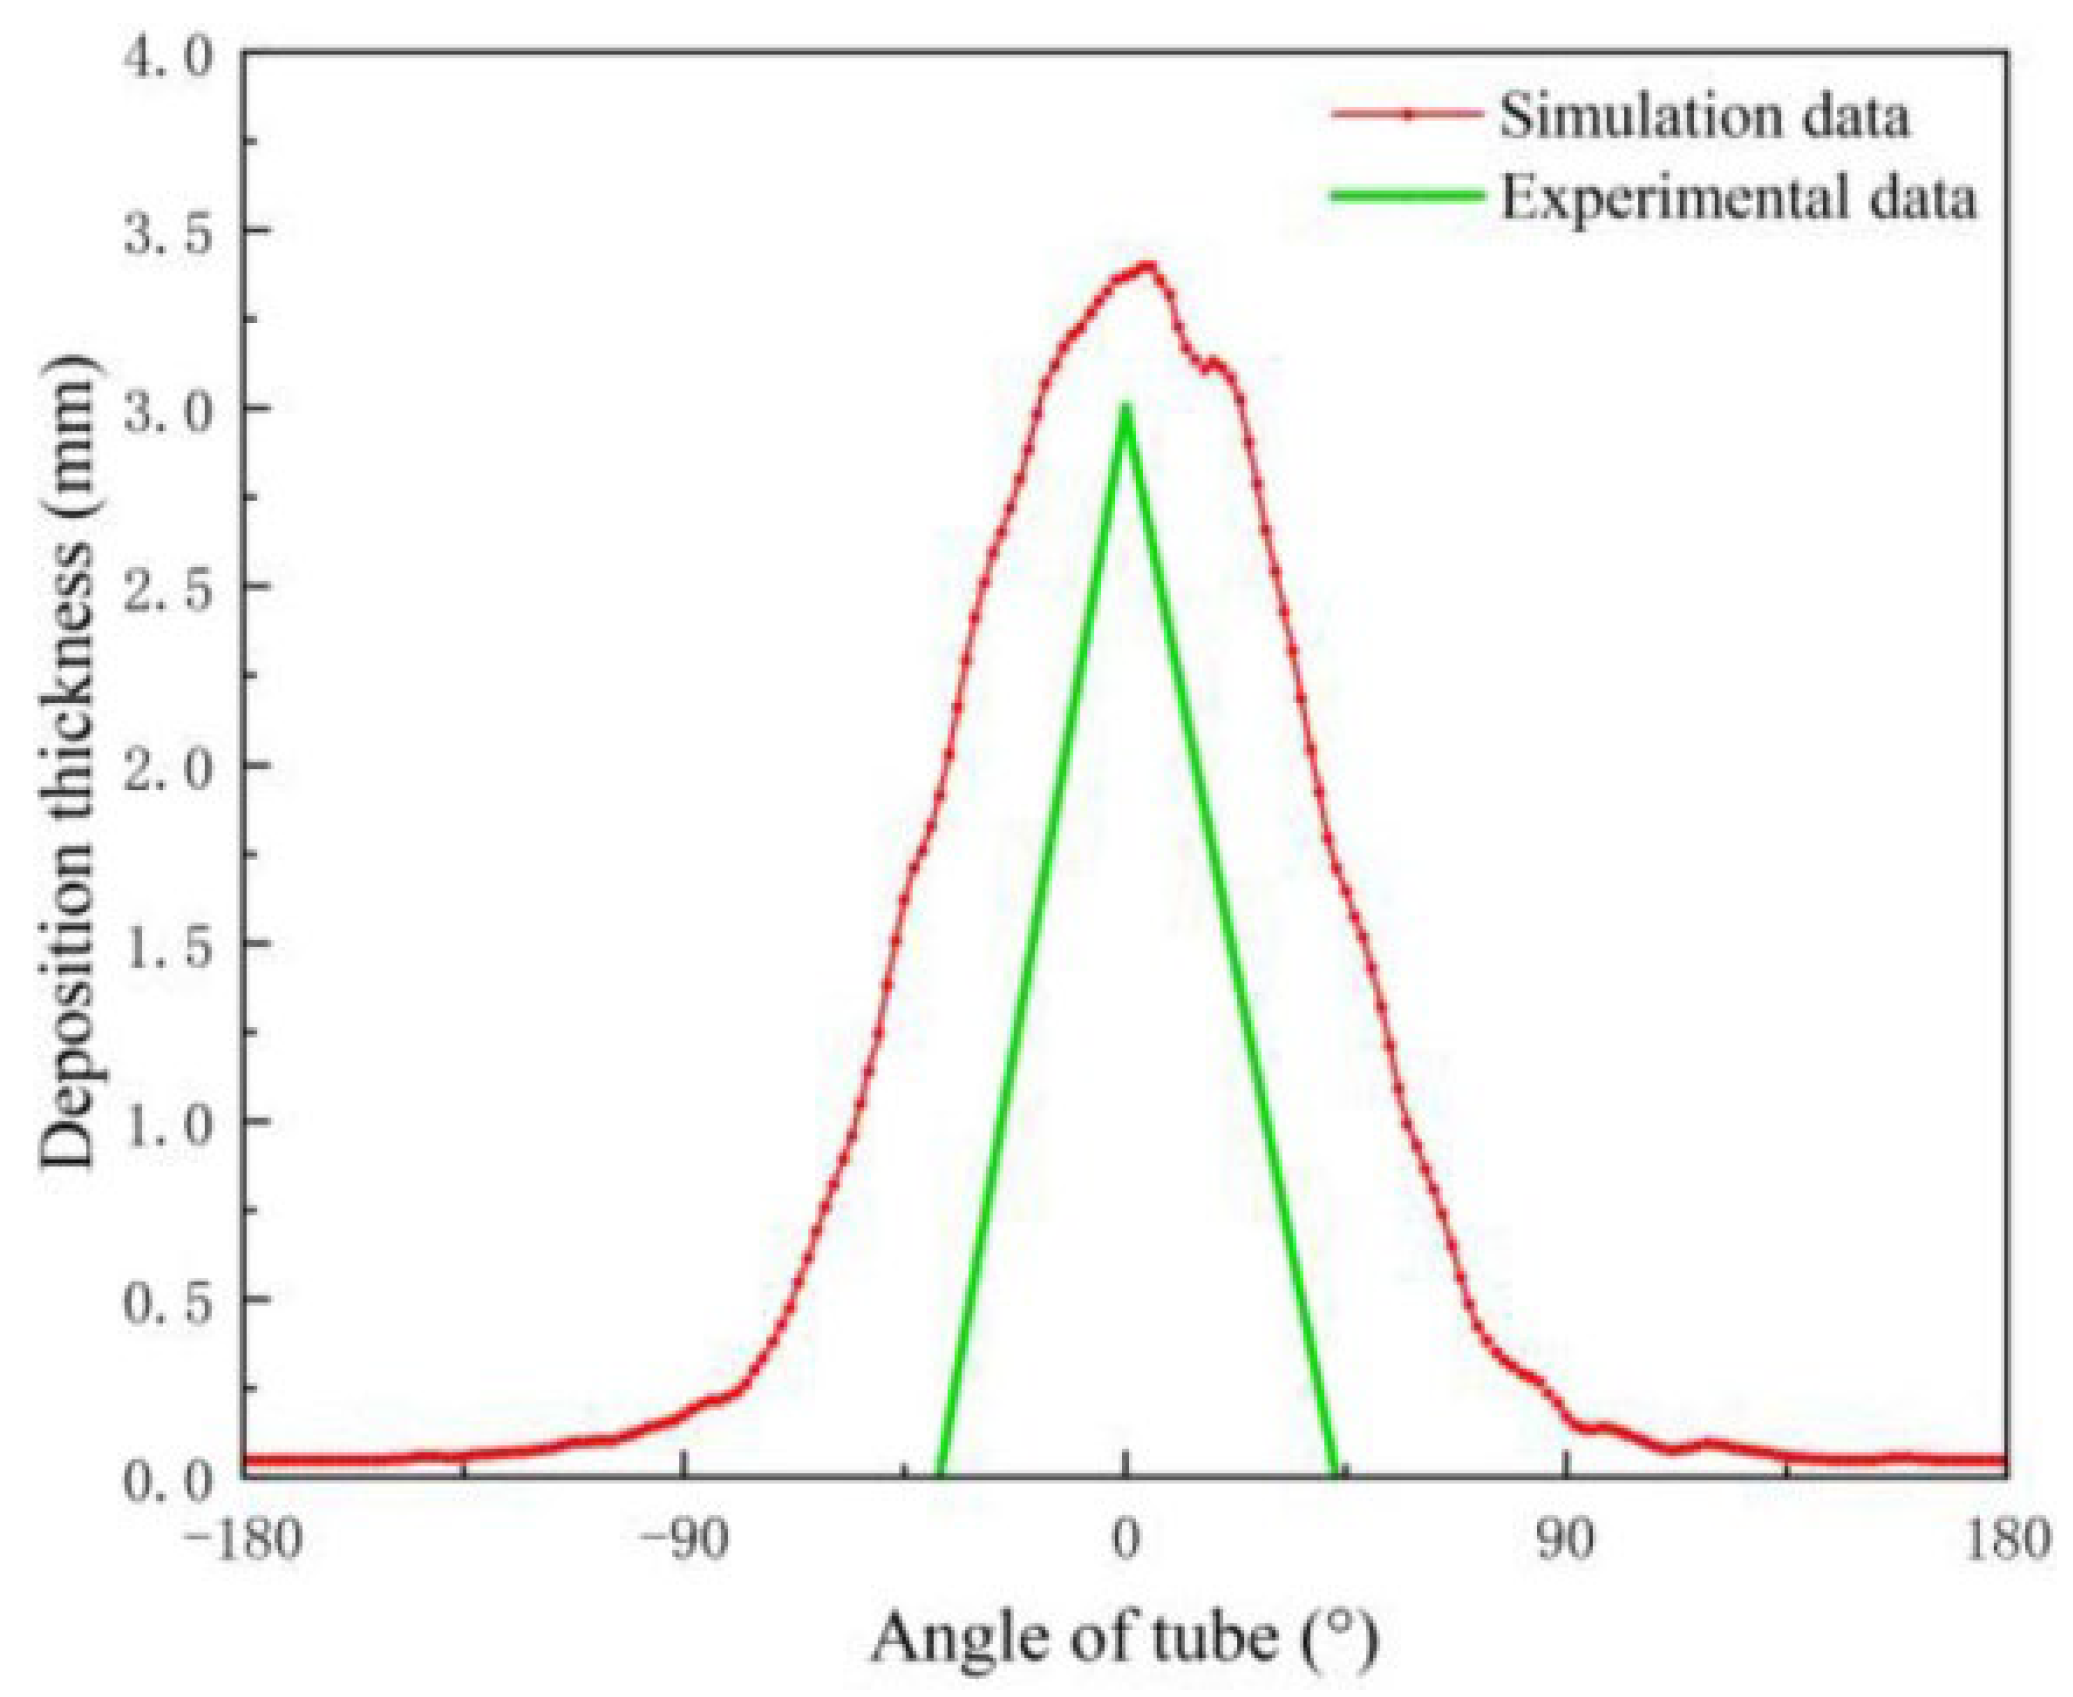
3.6. Model Validation
4. Results and Discussion
4.1. Deposit Mass and Morphology
4.2. Dynamic Particle Trajectories
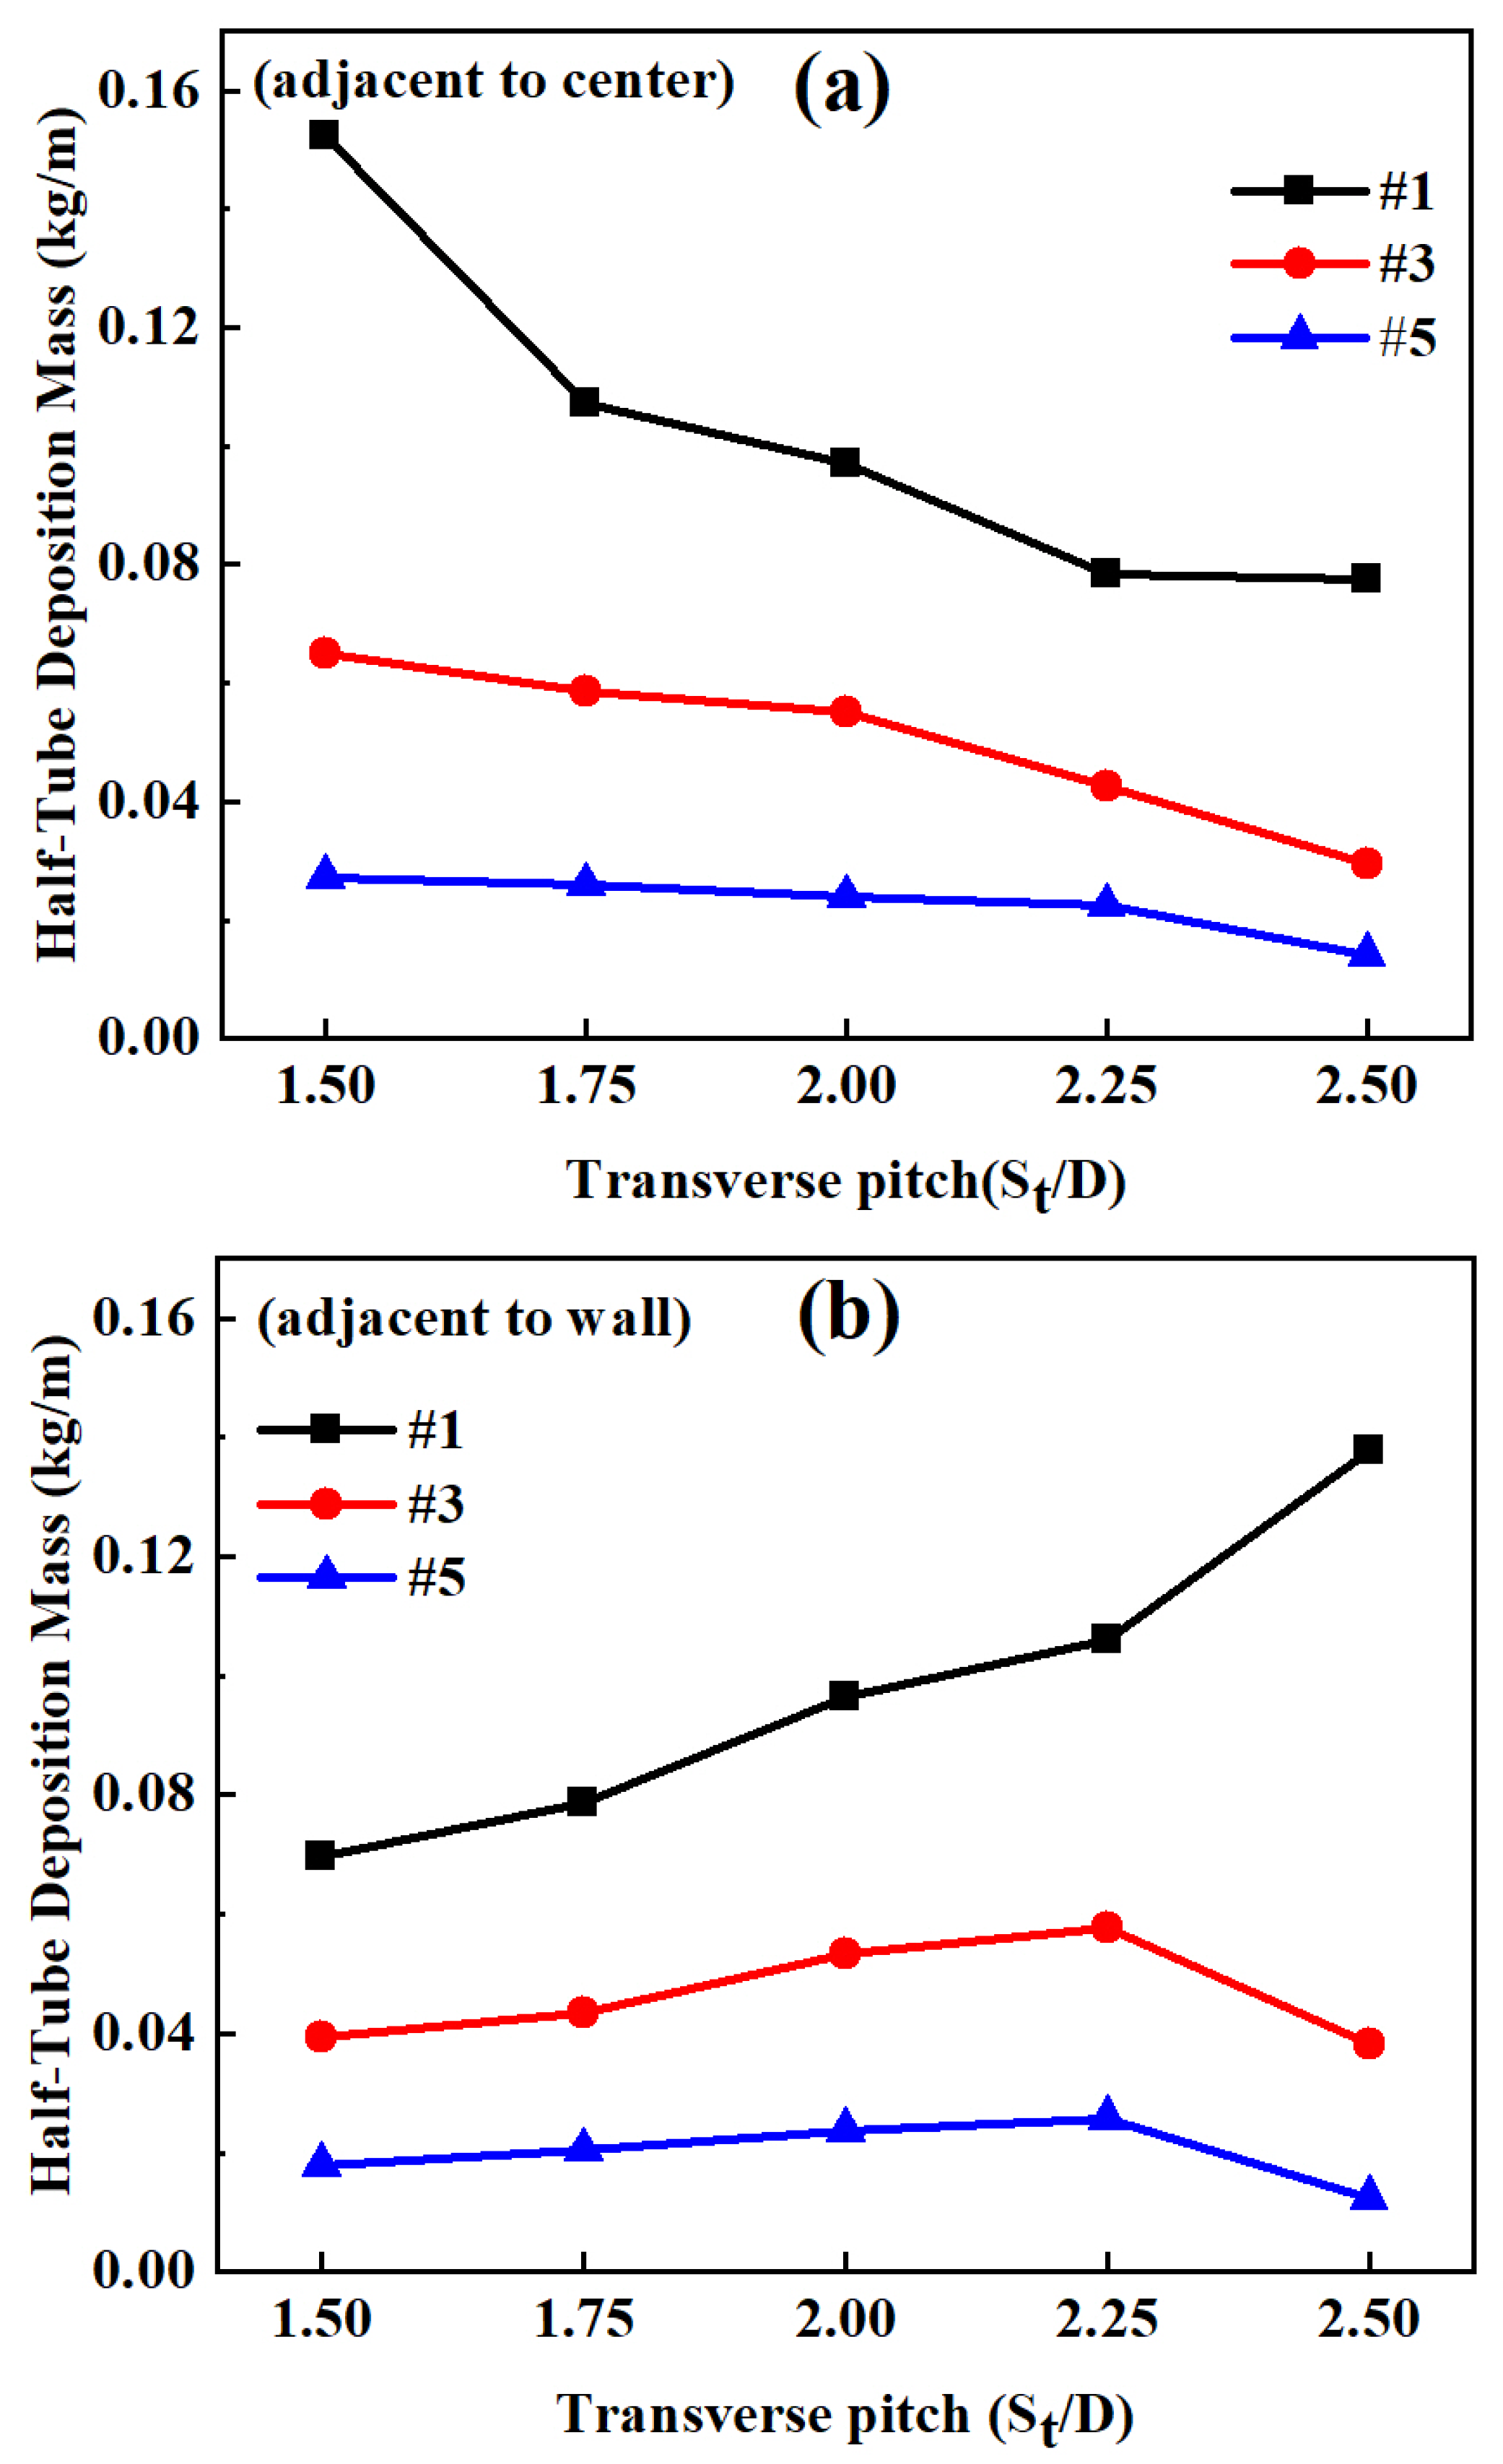
4.3. Effect of Tube Layouts
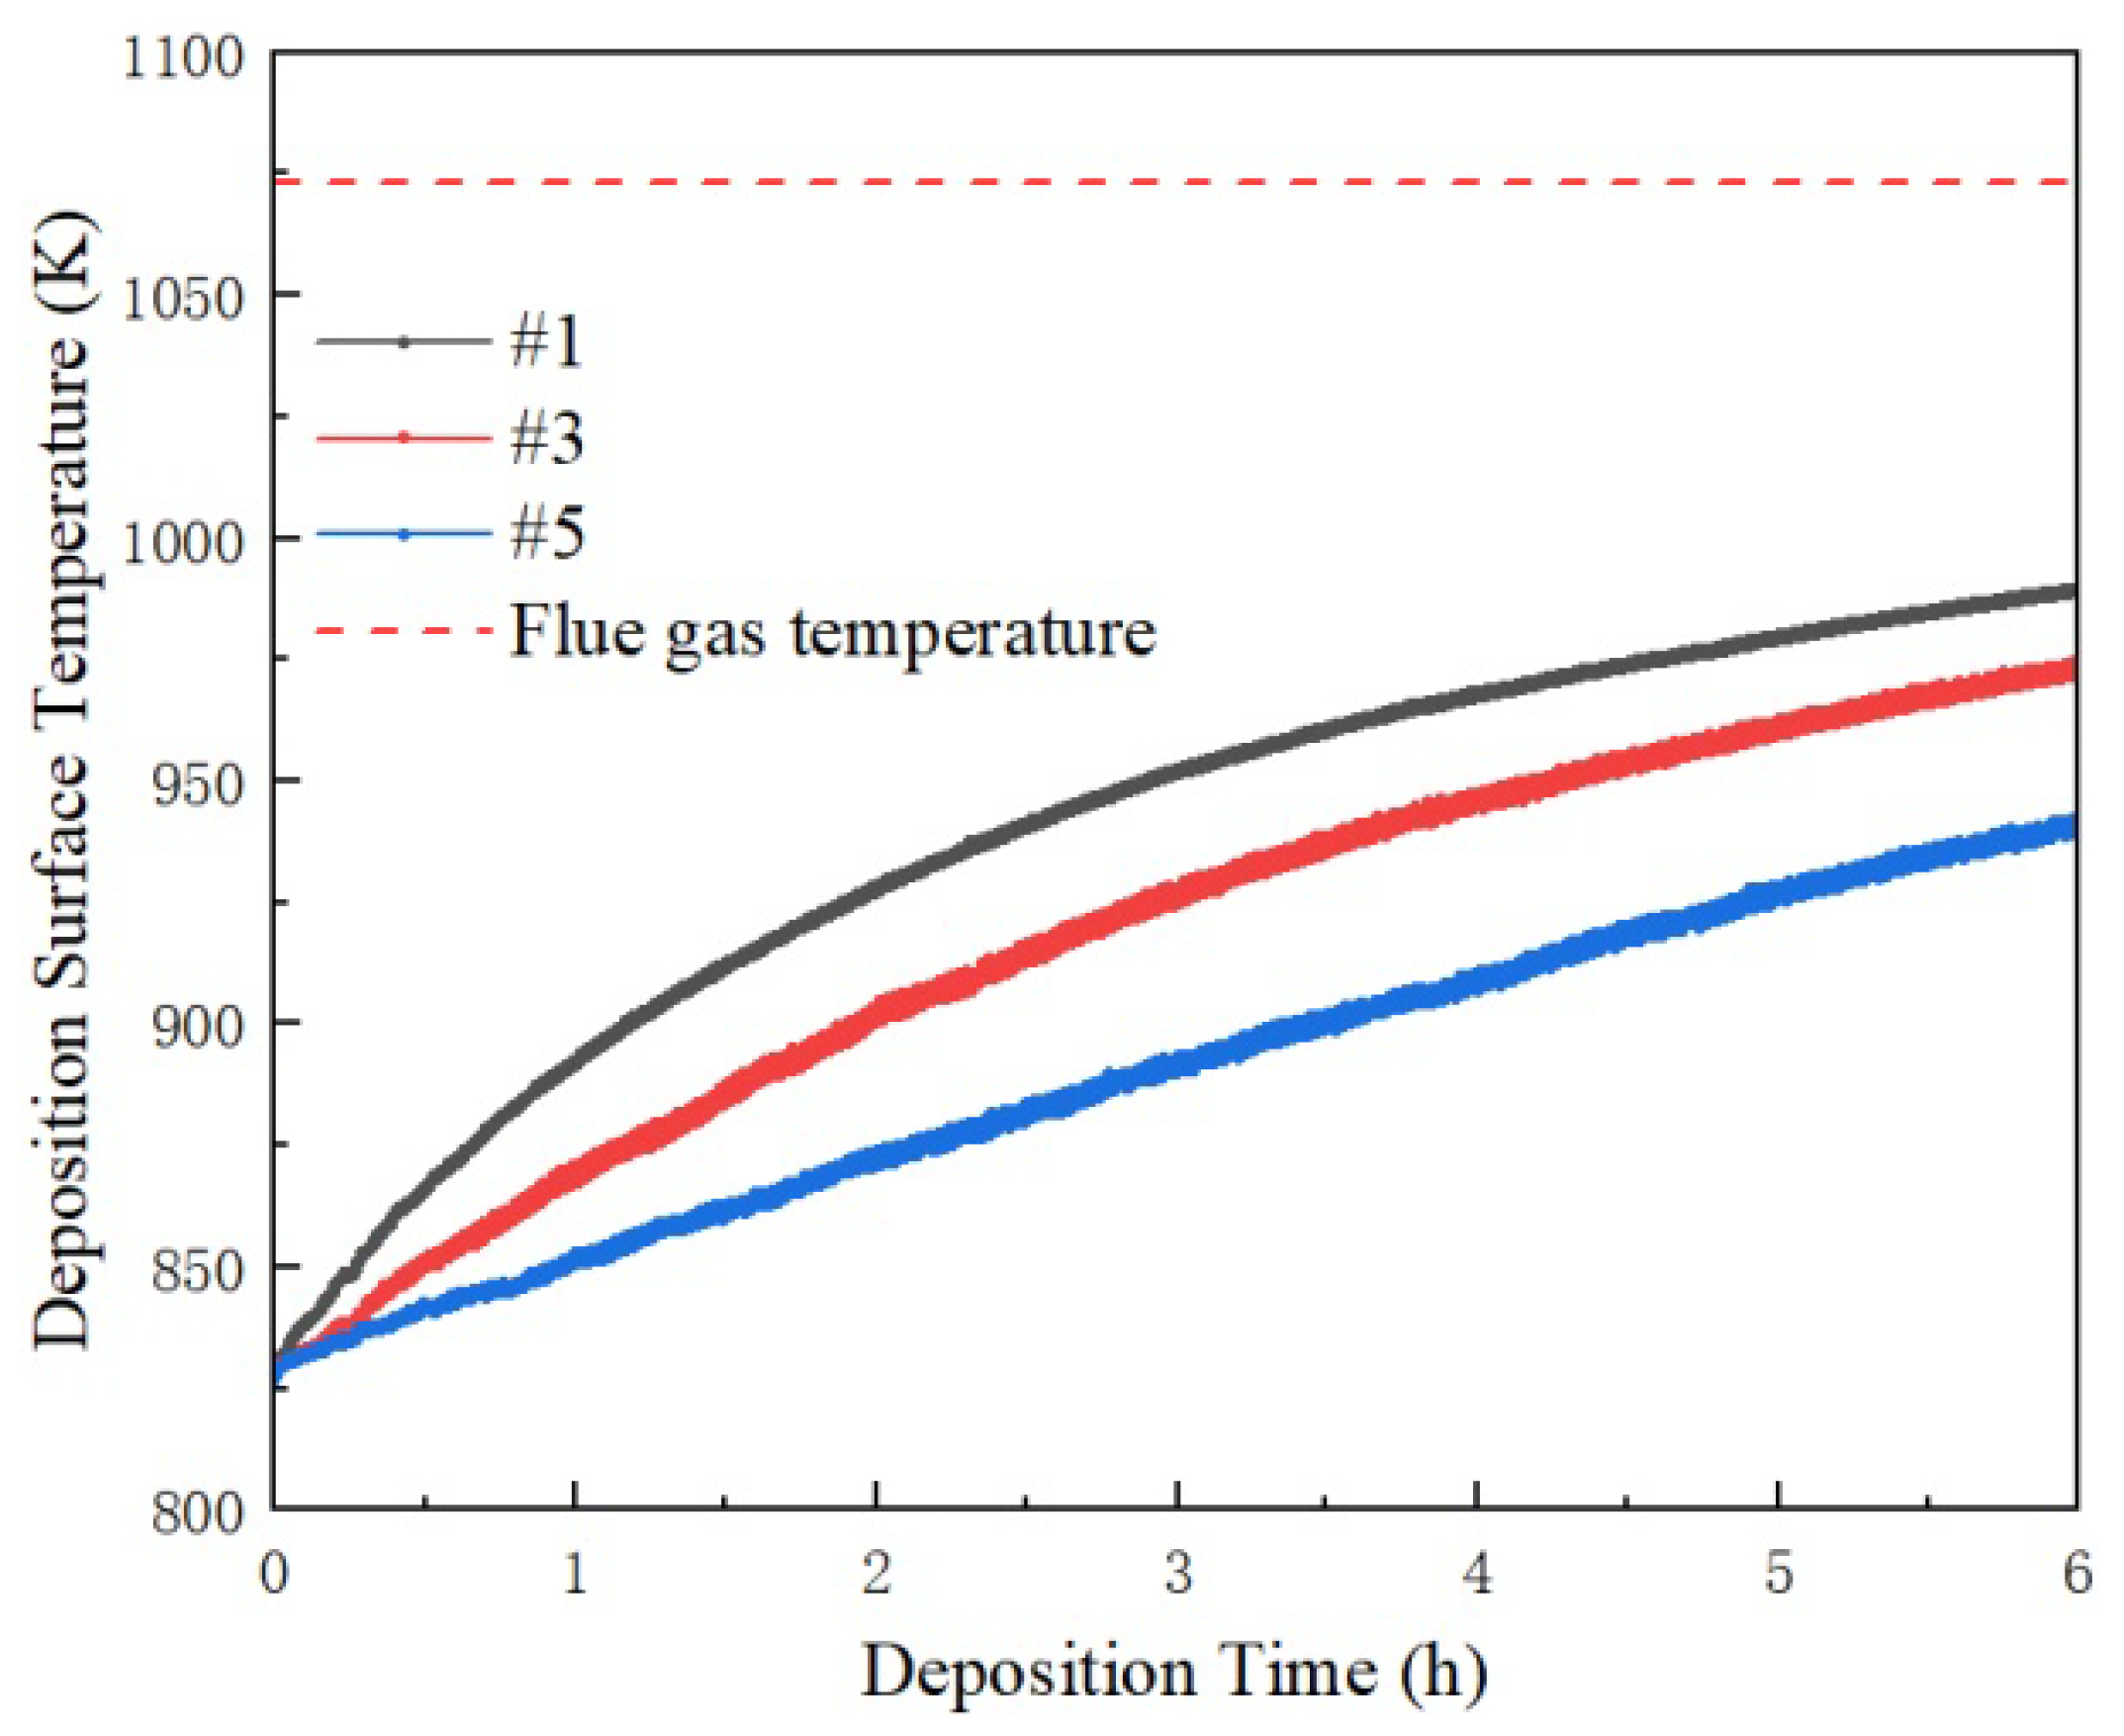
4.4. Heat Flux and Temperature Uniformity
5. Conclusions
Author Contributions
Funding
Data Availability Statement
Conflicts of Interest
References
- Baxter, L.L.; DeSollar, R.W. A mechanistic description of ash deposition during pulverized coal combustion: Predictions compared with observations. Fuel 1993, 72, 1411–1418. [Google Scholar] [CrossRef]
- Wang, X.; Guo, W.; Cheng, Y.; Zheng, X. Understanding the centripetal effect and evacuation efficiency of evacuation assistants: Using the extended dynamic communication field model. Saf. Sci. 2015, 74, 150–159. [Google Scholar] [CrossRef]
- Hupa, M. Ash-Related Issues in Fluidized-Bed Combustion of Biomasses: Recent Research Highlights. Energy Fuels 2012, 26, 4–14. [Google Scholar] [CrossRef]
- Kleinhans, U.; Wieland, C.; Frandsen, F.J.; Spliethoff, H. Ash formation and deposition in coal and biomass fired combustion systems: Progress and challenges in the field of ash particle sticking and rebound behavior. Prog. Energy Combust. Sci. 2018, 68, 65–168. [Google Scholar] [CrossRef]
- Li, M.-J.; Tang, S.-Z.; Wang, F.-l.; Zhao, Q.-X.; Tao, W.-Q. Gas-side fouling, erosion and corrosion of heat exchangers for middle/low temperature waste heat utilization: A review on simulation and experiment. Appl. Therm. Eng. 2017, 126, 737–761. [Google Scholar] [CrossRef]
- Shi, H.; Wu, Y.; Zhang, M.; Zhang, Y.; Lyu, J. Ash deposition of Zhundong coal in a 350 MW pulverized coal furnace: Influence of sulfation. Fuel 2020, 260, 116317. [Google Scholar] [CrossRef]
- Long, X.; Li, J.; Wang, H.; Liang, Y.; Lu, X.; Zhang, D. The morphological and mineralogical characteristics and thermal conductivity of ash deposits in a 220 MW CFBB firing Zhundong lignite. Energy 2023, 263, 125842. [Google Scholar] [CrossRef]
- Cai, Y.; Tay, K.; Zheng, Z.; Yang, W.; Wang, H.; Zeng, G.; Li, Z.; Keng Boon, S.; Subbaiah, P. Modeling of ash formation and deposition processes in coal and biomass fired boilers: A comprehensive review. Appl. Energy 2018, 230, 1447–1544. [Google Scholar] [CrossRef]
- Mavridou, S.G.; Bouris, D.G. Numerical evaluation of a heat exchanger with inline tubes of different size for reduced fouling rates. Int. J. Heat Mass Transf. 2012, 55, 5185–5195. [Google Scholar] [CrossRef]
- García Pérez, M.; Vakkilainen, E.; Hyppänen, T. Unsteady CFD analysis of kraft recovery boiler fly-ash trajectories, sticking efficiencies and deposition rates with a mechanistic particle rebound-stick model. Fuel 2016, 181, 408–420. [Google Scholar] [CrossRef]
- Mueller, C.; Selenius, M.; Theis, M.; Skrifvars, B.-J.; Backman, R.; Hupa, M.; Tran, H. Deposition behaviour of molten alkali-rich fly ashes—Development of a submodel for CFD applications. Proc. Combust. Inst. 2005, 30, 2991–2998. [Google Scholar] [CrossRef]
- Yang, X.; Ingham, D.; Ma, L.; Zhou, H.; Pourkashanian, M. Understanding the ash deposition formation in Zhundong lignite combustion through dynamic CFD modelling analysis. Fuel 2017, 194, 533–543. [Google Scholar] [CrossRef]
- Walsh, P.M.; Sayre, A.N.; Loehden, D.O.; Monroe, L.S.; Beér, J.M.; Sarofim, A.F. Deposition of bituminous coal ash on an isolated heat exchanger tube: Effects of coal properties on deposit growth. Prog. Energy Combust. Sci. 1990, 16, 327–345. [Google Scholar] [CrossRef]
- Kleinhans, U.; Wieland, C.; Babat, S.; Scheffknecht, G.; Spliethoff, H. Ash particle sticking and rebound behavior: A mechanistic explanation and modeling approach. Proc. Combust. Inst. 2017, 36, 2341–2350. [Google Scholar] [CrossRef]
- Kær, S.K. Numerical Investigation of Ash Deposition in Straw-Fired Boilers; Institut for Energiteknik, Aalborg Universitet: Aalborg, Denmark, 2001. [Google Scholar]
- García Pérez, M.; Vakkilainen, E. A comparison of turbulence models and two and three dimensional meshes for unsteady CFD ash deposition tools. Fuel 2019, 237, 806–811. [Google Scholar] [CrossRef]
- Balakrishnan, S.; Nagarajan, R.; Karthick, K. Mechanistic modeling, numerical simulation and validation of slag-layer growth in a coal-fired boiler. Energy 2015, 81, 462–470. [Google Scholar] [CrossRef]
- Losurdo, M.; Spliethoff, H.; Kiel, J. Ash deposition modeling using a visco-elastic approach. Fuel 2012, 102, 145–155. [Google Scholar] [CrossRef]
- Zhou, H.; Hu, S. Numerical simulation of ash deposition behavior with a novel erosion model using dynamic mesh. Fuel 2021, 286, 119482. [Google Scholar] [CrossRef]
- Weber, R.; Poyraz, Y.; Beckmann, A.M.; Brinker, S. Combustion of biomass in jet flames. Proc. Combust. Inst. 2015, 35, 2749–2758. [Google Scholar] [CrossRef]
- Tomeczek, J.; Wacławiak, K. Two-dimensional modelling of deposits formation on platen superheaters in pulverized coal boilers. Fuel 2009, 88, 1466–1471. [Google Scholar] [CrossRef]
- Tomeczek, J.; Palugniok, H.; Ochman, J. Modelling of deposits formation on heating tubes in pulverized coal boilers. Fuel 2004, 83, 213–221. [Google Scholar] [CrossRef]
- Garba, M.U.; Ingham, D.B.; Ma, L.; Porter, R.T.J.; Pourkashnian, M.; Tan, H.; Williams, A. Prediction of Potassium Chloride Sulfation and Its Effect on Deposition in Biomass-Fired Boilers. Energy Fuels 2012, 26, 6501–6508. [Google Scholar] [CrossRef]
- Liang, Y.; Li, J.; Long, X.; Lu, X.; Zhang, D. A numerical simulation study of ash deposition in a circulating fluidized bed during Zhundong lignite combustion. Fuel 2023, 333, 126501. [Google Scholar] [CrossRef]
- Li, J.; Du, W.; Cheng, L. Numerical simulation and experiment of gas-solid two phase flow and ash deposition on a novel heat transfer surface. Appl. Therm. Eng. 2017, 113, 1033–1046. [Google Scholar] [CrossRef]
- Han, H.; He, Y.-L.; Tao, W.-Q.; Li, Y.-S. A parameter study of tube bundle heat exchangers for fouling rate reduction. Int. J. Heat Mass Transf. 2014, 72, 210–221. [Google Scholar] [CrossRef]
- Zheng, Z.; Yang, W.; Cai, Y.; Wang, Q.; Zeng, G. Dynamic simulation on ash deposition and heat transfer behavior on a staggered tube bundle under high-temperature conditions. Energy 2020, 190, 116390. [Google Scholar] [CrossRef]
- García Pérez, M.; Vakkilainen, E.; Hyppänen, T. The contribution of differently-sized ash particles to the fouling trends of a pilot-scale coal-fired combustor with an ash deposition CFD model. Fuel 2017, 189, 120–130. [Google Scholar] [CrossRef]
- Mu, L.; Miao, H.; Zhao, C.; Zhai, Z.; Shang, Y.; Yin, H. Dynamic CFD modeling evaluation of ash deposition behavior and morphology evolution with different tube arrangements. Powder Technol. 2021, 379, 279–295. [Google Scholar] [CrossRef]
- Liu, Z.; Li, J.; Wang, Q.; Lu, X.; Zhang, Y.; Zhu, M.; Zhang, Z.; Zhang, D. An experimental investigation into mineral transformation, particle agglomeration and ash deposition during combustion of Zhundong lignite in a laboratory-scale circulating fluidized bed. Fuel 2019, 243, 458–468. [Google Scholar] [CrossRef]
- Liu, Z.; Li, J.; Zhu, M.; Wang, Q.; Lu, X.; Zhang, Y.; Zhang, Z.; Zhang, D. Morphological and Mineralogical Characterization of Ash Deposits during Circulating Fluidized Bed Combustion of Zhundong Lignite. Energy Fuels 2019, 33, 2122–2132. [Google Scholar] [CrossRef]
- Kantak, A.A.; Galvin, J.E.; Wildemuth, D.J.; Davis, R.H. Low-velocity collisions of particles with a dry or wet wall. Microgravity Sci. Technol. 2005, 17, 18–25. [Google Scholar] [CrossRef]
- Cheng, R.K.; Schefer, R.W.; Talbot, L.; Willis, D.R. Thermophoresis of particles in a heated boundary layer. J. Fluid Mech. 1980, 101, 737–758. [Google Scholar] [CrossRef]
- Jokiniemi, J.K.; Pyykönen, J.; Lyyränen, J.; Mikkanen, P.; Kauppinen, E.I. Modelling Ash Deposition during the Combustion of Low Grade Fuels. In Applications of Advanced Technology to Ash-Related Problems in Boilers; Baxter, L., DeSollar, R., Eds.; Springer: Boston, MA, USA, 1996; pp. 591–615. [Google Scholar] [CrossRef]
- Brink, A.; Lindberg, D.; Hupa, M.; de Tejada, M.E.; Paneru, M.; Maier, J.; Scheffknecht, G.; Pranzitelli, A.; Pourkashanian, M. A temperature-history based model for the sticking probability of impacting pulverized coal ash particles. Fuel Process. Technol. 2016, 141, 210–215. [Google Scholar] [CrossRef]
- Venturini, P.; Borello, D.; Hanjalić, K.; Rispoli, F. Modelling of particles deposition in an environment relevant to solid fuel boilers. Appl. Therm. Eng. 2012, 49, 131–138. [Google Scholar] [CrossRef]
- Browning, G.J.; Bryant, G.W.; Hurst, H.J.; Lucas, J.A.; Wall, T.F. An Empirical Method for the Prediction of Coal Ash Slag Viscosity. Energy Fuels 2003, 17, 731–737. [Google Scholar] [CrossRef]
- Ji, J.; Cheng, L.; Nie, L.; Li, L.; Wei, Y. Sodium transformation simulation with a 2-D CFD model during circulating fluidized bed combustion. Fuel 2020, 267, 117175. [Google Scholar] [CrossRef]
- Zhou, H.; Zhang, K.; Li, Y.; Zhang, J.; Zhou, M. Simulation of ash deposition in different furnace temperature with a 2D dynamic mesh model. J. Energy Inst. 2019, 92, 1743–1756. [Google Scholar] [CrossRef]
- Liu, Z.; Li, J.; Zhu, M.; Wang, F.; Lu, X.; Zhang, Z.; Zhang, D. Experimental Investigation into Ash Deposition and Na Migration Characteristics during Combustion of High Sodium Zhundong Lignite in a Circulating Fluidized Bed Operating at Low Temperatures. Energy Fuels 2020, 34, 188–198. [Google Scholar] [CrossRef]
- Wacławiak, K.; Kalisz, S. A practical numerical approach for prediction of particulate fouling in PC boilers. Fuel 2012, 97, 38–48. [Google Scholar] [CrossRef]
- Lee, B.-H.; Hwang, M.-Y.; Seon, C.-Y.; Jeon, C.-H. Numerical prediction of characteristics of ash deposition in heavy fuel oil heat recovery steam generator. J. Mech. Sci. Technol. 2014, 28, 2889–2900. [Google Scholar] [CrossRef]
- Kær, S.K.; Rosendahl, L.A.; Baxter, L.L. Towards a CFD-based mechanistic deposit formation model for straw-fired boilers. Fuel 2006, 85, 833–848. [Google Scholar] [CrossRef]
- Zhou, H.; Zhou, B.; Li, L.; Zhang, H. Experimental Measurement of the Effective Thermal Conductivity of Ash Deposit for High Sodium Coal (Zhun Dong Coal) in a 300 KW Test Furnace. Energy Fuels 2013, 27, 7008–7022. [Google Scholar] [CrossRef]


| Ash Chemistry (wt.%, Dry Basis) | |||||||||
|---|---|---|---|---|---|---|---|---|---|
| SiO2 | Al2O3 | Fe2O3 | CaO | MgO | TiO2 | SO3 | P2O5 | K2O | Na2O |
| 11.71 | 6.69 | 5.93 | 32.51 | 7.56 | 0.39 | 27.93 | 0.09 | 0.44 | 4.90 |
| Simulation conditions | |||||||||
| Flue gas temperature (K) | Probe temperature (K) | Inlet velocity (m/s) | Concentration of ash (kg/m/s) | Density of ash (kg/m3) | Porosity of deposit | Thermal conductivity of ash (W/m/k) | |||
| 1073 | 823 | 15 | 2.4 × 10⁻⁴ | 2.5 × 10³ | 0.5 | 1.89 | |||
| Impaction Probability | Sticking Probability | Mean Size of Impacting Particles (µm) | Deposit Mass (kg/m) | |
|---|---|---|---|---|
| 1st row | 0.3486 | 0.0538 | 85.2 | 0.186 |
| 2nd row | 0.1758 | 0.0163 | 89.1 | 0.107 |
| 3rd row | 0.1281 | 0.0106 | 89.4 | 0.049 |
| Single [24] | 0.2191 | 0.0717 | 81.2 | 0.085 |
Disclaimer/Publisher’s Note: The statements, opinions and data contained in all publications are solely those of the individual author(s) and contributor(s) and not of MDPI and/or the editor(s). MDPI and/or the editor(s) disclaim responsibility for any injury to people or property resulting from any ideas, methods, instructions or products referred to in the content. |
© 2024 by the authors. Licensee MDPI, Basel, Switzerland. This article is an open access article distributed under the terms and conditions of the Creative Commons Attribution (CC BY) license (https://creativecommons.org/licenses/by/4.0/).
Share and Cite
Guo, Z.; Li, J.; Liang, Y.; Long, X.; Lu, X.; Zhang, D. A Numerical Simulation Study into the Effect of Longitudinal and Transverse Pitch on Deposition of Zhundong Coal Ash on Tube Bundles. Processes 2024, 12, 178. https://doi.org/10.3390/pr12010178
Guo Z, Li J, Liang Y, Long X, Lu X, Zhang D. A Numerical Simulation Study into the Effect of Longitudinal and Transverse Pitch on Deposition of Zhundong Coal Ash on Tube Bundles. Processes. 2024; 12(1):178. https://doi.org/10.3390/pr12010178
Chicago/Turabian StyleGuo, Zipeng, Jianbo Li, Yintang Liang, Xiaofei Long, Xiaofeng Lu, and Dongke Zhang. 2024. "A Numerical Simulation Study into the Effect of Longitudinal and Transverse Pitch on Deposition of Zhundong Coal Ash on Tube Bundles" Processes 12, no. 1: 178. https://doi.org/10.3390/pr12010178