
The Influence of Shear-Thinning Characteristics on Multiphase Pump Vortex Structure Evolution, Pressure Fluctuation, and Gas-Solid Distribution

Abstract
:1. Introduction
2. Problem Set
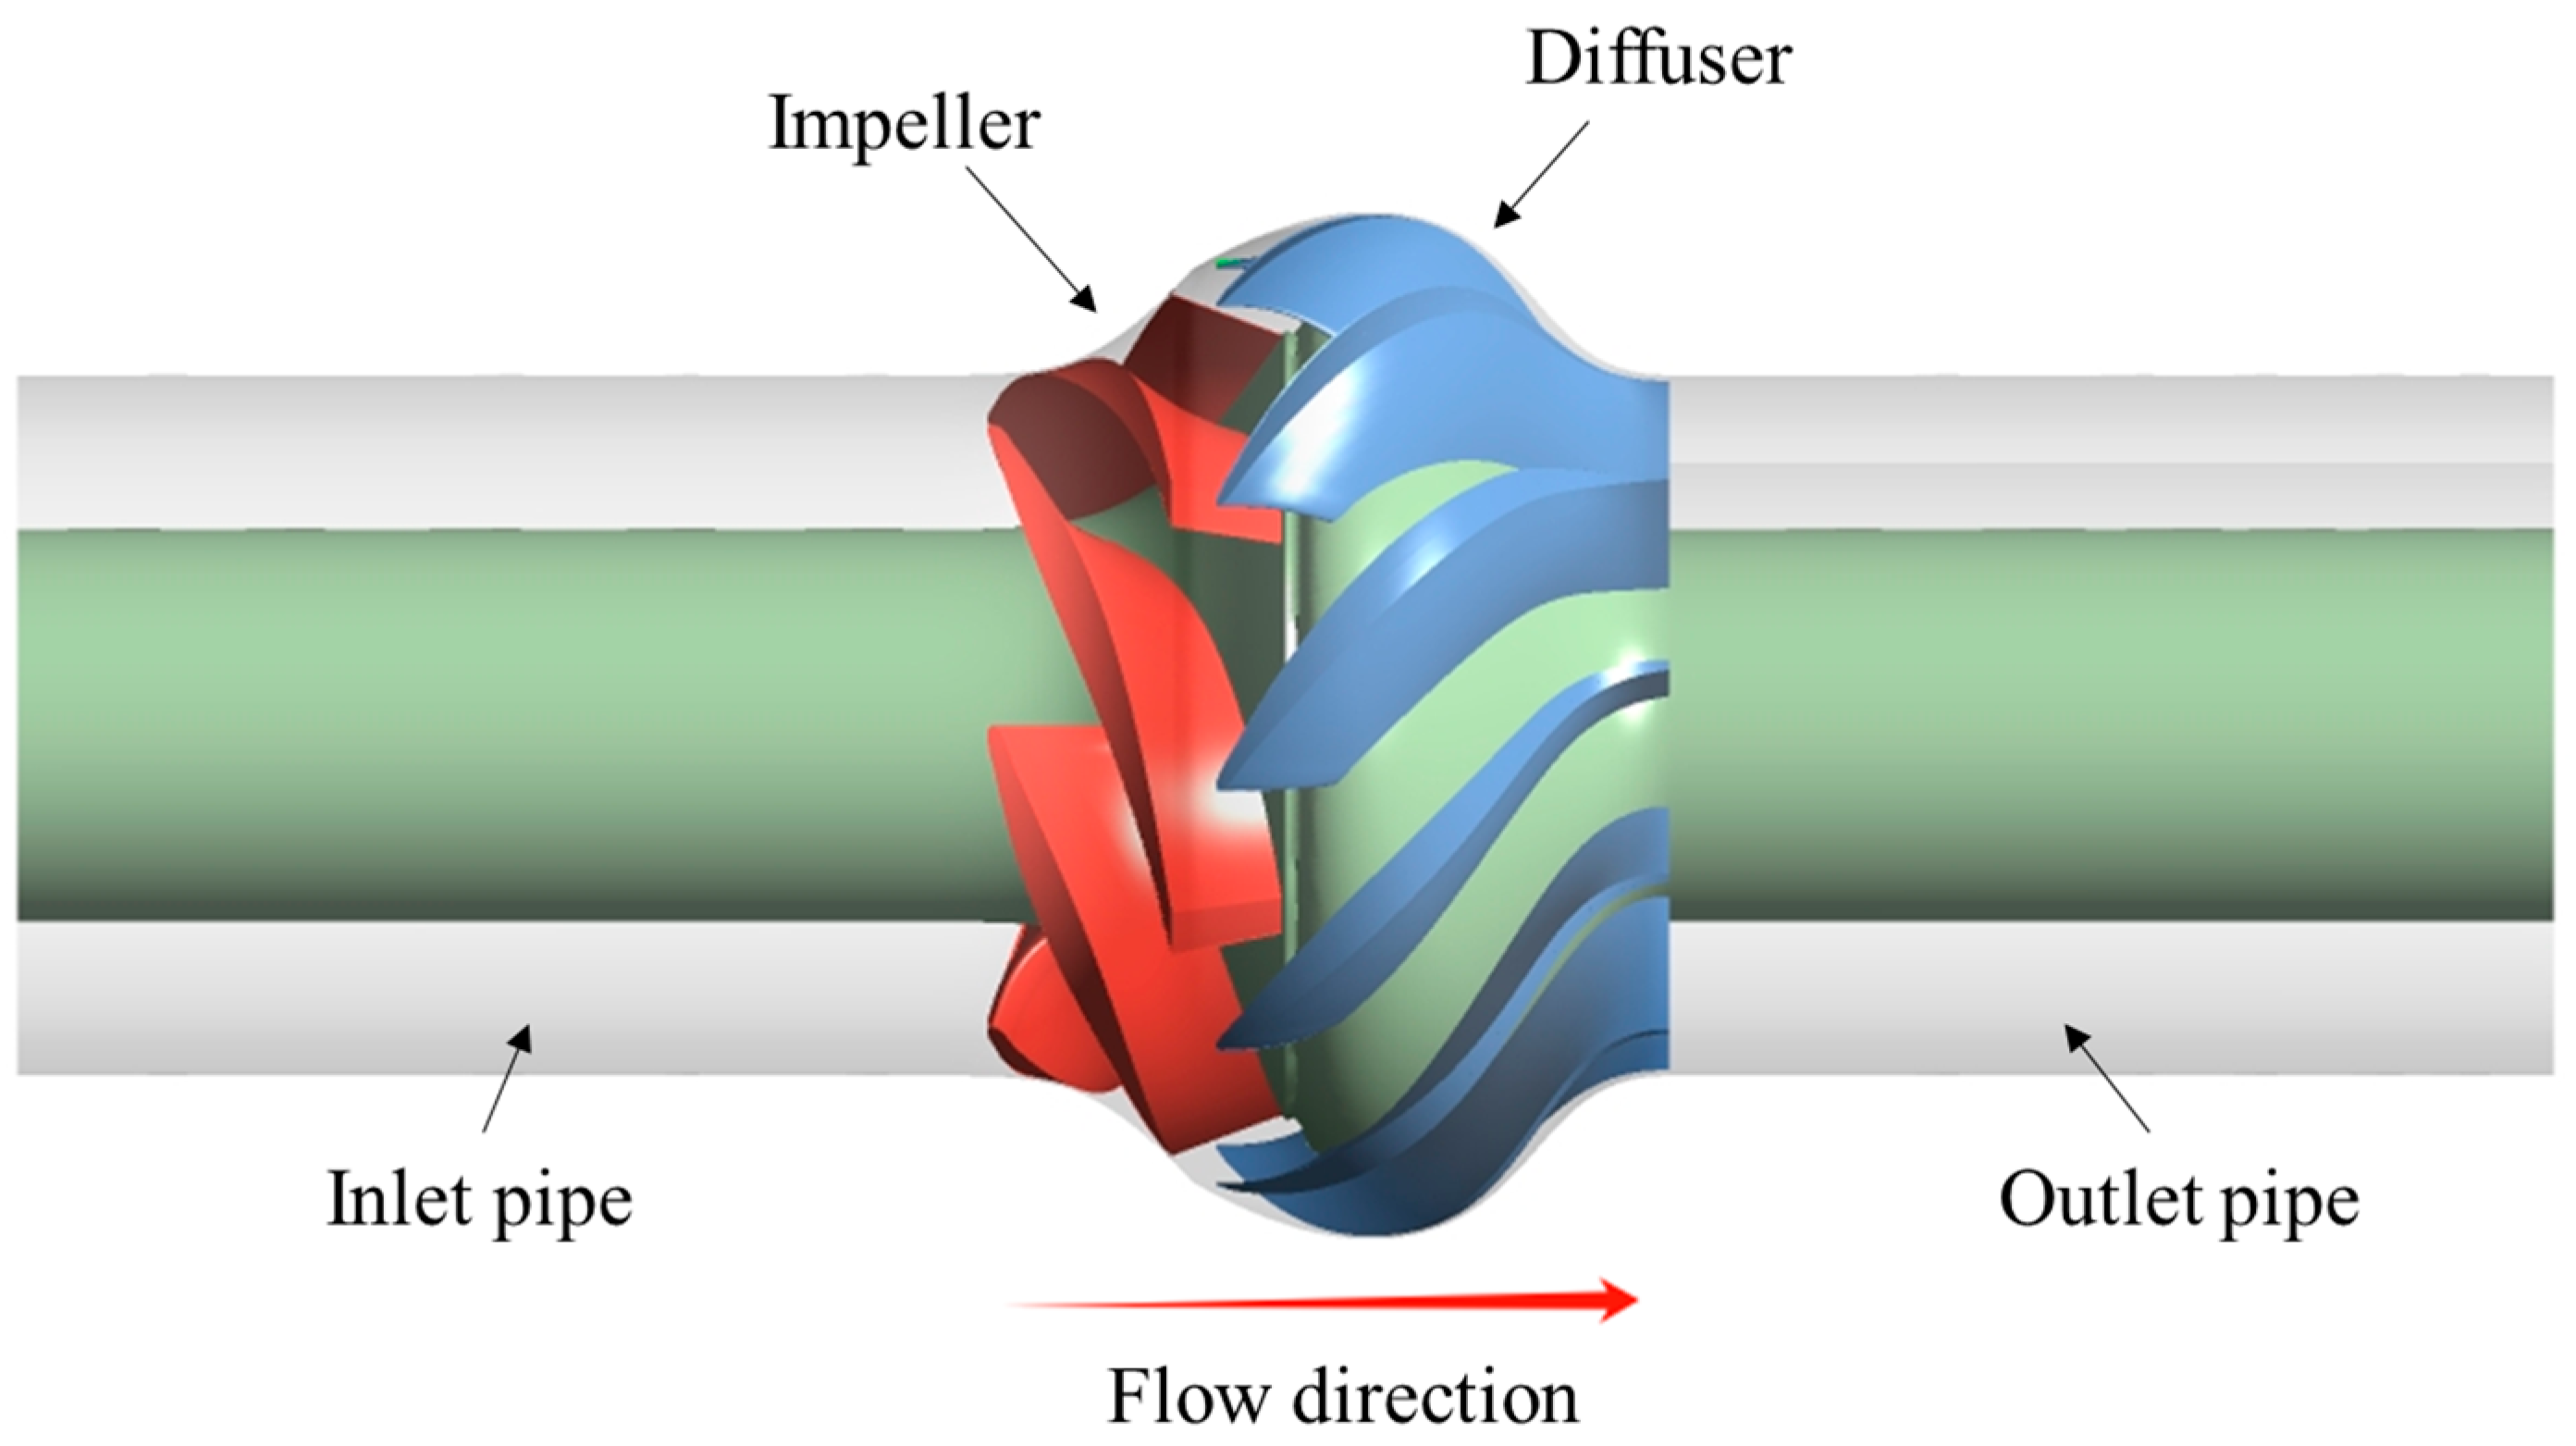
2.1. Physical Model
2.2. Parameterization of Operating Conditions
3. Numerical Methods
3.1. Governing Equations and Boundary Conditions
- (1)
- Discrete and continuous phases are both regarded as continuous media, coexisting within the same spatial domain and sharing a common pressure field.
- (2)
- The “gas-liquid-solid” three-phase follows their respective mass and momentum control equations.
- (3)
- No mass transfer or chemical reactions occur between the phases, and there is no temperature variation during the flow process. Solid particles undergo no phase changes.
3.2. Independence Test of Mesh and Time Step
4. Results and Discussion
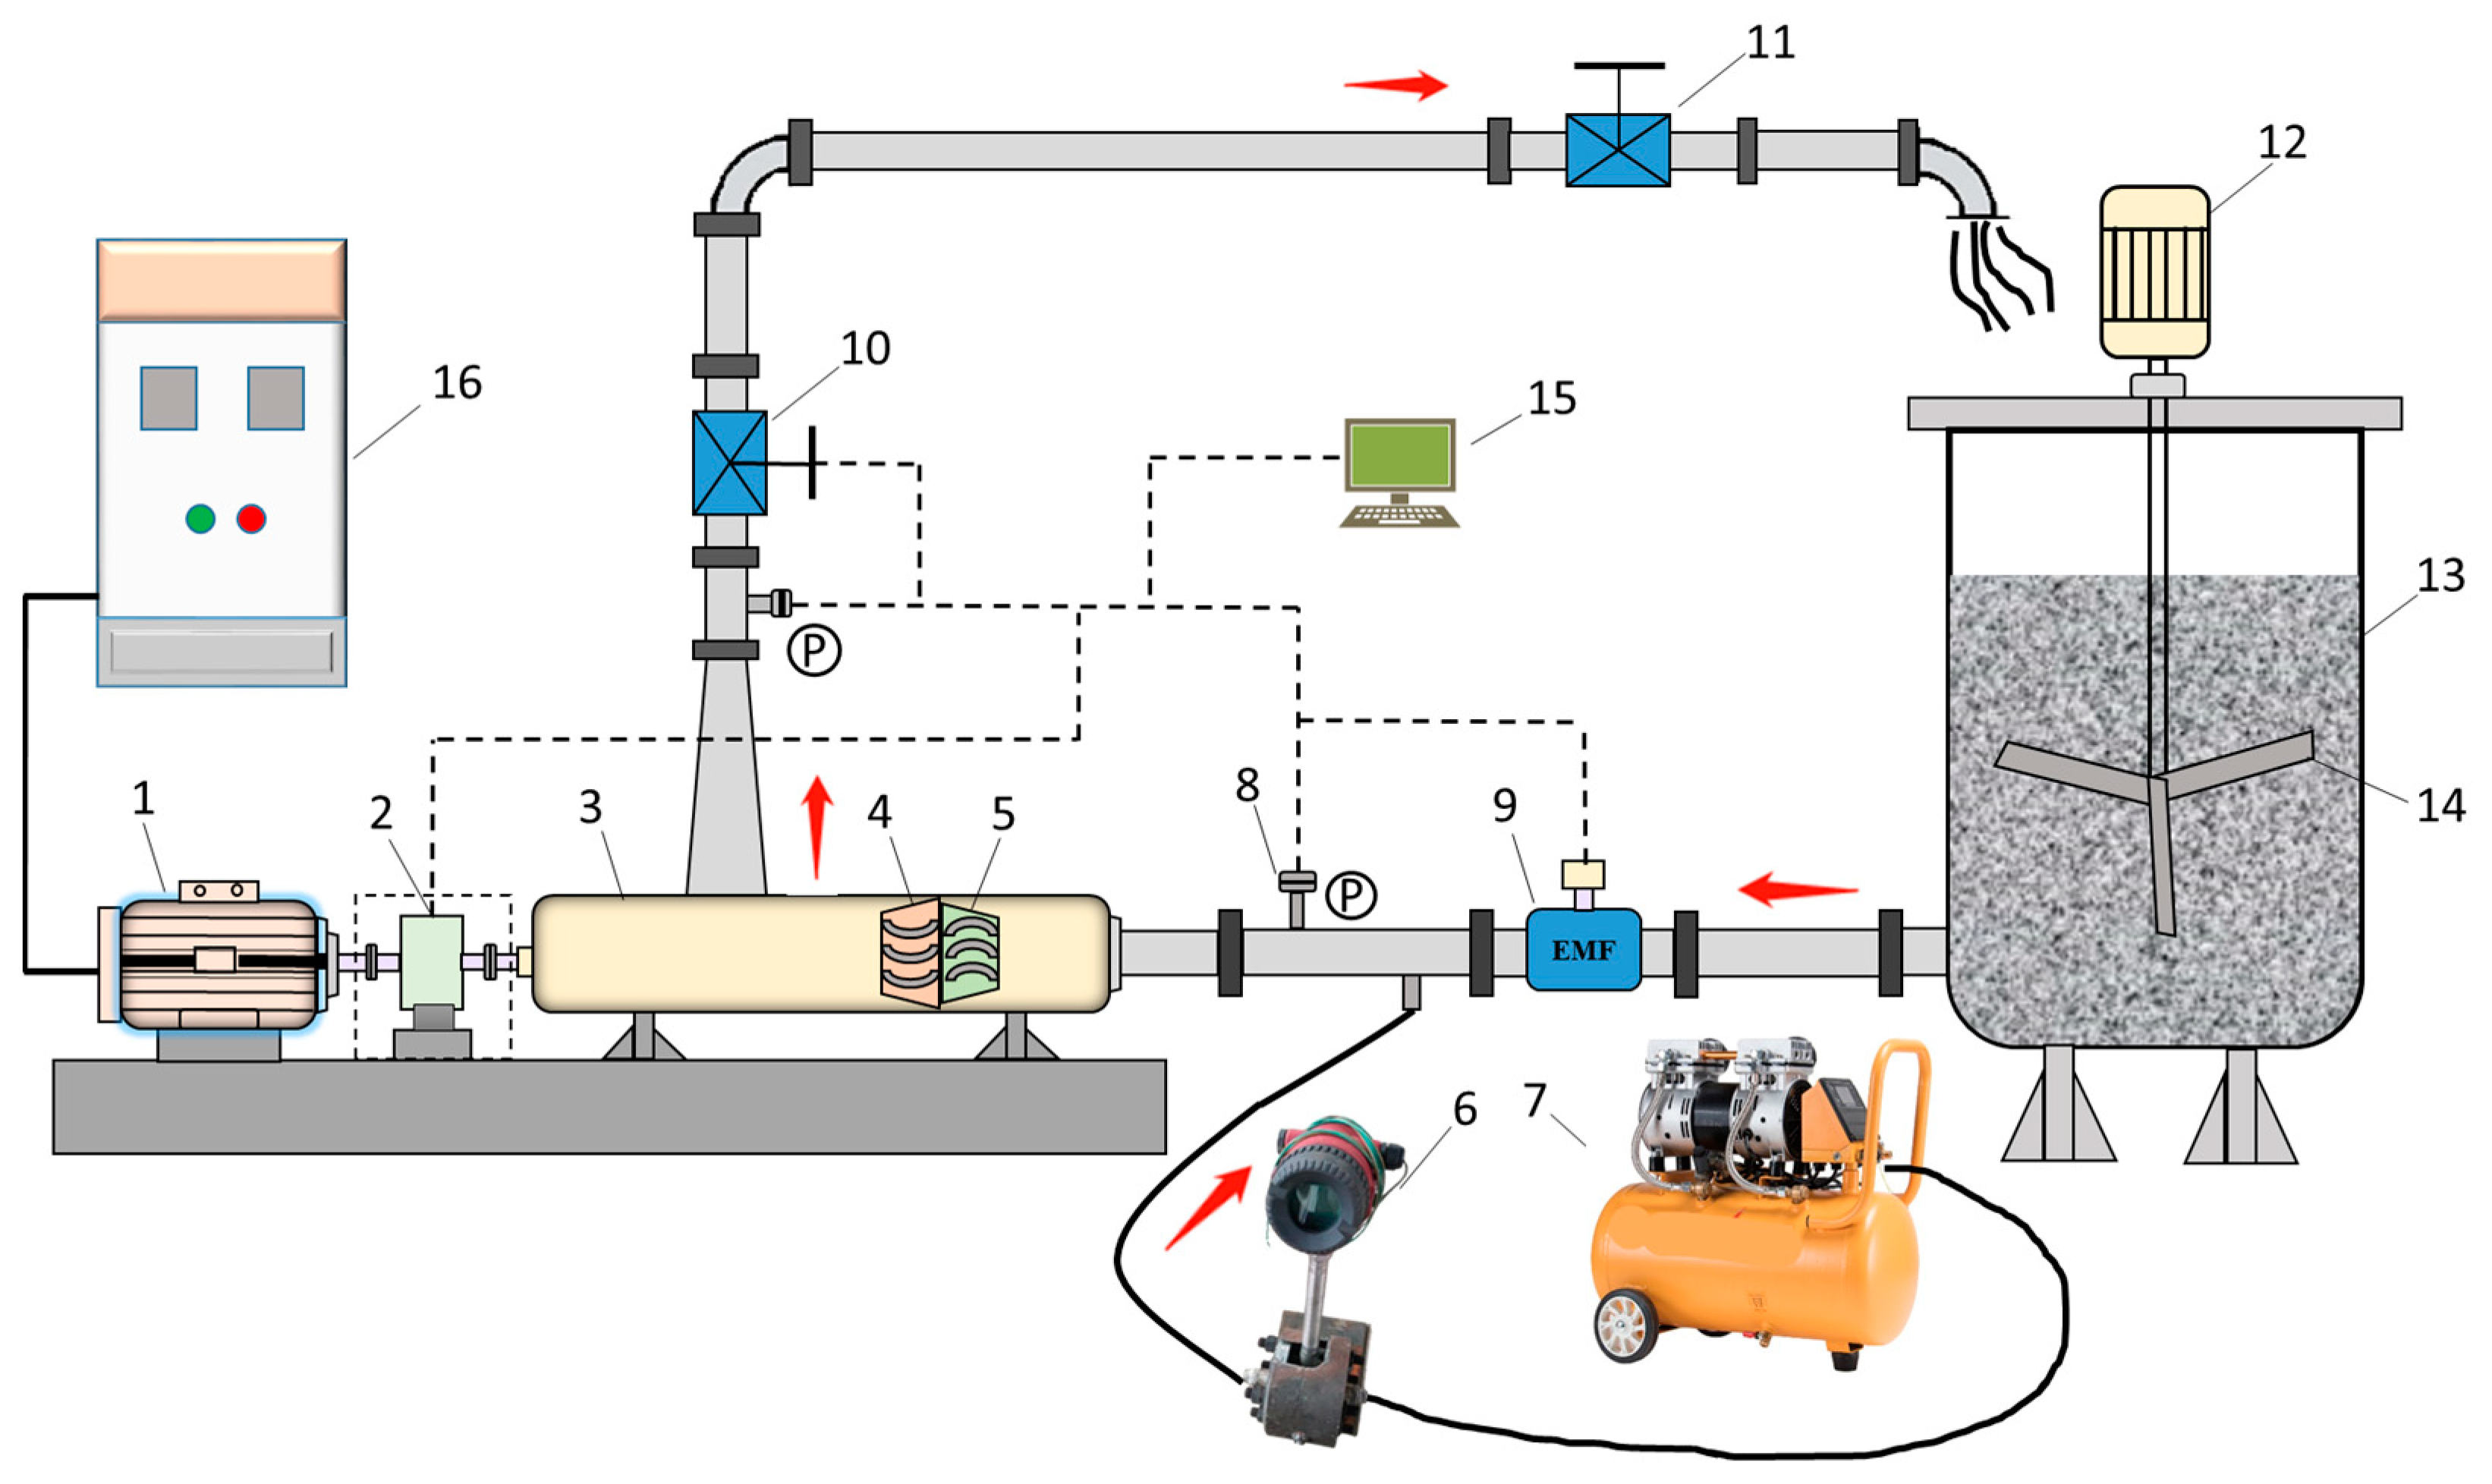
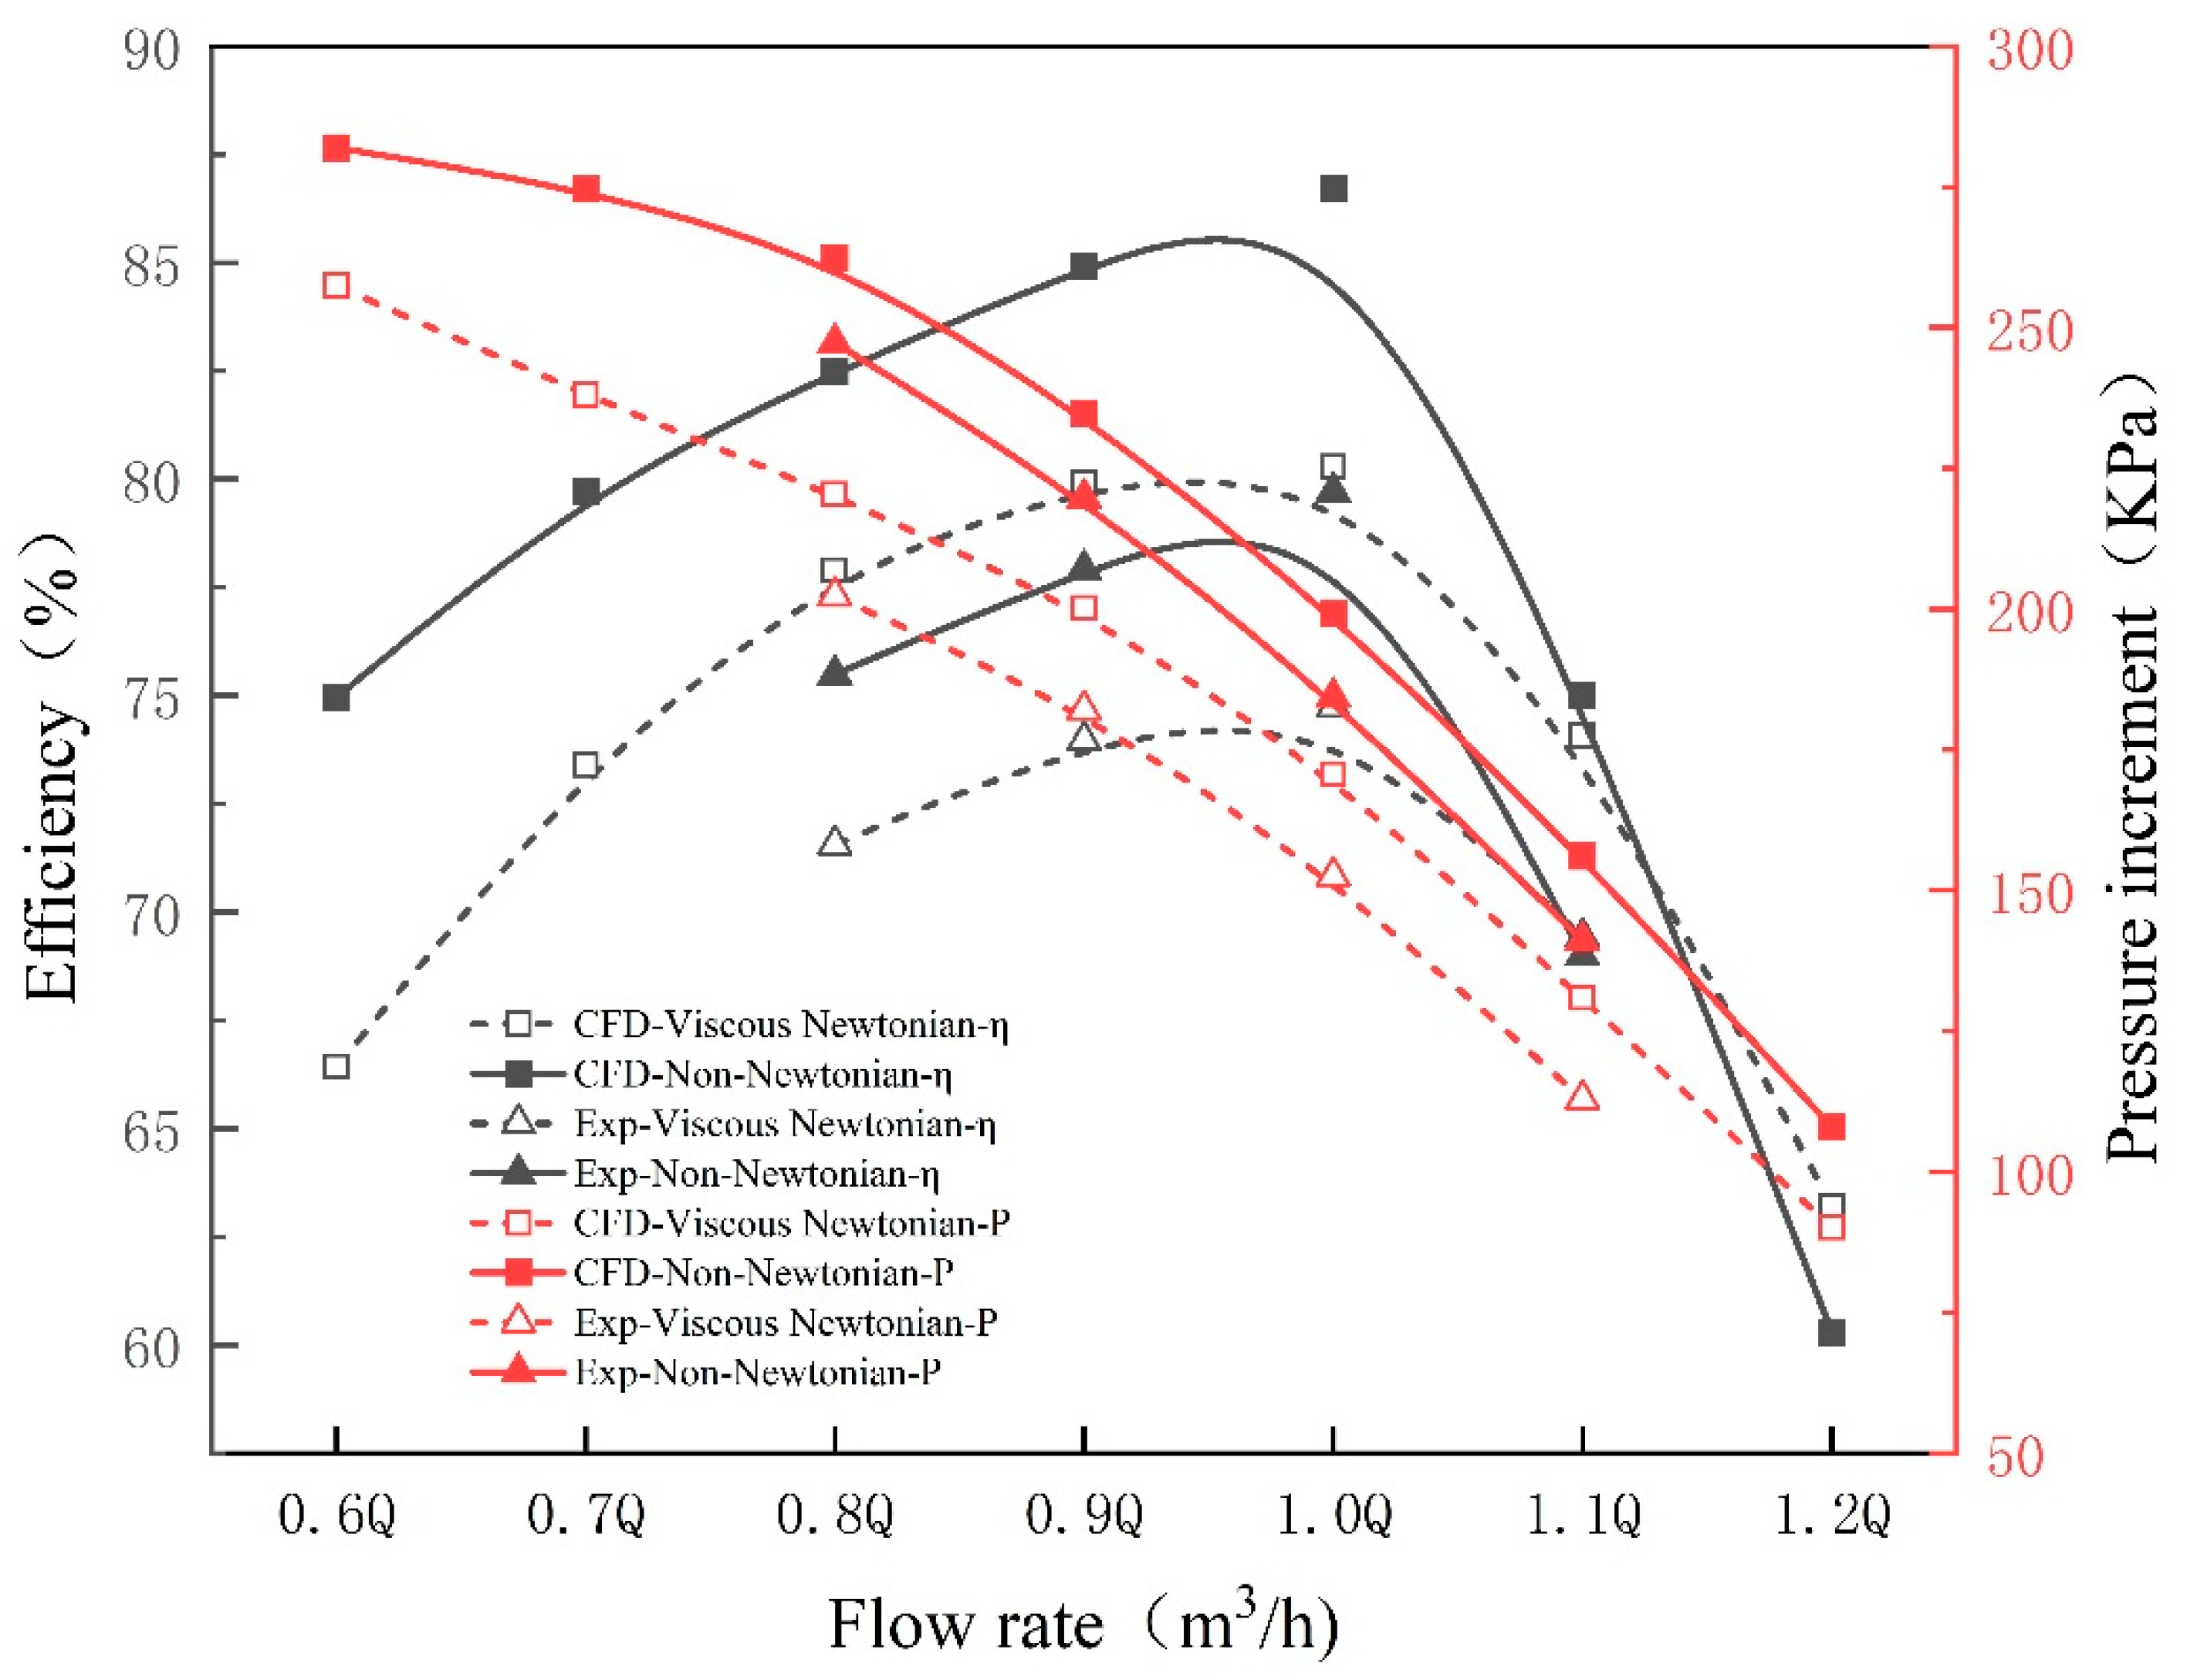
4.1. Validation of the Numerical Method
4.2. Variation of Apparent Viscosity
4.3. Discussion of the Evolution of Vortex Structures
4.4. Discussion of Pressure Fluctuation Characteristics
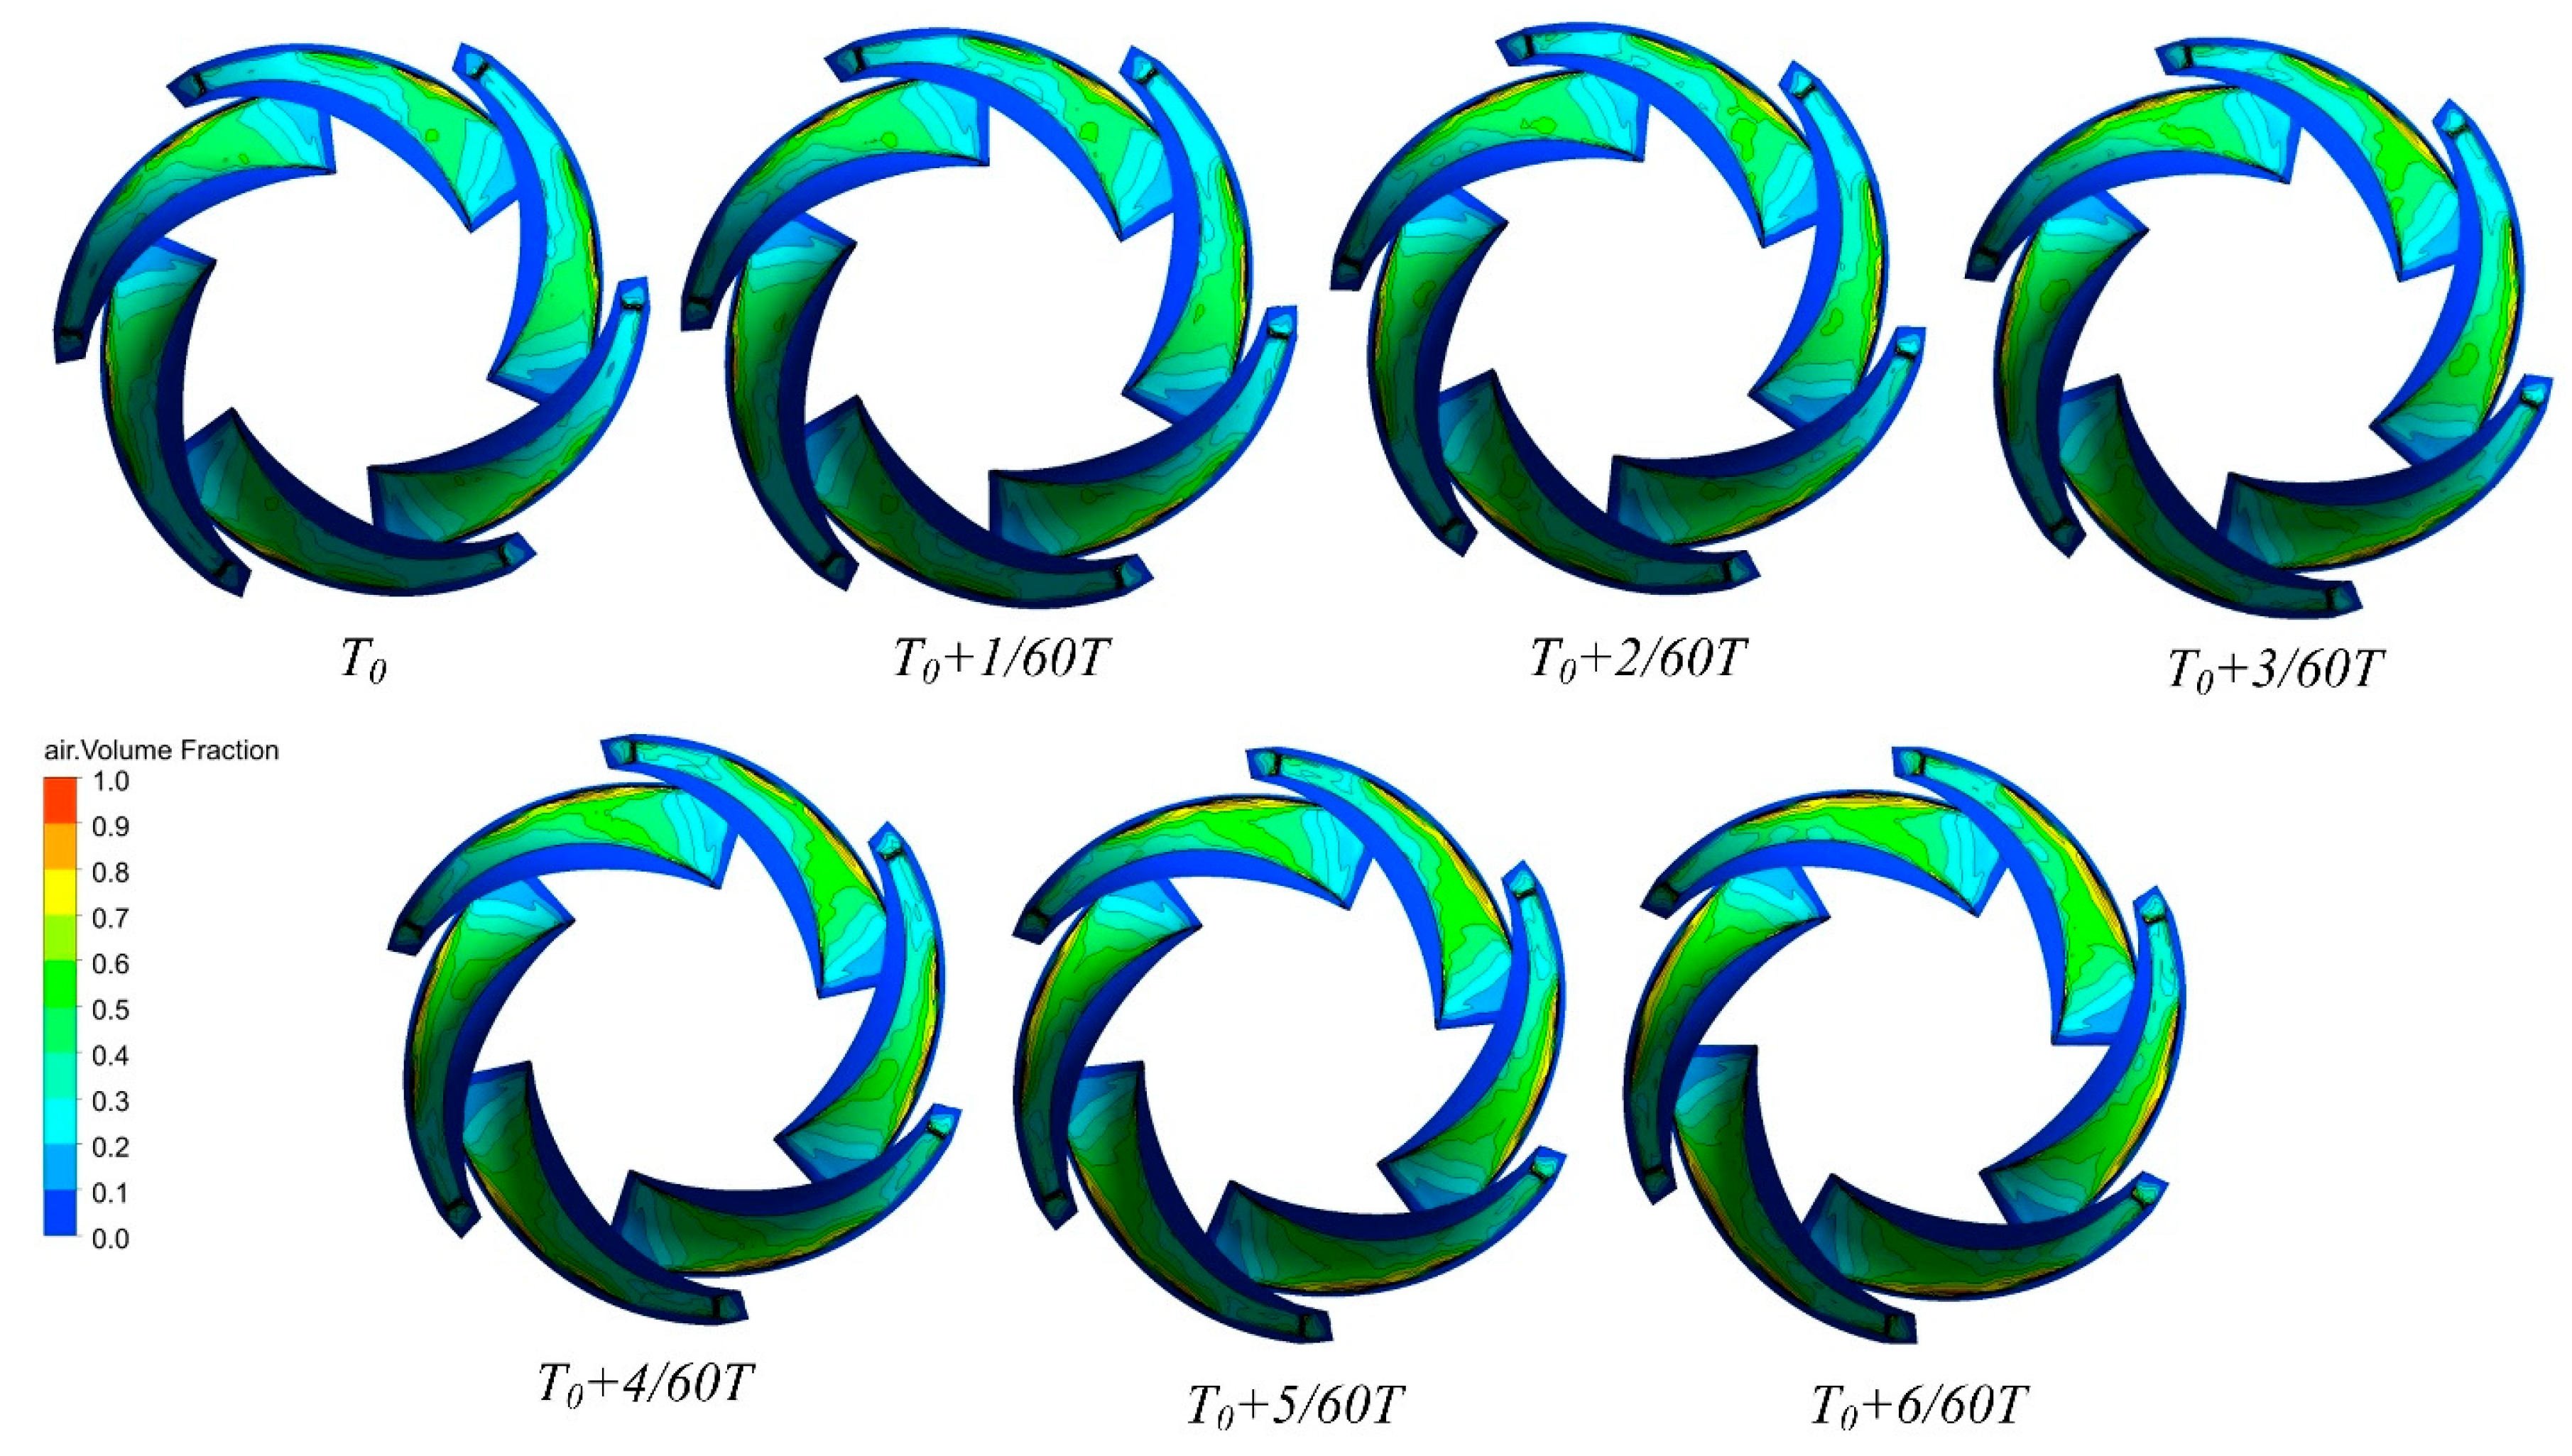
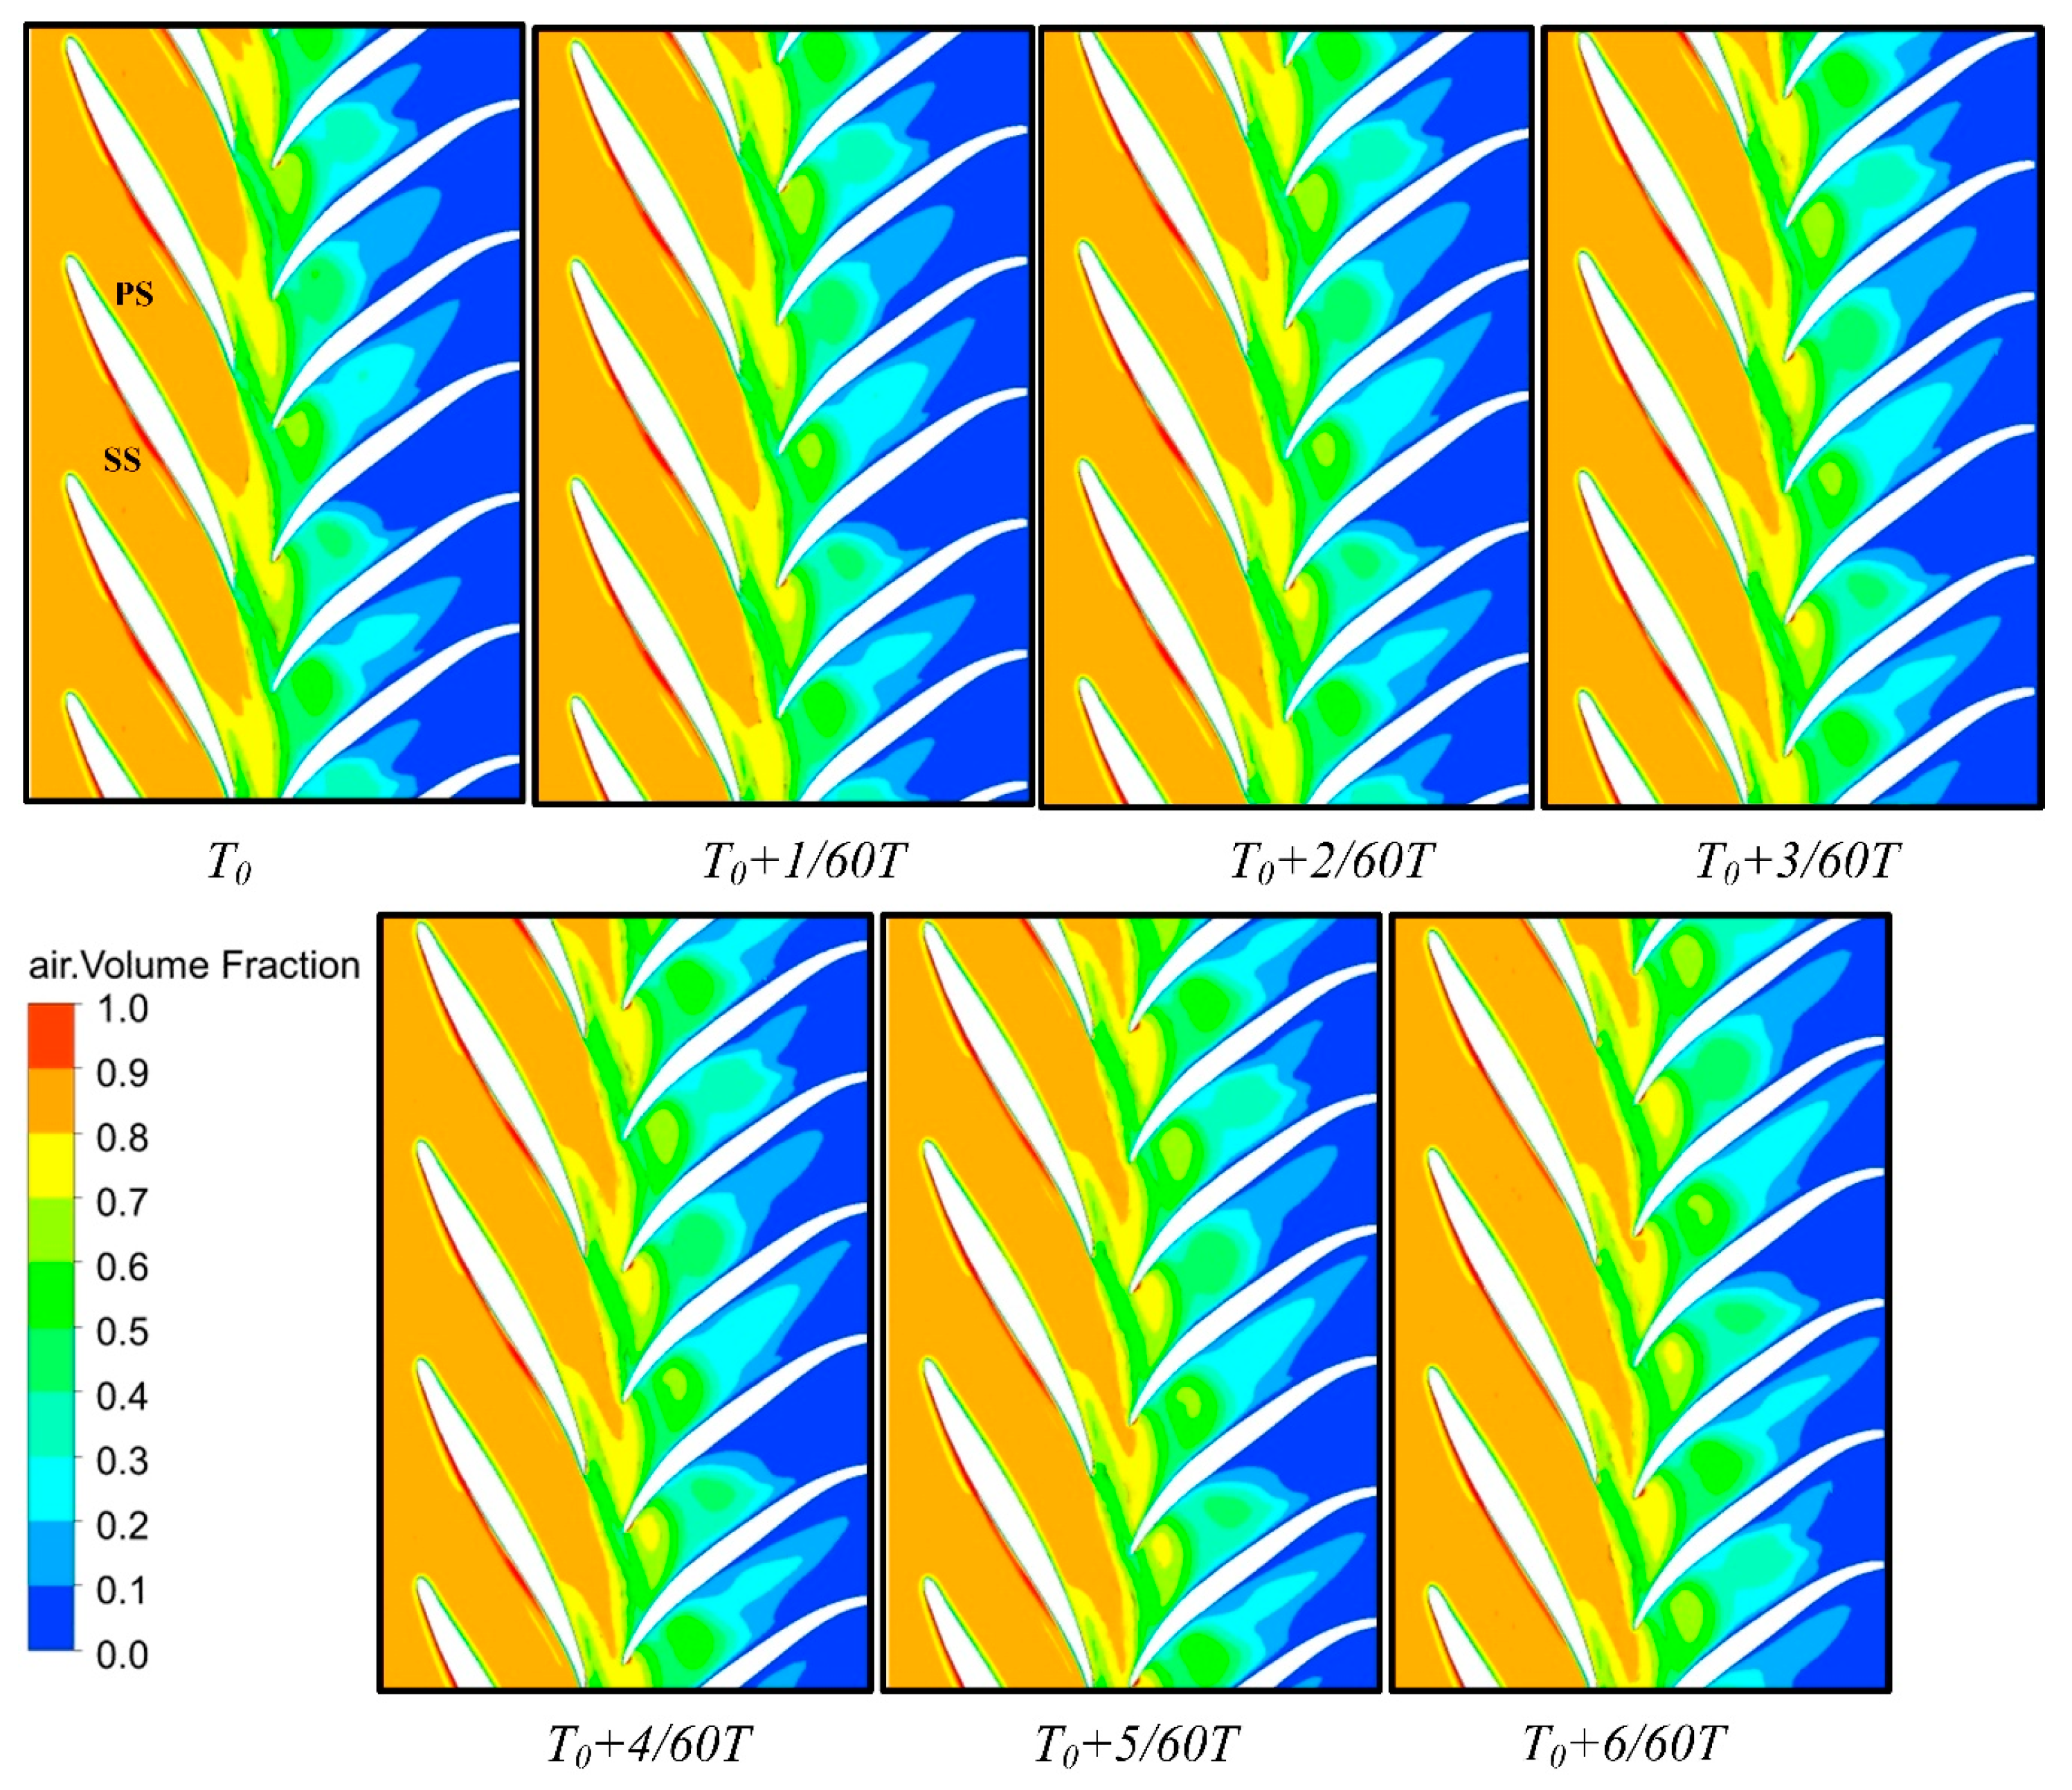
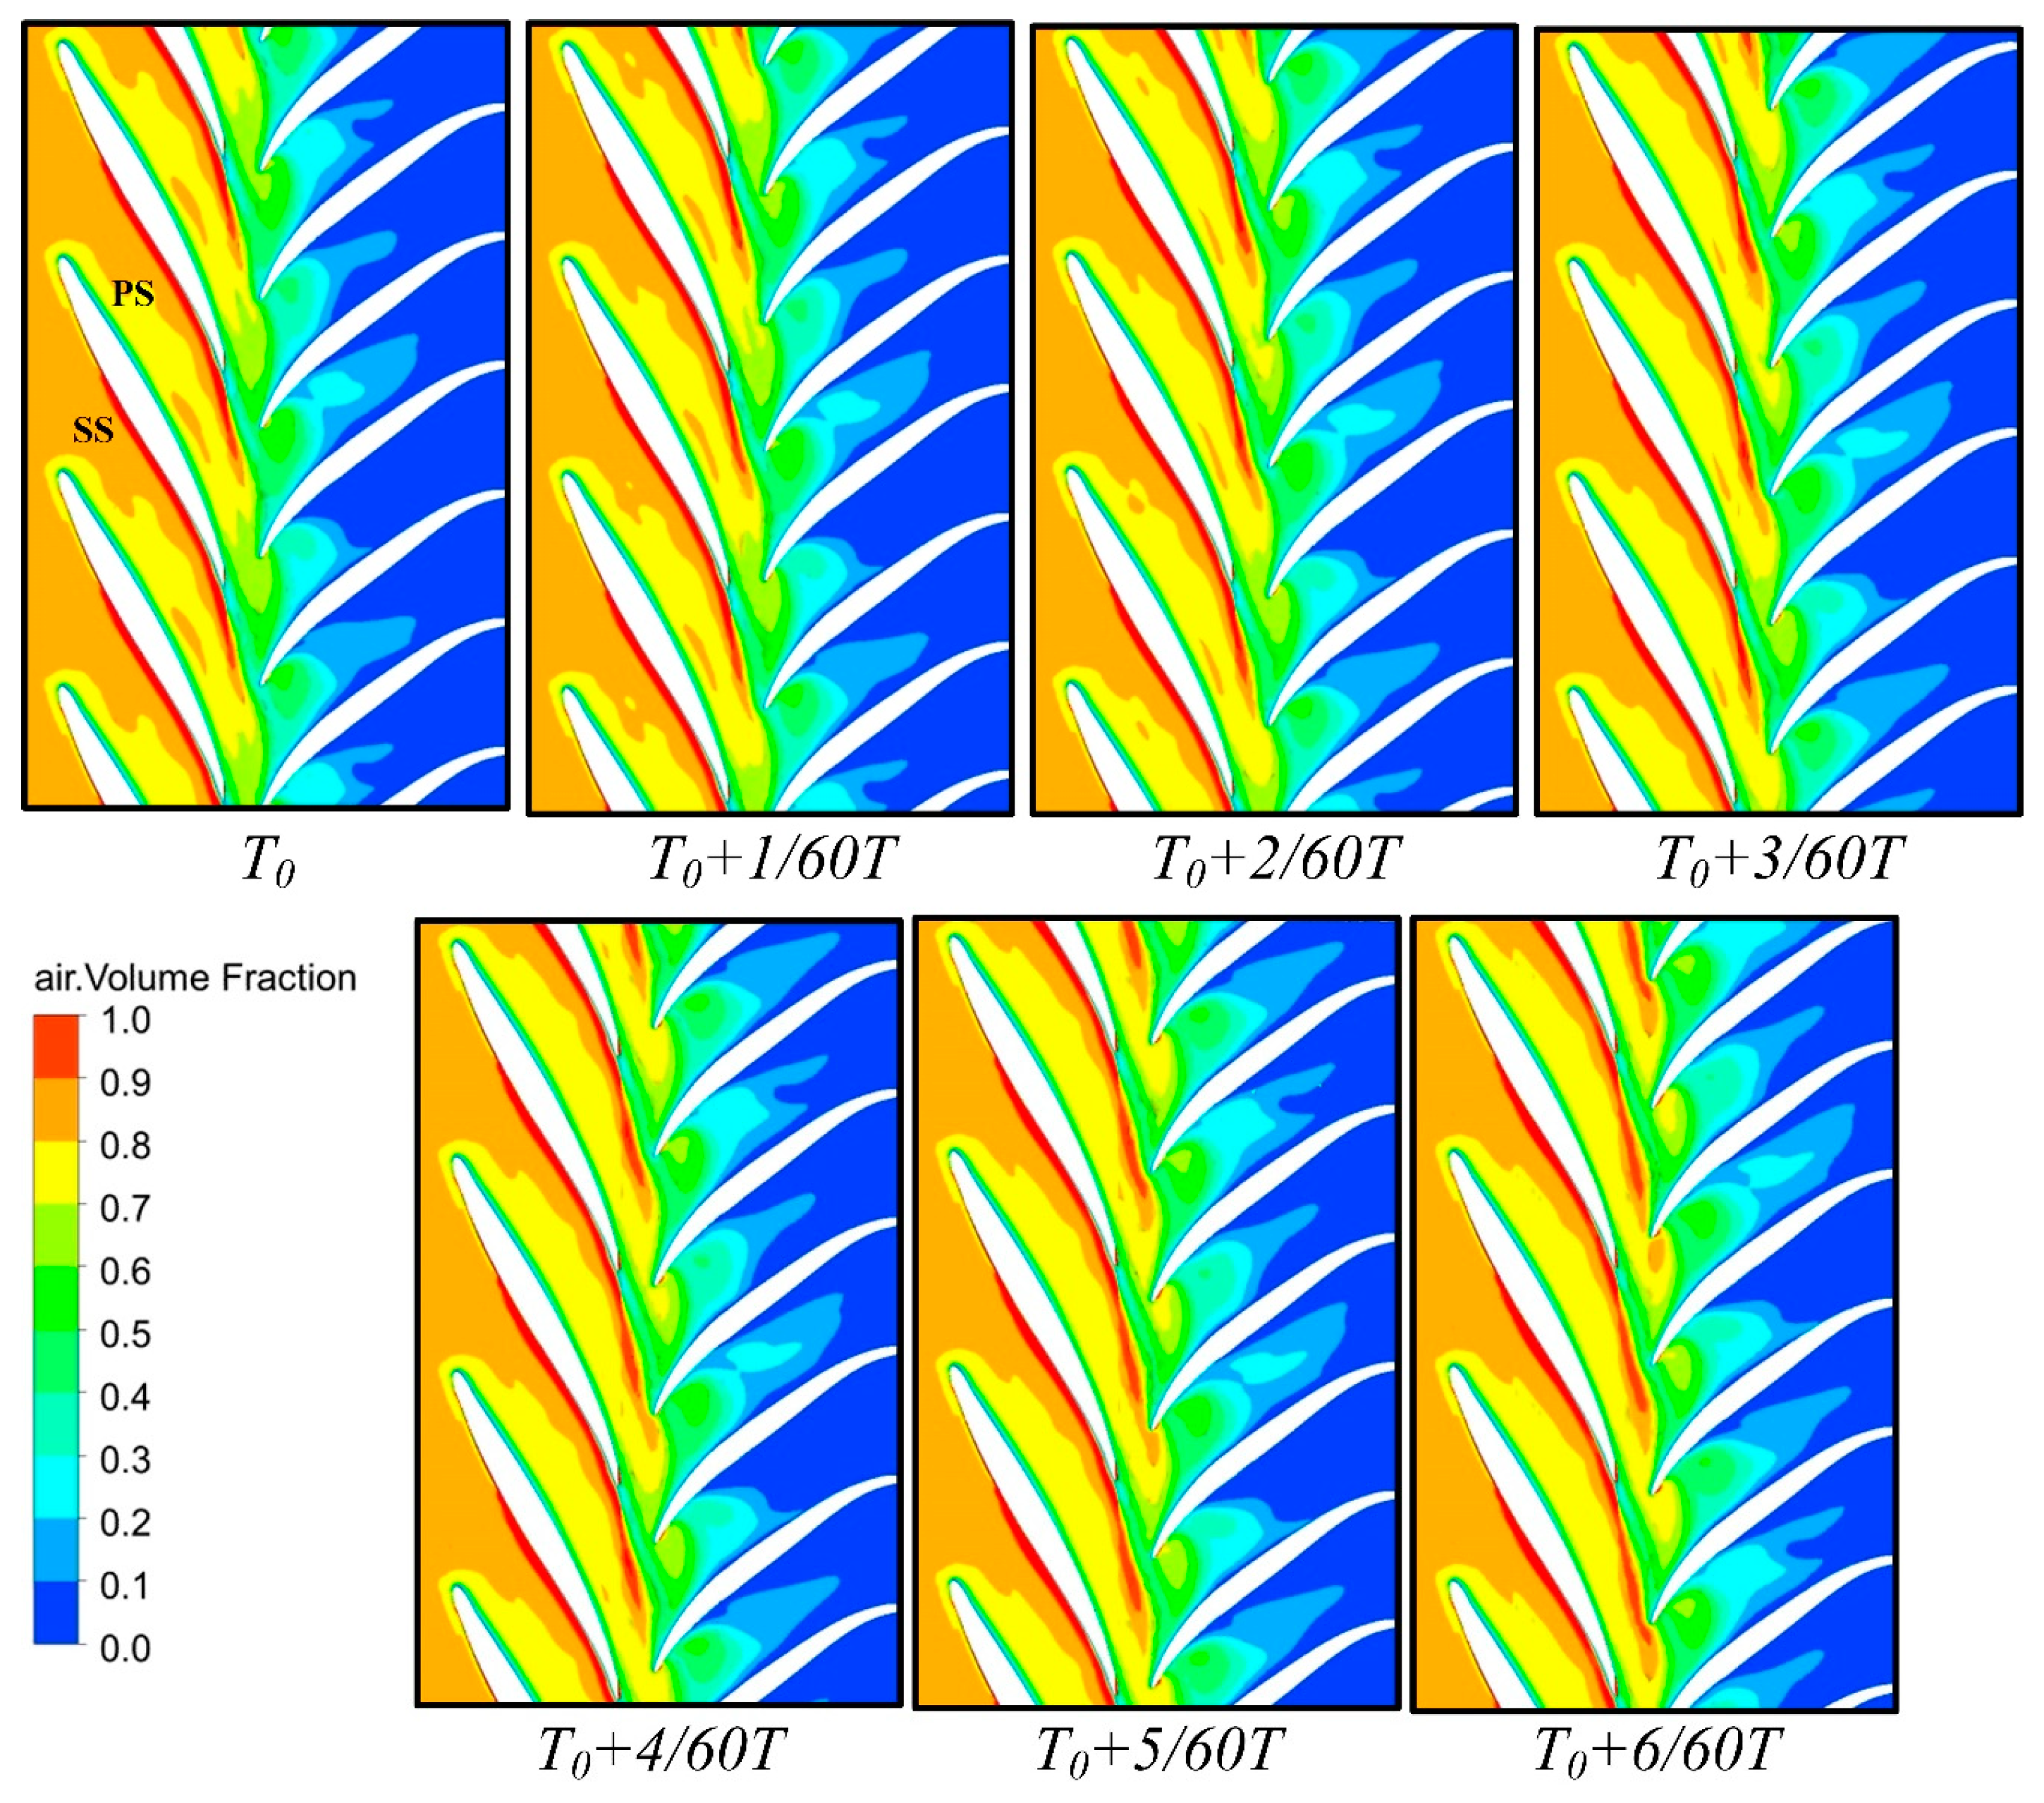
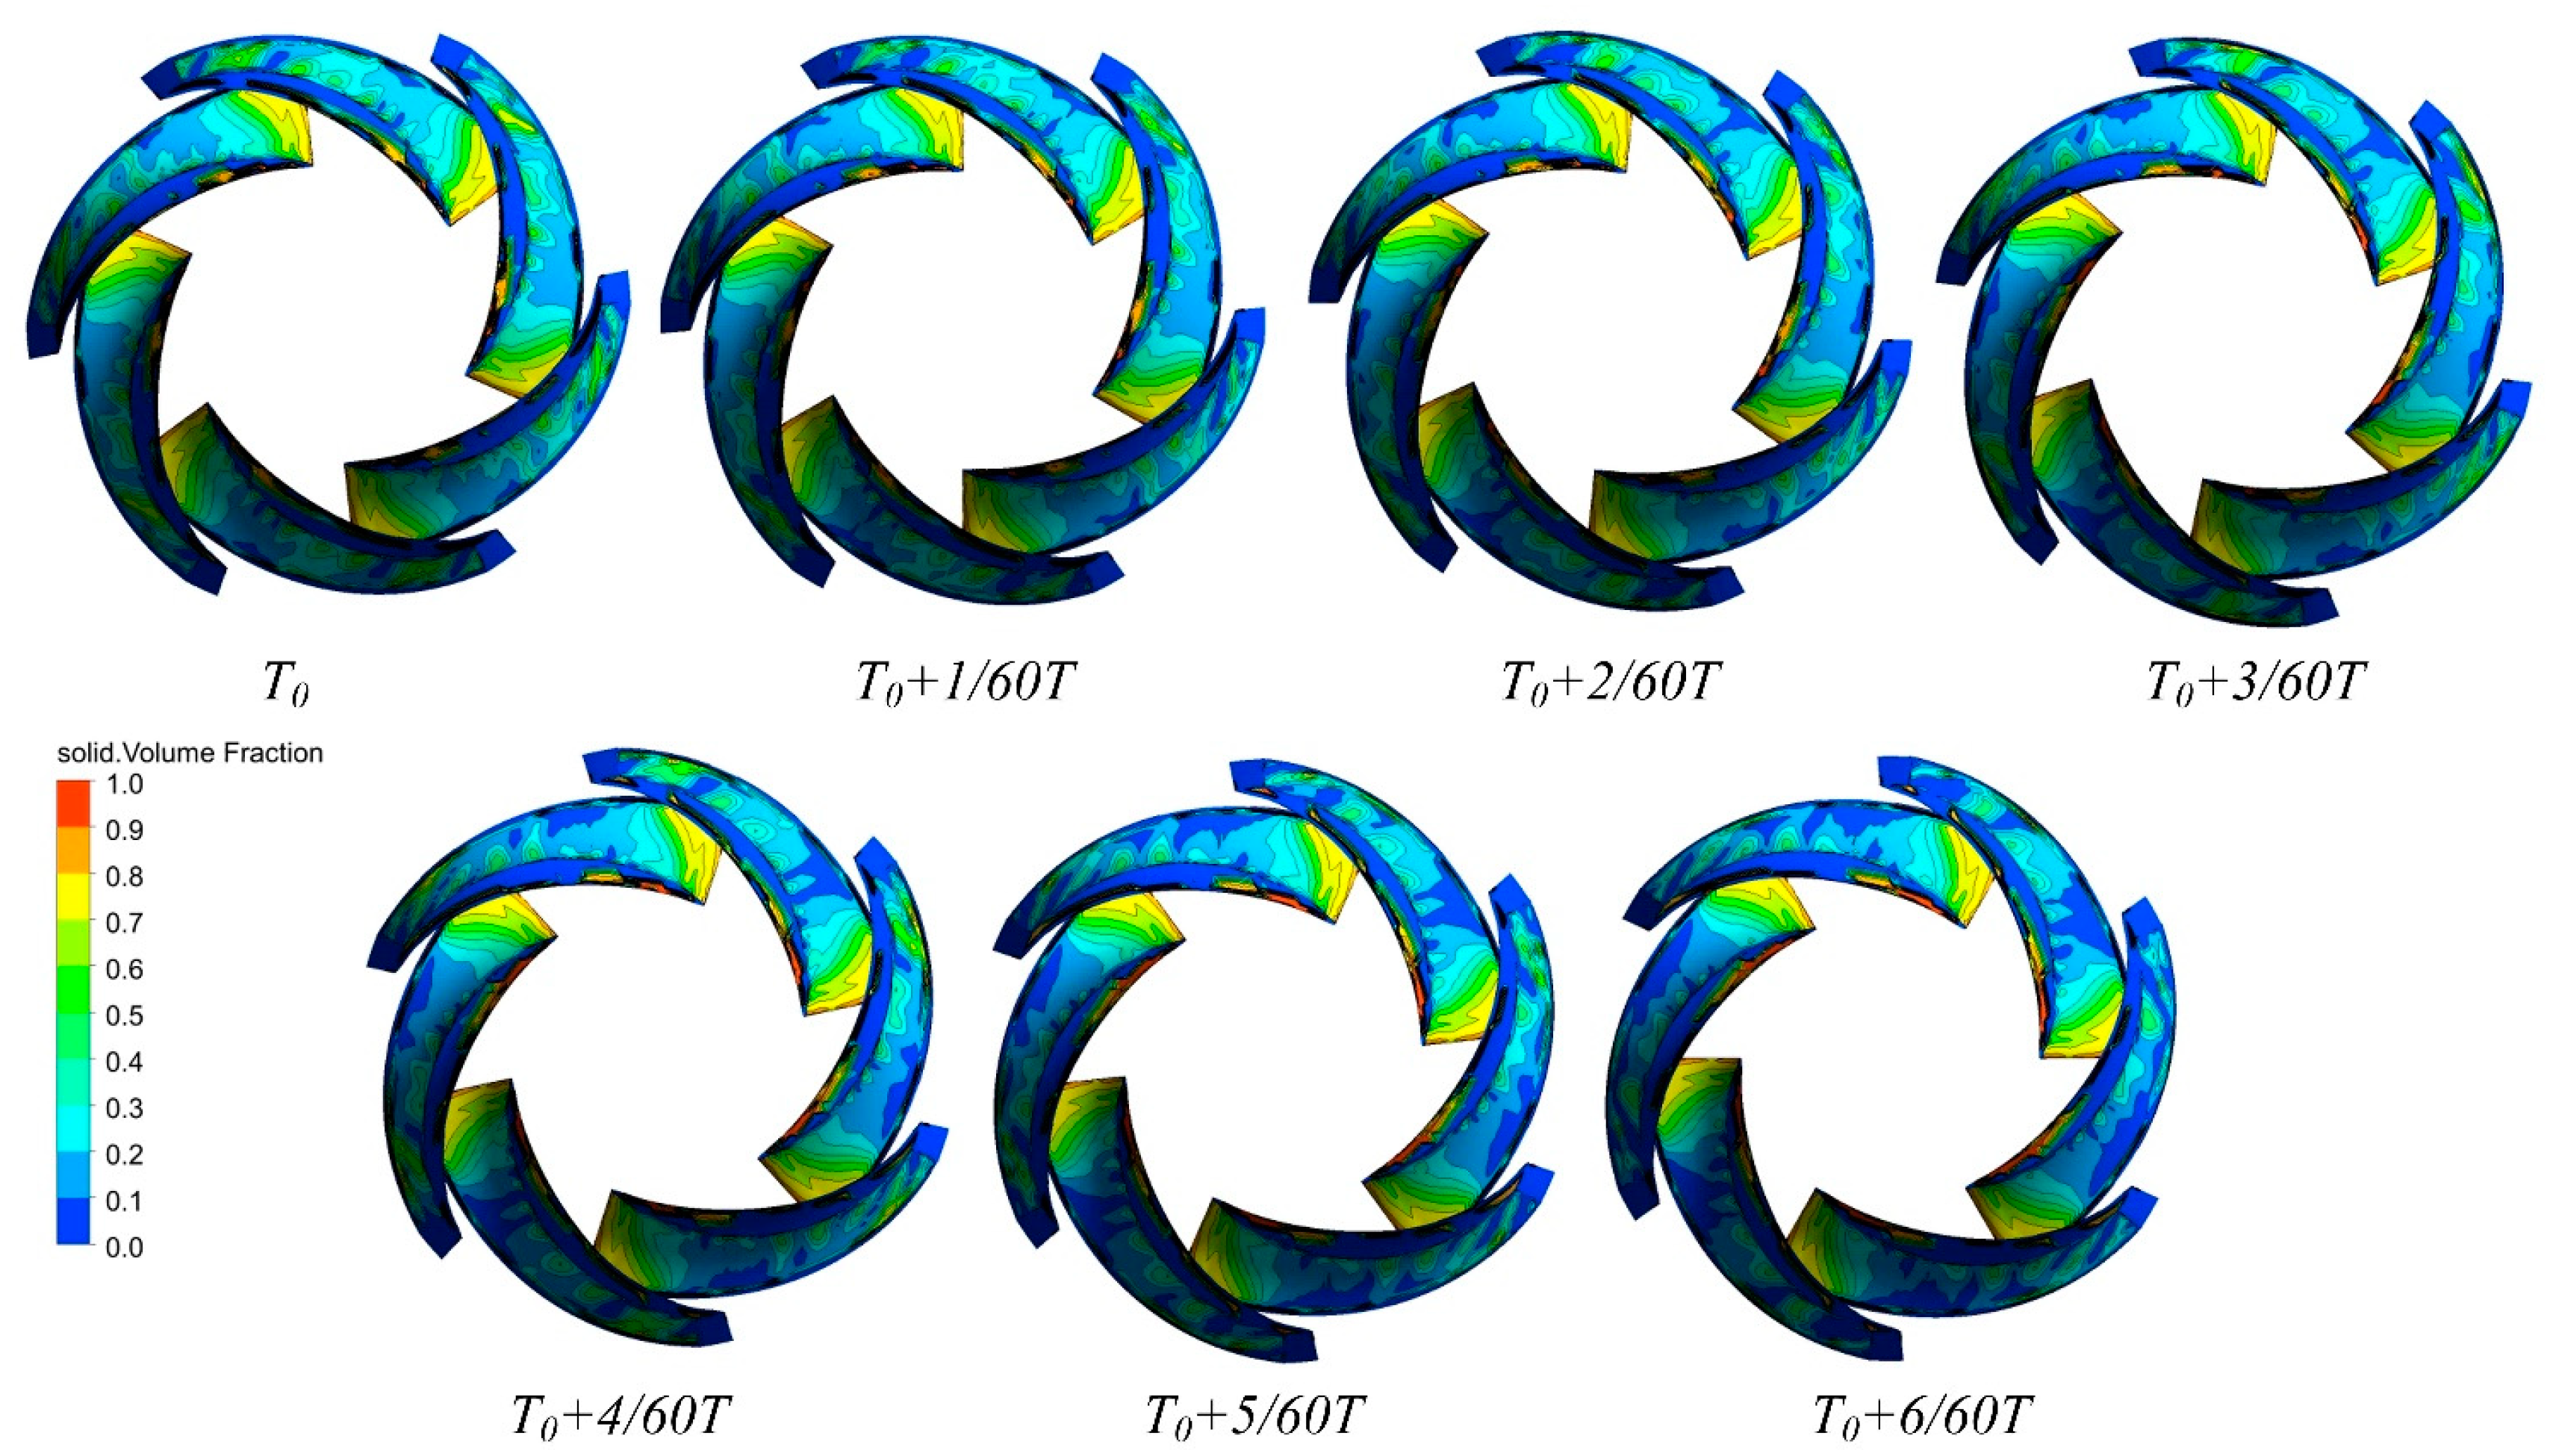
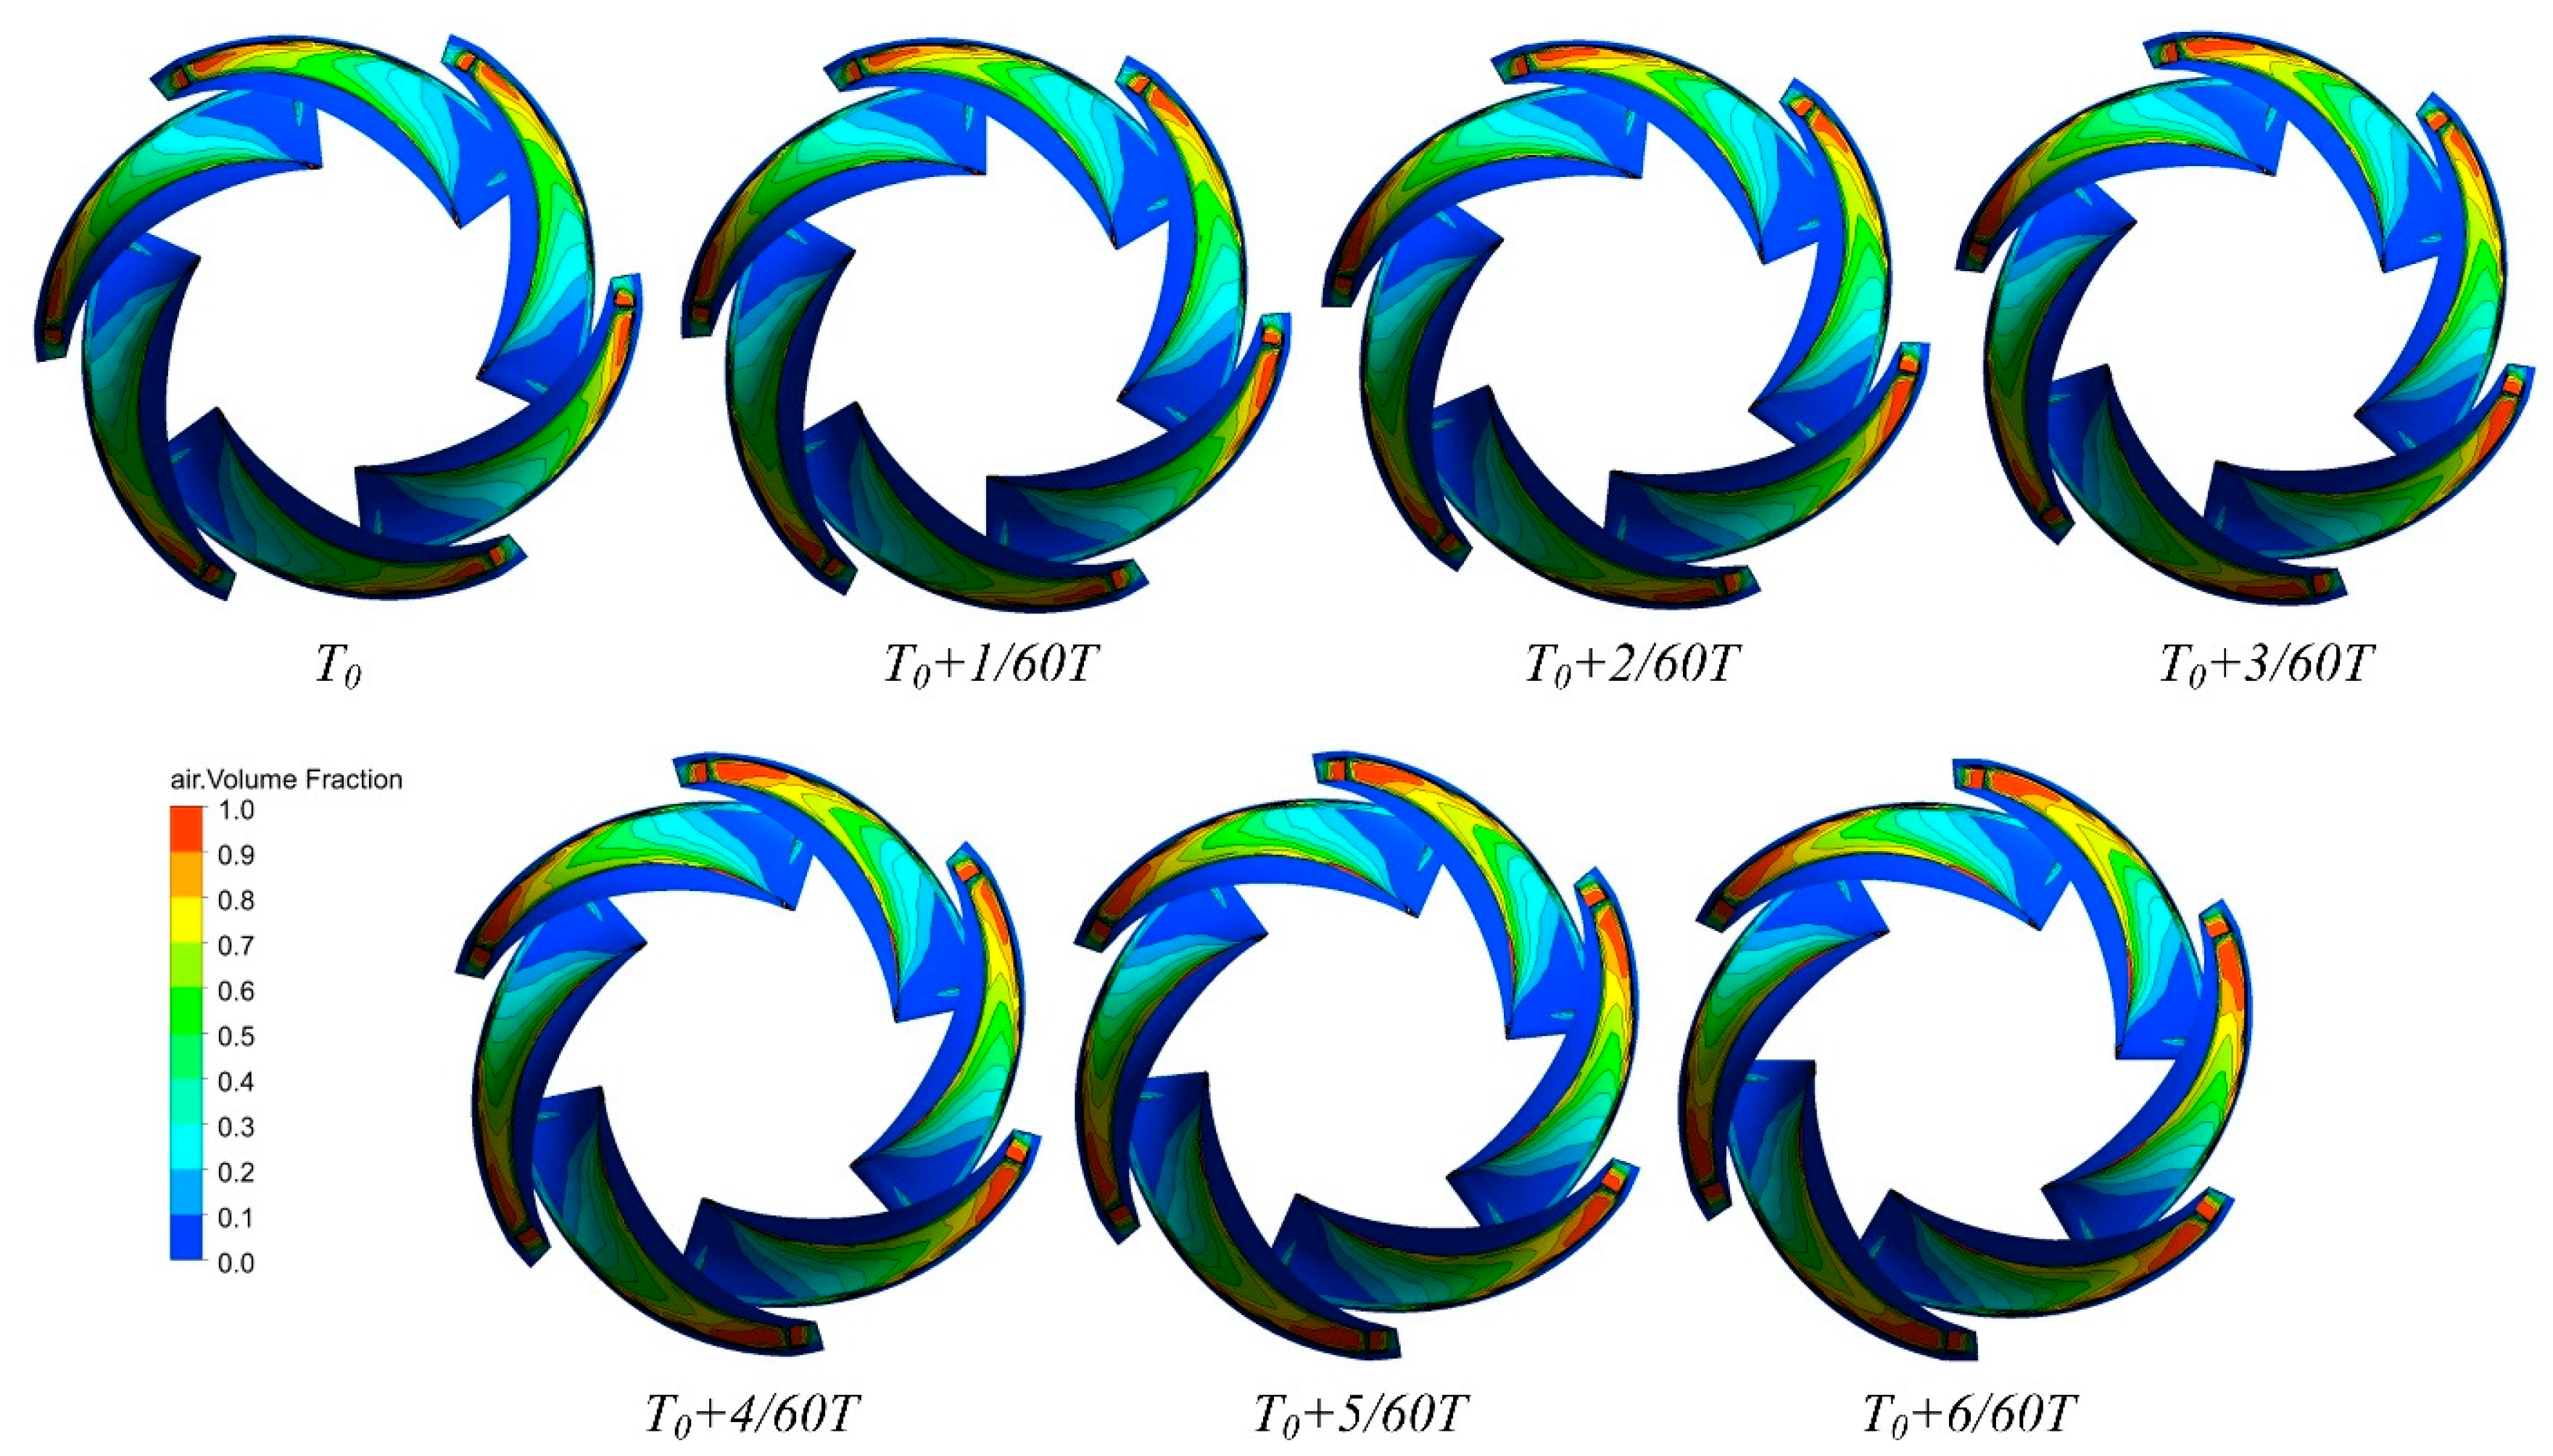
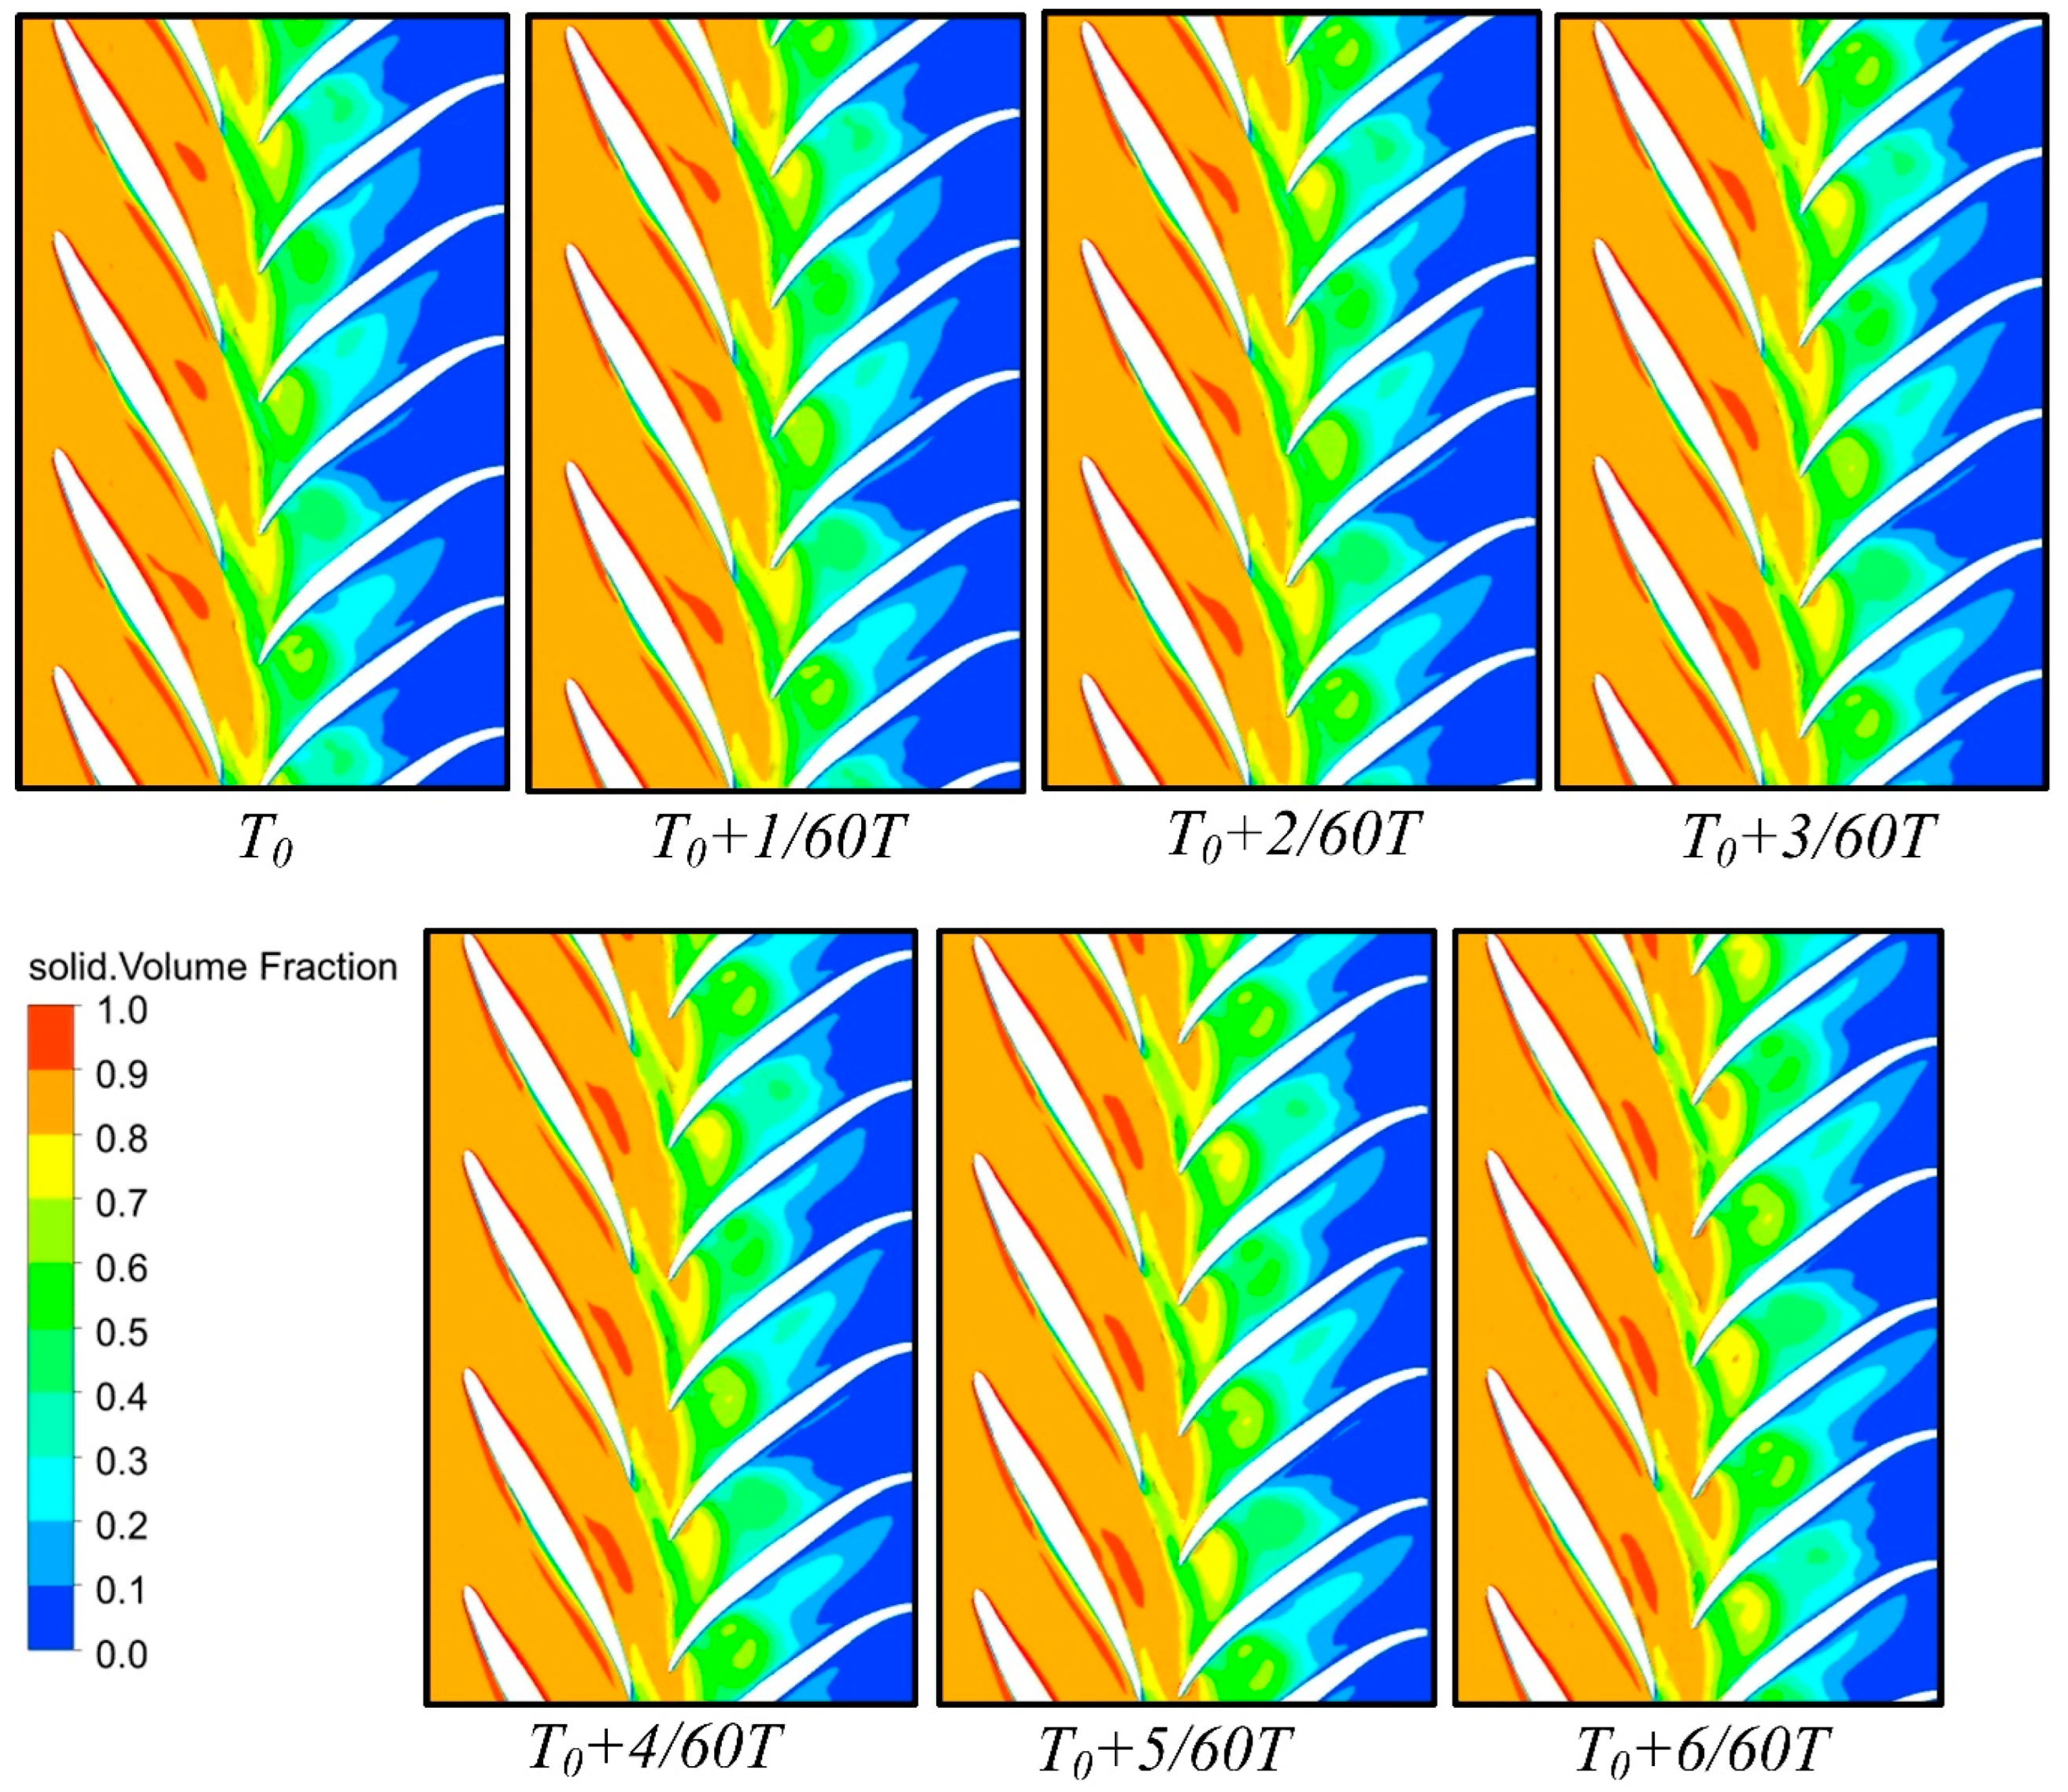
4.5. Influence of Gas-Solid Two-Phase Distribution
5. Conclusions
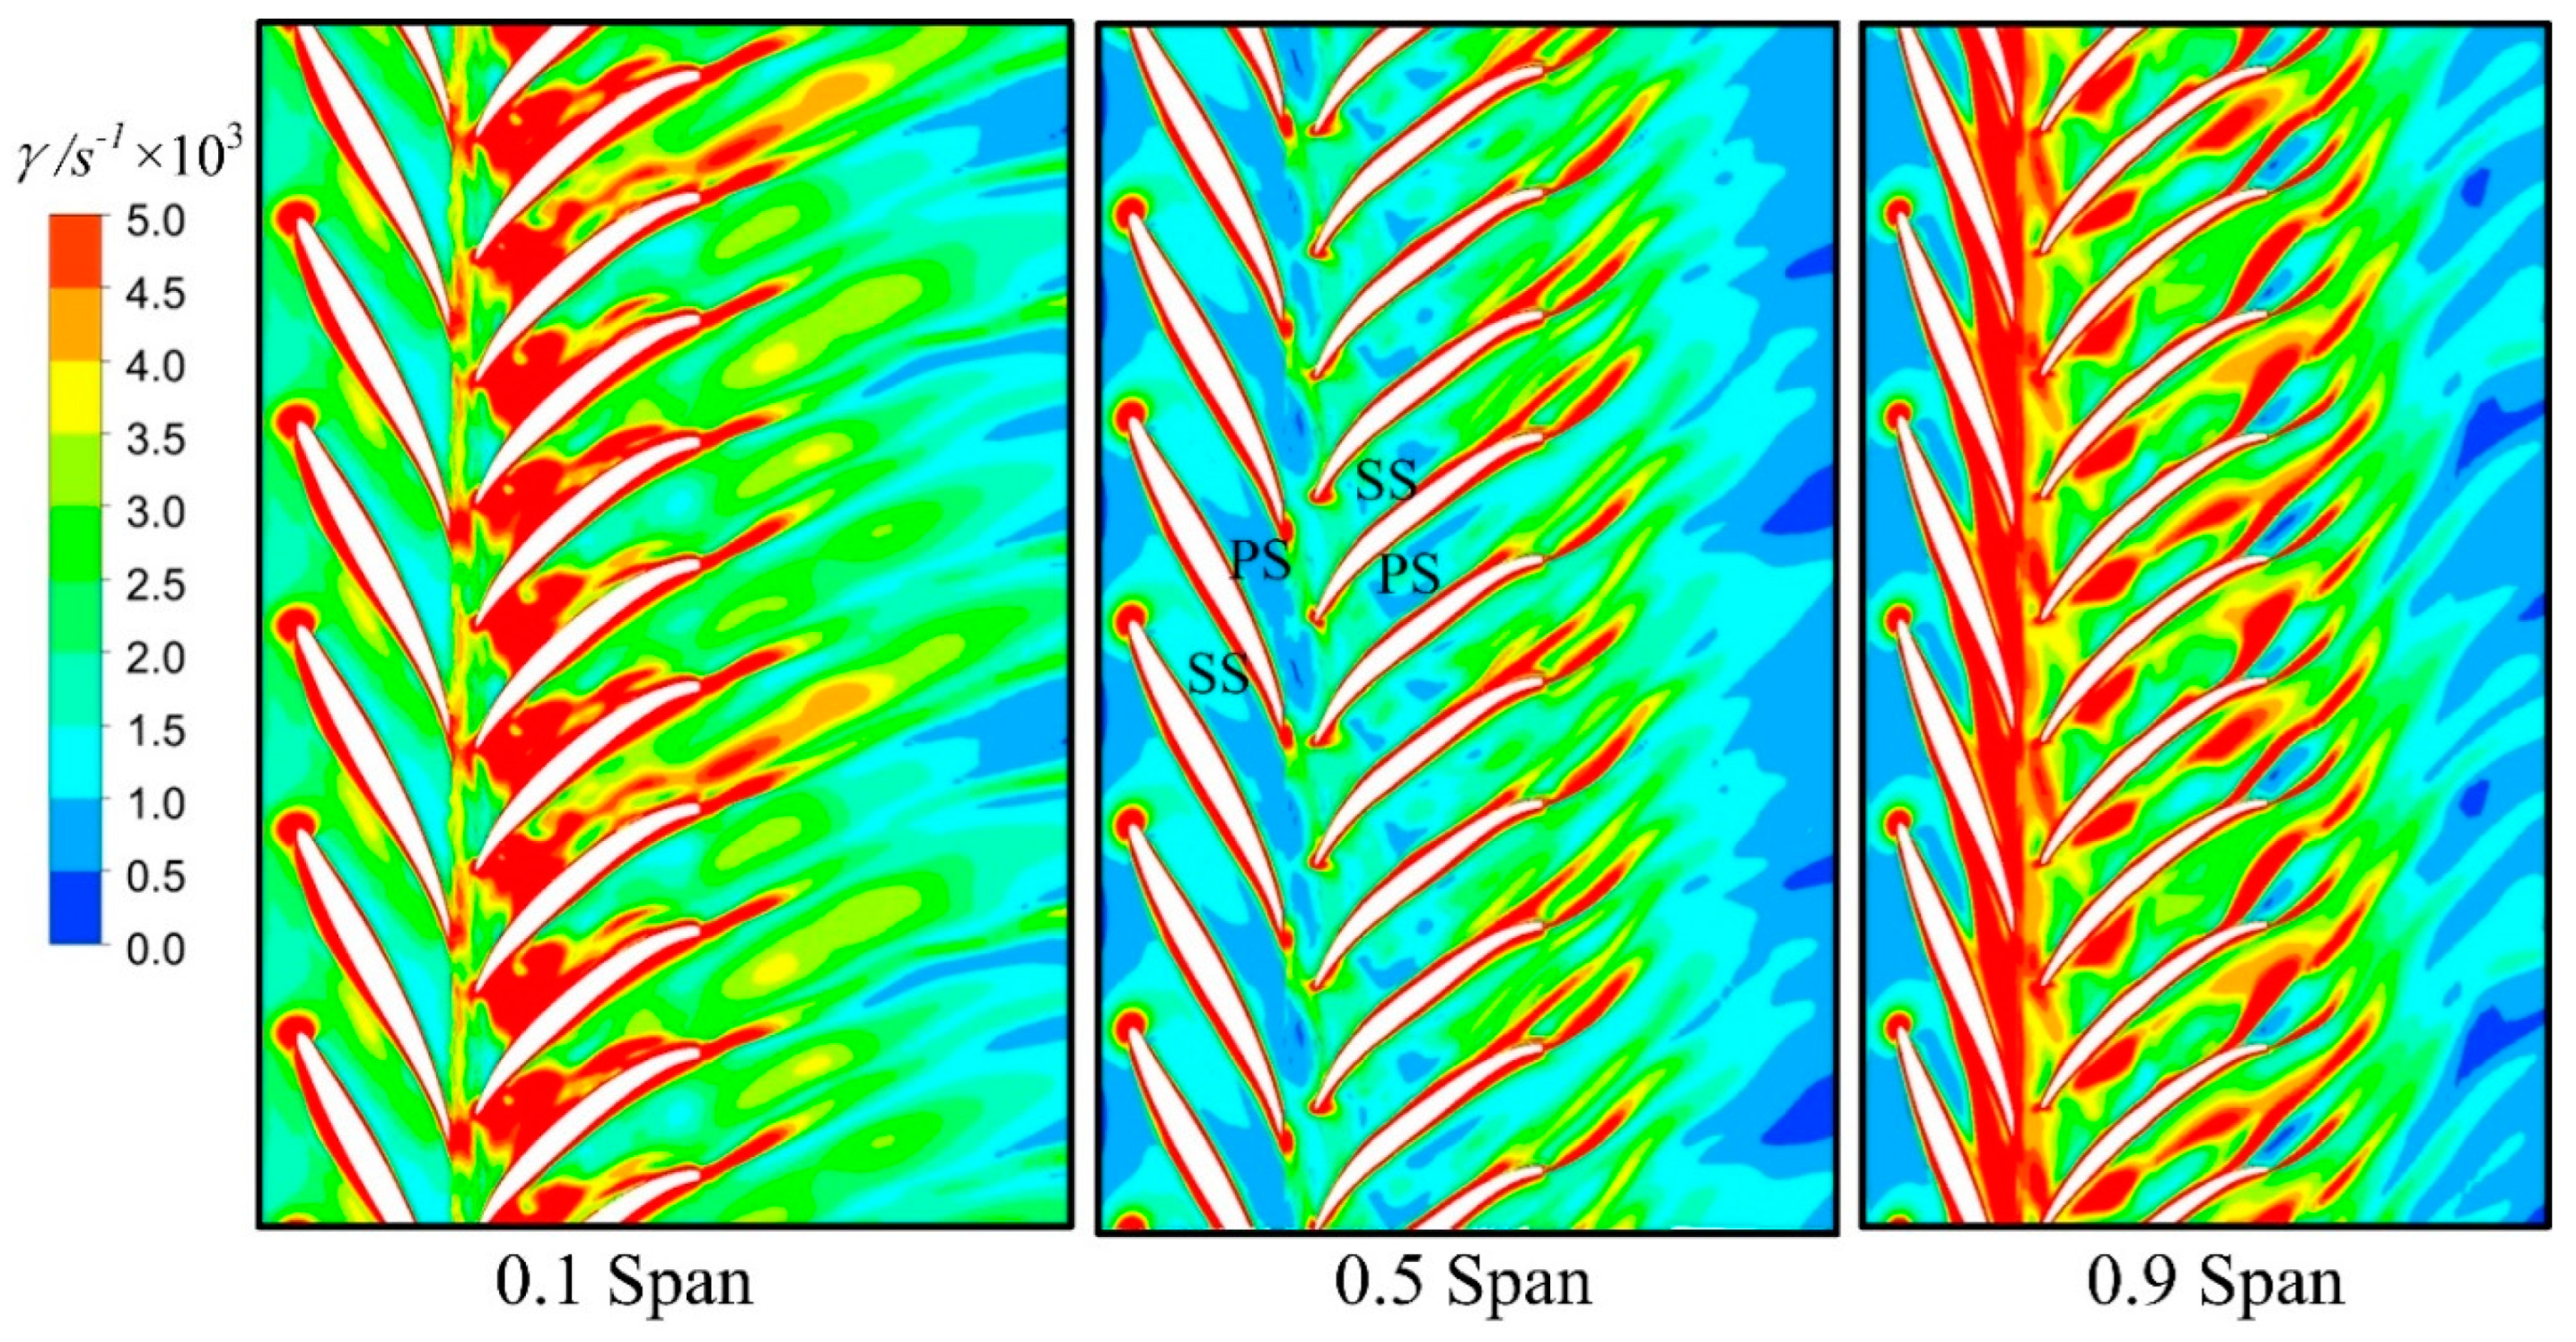
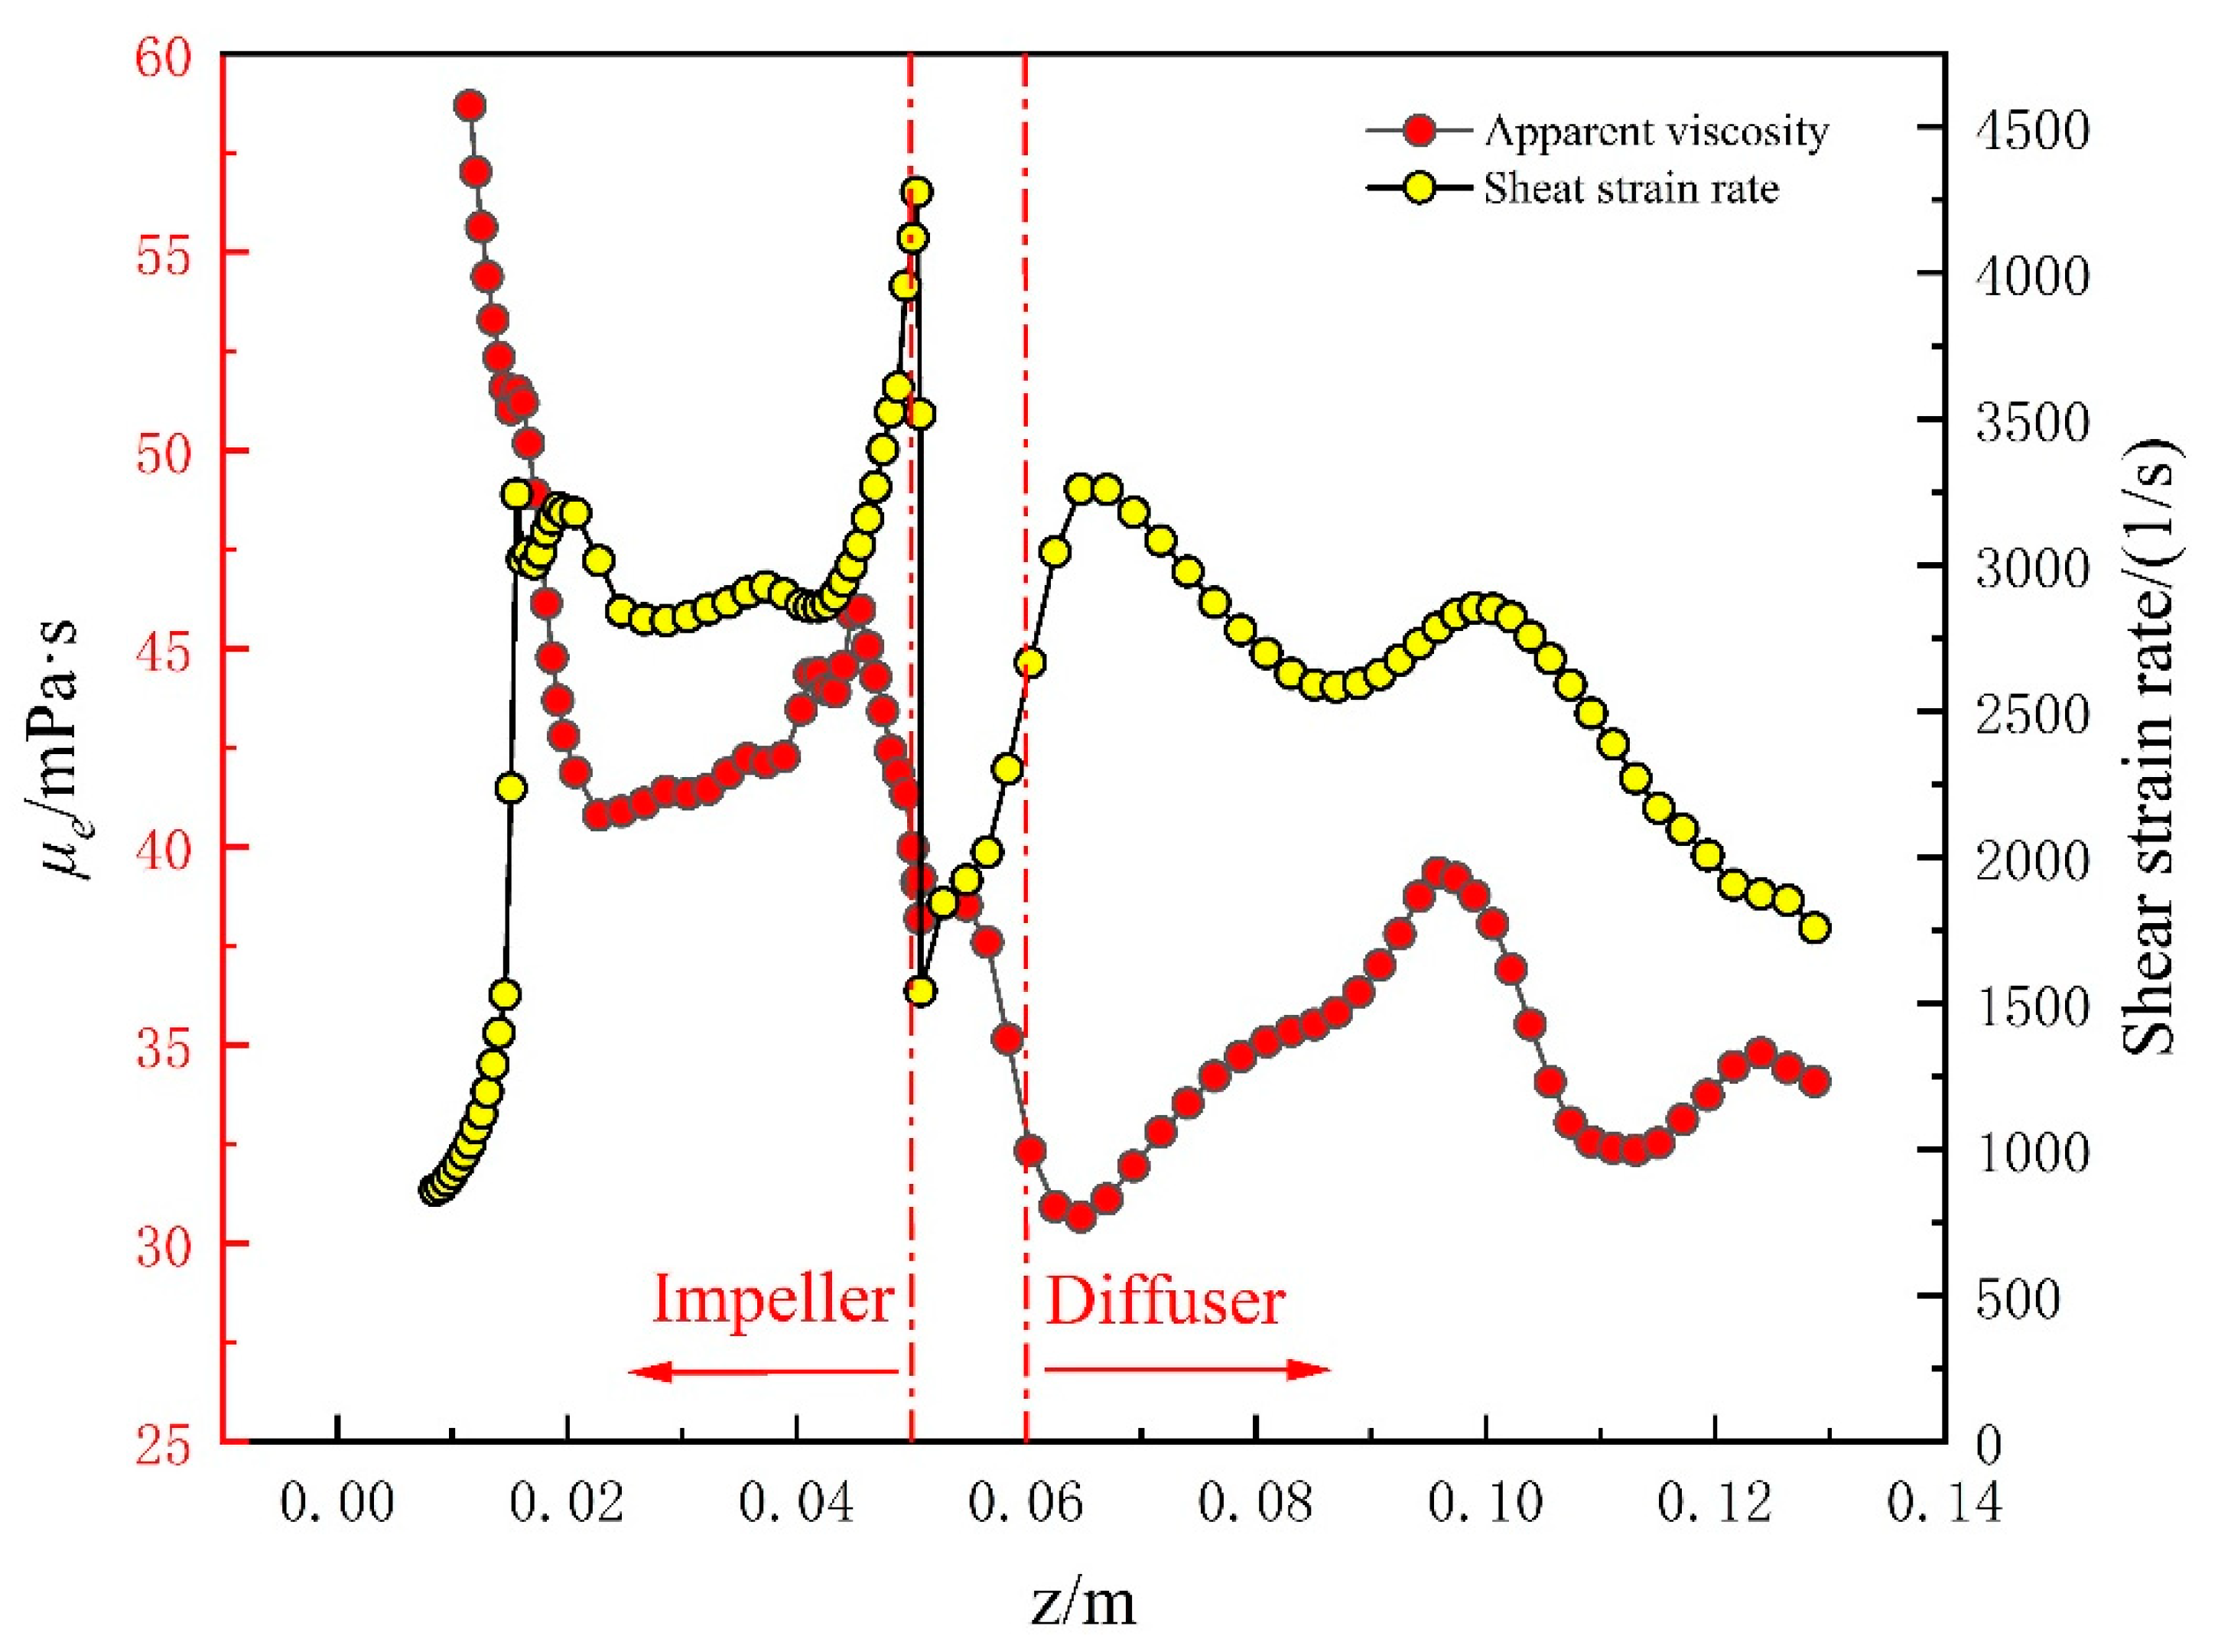
- The shear rate in the impeller is significantly higher than that in the diffuser, but the apparent viscosity changes considerably in the rear region of the diffuser. The presence of trailing-edge separation vortices significantly contributes to pronounced fluctuations in apparent viscosity at this location.
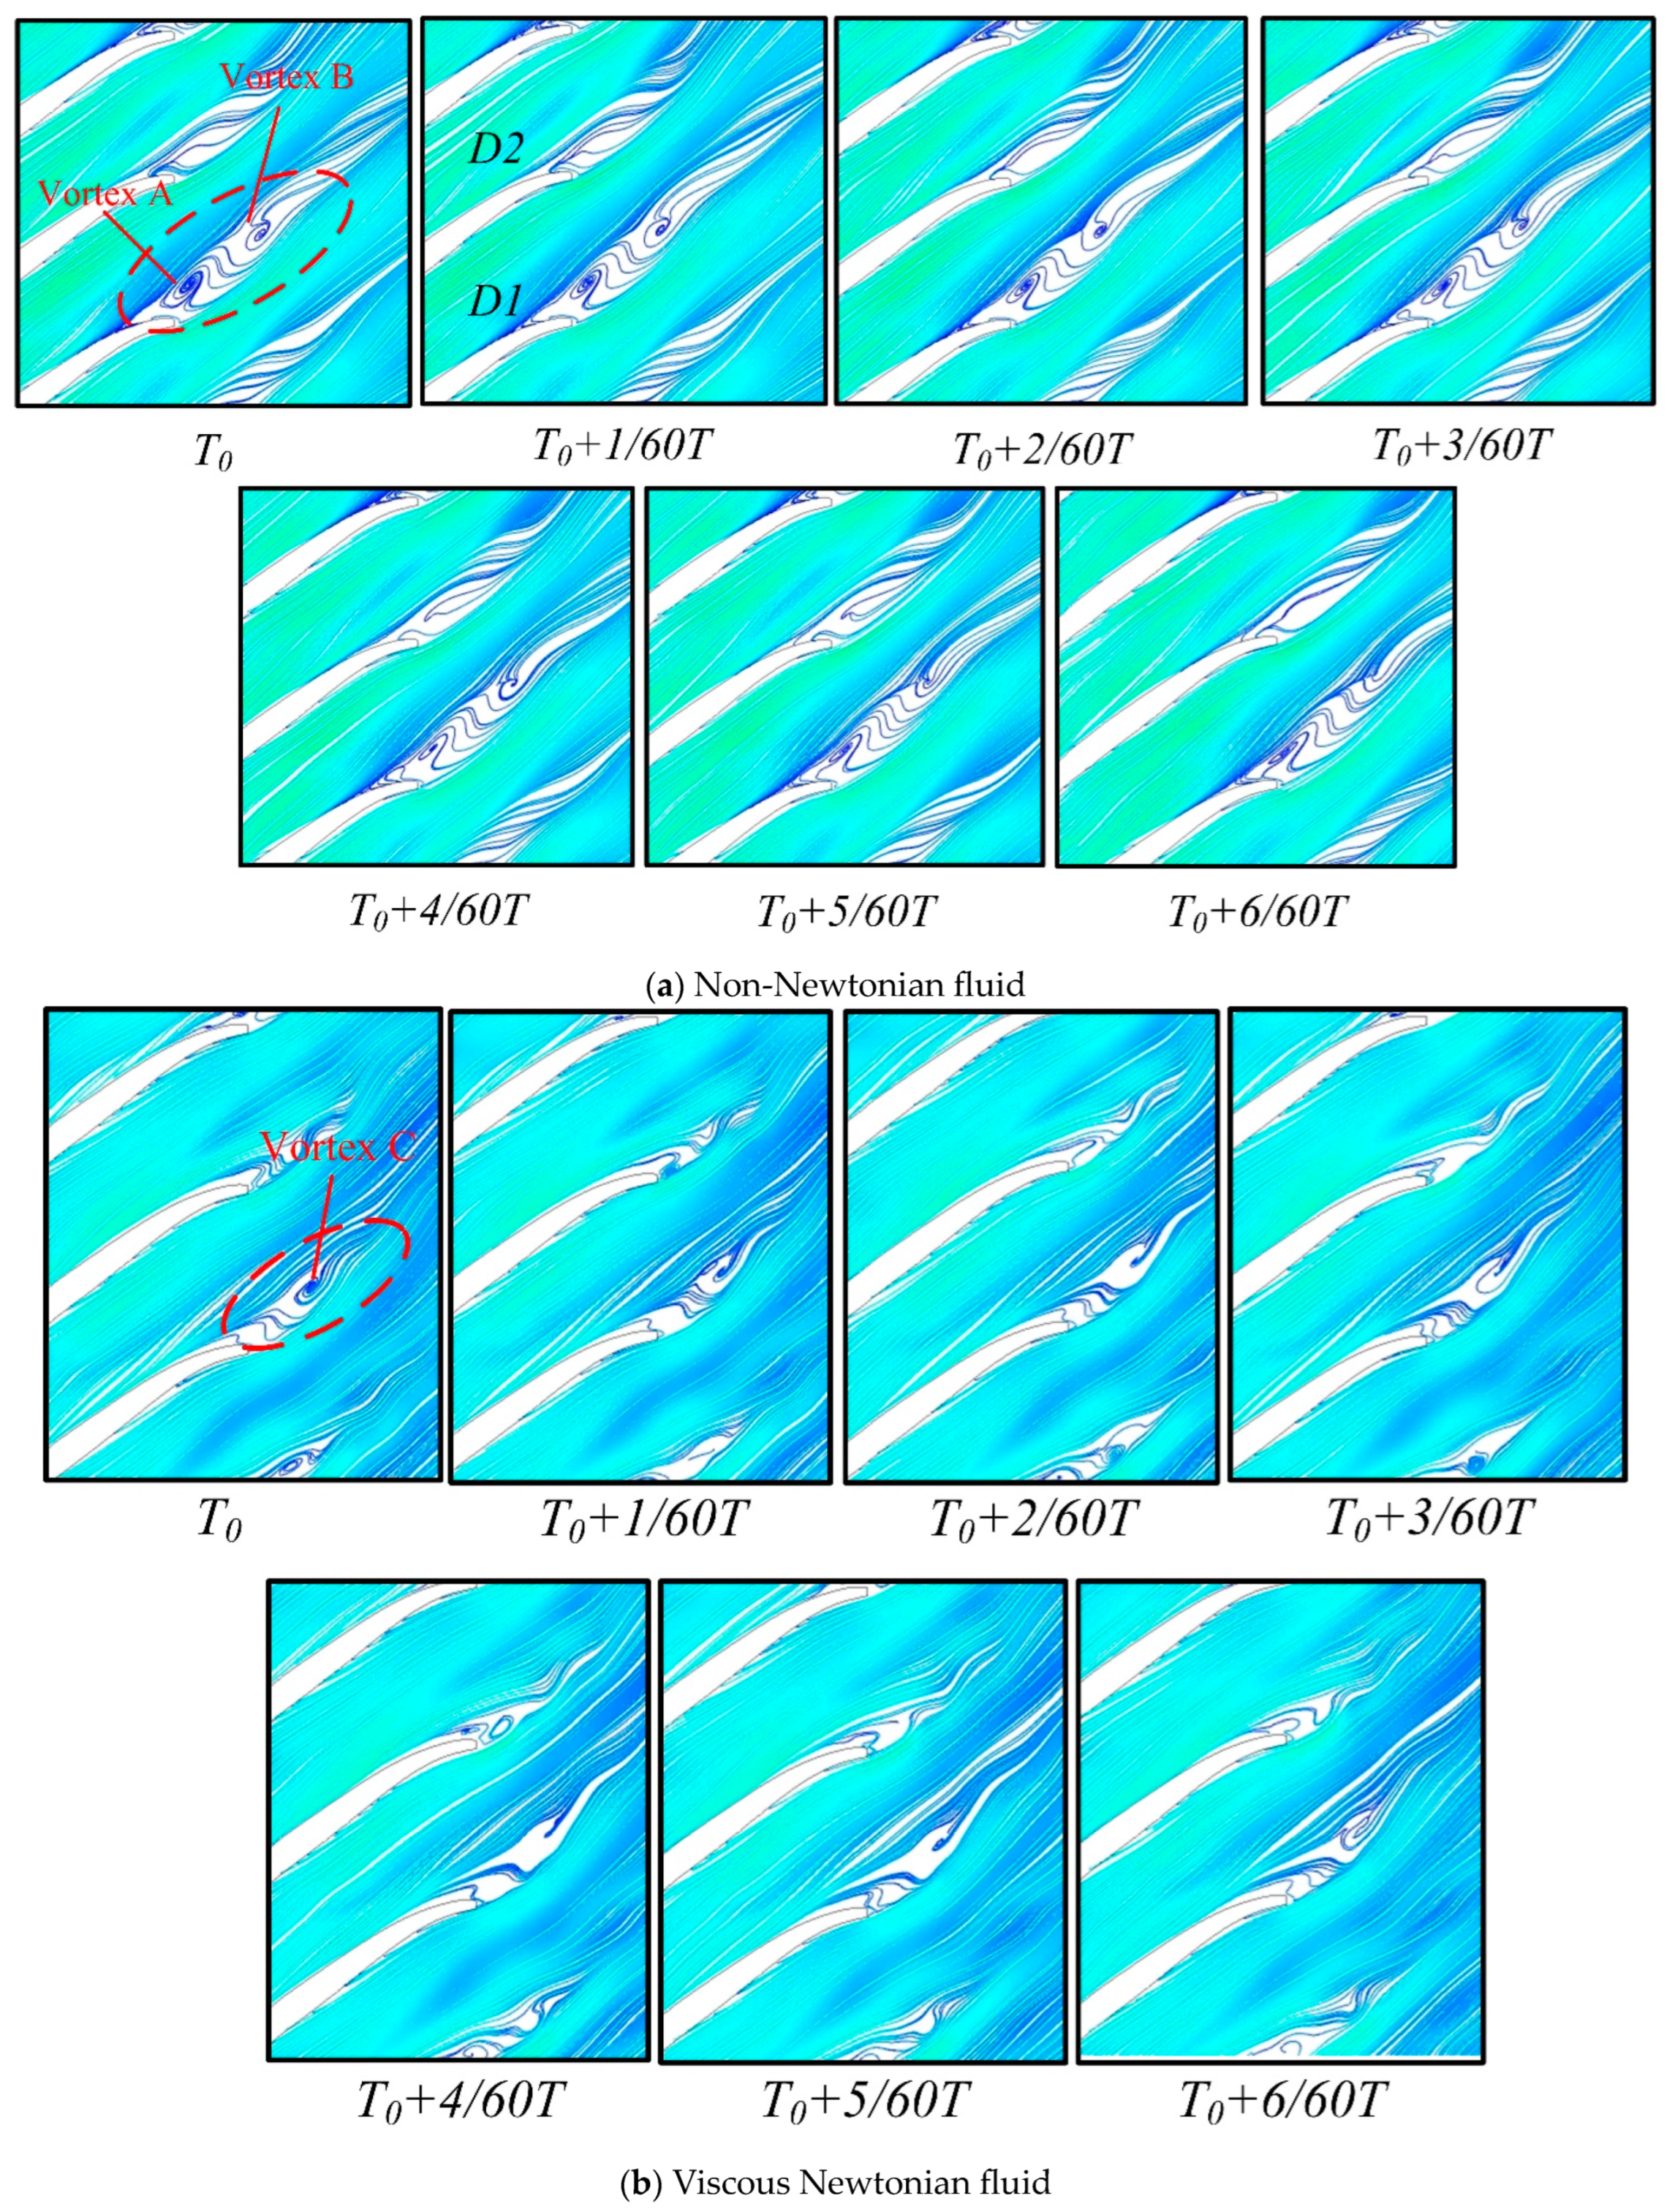
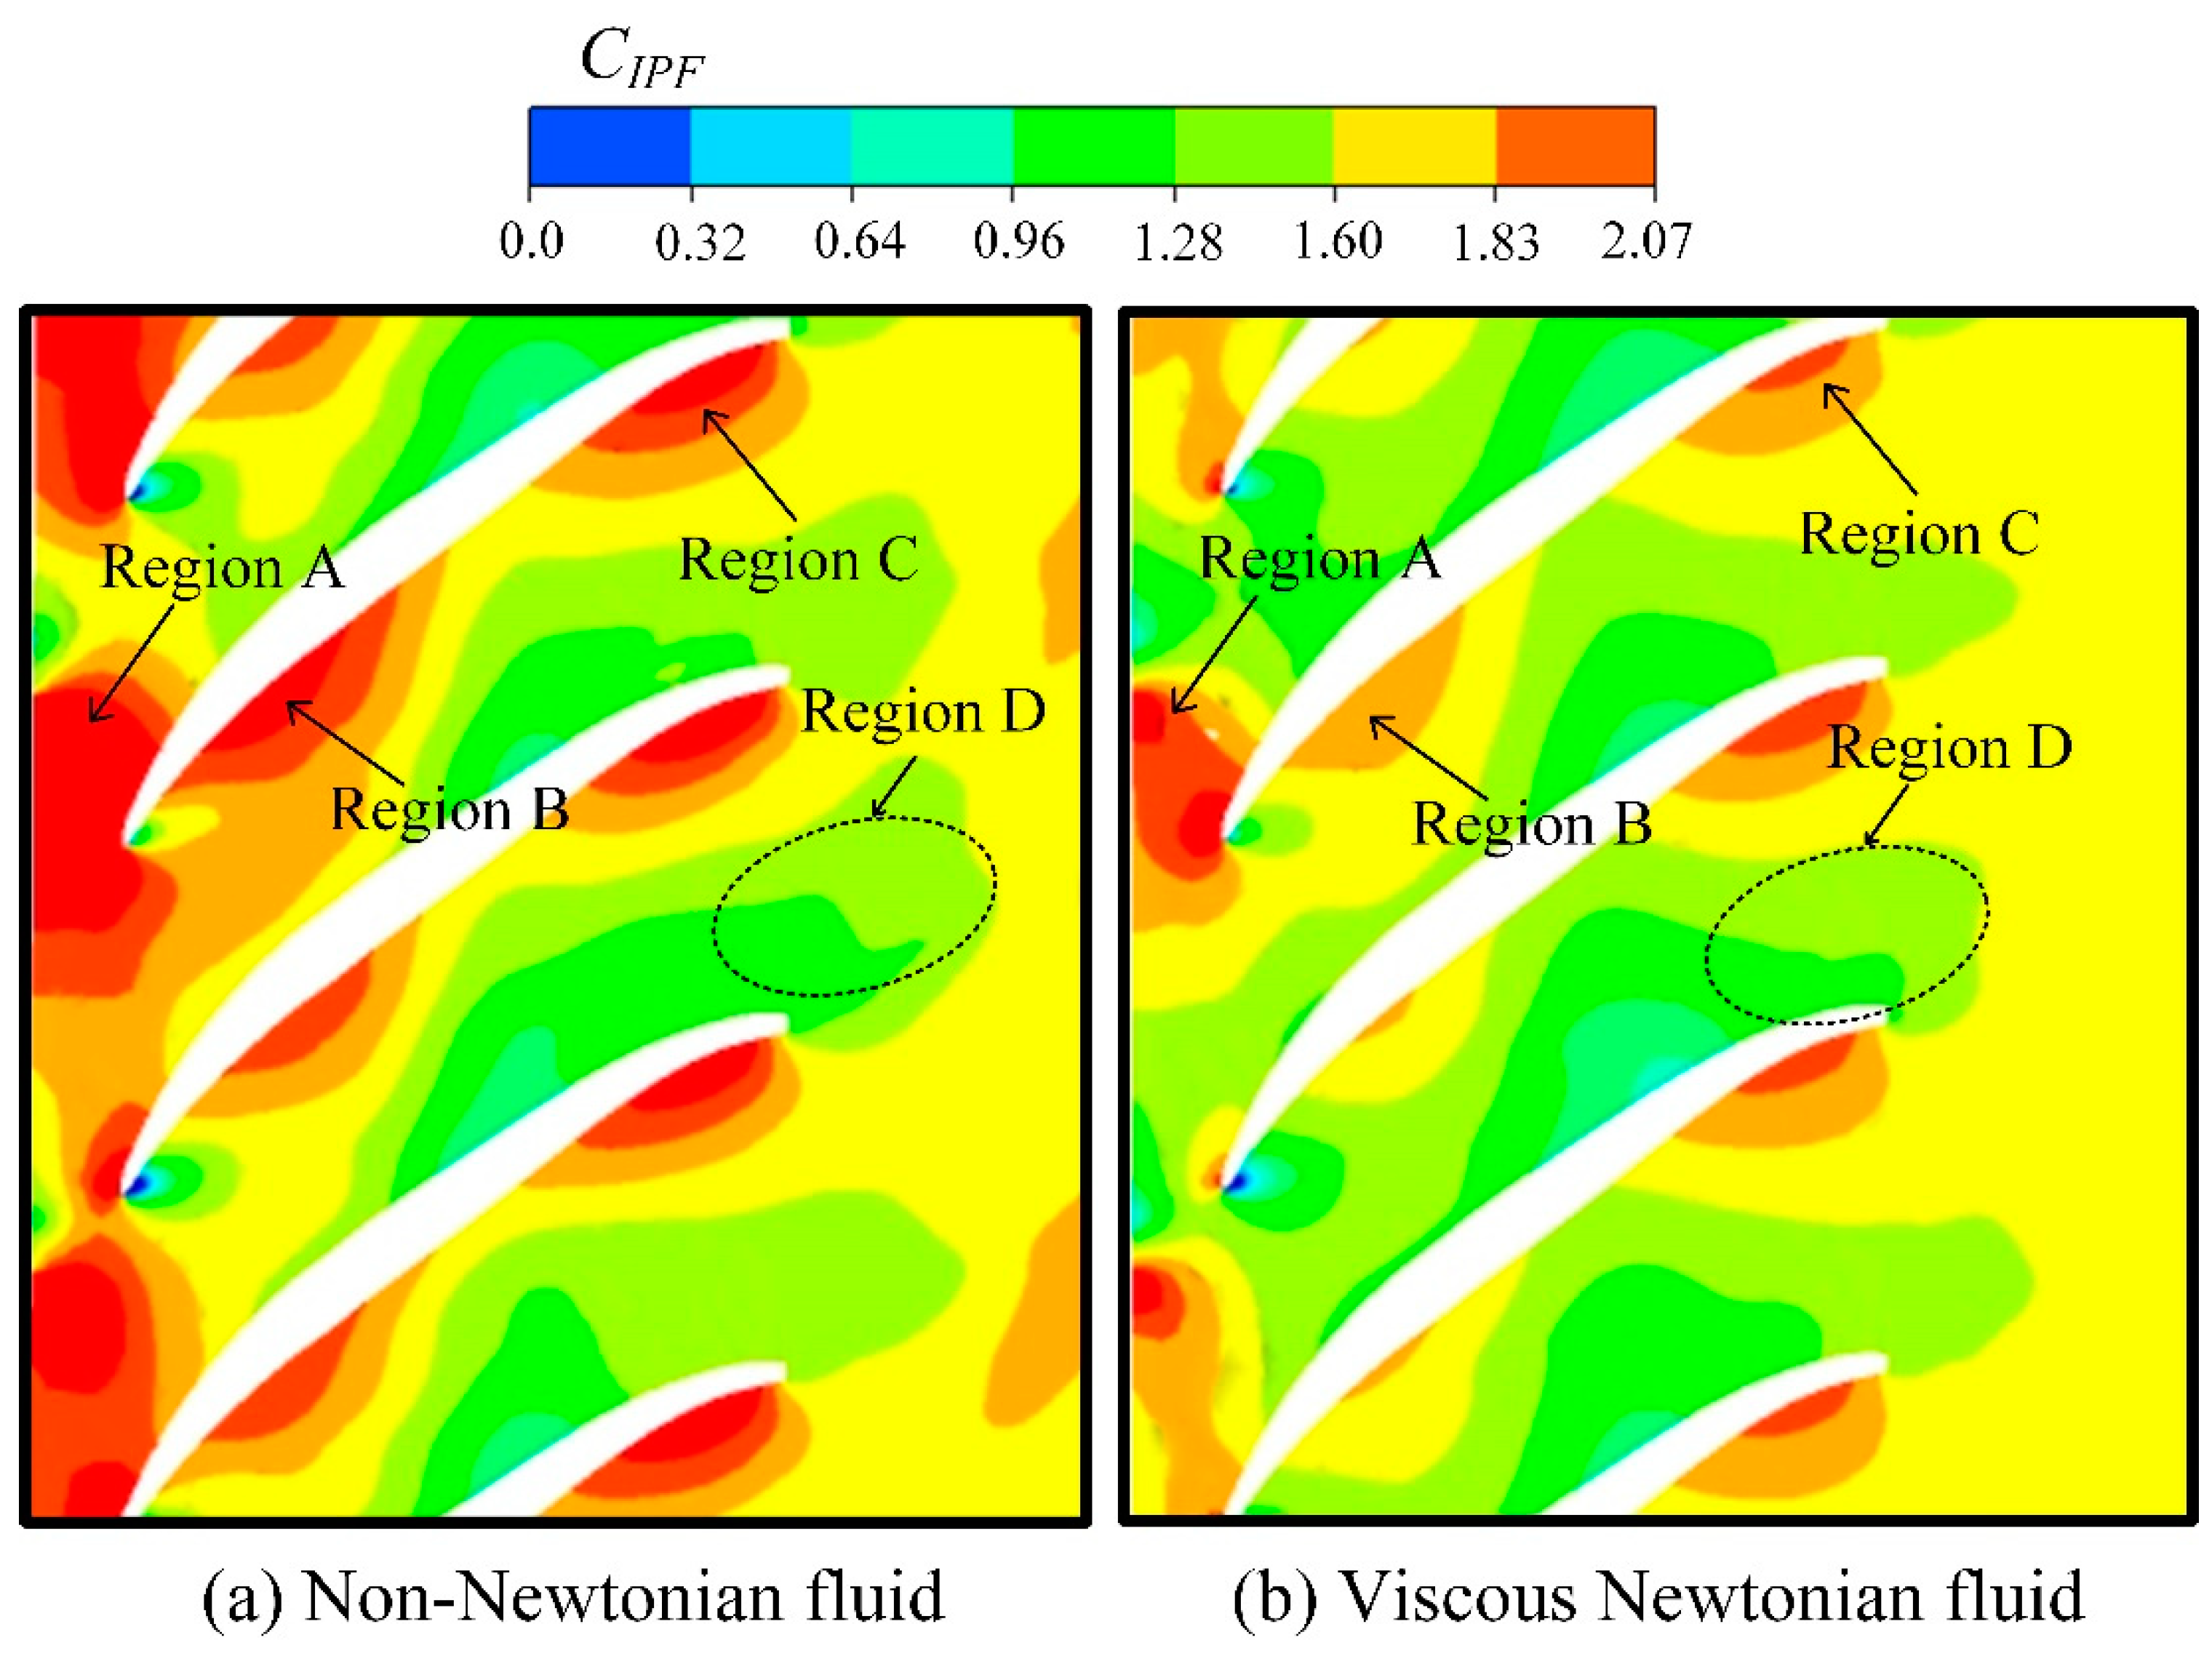
- In the case of non-Newtonian fluids, flow separation near the SS, induced by pressure-gradient-related effects along the flow direction, gives rise to Vortex A. Furthermore, the interaction of pressure gradients in both the mainstream and backflow directions forms Vortex B. While the mechanism for vortex structure formation in a viscous Newtonian fluid is broadly similar to that in a non-Newtonian fluid, the shear-thinning characteristics of the latter result in faster flow velocities and lower friction losses. Consequently, the velocity gradient between the primary and secondary flows is greater in the non-Newtonian fluid, leading to larger-scale vortex structures under their influence.
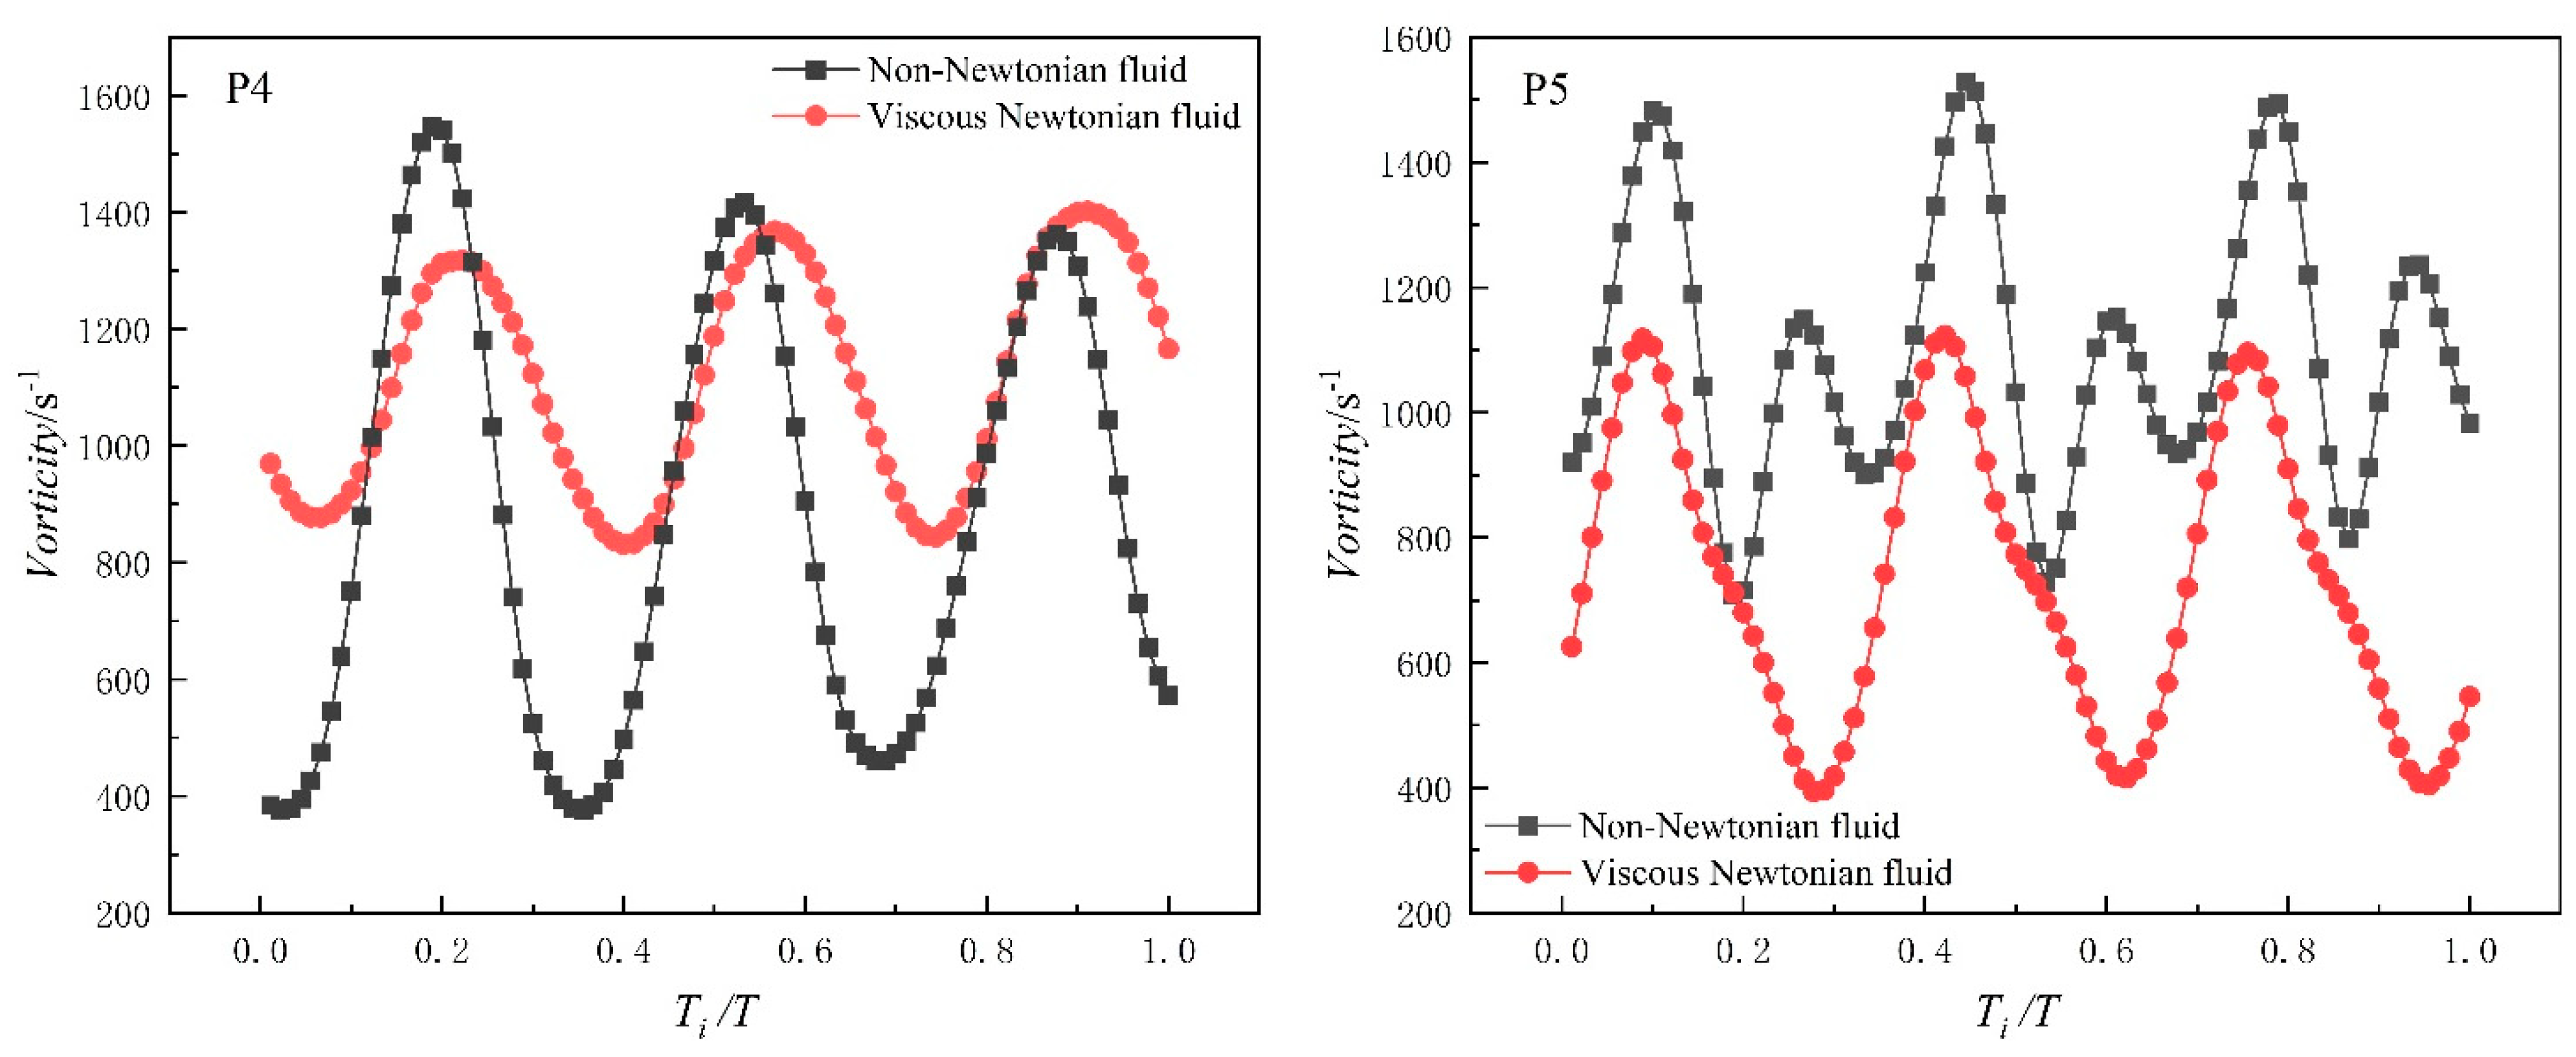
- Under the conditions of a viscous Newtonian fluid, pressure fluctuations primarily stem from the dynamic interaction between the rotor and stator. Conversely, when conveying a non-Newtonian fluid, the inducing factors for pressure fluctuations result from the combined effects of dynamic interaction and shear-thinning characteristics. Additionally, shear-thinning characteristics contribute to certain low-frequency components of pressure fluctuations.
- The high-magnitude regions of pressure fluctuations in both fluids are similar. However, due to shear-thinning characteristics, non-Newtonian fluids exhibit enhanced vortex fluctuations, leading to increased pressure fluctuation intensity, particularly at the locations of trailing-edge separation vortices.
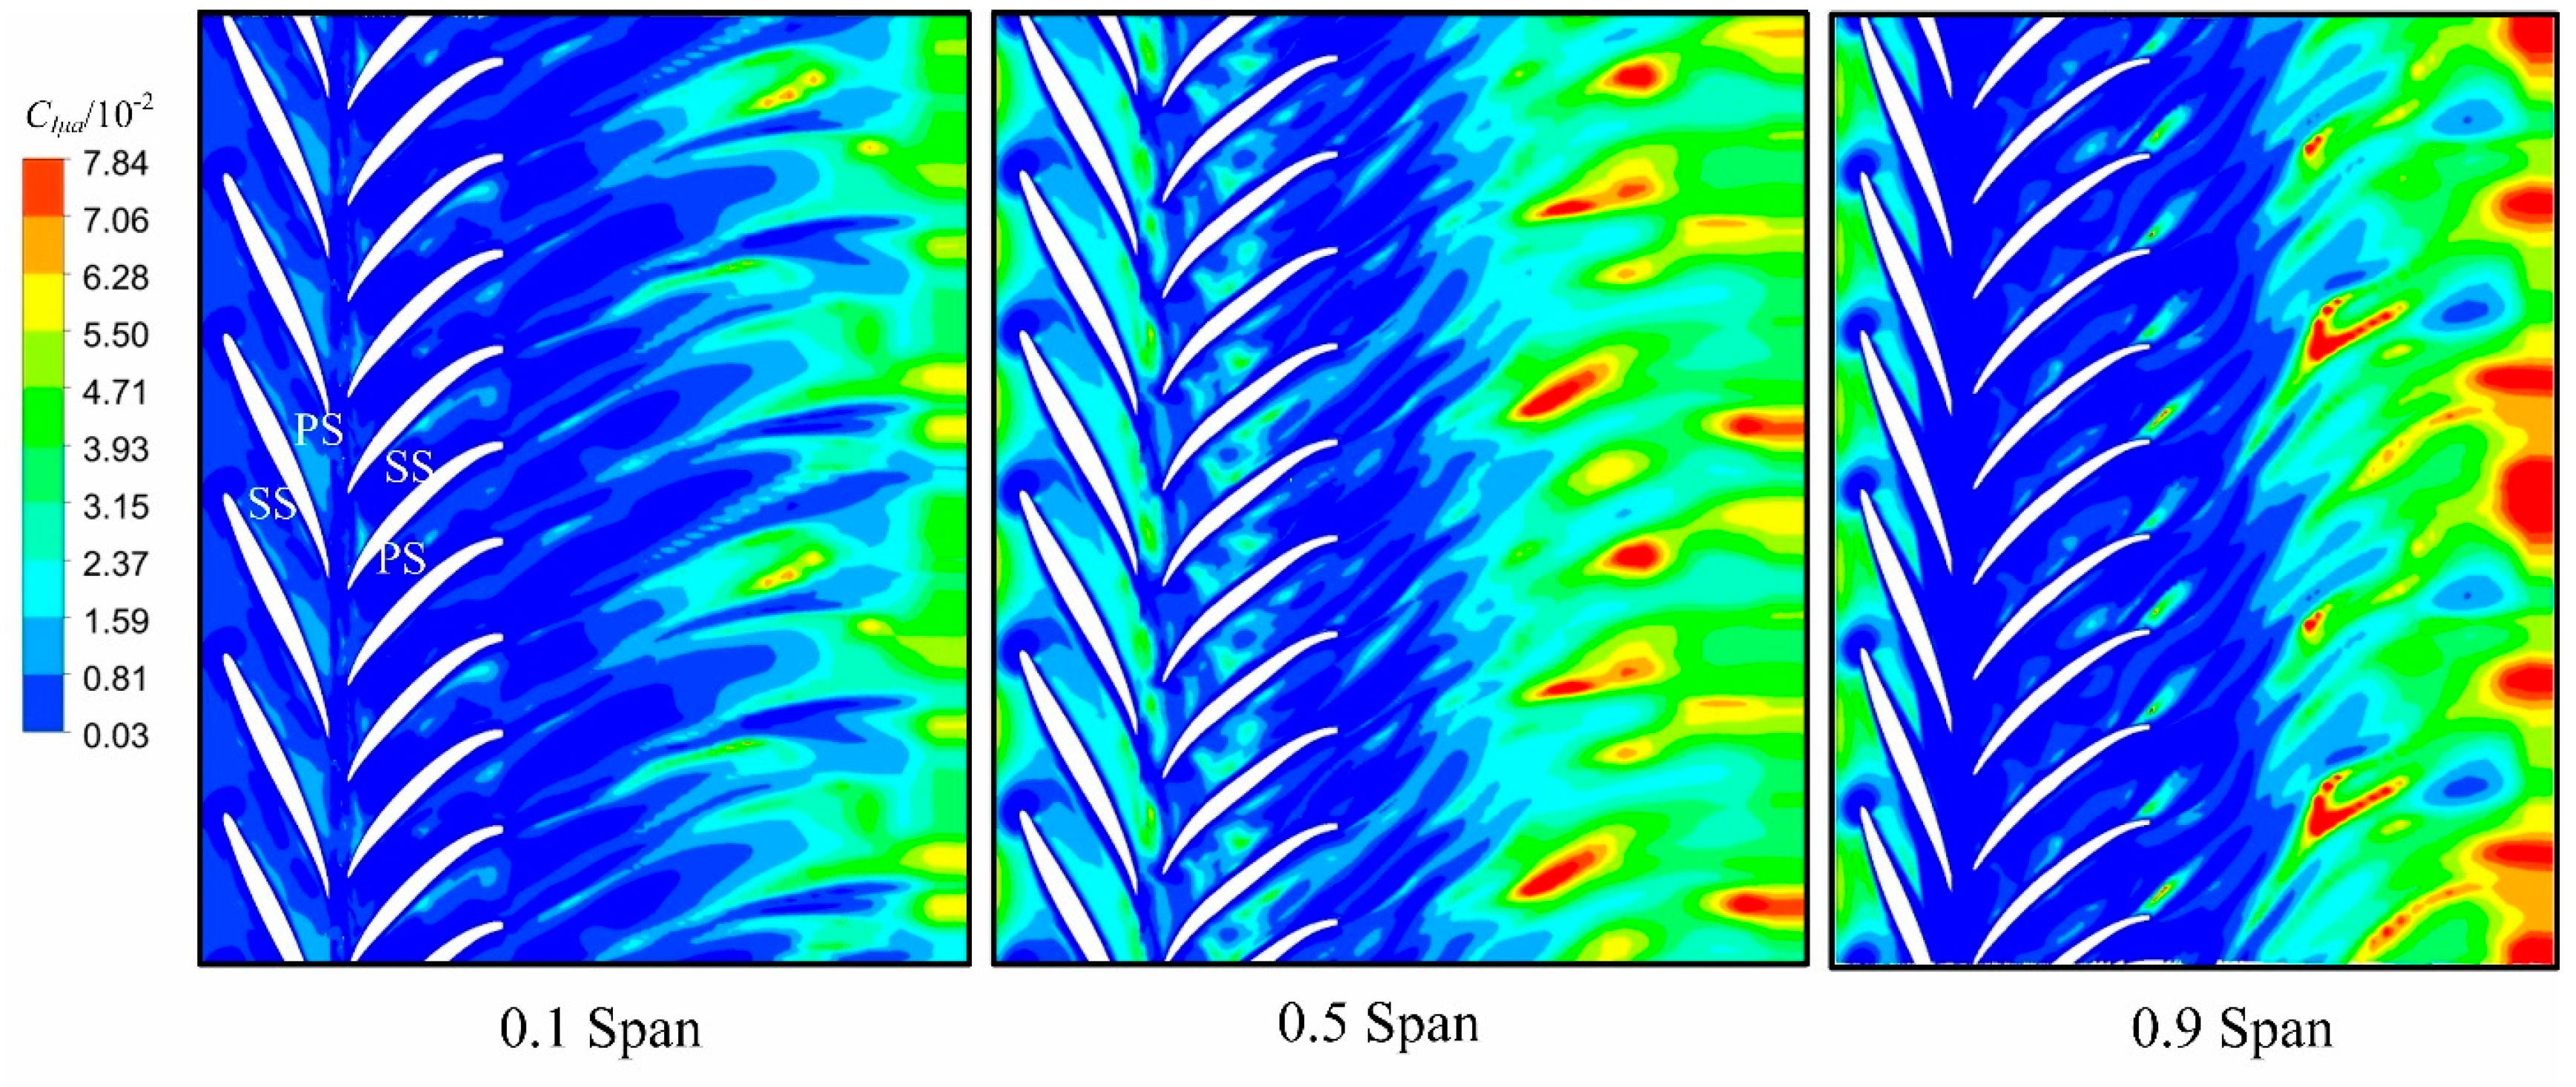
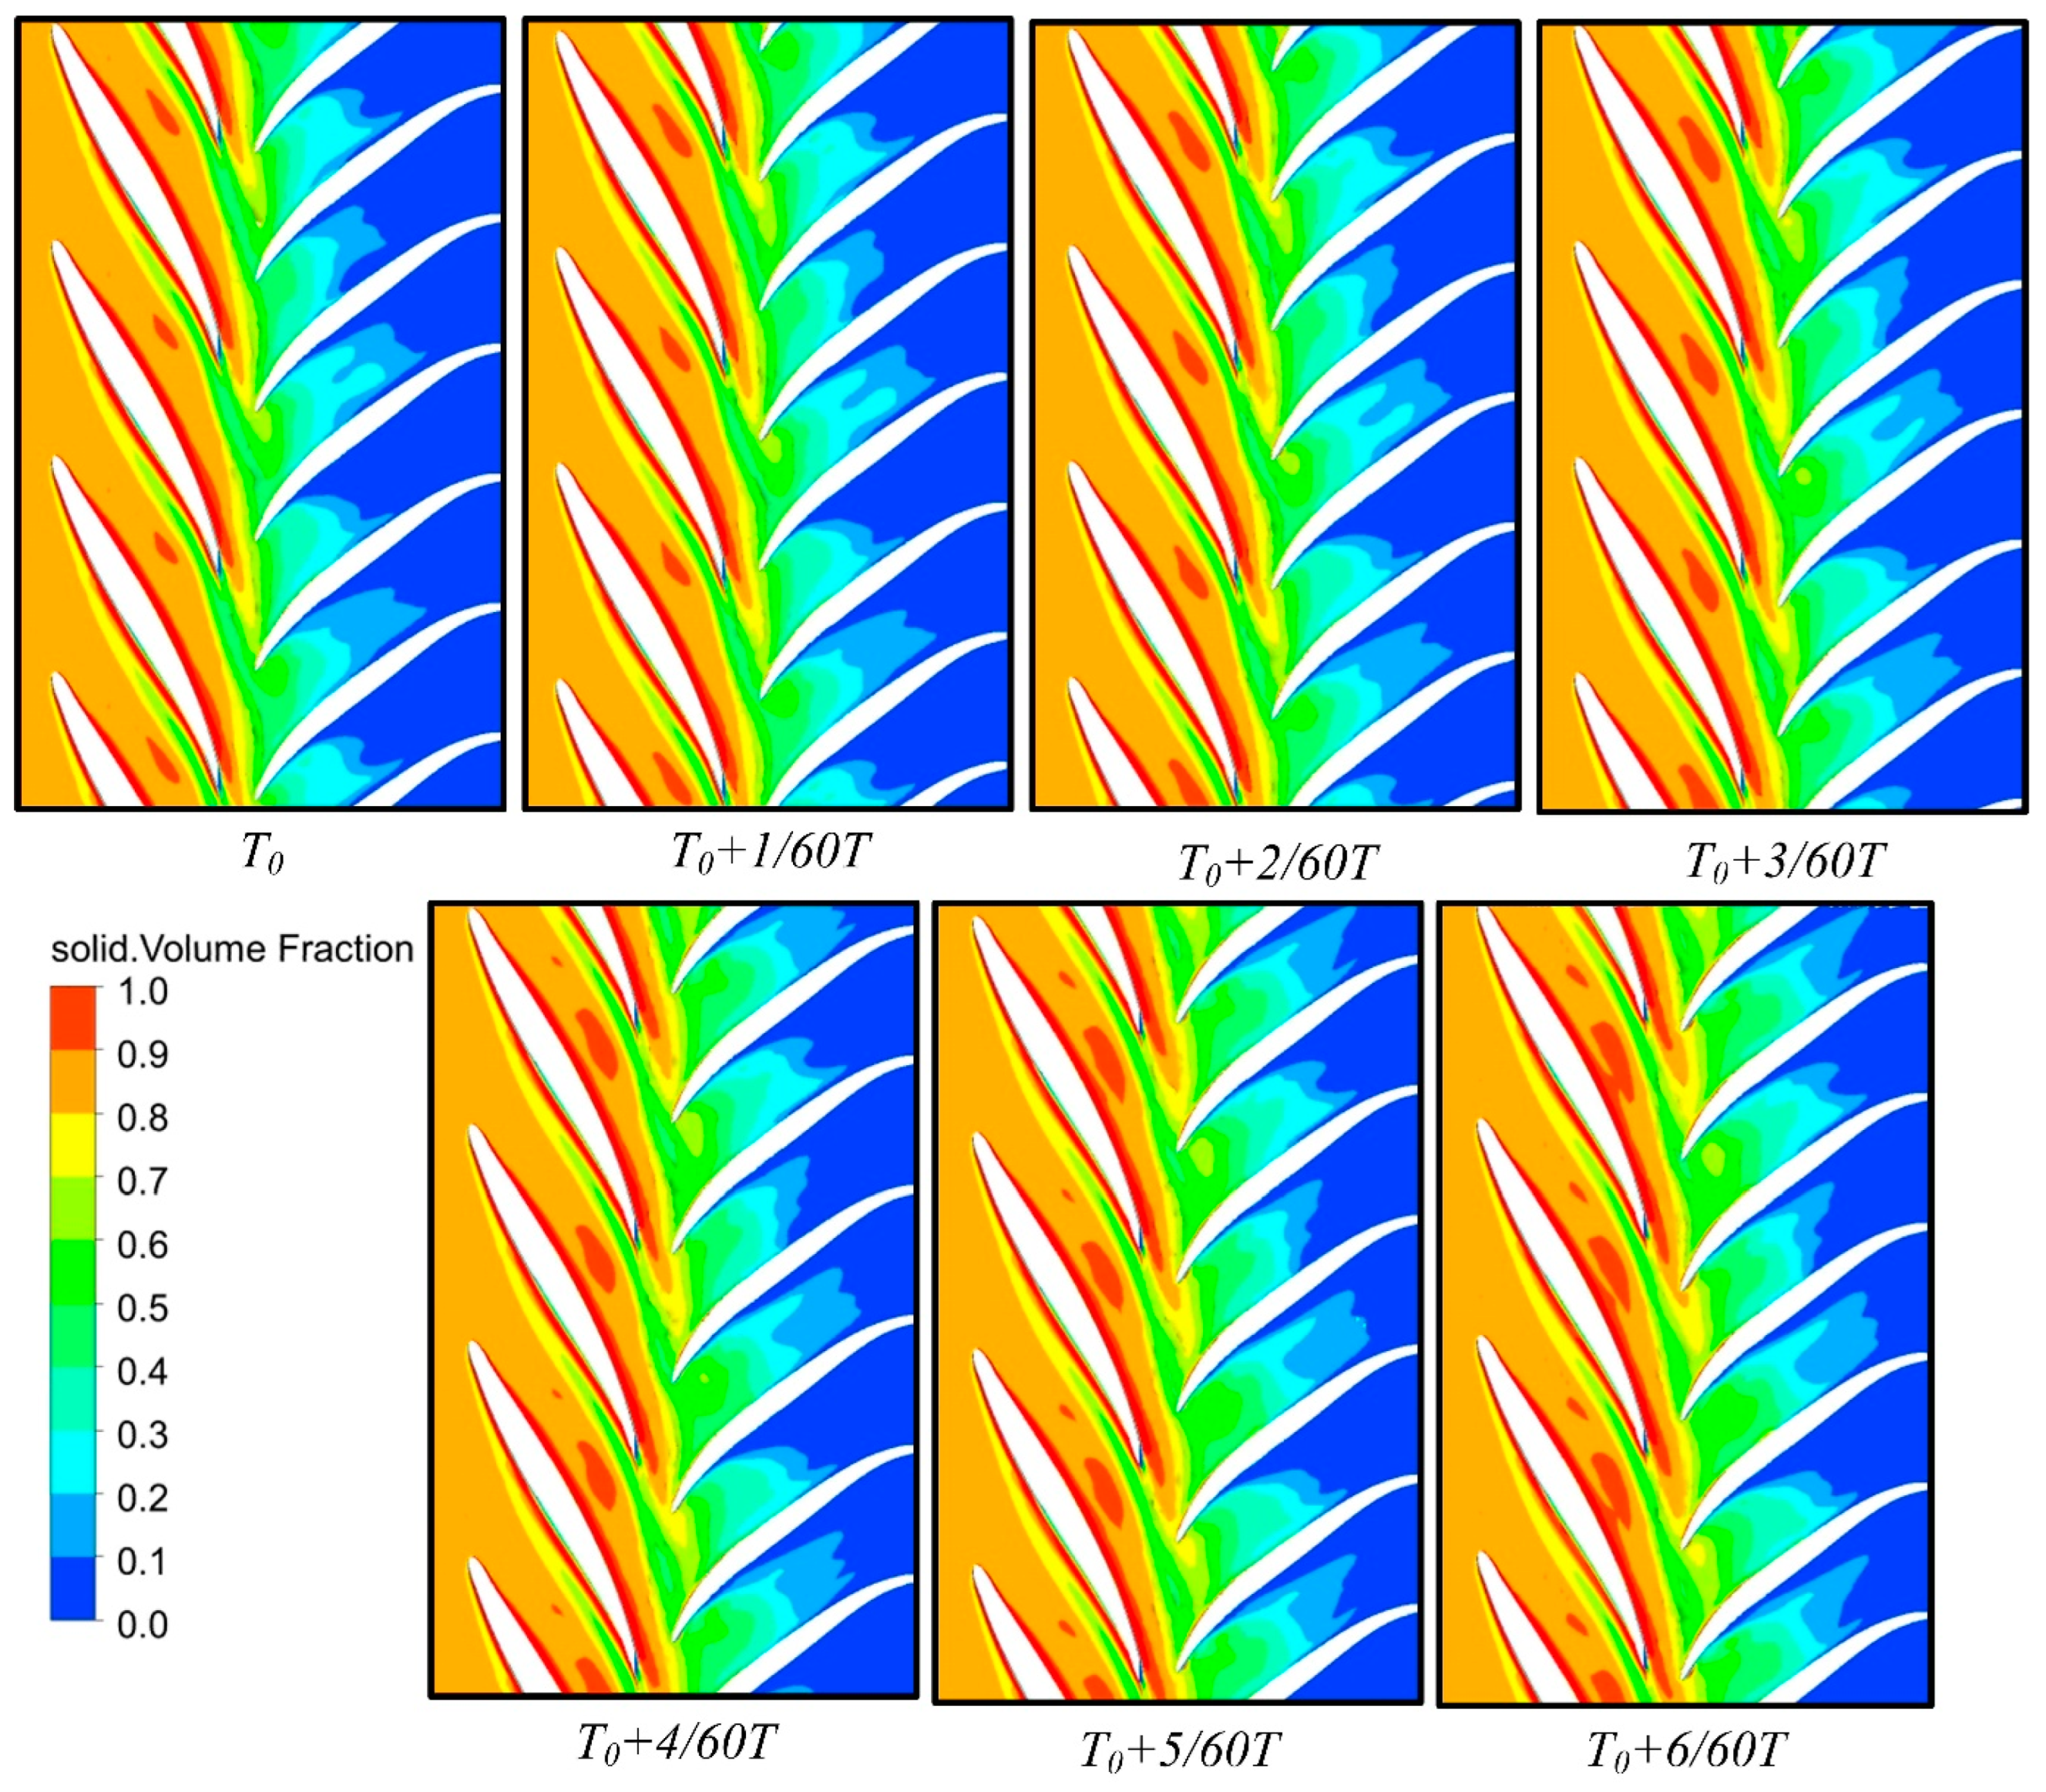
- Moreover, the distribution behavior of gas-solid two-phase flow on the PS of the impeller differs slightly under the influence of the two fluids. In a non-Newtonian fluid, the distribution of gas-solid two-phase flow on the PS is more uniform compared to that in a viscous Newtonian fluid. In a viscous Newtonian fluid, the gas phase is distributed closer to the trailing edge of the blade of the PS, while the solid phase is distributed closer to the leading edge. The shear-thinning characteristics of the non-Newtonian fluid play a crucial role in this observed behavior.
Author Contributions
Funding
Data Availability Statement
Conflicts of Interest
References
- Boswell, R.; Collett, T.S. Current Perspectives on Gas Hydrate Resources. Energy Environ. Sci. 2011, 4, 1206–1215. [Google Scholar] [CrossRef]
- Wei, N.; Bai, R.-L.; Zhou, S.-W.; Luo, P.-Y.; Zhao, J.-Z.; Zhang, Y.; Xue, J. Development Strategy for Deep-sea Natural Gas Hydrates in China to Achieve Carbon Peak Goal. Nat. Gas Ind. 2022, 42, 156–165. [Google Scholar]
- Torres, M.D.; Gadala-Maria, F.; Wilson, D.I. Comparison of the Rheology of Bubbly Liquids Prepared by Whisking Air into a Viscous Liquid (Honey) and a Shear-Thinning Liquid (Guar Gum Solutions). J. Food Eng. 2013, 118, 213–228. [Google Scholar] [CrossRef]
- Li, Y.; Yu, Z. Distribution and Motion Characteristics of Bubbles in a Multiphase Rotodynamic Pump Based on Modified Non-Uniform Bubble Model. J. Pet. Sci. Eng. 2020, 195, 107569. [Google Scholar] [CrossRef]
- Zhou, S.-W.; Chen, W.; Li, Q.-P. Green Mining Technology of Solid-state Fluidized Natural Gas Hydrates in Deep-water Shallow Layers. China Offshore Oil Gas 2014, 26, 1–7. [Google Scholar]
- Zhang, D.; Shi, W.; (Bart) van Esch, B.P.M.; Shi, L.; Dubuisson, M. Numerical and Experimental Investigation of Tip Leakage Vortex Trajectory and Dynamics in an Axial Flow Pump. Comput. Fluids 2015, 112, 61–71. [Google Scholar] [CrossRef]
- Sun, W.; Tan, L. Cavitation-Vortex-Pressure Fluctuation Interaction in a Centrifugal Pump Using Bubble Rotation Modified Cavitation Model Under Partial Load. J. Fluids Eng. Trans. ASME 2020, 142, 051206. [Google Scholar] [CrossRef]
- Wang, C.; Zhang, Y.; Zhang, J.; Zhu, J. Flow Pattern Recognition inside a Rotodynamic Multiphase Pump via Developed Entropy Production Diagnostic Model. J. Pet. Sci. Eng. 2020, 194, 107467. [Google Scholar] [CrossRef]
- Bosioc, A.I.; Tănasă, C. Experimental Study of Swirling Flow from Conical Diffusers Using the Water Jet Control Method. Renew. Energy 2020, 152, 385–398. [Google Scholar] [CrossRef]
- Kadambi, J.R.; Charoenngam, P.; Subramanian, A.; Wernet, M.P.; Sankovic, J.M.; Addie, G.; Courtwright, R. Investigations of Particle Velocities in a Slurry Pump Using PIV: Part 1, The Tongue and Adjacent Channel Flow. J. Energy Resour. Technol. 2004, 126, 271–278. [Google Scholar] [CrossRef]
- Liu, Y.; Tan, L. Tip Clearance on Pressure Fluctuation Intensity and Vortex Characteristic of a Mixed Flow Pump as Turbine at Pump Mode. Renew. Energy 2018, 129, 606–615. [Google Scholar] [CrossRef]
- Zhang, W.; Yu, Z.; Zhu, B. Influence of Tip Clearance on Pressure Fluctuation in Low Specific Speed Mixed-Flow Pump Passage. Energies 2017, 10, 148. [Google Scholar] [CrossRef]
- Kan, K.; Yang, Z.; Lyu, P.; Zheng, Y.; Shen, L. Numerical Study of Turbulent Flow Past a Rotating Axial-Flow Pump Based on a Level-Set Immersed Boundary Method. Renew. Energy 2021, 168, 960–971. [Google Scholar] [CrossRef]
- Kan, K.; Li, H.; Chen, H.; Xu, H.; Gong, Y.; Li, T.; Shen, L. Effects of Clearance and Operating Conditions on Tip Leakage Vortex-Induced Energy Loss in an Axial-Flow Pump Using Entropy Production Method. J. Fluids Eng. 2022, 145, 031201. [Google Scholar] [CrossRef]
- Sonawat, A.; Kim, S.; Ma, S.-B.; Kim, S.-J.; Lee, J.B.; Yu, M.S.; Kim, J.-H. Investigation of Unsteady Pressure Fluctuations and Methods for Its Suppression for a Double Suction Centrifugal Pump. Energy 2022, 252, 124020. [Google Scholar] [CrossRef]
- Lei, T.; Zhifeng, X.; Yabin, L.; Yue, H.; Yun, X. Influence of T-Shape Tip Clearance on Performance of a Mixed-Flow Pump. Proc. Inst. Mech. Eng. Part A-J. Power Energy 2018, 232, 386–396. [Google Scholar] [CrossRef]
- Liu, M.; Tan, L.; Cao, S. Influence of Viscosity on Energy Performance and Flow Field of a Multiphase Pump. Renew. Energy 2020, 162, 1151–1160. [Google Scholar] [CrossRef]
- Pablo Valdes, J.; Becerra, D.; Rozo, D.; Cediel, A.; Torres, F.; Asuaje, M.; Ratkovich, N. Comparative Analysis of an Electrical Submersible Pump’s Performance Handling Viscous Newtonian and Non-Newtonian Fluids through Experimental and CFD Approaches. J. Pet. Sci. Eng. 2020, 187, 106749. [Google Scholar] [CrossRef]
- Zhu, J.; Banjar, H.; Xia, Z.; Zhang, H.-Q. CFD Simulation and Experimental Study of Oil Viscosity Effect on Multi-Stage Electrical Submersible Pump (ESP) Performance. J. Pet. Sci. Eng. 2016, 146, 735–745. [Google Scholar] [CrossRef]
- Ebrahimi, A.; Naranjani, B.; Milani, S.; Dadras Javan, F. Laminar Convective Heat Transfer of Shear-Thinning Liquids in Rectangular Channels with Longitudinal Vortex Generators. Chem. Eng. Sci. 2017, 173, 264–274. [Google Scholar] [CrossRef]
- Li, W.-G. Mechanism for Onset of Sudden-Rising Head Effect in Centrifugal Pump When Handling Viscous Oils. J. Fluids Eng. 2014, 136, 074501. [Google Scholar] [CrossRef]
- Amiraftabi, M.; Khiadani, M.; Mohammed, H.A. Performance of a Dual Helical Ribbon Impeller in a Two-Phase (Gas-Liquid) Stirred Tank Reactor. Chem. Eng. Process. Process. Intensif. 2020, 148, 107811. [Google Scholar] [CrossRef]
- Huang, T.; Li, C.; Jia, W.; Peng, Y. Application of Equations of State to Predict Methane Solubility under Hydrate-Liquid Water Two-Phase Equilibrium. Fluid Phase Equilibria 2016, 427, 35–45. [Google Scholar] [CrossRef]
- Wei, R.; Shi, K.; Guo, X.; Wang, T.; Lv, X.; Li, Q.; Zhang, Y.; Zhao, J.; Yang, L. Evolving Thermal Conductivity upon Formation and Decomposition of Hydrate in Natural Marine Sediments. Fuel 2021, 302, 121141. [Google Scholar] [CrossRef]
- Chen, B.; Sun, H.; Zhou, H.; Yang, M.; Wang, D. Effects of Pressure and Sea Water Flow on Natural Gas Hydrate Production Characteristics in Marine Sediment. Appl. Energy 2019, 238, 274–283. [Google Scholar] [CrossRef]
- Liu, Z.; Song, Y.; Liu, W.; Liu, R.; Lang, C.; Li, Y. Rheology of Methane Hydrate Slurries Formed from Water-in-Oil Emulsion with Different Surfactants Concentrations. Fuel 2020, 275, 117961. [Google Scholar] [CrossRef]
- Si, G. Experimentally Study the Rheology of Fine-Grained Slurries and Some Numerical Simulations of Downslopes Slurry Movements. Available online: https://www.duo.uio.no/handle/10852/12443 (accessed on 28 July 2023).
- Guo, X.; Stoesser, T.; Nian, T.; Jia, Y.; Liu, X. Effect of Pipeline Surface Roughness on Peak Impact Forces Caused by Hydrodynamic Submarine Mudflow. Ocean Eng. 2022, 243, 110184. [Google Scholar] [CrossRef]
- Abdolahnejad, E.; Moghimi, M.; Derakhshan, S. Experimental and Numerical Investigation of Slip Factor Reduction in Centrifugal Slurry Pump. J. Braz. Soc. Mech. Sci. Eng. 2021, 43, 179. [Google Scholar] [CrossRef]
- Wang, Z.; Ding, W.; Zhu, Z.; Liu, R.; Wang, C.; Yu, W.; Wang, Z. Experimental Study on Rheological Behaviors of Na-Bentonite Slurries under Seawater Intrusion. Constr. Build. Mater. 2022, 357, 129369. [Google Scholar] [CrossRef]
- Deng, Y.; Wang, X.; Xu, J.; Li, Y.; Zhang, Y.; Kuang, C. Gas-Liquid Interaction Characteristics in a Multiphase Pump under Different Working Conditions. Processes 2022, 10, 1977. [Google Scholar] [CrossRef]
- Xiao, Y.; Gui, Z.; Li, X.; Tao, S.; Shi, G.; Gu, C. Study on Distribution Law of Gas Phase and Cavitation in the Pressurization Unit of Helical Axial Flow Multiphase Pump. J. Mar. Sci. Eng. 2022, 10, 1795. [Google Scholar] [CrossRef]
- Yu, Z.; Zhu, B.; Cao, S. Interphase Force Analysis for Air-Water Bubbly Flow in a Multiphase Rotodynamic Pump. Eng. Comput. 2015, 32, 2166–2180. [Google Scholar] [CrossRef]
- Granados-Ortiz, F.-J.; Jimenez-Salas, M.; Ortega-Casanova, J. Application of Shear-Thinning and Shear-Thickening Fluids to Computational Fluid Mechanics of High-Reynolds Impinging Turbulent Jets for Cooling Engineering. Int. J. Therm. Sci. 2021, 162, 106753. [Google Scholar] [CrossRef]
- Menter, F.R. Two-Equation Eddy-Viscosity Turbulence Models for Engineering Applications. AIAA J. 1994, 32, 1598–1605. [Google Scholar] [CrossRef]
- Zhang, J.Y.; Zhu, H.W.; Ding, K.; Qiang, R. Study on Measures to Improve Gas-Liquid Phase Mixing in a Multiphase Pump Impeller under High Gas Void Fraction. IOP Conf. Ser. Earth Environ. Sci. 2012, 15, 062023. [Google Scholar] [CrossRef]
- Menter, F.R. Review of the Shear-Stress Transport Turbulence Model Experience from an Industrial Perspective. Int. J. Comput. Fluid Dyn. 2009, 23, 305–316. [Google Scholar] [CrossRef]
- Sun, H.; Luo, Y.; Yuan, S.; Yin, J. Hilbert spectrum analysis of unsteady characteristics in centrifugal pump operation under cavitation status. Ann. Nucl. Energy 2018, 114, 607–615. [Google Scholar] [CrossRef]
- Sun, W.; Yu, Z.; Zhang, K.; Zhang, W. Effect of Shear-Thinning Property on Vortex Evolution and Pressure Fluctuation in an Axial Flow Pump. Chem. Eng. Commun. 2023, 211, 192–204. [Google Scholar] [CrossRef]


| Medium | Density (kg/m3) | Dynamic Viscosity (Pa·s) | Particle Sizes (mm) |
|---|---|---|---|
| Natural gas | 95.94 | 7.207 × 10⁻⁶ | 0.1 |
| Hydrate particles | 1400 | 0.00163 | 0.8 |
| Sea water | 1025 | 0.0017 | / |
| Operating Solution | Density (kg/m3) | Yield Stress (Pa) | Consistency (Pa·sn) | Flow Index |
|---|---|---|---|---|
| 0.1%CMC and 8%Bentonite | 1312 | 7.5 | 1.37 | 0.387 |
| Mesh Measure | Value | %Bad |
|---|---|---|
| Minimum Face Angle | 17.3103° | 0.00 |
| Maximum Face Angle | 163.005° | 0.00 |
| Maximum Element Volume Ratio | 14.2534 | 0.00 |
| Minimum Volume | 2.634 × 10⁻¹⁴ m3 | 0.00 |
| Maximum Edge Length Ratio | 713.513 | 0.00 |
| Maximum Connectivity Number | 10 | 0.00 |
| Apparatus | Production Type | Technical Specification | Measurement Accuracy |
|---|---|---|---|
| Motor | YVF2-225M-2 | 45 KW, 5~135 HZ | \ |
| Torque sensor | ZH07 | 0~±200 N·m, 0~10,000 r/min | 0.1~0.5 F·S |
| Electromagnetic flow meter | SZLDE-L | 0~150 m3/h, 4~20 mA | \ |
| Electric control valve | QB | 4~20 mA | \ |
| Pressure sensor | QDW90A | −0.1~0.1 MPa, 0~0.6 MPa | ±0.03%FS/°C |
| Dominant Frequency | Secondary Frequency | |||
|---|---|---|---|---|
| Non-Newtonian Fluid | Viscous Newtonian Fluid | Non-Newtonian Fluid | Viscous Newtonian Fluid | |
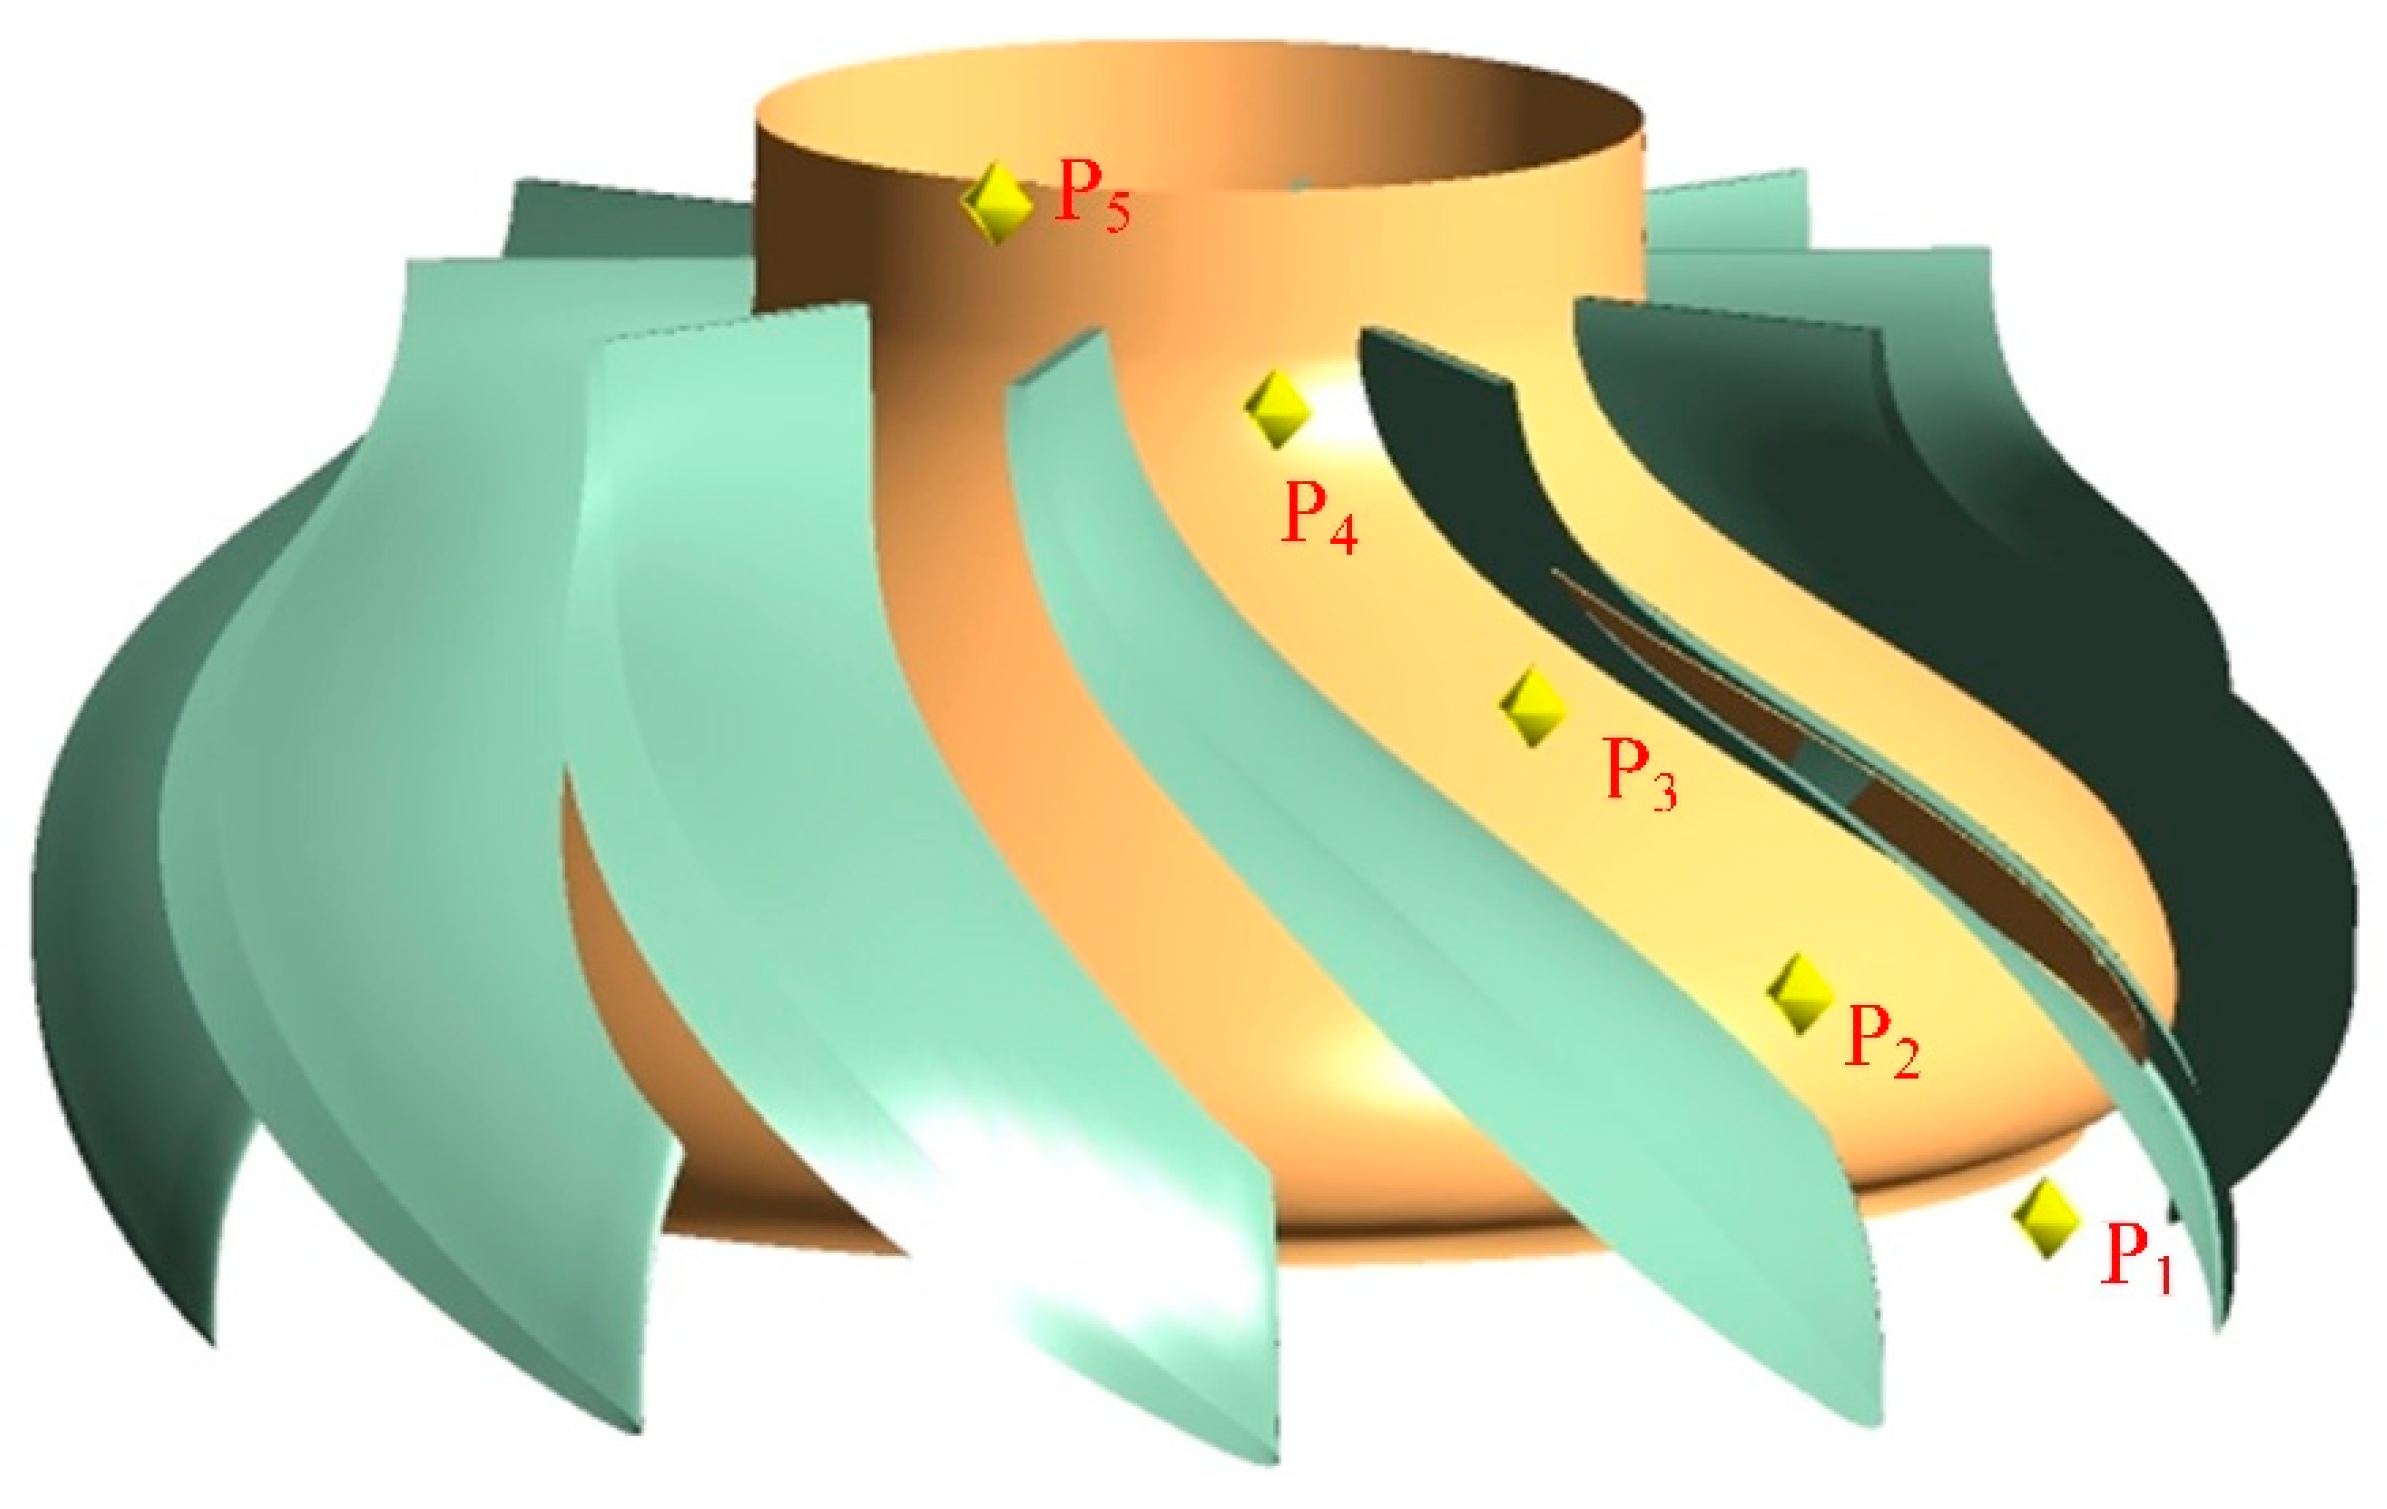
| P1 | 1.68fi | 5.37fi | 0.13fi | 10.75fi |
| P2 | 1.88fi | 5.74fi | 3.9fi | 11.48fi |
| P3 | 0.15fi | 4.35fi | 1.98fi | 8.69fi |
| P4 | 0.22fi | 5.27fi | 2.83fi | 10.53fi |
| P5 | 0.82fi | 5.63fi | 5.74fi | 11.27fi |
Disclaimer/Publisher’s Note: The statements, opinions and data contained in all publications are solely those of the individual author(s) and contributor(s) and not of MDPI and/or the editor(s). MDPI and/or the editor(s) disclaim responsibility for any injury to people or property resulting from any ideas, methods, instructions or products referred to in the content. |
© 2024 by the authors. Licensee MDPI, Basel, Switzerland. This article is an open access article distributed under the terms and conditions of the Creative Commons Attribution (CC BY) license (https://creativecommons.org/licenses/by/4.0/).
Share and Cite
Chen, L.; Yang, Y.; Peng, C.; Zhang, X.; Gong, Y. The Influence of Shear-Thinning Characteristics on Multiphase Pump Vortex Structure Evolution, Pressure Fluctuation, and Gas-Solid Distribution. Processes 2024, 12, 284. https://doi.org/10.3390/pr12020284
Chen L, Yang Y, Peng C, Zhang X, Gong Y. The Influence of Shear-Thinning Characteristics on Multiphase Pump Vortex Structure Evolution, Pressure Fluctuation, and Gas-Solid Distribution. Processes. 2024; 12(2):284. https://doi.org/10.3390/pr12020284
Chicago/Turabian StyleChen, Long, Yingxin Yang, Cancan Peng, Xiaodong Zhang, and Yan Gong. 2024. "The Influence of Shear-Thinning Characteristics on Multiphase Pump Vortex Structure Evolution, Pressure Fluctuation, and Gas-Solid Distribution" Processes 12, no. 2: 284. https://doi.org/10.3390/pr12020284