
Preparation of Nickel-Based Bimetallic Catalyst and Its Activation of Persulfate for Degradation of Methyl Orange
1
School of the Environment and Safety Engineering, Jiangsu University, Zhenjiang 212013, China
2
Changzhou Engineering and Technology Institute, Jiangsu University, Changzhou 213164, China
*
Author to whom correspondence should be addressed.
Processes 2024, 12(2), 322; https://doi.org/10.3390/pr12020322
Submission received: 12 January 2024
/
Revised: 29 January 2024
/
Accepted: 31 January 2024
/
Published: 2 February 2024
Abstract
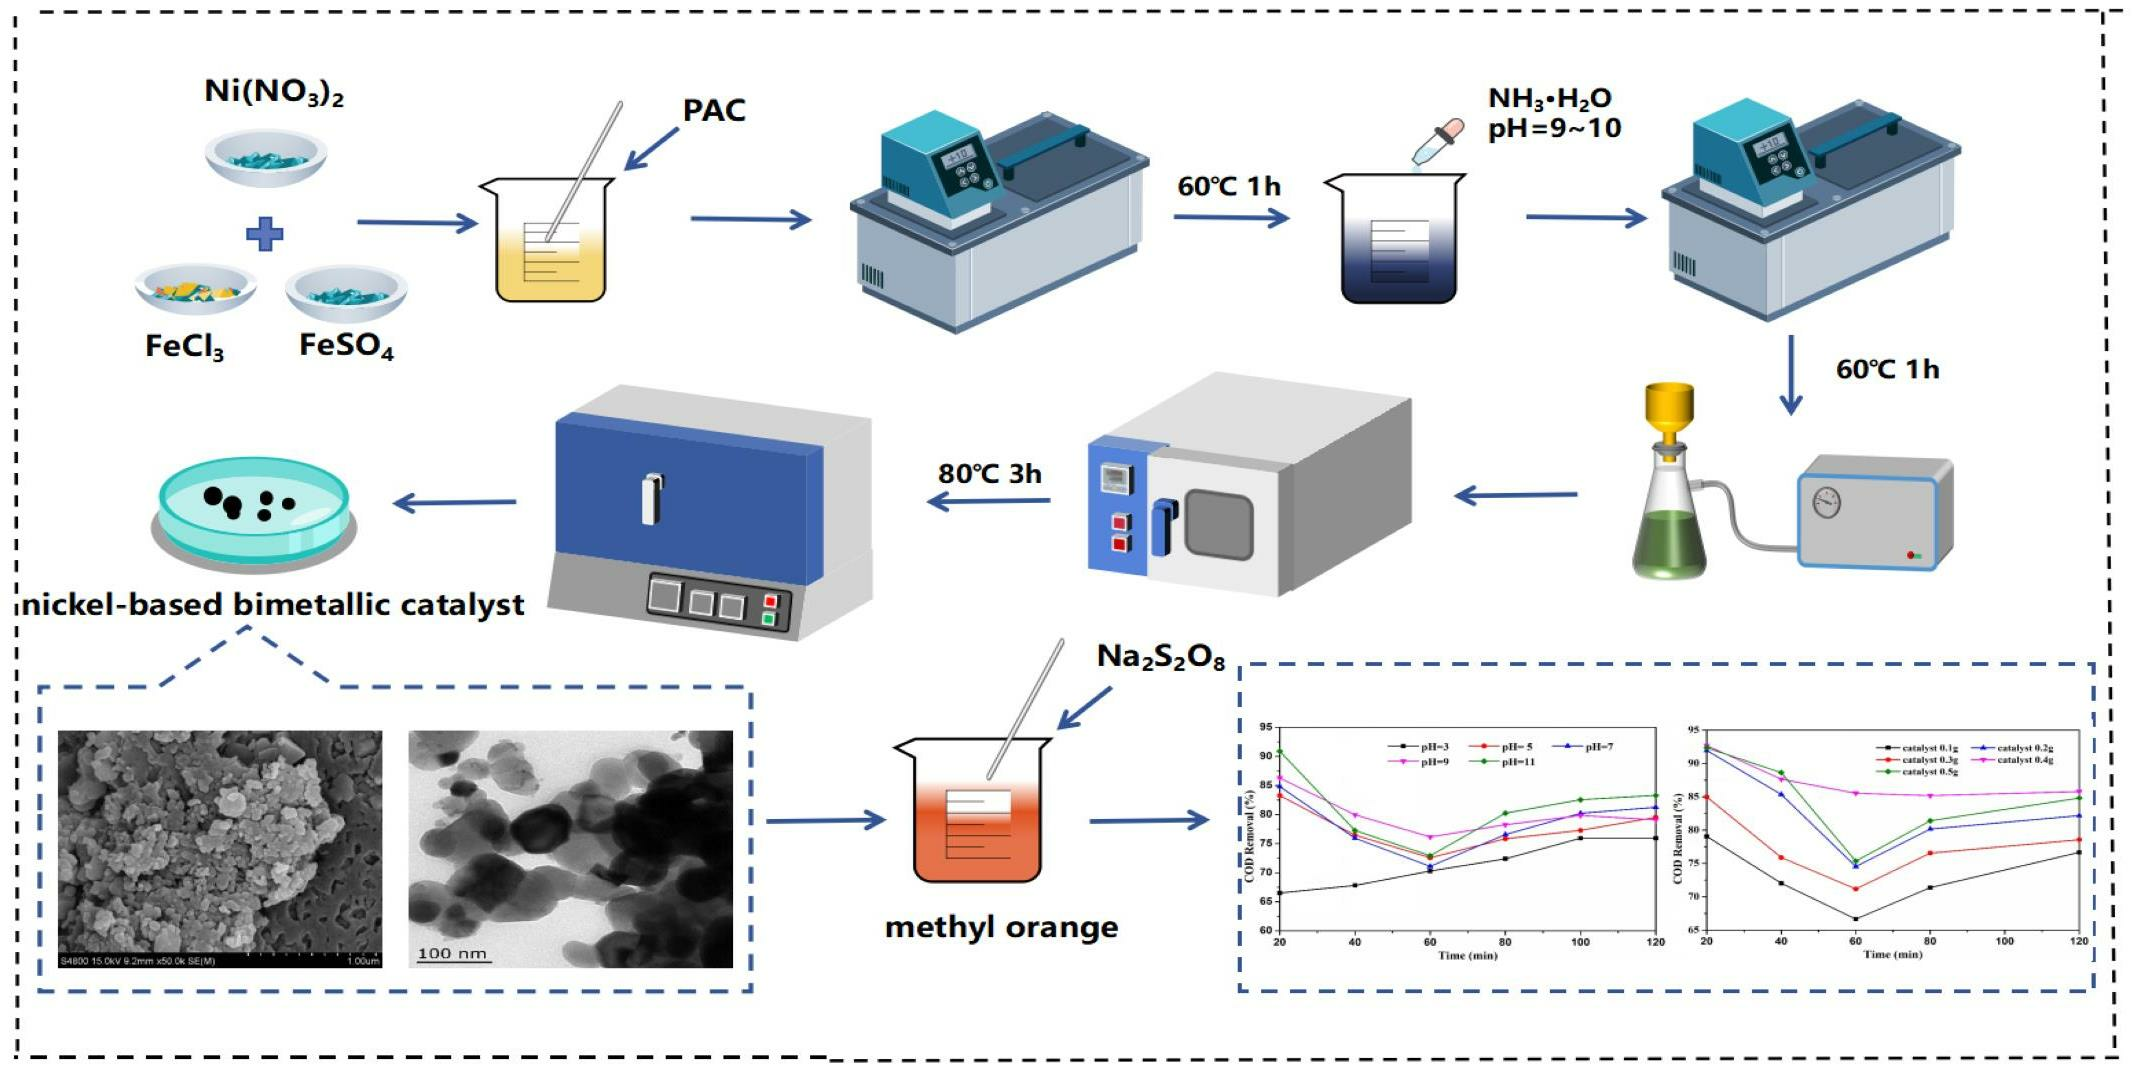
:In this research, a new catalyst for activating persulfate was developed by loading iron and nickel ions onto powdered activated carbon (PAC) for treating methyl orange, and the preparation process was optimized and characterized. The efficacy of the treatment was evaluated using the Chemical Oxygen Demand (COD) removal rate, which reflects the impact of various process parameters, including catalyst dosage, sodium persulfate dosage, and reaction pH. Finally, the recovery and reuse performance of the catalyst were studied. The optimal conditions for preparing the activated sodium persulfate catalyst were determined to be as follows: a molar ratio of Fe3+ and Fe2+ to Ni of 4:1, a mass ratio of Fe3O4 to PAC of 1:4, a calcination temperature of 700 °C, and a calcination time of 4 h. This preparation led to an increase in surface porosity and the formation of a hollow structure within the catalyst. The active material on the surface was identified as nickel ferrite, comprising the elements C, O, Fe, and Ni. The magnetic property is beneficial to recycling. With the increase in catalyst and sodium persulfate dosage, the COD removal efficiency of the oxidation system increased first, and then, decreased. The catalyst showed good catalytic performance when the pH value was in the range of 3~11. Furthermore, Gas Chromatography–Mass Spectrometry (GC-MS) analysis indicated the complete oxidation of methyl orange dye molecules in the system. This result highlights the important role of the newly developed catalyst in activating persulfate.

1. Introduction
With the continuous development of advanced oxidation processes (AOPs) for the treatment of refractory organic pollutants, sulfate radical (·SO4−) oxidation, a novel free radical oxidation technology, has been developed [1]. This technology, exhibiting a higher redox potential and longer lifespan in solutions than the hydroxyl radical (·OH), is effective across a broad pH range [2,3,4]. Its potential to degrade methyl orange provides an important market prospect for water treatment [5].
Persulfate, as a derivative of hydrogen peroxide, also contains O=O double bonds and has potential strong oxidation capacity. Activated persulfate oxidation technology is an advanced oxidation technology that has emerged in recent years for environmental remediation and wastewater treatment [6,7]. Persulfate can exist stably at room temperature and pressure, and the oxidation effect of organic pollutants is not significant when used alone [8]. Therefore, various methods are often needed to activate persulfate, such as heating activation [9], photoactivation (ultraviolet) [10], transition metal ion activation (Fe2+, Ag+, Ce2+, Co2+) [11], microwave activation [12], ultrasonic activation [13], strong alkali activation [14], and other catalytic reactions [15]. After persulfate activation, S2O82− will rapidly decompose to produce ·SO4− [16,17]. Ma et al. prepared magnetic CuO/MnFe2O4 nanocomposites for the removal of levofloxacin (LVF) by activated persulfate. The results showed that 1 g·L−1 CuO/MnFe2O4-9% could decompose 91.3% of LVF within 120 min under the optimized conditions of pH = 9 and 25 °C [18]. Xian et al. prepared an efficient CuO-γFe2O3 composite material that can activate persulfate to remove organic pollutants. There was an obvious synergy between CuO and γFe2O3 in the composite, and the removal rate of acid orange 7 (AO7) was 84.7% [19]. Heterogeneous persulfate catalysts have high catalytic oxidation efficiency, mild catalytic oxidation conditions, a low ion dissolution rate, and the capability for the convenient recovery of catalysts in solid form. It represents the main direction for developing advanced persulfate oxidation technology in the future [20,21,22].
The process of the persulfate catalytic oxidation reaction is a complex process, and a change in any factor during the reaction may affect the reaction [23]. The literature shows that in the environment, different pH values have a great influence on the types of free radicals produced by persulfate activation. In an acidic environment, ·SO4− is the main radical, but it will be transformed into ·OH under alkaline conditions [24,25,26]. In addition, the substrate concentration, reaction time, reaction temperature, catalyst dosage, oxidant dosage, etc., are the factors that affect the reaction [27,28]. Therefore, when studying the efficiency of the catalyst activation of the persulfate degradation of pollutants, it is necessary to comprehensively consider the influence of the above factors on the reaction, and analyze the main factors affecting the reaction efficiency according to the test results.
This study discusses the effectiveness of catalyst-activated sodium persulfate in the treatment of methyl orange. It examines the impacts of transition metal (Fe, Ni) ratios, PAC addition, calcination time, and temperature on methyl orange degradation. The catalyst is optimized using the COD removal rate as an evaluation index and characterized using scanning electron microscopy (SEM), transmission electron microscopy (TEM), X-ray diffraction (XRD), and an X-ray energy-dispersive spectrometer (EDS). Additionally, this study discusses the influences of pH, catalyst dosage, and oxidant dosage on degradation efficiency. Finally, the recovery and reusability of the catalyst are studied.
2. Materials and Methods
2.1. Medicine and Reagent
Analytical-grade chemicals including Ferrous sulfate (FeSO4·7H2O), ferric chloride (FeCl3·6H2O), nickel nitrate (Ni (NO3)2·6H2O), powdered activated carbon (C), ammonia water (NH3·H2O), sodium persulfate (Na2S2O8), sulfuric acid (H2SO4), and sodium hydroxide (NaOH) were obtained from Aladdin Biochemical Technology Co., Ltd. (Shanghai, China). These reagents were used as received without further purification.
2.2. Instruments and Equipment
The phase structure of the catalyst was identified by X-ray diffraction (XRD, D8, Bruker, Ettlingen, Germany). The feature morphology and element distribution were monitored by a scanning electron microscope (SEM, S4800, Hitachi, Tokyo, Japan) equipped with an energy-dispersive X-ray spectrometer (EDS), and the fine microstructure information was illustrated via transmission electron microscopy (TEM, JEM 2100plus, JEOL, Tokyo, Japan). The phase structure of the catalyst was determined by a multi-parameter water quality analyzer (5B-3B (V8), Lianhua, Shanghai, China). The intermediate products were analyzed by gas chromatography–mass spectrometry (GC-MS, Agilent, Santa Clara, CA, USA).
2.3. Method and Procedure
2.3.1. Catalyst Preparation
FeCl3, FeSO4, and Ni (NO3)3 were dissolved in 50 mL of deionized water following a specific molar ratio. A predetermined amount of PAC was then added. The mixture was stirred at 60 °C for 1 h in a water bath, after which the pH was adjusted to 9~10 with NH3·H2O. Stirring continued for another 60 min. Post-reaction, the mixture underwent vacuum filtration, drying at 100 °C in a blast-drying oven, and calcination at a set temperature in a muffle furnace for a designated duration.
2.3.2. Optimization of Catalyst Preparation
The catalyst optimization was centered on a molar ratio of Fe3+ + Fe2+:Ni of 1.5:1. Fixed dosages of Fe3+ (0.0025 mol) and Fe2+ (0.00167 mol) were used, aiming for a theoretical yield of Fe3O4 at 0.00375 mol. Variations in the amounts of Ni (NO3)3 and PAC, alongside changes in calcination temperature and time, were tested using a single-factor method to optimize catalyst preparation.
2.3.3. Test Method for Influencing Factors of Degradation Reaction Efficiency
Methyl orange solution was prepared by dissolving 0.6000 g of methyl orange in deionized water to a total volume of 1000 mL (600 mg/L). In a 100 mL solution, the pH was adjusted using H2SO4 and NaOH. Prescribed amounts of catalyst and sodium persulfate were added, followed by stirring. The COD value was measured, and the COD removal rate was used to evaluate the catalytic oxidation efficiency. Optimal reaction conditions, including pH, catalyst dosage, and sodium persulfate dosage, were determined based on these results. The degradation effect of methyl orange was analyzed by GC-MS.
2.3.4. Research Methods of Catalyst Recovery and Reusability
A magnetic field, generated using a magnet, was employed for the rapid separation of the persulfate catalyst. The catalyst was tested under optimum single-factor test conditions. Post-testing, it was retrieved through vacuum filtration and dried in an oven. The above test was continued to study the reusability of the catalyst.
3. Results and Discussion
3.1. Optimization of Preparation of New Activated Persulfate Catalyst
3.1.1. Effect of Ni Doping Amount on the Catalyst
Magnetic Fe3O4 was formed after the chemical co-precipitation of Fe3+ and Fe2+ (theoretical molar ratio of 2:1). However, Fe2+ was easily oxidized to Fe3+ during the reaction. Therefore, increasing the amount of Fe2+ to solve the problem of Fe2+ oxidation was beneficial in increasing the yield of Fe3O4. The dosages of Fe3+ and Fe2+ were maintained at 0.0025 mol and 0.00167 mol, respectively. In this experiment, 0.675 g of FeCl3 and 0.465 g of Fe2SO4 were added into a 100 mL beaker, followed by varying amounts of Ni (NO3)3 to maintain a Fe3+ + Fe2+:Ni3+ molar ratio of (1~5):1. Then, 2.59 g of powdered activated carbon (PAC) was added, and the mixture was reacted in a water bath at 60 °C for 1 h. The pH was adjusted to 9~10 using NH3·H2O, and the reaction continued for an additional hour. Post-reaction, the sample underwent filtration, drying in a 100 °C blast oven, and calcination in a 300 °C muffle furnace for 4 h.
The degradation target was 600 mg/L methyl orange solution. For the degradation test, five 100 mL aliquots of the methyl orange solution were taken and placed in 250 mL beakers. The pH was adjusted to neutral with H2SO4 and NaOH, and 0.3 g of the prepared catalyst and 1 g of sodium persulfate were added to each. The reaction proceeded at room temperature for 2 h, after which the COD value was measured. The degradation results are presented in Figure 1.
The analysis of Figure 1 reveals a trend where the COD removal rate initially increases, and then, decreases as the Ni content in the catalyst rises. Introducing a small amount of Ni enhances the catalyst’s activity. However, when the doping amount of Ni is too high, the amount of Ni adsorbed on the PAC increases, which may affect the chemical structure of the active component and the uneven distribution on the PAC, thus affecting the catalytic effect of the catalyst [29]. The degradation process demonstrates that the most effective Fe3+ + Fe2+:Ni3+ molar ratio is 4:1. At this ratio, the effluent COD value is reduced to 158.1 mg/L within a 2 h reaction period, achieving a COD removal rate of 79.07%. Therefore, the optimal molar ratio of Fe3+ + Fe2+:Ni3+ for the catalyst is established to be 4:1.
3.1.2. Effect of PAC Addition to the Catalyst
Activated carbon itself has the ability to catalyze persulfate, and may have a synergistic catalytic effect with metal oxides produced by loading Fe and Ni [30,31]. Thus, varying the PAC amount significantly influences the efficiency of activated persulfate. Under optimal conditions (Fe3+ + Fe2+:Ni3+ = 4:1), the catalyst was prepared with varying Fe3O4:PAC mass ratios (1:1, 1:2, 1:3, 1:4, 1:5). The other preparation steps remained unchanged. The degradation target and conditions were identical to the previous experiments, focusing on the COD removal efficiency of catalysts with different PAC additions. The results are depicted in Figure 2.
Figure 2 illustrates an initial increase and subsequent decrease in the COD removal rate with increasing PAC addition. The maximum removal rate (79.98%) occurs at a Fe3O4:PAC ratio of 1:4. When the PAC levels rise, the proportion of active components in the catalyst decreases, and the catalyst’s catalytic performance is mainly carried out by the activated carbon itself. This prevents achieving synergistic catalysis, leading to reduced COD removal efficiency. The optimal Fe3O4:PAC (mass ratio) for a catalytic effect is 1:4.
3.1.3. Effect of Calcination Temperature on the Catalyst
The literature suggests that calcination temperature has a great influence on the activity of the catalyst. Catalysts prepared at different calcination temperatures have different catalytic properties. Different calcination temperatures can affect the formation of metal oxides loaded on the surface of activated carbon and the physical properties of activated carbon itself [32], which, in turn, affects the activity of the catalyst. On the other hand, the calcination temperature also has a great influence on the magnetic properties of the catalyst. In a certain temperature range, the higher the temperature, the stronger the magnetic properties, and the more favorable the recovery and reuse of the catalyst [33,34]. We examined the effects of various calcination temperatures (300, 400, 500, 600, 700, and 800 °C) on catalyst performance, keeping the other conditions the same as before. The COD removal efficiency was assessed under these conditions, and the results are shown in Figure 3.
From the results of Figure 3, it can be seen that the calcination of the catalysts at different temperatures has a great influence on the COD removal rate. When the calcination temperature is 300 °C, the COD removal rate reaches 78.85% after 2 h of reaction. Compared with the catalyst prepared at 400 °C and 500 °C, the COD removal rate is higher. The reason may be that at 300 °C, PAC has a higher degree of activation. In the process of catalyzing the degradation of pollutants by sodium persulfate, it shows better adsorption performance. After 400 °C, the COD removal rate increases first, and then, decreases with the change in temperature. When the temperature reaches 700 °C, the performance of the catalyst reaches its highest, and the COD removal rate reaches a maximum of 81.35%. At this time, the reason for the maximum COD removal rate may be that the material formed by the metal ions adsorbed by PAC calcined at 700 °C has better catalytic performance. Then, the calcination temperature continues to increase, but the COD removal rate decreases. The reason may be that the PAC structure changes at too high a temperature and the PAC is partially inactivated, or the change in the active component leads to a decrease in the removal rate [35]. According to the degradation results, the optimum calcination temperature is 700 °C.
3.1.4. Effect of Calcination Time on the Catalyst
The length of calcination time is related to whether the metal ions loaded on the PAC can be completely converted into active components that play a role in catalysis, which has a significant effect on the final activity of the catalyst [36]. We varied the calcination time (2, 4, 6, 8, 10 h) to prepare the catalyst, and the other conditions were the same as above. After the calcination, the catalysts with different calcination time were used to degrade the methyl orange solution under the same conditions, and the changes in COD before and after the reaction were tested. The results are shown in Figure 4.
Figure 4 indicates that the catalyst’s activity increases, and then, decreases with calcination time. The optimal COD removal rate (82.67%) was observed to be 4 h. Too short a calcination time may lead to incomplete oxidation of metal ions adsorbed on the surface of activated carbon, and the conversion degree of active components is not high. The activation degree of activated carbon itself is not high, and the adsorption performance cannot be improved, which, in turn, affects the catalytic performance of the catalyst. When the calcination time exceeds a certain limit, it may lead to partial sintering of the active component of the catalyst and the collapse of the internal structure of the activated carbon, and affect the catalytic activity [37]. Therefore, the best calcination duration was established to be 4 h.
Based on these findings, the optimal conditions for preparing the persulfate catalyst are as follows: an Fe3+ + Fe2+:Ni3+ molar ratio of 4:1, an Fe3O4:PAC mass ratio of 1:4, and calcination at 700 °C for 4 h. The catalyst prepared under these conditions was further characterized and analyzed.
3.2. Characterization of Catalyst
3.2.1. SEM Analysis
In order to explore the changes in surface morphology before and after the calcination of PAC loaded with Fe and Ni elements, we characterized and analyzed them using scanning electron microscopy, and the results are shown in Figure 5a,b. The surface morphology of PAC without any treatment is shown in Figure 5c,d. At this time, the surface of powdered activated carbon is relatively flat and has no pore structure. After the calcination of the supported Fe and Ni elements, the surface particle material increases significantly and is full of pore structures. The production of these pore structures can create more favorable conditions for the contact between the catalyst and the oxidant, and can enhance the adsorption performance of the catalyst itself [38].
3.2.2. TEM Analysis
3.2.3. EDS Analysis
3.2.4. XRD Analysis
XRD can accurately analyze the crystal structure of the material on the surface of the catalyst. Through the analysis using the X-ray diffraction instrument, the form of the active material on the surface of the catalyst can be known. The X-ray diffraction pattern of the catalyst is shown in Figure 8. It can be seen from the diagram that the diffraction peaks appear at 2θ values equal to 30.2°, 35.6°, 37.2°, 43.6°, 53.8°, 57.3°, 63.0°, 71.8°, 74.5°, 75.8°, and 79.2°, corresponding to (220), (311), (222), (400), (422), (511), (400), (620), (533), (622), and (444) of the NiFe2O4 structure, which are completely consistent with the characteristic peaks of the X-ray diffraction standard card (74-2081), indicating that the active substance formed on the surface of the catalyst is NiFe2O4.
3.3. Factors Affecting Degradation Efficiency of Oxidation System
3.3.1. Effect of Initial pH on COD Removal Rate
The initial pH of methyl orange solution significantly influences the effectiveness of catalytic persulfate treatment. Different pollutants require different optimal pH conditions for treatment, achieving best results under acidic, neutral, or alkaline conditions [40,41]. This variability necessitates a specific analysis of the impact of pH on degradation efficacy.
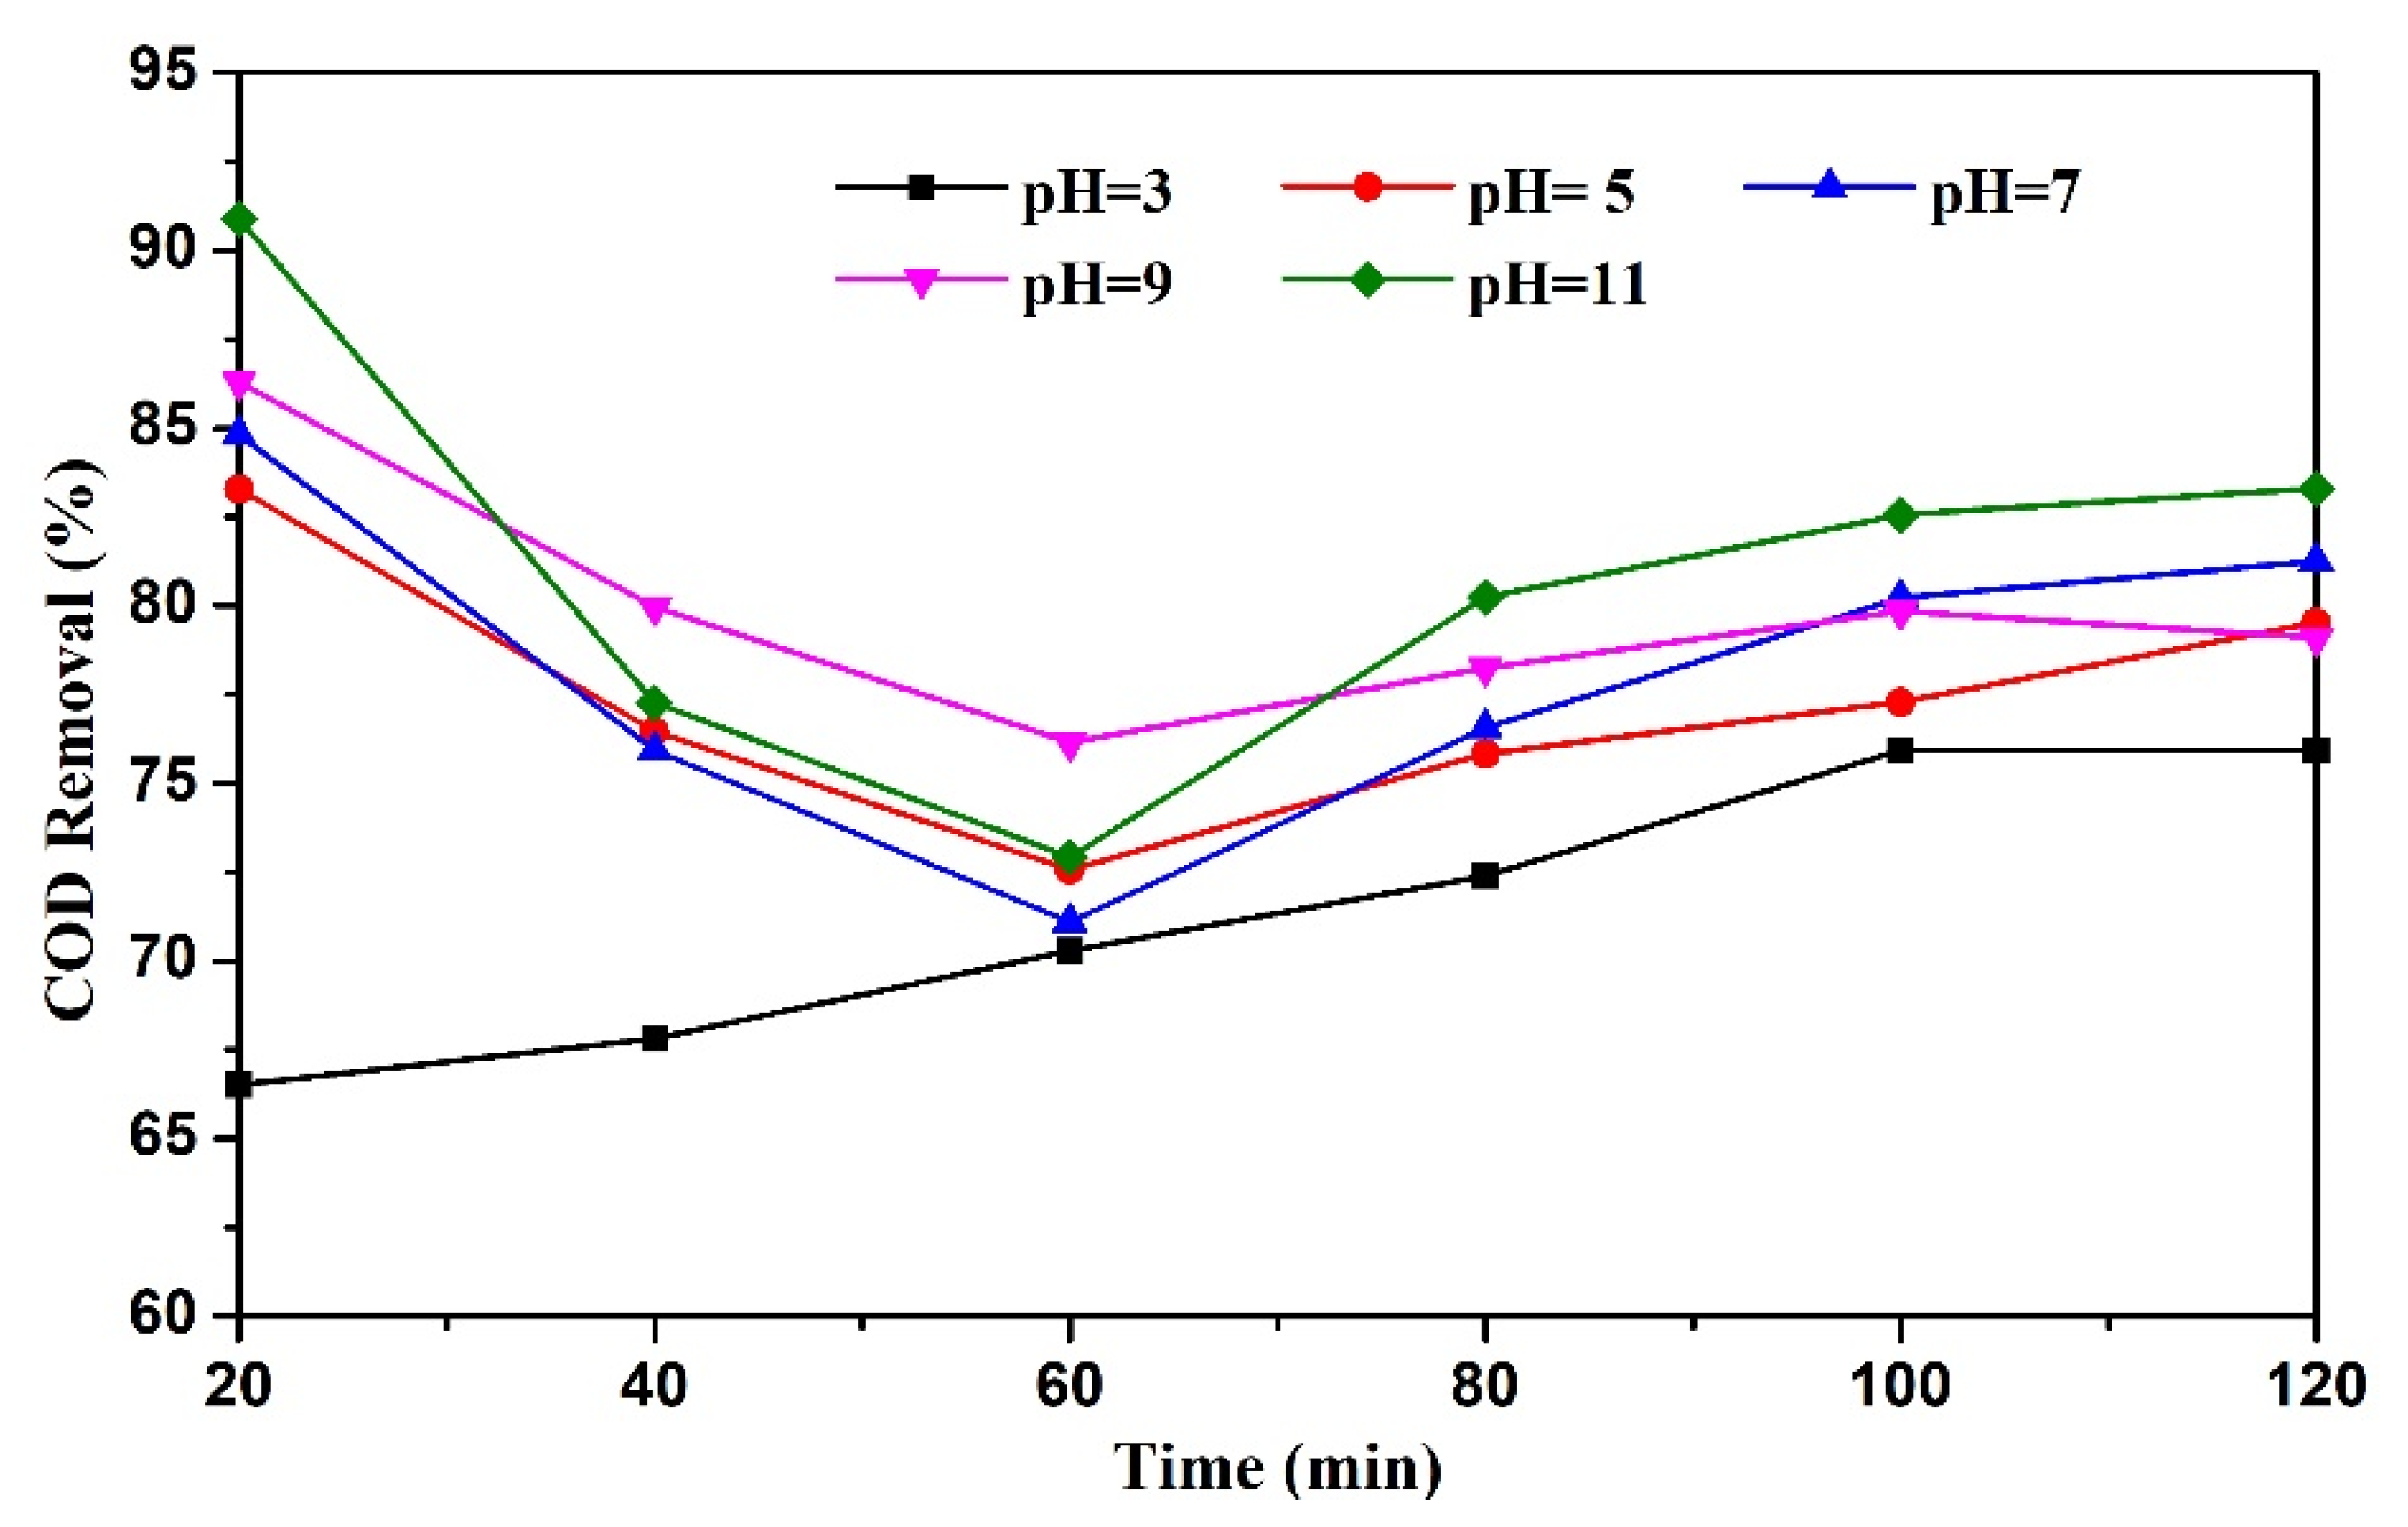
In this section, the effect of initial pH value on the degradation of the methyl orange simulated solution by the oxidation system composed of the catalyst and sodium persulfate was studied. The experimental procedure was as follows: Five 100 mL portions of methyl orange solution (600 mg/L) were placed in 250 mL beakers. The pH values of these solutions were adjusted to 3, 5, 7, 9, and 11 using H2SO4 and NaOH, respectively. To each solution, 0.3 g of catalyst and 1 g of sodium persulfate were added. The reaction mixture was then stirred at room temperature for 2 h, with samples taken every 20 min to measure the COD values. The results of this study are presented in Figure 9.
Figure 9 illustrates the impact of the initial pH values on the COD removal rate during the sodium persulfate-catalyzed degradation of methyl orange over a 2 h period. It can be seen from the diagram that when the reaction is carried out for 20 min, the lower the initial pH, the lower the COD removal rate. This trend suggests that lower pH values diminish the adsorption performance of the catalyst. Additionally, at pH values above 5, the catalyst’s adsorption capacity is observed to be more significant than its oxidation capability within the first hour of the reaction. From the point of view of the whole reaction process, the process of the catalyst catalyzing the degradation of methyl orange by sodium persulfate involves the adsorption of the methyl orange molecule on the surface of the catalyst first, then oxidative desorption, and then, stabilization. When the pH is 3, the performance of the catalyst is the worst, and the COD removal rate is 75.93%. Conversely, at pH 11, the catalyst’s performance peaks, achieving an 83.3% COD removal rate. A moderate pH of 7 yields a removal rate of 81.27%. In the catalyst application process, few of them can achieve this effect under acidic, neutral, and alkaline conditions. It can be seen that the catalyst has good pH adaptability. Taking economic factors into account, a pH of 7 is identified as the optimal condition for the degradation process.
3.3.2. Effect of Catalyst Dosage on COD Removal Rate
The dosage of the catalyst plays a crucial role in the removal of pollutants, directly influencing the release of free radicals and the degradation efficiency of pollutants [42]. At lower catalyst dosages, the catalytic effect is subdued, leading to reduced catalytic efficiency. Conversely, an excessive dosage accelerates the reaction too rapidly, quenching free radicals, diminishing sodium persulfate utilization, and consequently lowering the overall reaction efficiency. Thus, understanding the relationship between catalyst dosage and pollutant removal is vital.
To explore this relationship, we employed a controlled variable method, maintaining constant conditions while varying the catalyst dosage. The experimental procedure involved preparing five samples of 100 mL methyl orange solution (600 mg/L) in 250 mL beakers. The pH of each solution was adjusted to 7 using H2SO4 and NaOH. Varying amounts of the catalyst (0.1, 0.2, 0.3, 0.4, and 0.5 g) were added to each sample, along with a constant 1 g of sodium persulfate. The mixtures were stirred at room temperature for 2 h, with COD values measured at 20 min intervals. The outcomes of these experiments are depicted in Figure 10.
Figure 10 presents a reaction curve akin to that of Figure 9, shedding light on the dynamics of the catalytic process. In the initial phase, the catalyst predominantly exhibits strong adsorption properties, with adsorption prevailing over oxidation. Methyl orange molecules are initially adsorbed onto the catalyst’s surface. When the active site makes contact with S2O82−, substantial amounts of ·SO4− and ·OH radicals are generated, leading to the gradual oxidation of the methyl orange into smaller organic molecules, and gradually separated from the adsorption of the catalyst. This leads to an initial increase in the COD value of the solution. As the reaction progresses beyond 60 min, the previously adsorbed methyl orange is largely converted into small-molecular organic matter. The free radicals produced during this stage are primarily involved in attacking these smaller organic molecules, leading to a decrease in the COD value, which eventually stabilizes after 120 min. The characteristic peak of methyl orange disappeared and was completely degraded by GC-MS.
Notably, the optimal COD removal rate of 85.4% is achieved at a catalyst dosage of 4 g/L, as indicated in Figure 10. This rate represents the peak efficiency in the catalytic degradation process. Consequently, a catalyst dosage of 4 g/L is identified as the most effective single factor in this reaction system.
3.3.3. Effect of Sodium Persulfate Dosage on COD Removal Rate
As a primary oxidant in the reaction, sodium persulfate’s dosage plays a critical role in the oxidation process. To assess its effect on the COD removal rate, an experiment was conducted with varying dosages of sodium persulfate. Five samples of 100 mL methyl orange solution were prepared in 250 mL beakers, with the pH adjusted to 7 using H2SO4 and NaOH. In each solution, 0.4 g of the catalyst was added, followed by different amounts of sodium persulfate: 0.5, 0.75, 1, 1.25, and 1.5 g. The reactions were stirred at room temperature for 2 h, and the COD values were measured at 20 min intervals. The outcomes are depicted in Figure 11.
The reaction involving sodium persulfate leads to the production of a significant amount of SO42−, which alters the solution’s pH. The more sodium persulfate is added, the lower the pH value will be. Figure 11 indicates that when the sodium persulfate dosage is less than or equal to 10 g/L, the COD removal rate initially decreases, and then, increases. Conversely, at dosages higher than 10 g/L, the removal rate first increases, and then, decreases. It can be inferred that when the amount of sodium persulfate is too large, it affects the pH value of the solution, making the pH low, affecting the adsorption performance of the catalyst, which is the reason why the COD degradation curve tends to be stable after increasing. Furthermore, this conclusion is similar to that regarding the effect of initial pH on COD removal rate in Figure 9. When the pH value is 3, the catalyst also shows a similar degradation curve. It is obvious in the figure that when the dosage of sodium persulfate is 10 g/L, the oxidation system has the best treatment effect on methyl orange, so 10 g/L is the best dosage of sodium persulfate.
3.4. Catalyst Recovery and Reusability
The problem of catalyst recovery and reusability is the bottleneck restricting the development of the advanced oxidation technology industry. An excellent catalyst not only needs high catalytic activity, but also requires convenient recovery performance and good reusability [43].
3.4.1. Recovery of Catalyst
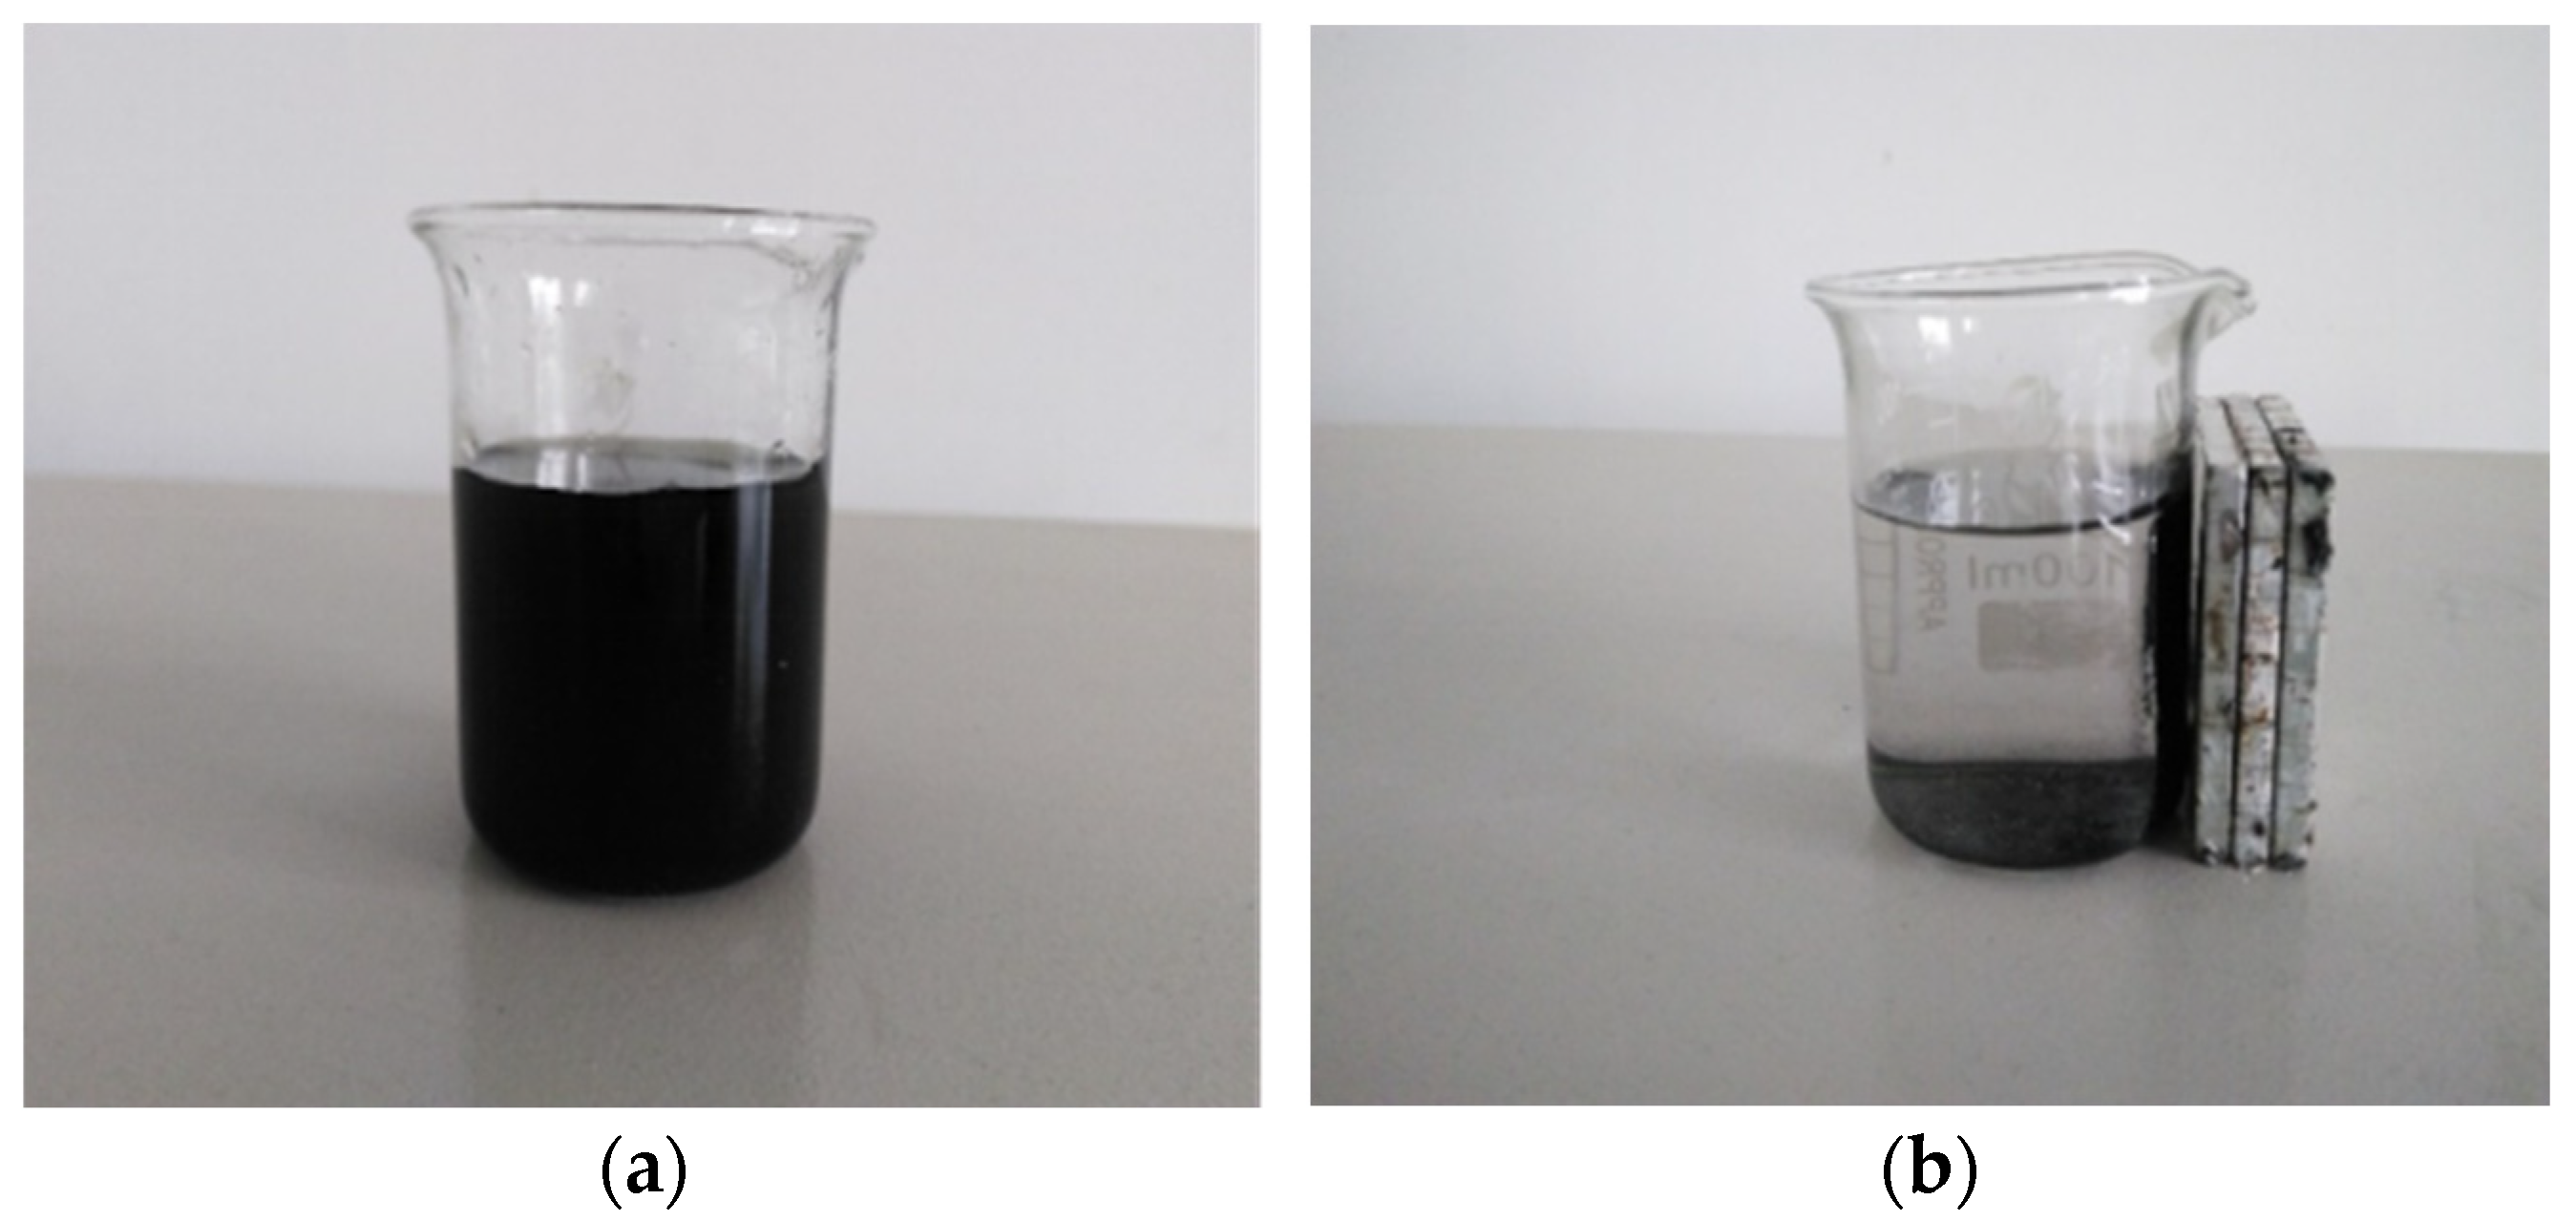
After the reaction, the catalyst is dispersed in the aqueous solution, as depicted in Figure 12a. Upon applying a magnetic field, the catalyst rapidly adheres to the beaker wall, resulting in a clear solution, as shown in Figure 12b. The entire process of catalyst separation takes less than one minute, demonstrating its efficient recovery.
3.4.2. Reusability of the Catalyst
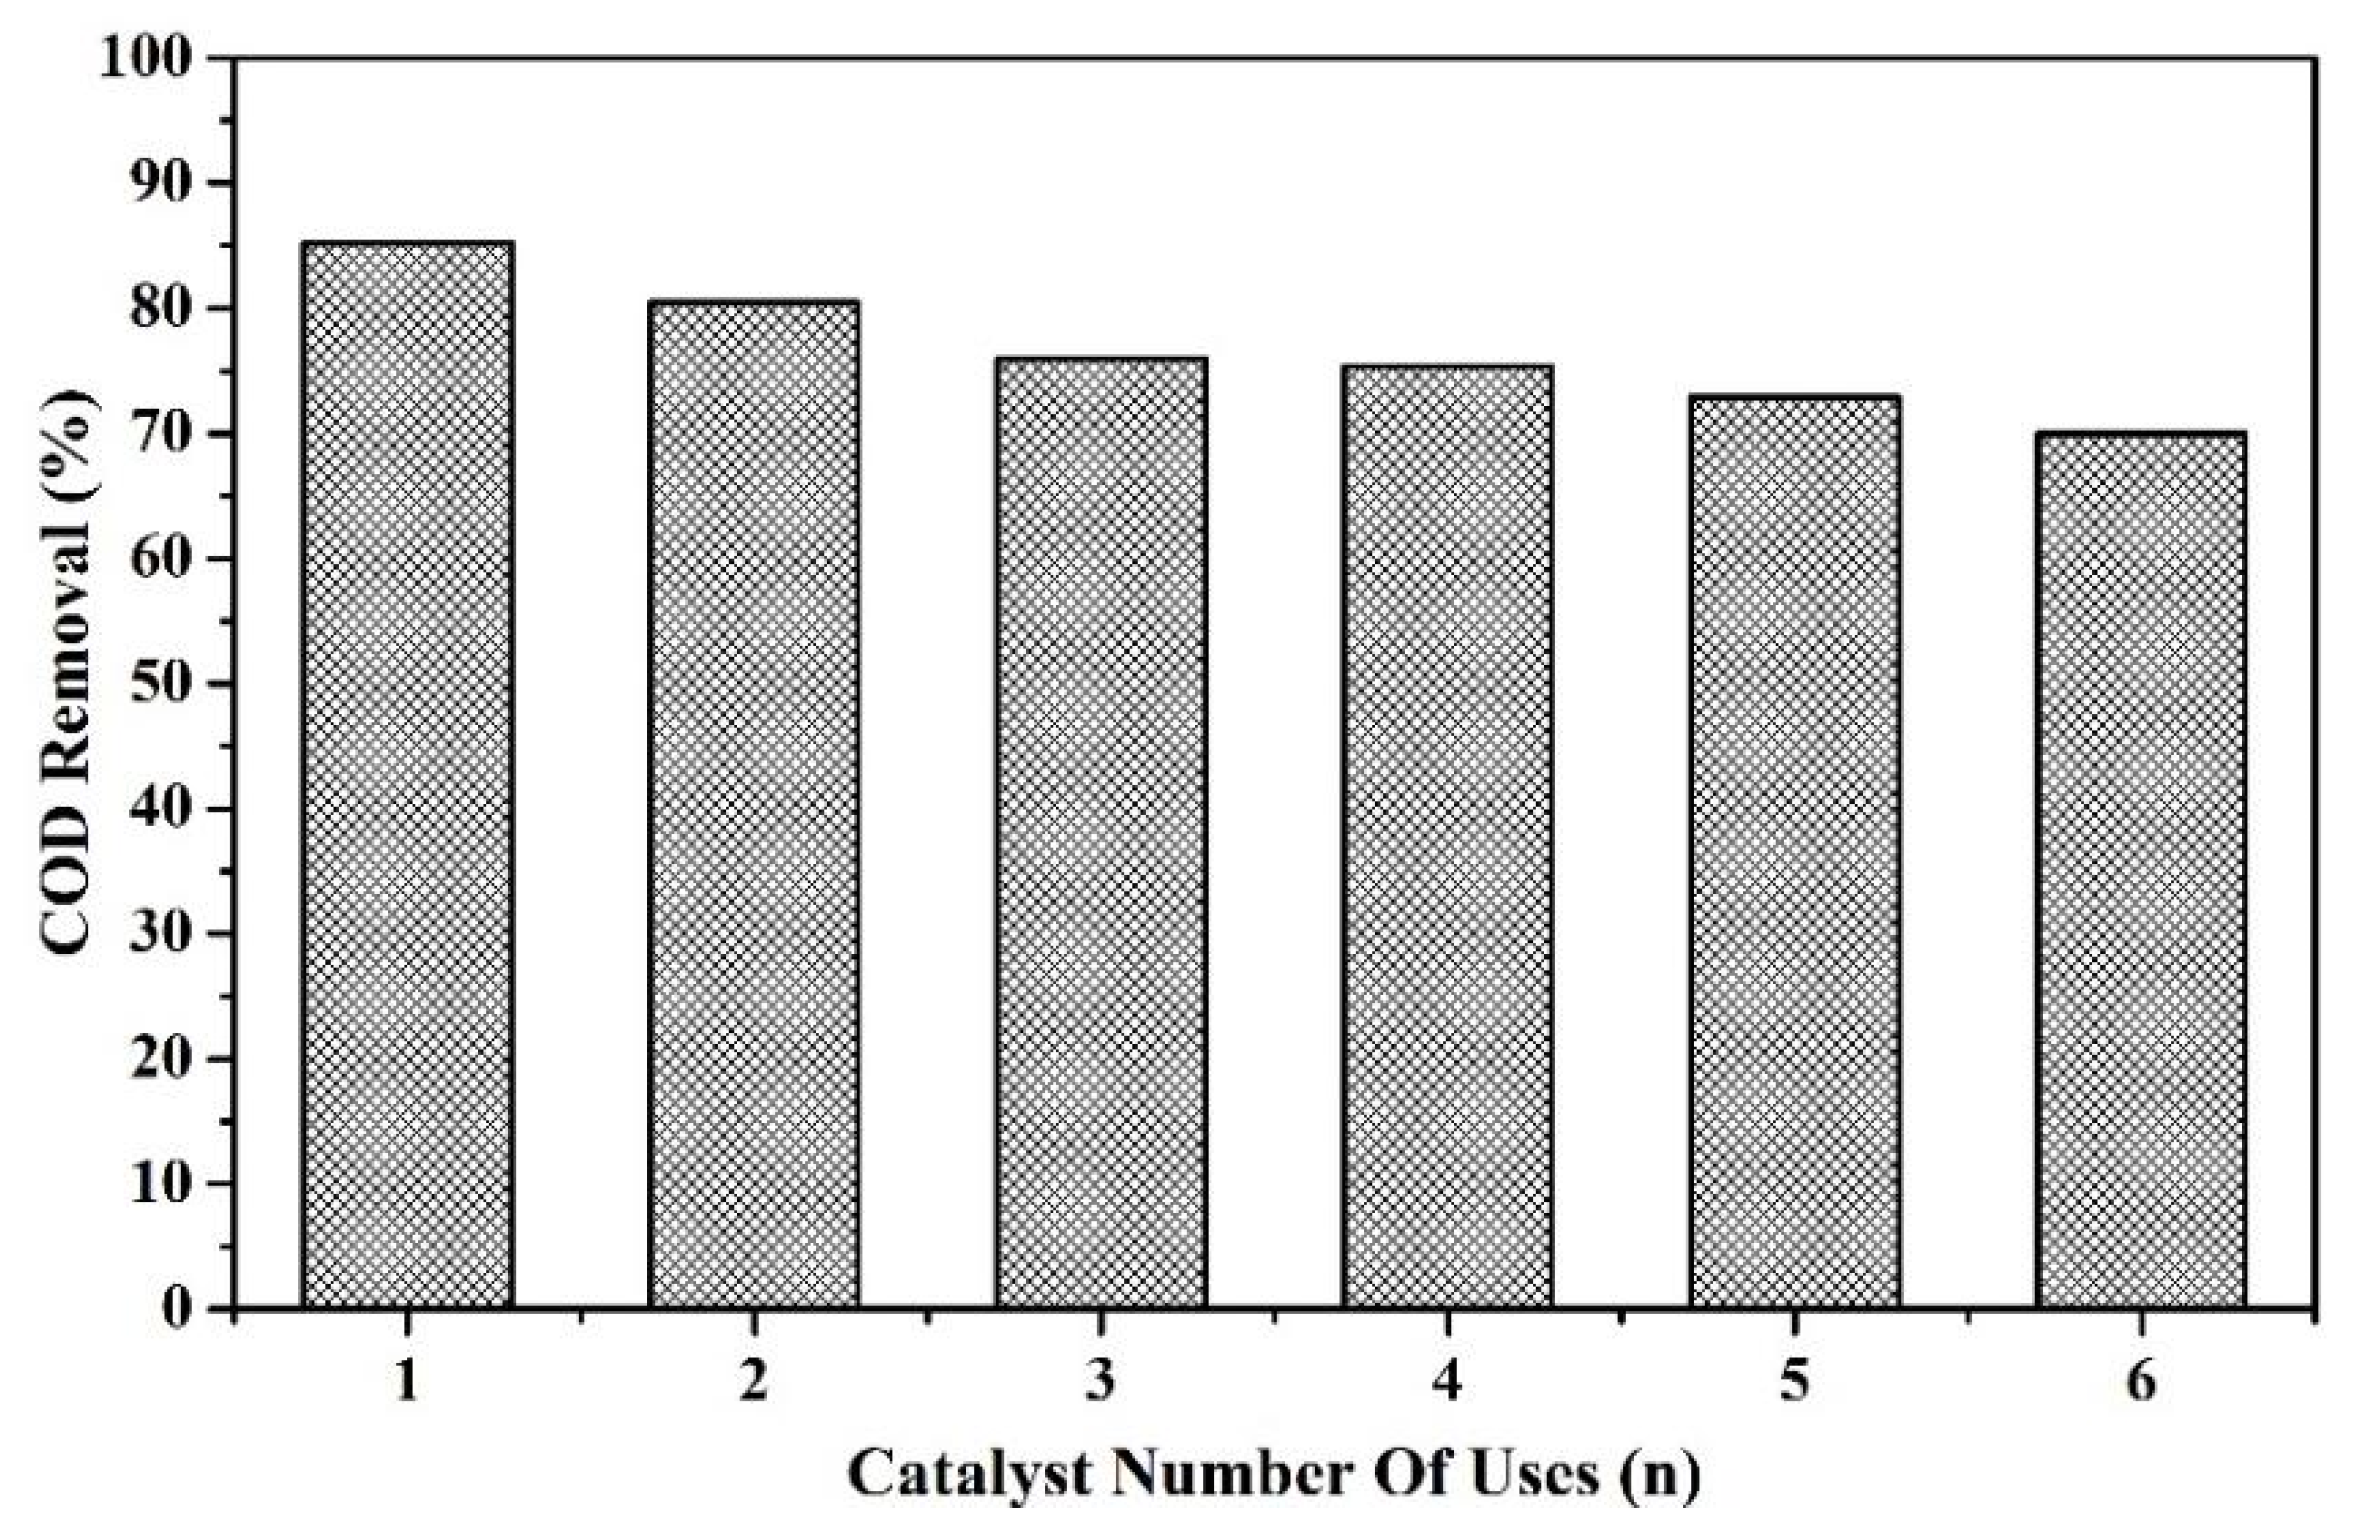
Figure 13 illustrates the COD degradation rate over six repeated uses of the catalyst under optimal conditions. The figure reveals a gradual decline in catalytic efficiency with each use. However, even after six cycles, the catalyst’s efficiency remains over 70%, only 15% less than its initial usage. This finding underscores the catalyst’s notable reusability alongside its high catalytic performance [44].
4. Conclusions
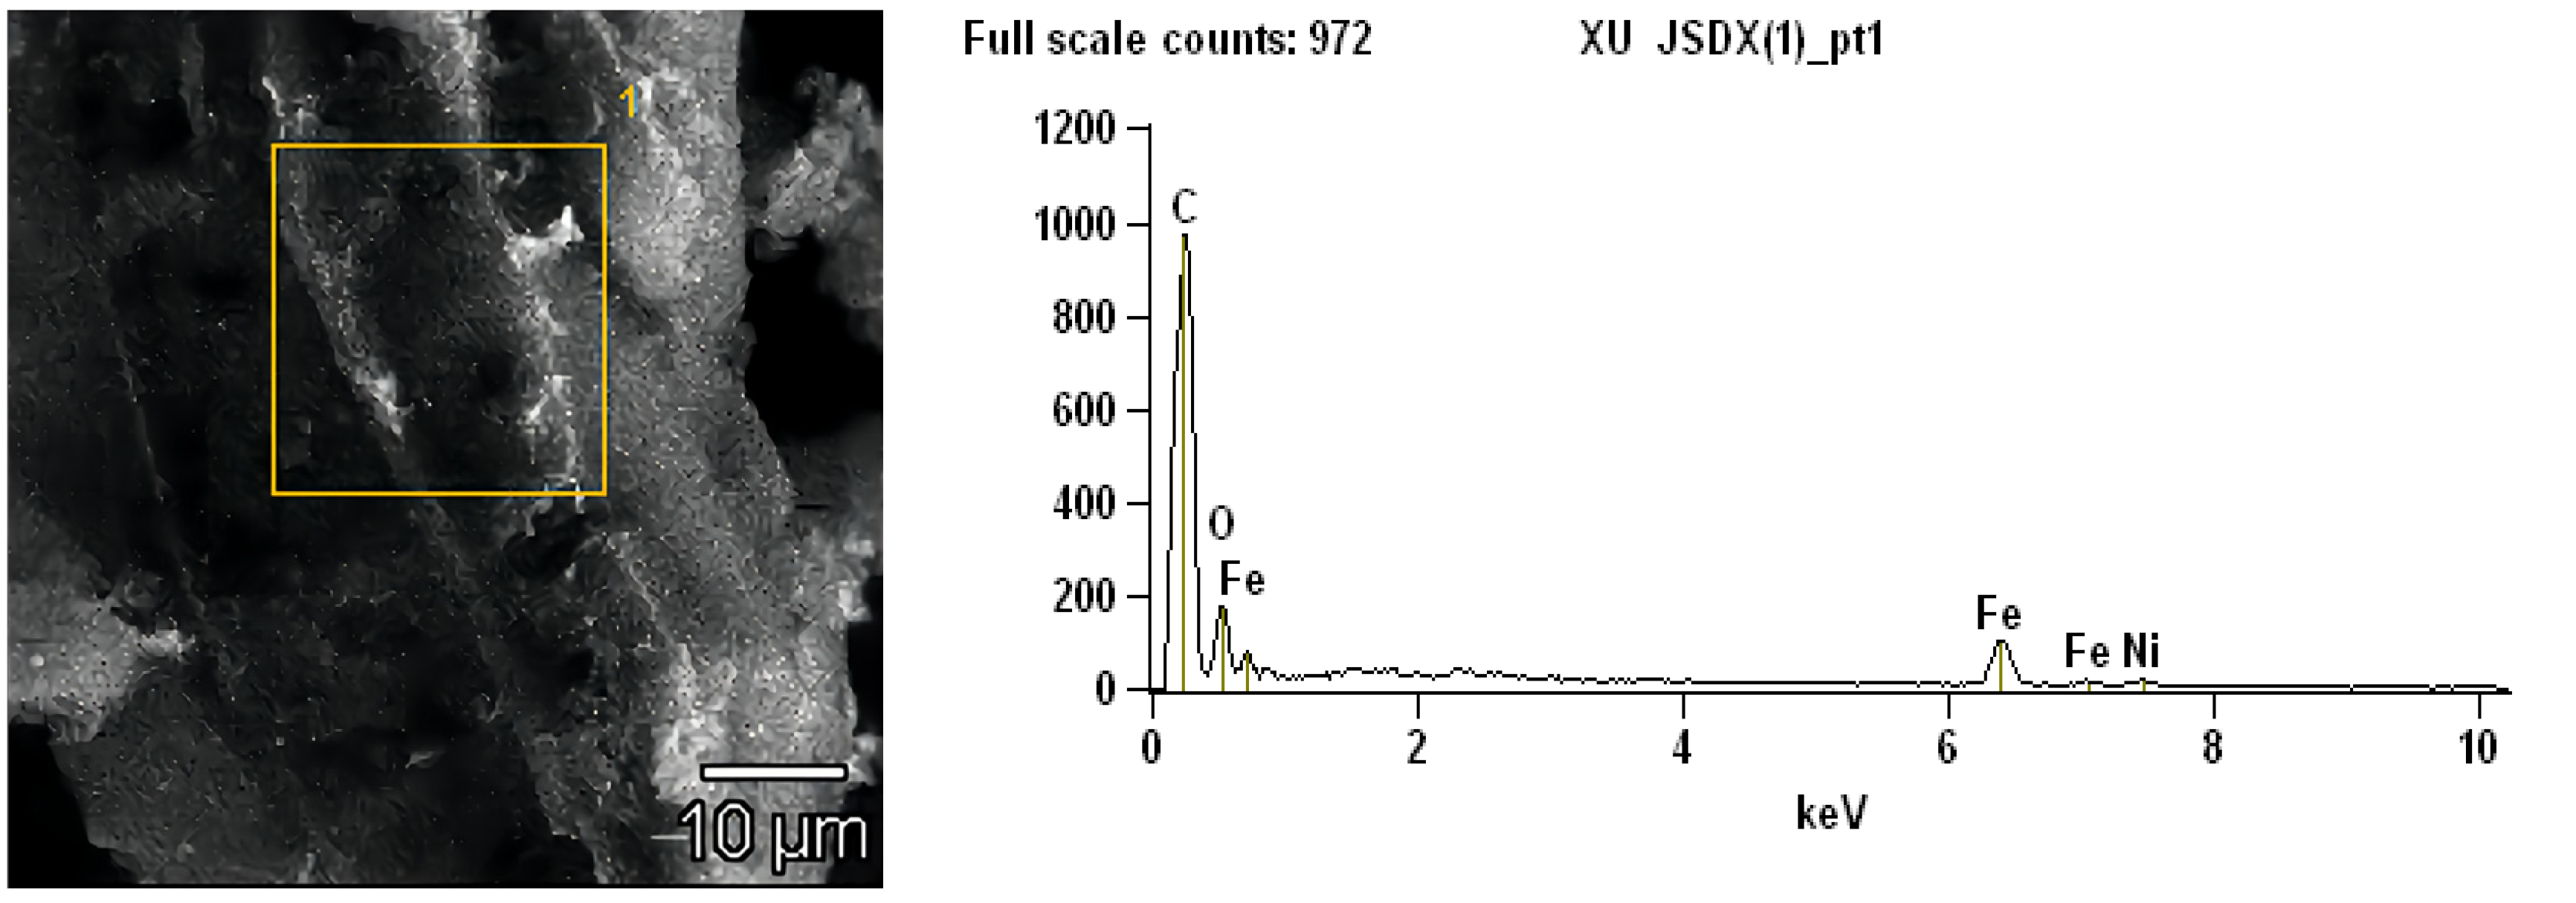
In this study, we focused on treating methyl orange using a prepared activated persulfate catalyst. The catalyst was synthesized using an optimal process: a molar ratio of Fe3+ and Fe2+ to Ni of 4:1, a mass ratio of Fe3O4 to PAC of 1:4, a calcination temperature of 700 °C, and a calcination duration of 4 h. Characterization techniques such as SEM, TEM, EDS, and XRD were employed. The characterization results show that the catalyst exhibited a hollow internal structure with increased granular material on its surface, enhanced porosity, and nickel ferrite as the active surface material. The elemental weight ratios were determined to be 72.84% C, 16.76% O, 8.37% Fe, and 2.03% Ni, with corresponding atomic proportions of 83.11%, 14.36%, 2.05%, and 0.47%.
This study also investigated the influence of reaction pH, catalyst dosage, and oxidant dosage on the degradation efficiency of methyl orange by the catalyst–sodium persulfate oxidation system. It was found that the COD removal efficiency increased with rising pH values. Both the catalyst and sodium persulfate dosages impacted the COD removal efficiency, which first increased, and then, decreased with increasing dosages. The catalyst demonstrated effective catalytic performance over a wide pH range (3~11). Additionally, the catalyst exhibited strong magnetic properties, enabling complete adsorption on the beaker wall within less than 1 min in a magnetic field. Even after six cycles of reuse, the catalyst maintained over 70% of its initial catalytic efficiency.
The GC-MS analysis revealed that the methyl orange molecules were completely oxidized during the treatment process, achieving a 100% removal rate. These results underscore the significant role of the newly developed activated persulfate catalyst in treating methyl orange.
Author Contributions
Proposal of research ideas, design and development research methods, writing—original draft preparation, B.Z.; investigation, experimental analysis, J.L.; data analysis, Z.X.; data curation, supervision, academic guidance, X.X.; resource provision, C.W. All authors have read and agreed to the published version of the manuscript.
Funding
This work was supported by the Jiangsu Province Science and Technology Support Plan (BE2022338) and the Changzhou Sci&Tech Program (China, No. CJ20220025).
Data Availability Statement
Data will be made available on request.
Conflicts of Interest
The authors declare no conflicts of interest.
References
- Mi, J.; Tian, L.; Liu, L.; Qi, H.; Wang, Y.; Qin, Y.; Liu, Y. Research Progress on Persulfate Activation Method. Ind. Water Treat. 2020, 40, 12–17. [Google Scholar]
- Tian, K.; Hu, L.; Li, L.; Zheng, Q.; Xin, Y.; Zhang, G. Recent Advances in Persulfate-Based Advanced Oxidation Processes for Organic Wastewater Treatment. Chin. Chem. Lett. 2022, 33, 4461–4477. [Google Scholar] [CrossRef]
- Huang, W.; Xiao, S.; Zhong, H.; Yan, M.; Yang, X. Activation of Persulfates by Carbonaceous Materials: A Review. Chem. Eng. J. 2021, 418, 129297. [Google Scholar] [CrossRef]
- Liu, F.; Zhang, Y.; Wang, S.; Gong, T.; Hua, M.; Qian, J.; Pan, B. Metal-Free Biomass with Abundant Carbonyl Groups as Efficient Catalyst for the Activation of Peroxymonosulfate and Degradation of Sulfamethoxazole. Chem. Eng. J. 2022, 430, 132767. [Google Scholar] [CrossRef]
- Ranjbari, A.; Kim, J.; Yu, J.; Kim, J.; Park, M.; Kim, N.; Demeestere, K.; Heynderickx, P. Effect of Oxygen Vacancy Modification of ZnO on Photocatalytic Degradation of Methyl Orange: A Kinetic Study. Catal. Today 2024, 427, 114413. [Google Scholar] [CrossRef]
- Rao, L.; Yang, Y.; Liu, X.; Huang, Y.; Chen, M.; Yao, Y.; Wang, W. Heterogeneous Activation of Persulfate by Supporting Ferric Oxalate onto Activated Carbon Fibers for Organic Contaminants Removal. Mater. Res. Bull. 2020, 130, 110919. [Google Scholar] [CrossRef]
- Bhat, A.; Gogate, P. Degradation of Nitrogen-Containing Hazardous Compounds Using Advanced Oxidation Processes: A Review on Aliphatic and Aromatic Amines, Dyes, and Pesticides. J. Hazard. Mater. 2021, 403, 123657. [Google Scholar] [CrossRef] [PubMed]
- Liu, Q.; Chen, L. Research Progress on Activation Generation of Sulfate Radical. Appl. Chem. Ind. 2021, 50, 3135–3139. [Google Scholar]
- Dominguez, C.; Romero, A.; Lorenzo, D.; Santos, A. Thermally Activated Persulfate for the Chemical Oxidation of Chlorinated Organic Compounds in Groundwater. J. Environ. Manag. 2020, 261, 110240. [Google Scholar] [CrossRef]
- Fang, Z.; Huang, R.; Chelme-Ayala, P.; Shi, Q.; Xu, C.; El-Din, M. Comparison of UV/Persulfate and UV/H2O2 for the Removal of Naphthenic Acids and Acute Toxicity towards Vibrio Fischeri from Petroleum Production Process Water. Sci. Total Environ. 2019, 694, 133686. [Google Scholar] [CrossRef]
- Wang, Q.; Shi, Y.; Lv, S.; Liang, Y.; Xiao, P. Application Progress of Carbon Material Supported Metal Catalyst in Activation of Persulfate. New Chem. Mater. 2021, 49, 64–67. [Google Scholar]
- Gao, Y.; Zou, D. Efficient Degradation of Levofloxacin by a Microwave-3D ZnCo2O4/Activated Persulfate Process: Effects, Degradation Intermediates, and Acute Toxicity. Chem. Eng. J. 2020, 393, 124795. [Google Scholar] [CrossRef]
- Gujar, S.; Divyapriya, G.; Gogate, P.; Nidheesh, P. Environmental Applications of Ultrasound Activated Persulfate/Peroxymonosulfate Oxidation Process in Combination with Other Activating Agents. Crit. Rev. Environ. Sci. Technol. 2023, 53, 780–802. [Google Scholar] [CrossRef]
- Shi, J.; Wang, L.; Gao, S.; Huang, J.; Yang, H.; Lu, H.; Cao, S. Degradation of Diclofenac by Loaded Solid Superbase-Activated Persulfate. Int. J. Mol. Sci. 2023, 24, 14313. [Google Scholar] [CrossRef] [PubMed]
- Lu, S.; Wang, G.; Chen, S.; Yu, H.; Ye, F.; Quan, X. Heterogeneous Activation of Peroxymonosulfate by LaCo1-xCuxO3 Perovskites for Degradation of Organic Pollutants. J. Hazard. Mater. 2018, 353, 401–409. [Google Scholar] [CrossRef] [PubMed]
- Wang, C.; Huang, R.; Sun, R.; Yang, J.; Sillanpää, M. A Review on Persulfates Activation by Functional Biochar for Organic Contaminants Removal: Synthesis, Characterizations, Radical Determination, and Mechanism. J. Environ. Chem. Eng. 2021, 9, 106267. [Google Scholar] [CrossRef]
- Luo, H.; Zeng, Y.; He, D.; Pan, X. Application of Iron-Based Materials in Heterogeneous Advanced Oxidation Processes for Wastewater Treatment: A Review. Chem. Eng. J. 2021, 407, 127191. [Google Scholar] [CrossRef]
- Ma, Q.; Zhang, H.; Zhang, X.; Li, B.; Guo, R.; Cheng, Q.; Cheng, X. Synthesis of Magnetic CuO/MnFe2O4 Nanocompisite and Its High Activity for Degradation of Levofloxacin by Activation of Persulfate. Chem. Eng. J. 2019, 360, 848–860. [Google Scholar] [CrossRef]
- Xian, G.; Niu, L.; Zhang, G.; Zhou, N.; Long, Z.; Zhi, R. An Efficient CuO-γFe2O3 Composite Activates Persulfate for Organic Pollutants Removal: Performance, Advantages and Mechanism. Chemosphere 2020, 242, 125191. [Google Scholar] [CrossRef]
- Tian, D.; Zhou, H.; Zhang, H.; Zhou, P.; You, J.; Yao, G.; Pan, Z.; Liu, Y.; Lai, B. Heterogeneous Photocatalyst-Driven Persulfate Activation Process under Visible Light Irradiation: From Basic Catalyst Design Principles to Novel Enhancement Strategies. Chem. Eng. J. 2022, 428, 131166. [Google Scholar] [CrossRef]
- Ahn, Y.; Yun, E. Heterogeneous Metals and Metal-Free Carbon Materials for Oxidative Degradation through Persulfate Activation: A Review of Heterogeneous Catalytic Activation of Persulfate Related to Oxidation Mechanism. Korean J. Chem. Eng. 2019, 36, 1767–1779. [Google Scholar] [CrossRef]
- Zhou, S.; Wang, G.; Chen, H.; Feng, L.; Wang, D. Research Progress on Heterogeneous Persulfate-Based Catalytic Materials. Mod. Chem. Ind. 2020, 40, 20–25. [Google Scholar]
- Matzek, L.; Carter, K. Activated Persulfate for Organic Chemical Degradation: A Review. Chemosphere 2016, 151, 178–188. [Google Scholar] [CrossRef] [PubMed]
- Cai, C.; Zhang, H.; Zhong, X.; Hou, L. Electrochemical Enhanced Heterogeneous Activation of Peroxydisulfate by Fe-Co/SBA-15 Catalyst for the Degradation of Orange II in Water. Water Res. 2014, 66, 473–485. [Google Scholar] [CrossRef] [PubMed]
- He, X.; Yu, J.; Tao, Y.; Li, X.; Hou, J. Research Progress on the Degradation of Organic Pollutants in Water by Persulfate Activated with Different Catalysts. Environ. Pollut. Control 2021, 43, 1344–1349. [Google Scholar]
- Zhang, Y.; Zhang, Q.; Dong, Z.; Wu, L.; Hong, J. Structurally Modified CuFe2O4/Persulfate Process for Acetaminophen Scavenging: High Efficiency with Low Catalyst Addition. J. Chem. Technol. Biotechnol. 2019, 94, 785–794. [Google Scholar] [CrossRef]
- Wu, X.; Sun, D.; Ma, H.; Ma, C.; Zhang, X.; Hao, J. Activation of Peroxymonosulfate by Magnetic CuFe2O4@ZIF-67 Composite Catalyst for the Study on the Degradation of Methylene Blue. Colloids Surf. A Physicochem. Eng. Asp. 2022, 637, 128278. [Google Scholar] [CrossRef]
- Li, Y.; Sun, M.; Gao, B.; Hu, B.; Zhou, S.; Liu, B. 2D ZIF-L Arrays Supported on Zinc Foam to Activate Peroxymonosulfate for Degrading Sulfamethoxazole through Both Radical and Non-Radical Pathways. Sep. Purif. Technol. 2024, 330, 125656. [Google Scholar] [CrossRef]
- Wu, P.; Wu, J.; Huang, X.; Wang, L.; Liu, M.; Wang, Z.; Wang, Z. Effect of Doping Ni on Microstructures and Properties of CoxNi1-xHCF Based Seawater Battery. Vacuum 2024, 220, 112822. [Google Scholar] [CrossRef]
- Heidarinejad, Z.; Dehghani, M.; Heidari, M.; Javedan, G.; Ali, I.; Sillanpää, M. Methods for Preparation and Activation of Activated Carbon: A Review. Environ. Chem. Lett. 2020, 18, 393–415. [Google Scholar] [CrossRef]
- Tan, X.; Liu, S.; Liu, Y.; Gu, Y.; Zeng, G.; Hua, X.; Wang, X.; Liu, S.; Jiang, L. Biochar as Potential Sustainable Precursors for Activated Carbon Production: Multiple Applications in Environmental Protection and Energy Storage. Bioresour. Technol. 2017, 227, 359–372. [Google Scholar] [CrossRef] [PubMed]
- Lei, Z.; Sha, X.; Lei, Z.; Wang, R.; Zhang, L.; Shu, X. Influences of Different Preparation Conditions on Catalytic Activity of Ag2O-Co3O4/γ-Al2O3 for Hydrogenation of Coal Pyrolysis. J. Spectrosc. 2014, 2014, 272819. [Google Scholar]
- Babyszko, A.; Wanag, A.; Kusiak-Nejman, E.; Morawski, A. Effect of Calcination Temperature of SiO2/TiO2 Photocatalysts on UV-VIS and VIS Removal Efficiency of Color Contaminants. Catalysts 2023, 13, 186. [Google Scholar] [CrossRef]
- Ge, C.; Wang, L.; Liu, G.; Wu, R. Effects of Calcination Temperature on the Electromagnetic Properties of Carbon Nanotubes/Indium Tin Oxide Composites. J. Alloys Compd. 2019, 775, 647–656. [Google Scholar] [CrossRef]
- Wang, M.; Li, C.; Liu, B.; Qin, W.; Xie, Y. Influence of Calcination Temperature on Photocatalyst Performances of Floral Bi2O3/TiO2 Composite. Catalysts 2022, 12, 1635. [Google Scholar] [CrossRef]
- Cao, B.; Liu, Q.; Zhang, D. Synthesis and Characterization of Porous Carbon/Fe Nanocomposite. J. Inorg. Mater. 2010, 25, 457–462. [Google Scholar] [CrossRef]
- Alhalili, Z.; Smiri, M. The Influence of the Calcination Time on Synthesis of Nanomaterials with Small Size, High Crystalline Nature and Photocatalytic Activity in the TiO2 Nanoparticles Calcined at 500 °C. Crystals 2022, 12, 1629. [Google Scholar] [CrossRef]
- Hu, L.; Yan, Z.; Zhang, J.; Peng, X.; Mo, X.; Wang, A.; Chen, L. Surfactant Aggregates within Deep Eutectic Solvent-Assisted Synthesis of Hierarchical ZIF-8 with Tunable Porosity and Enhanced Catalytic Activity. J. Mater. Sci. 2019, 54, 11009–11023. [Google Scholar] [CrossRef]
- Wang, J.; Liu, H. The Effect of the Support Structure on Catalytic Activity: A Case Study on Hollow and Solid MoO3/SiO2. RSC Adv. 2016, 6, 2374–2378. [Google Scholar] [CrossRef]
- Fischbacher, A.; von Sonntag, C.; Schmidt, T. Hydroxyl Radical Yields in the Fenton Process under Various pH, Ligand Concentrations and Hydrogen Peroxide/Fe(II) Ratios. Chemosphere 2017, 182, 738–744. [Google Scholar] [CrossRef]
- Zhao, Q.; Mao, Q.; Zhou, Y.; Wei, J.; Liu, X.; Yang, J.; Luo, L.; Zhang, J.; Chen, H.; Chen, H.; et al. Metal-Free Carbon Materials-Catalyzed Sulfate Radical-Based Advanced Oxidation Processes: A Review on Heterogeneous Catalysts and Applications. Chemosphere 2017, 189, 224–238. [Google Scholar] [CrossRef]
- Oh, H.; Ko, Y. Effect of Polymerization Conditions on the Polymer Properties of CO2-Cyclohexene Oxide Copolymer Prepared by Double Metal Cyanide Catalyst. J. Ind. Eng. Chem. 2013, 19, 1939–1943. [Google Scholar] [CrossRef]
- Eisavi, R.; Ghadernejad, S. NiFe2O4@SiO2-Cu as a Novel and Efficient Magnetically Recoverable Nanocatalyst for Regioselective Synthesis of β-Thiol-1,2,3-Triazoles under Benign Conditions. RSC Adv. 2023, 13, 27984–27996. [Google Scholar] [CrossRef]
- Elansary, M.; Belaiche, M.; Oulhakem, O.; Alaoui, K.B.; Lemine, O.; Mouhib, Y.; Iffer, E.; Salameh, B.; Alsmadi, A. In-Depth Study of the Photocatalytic Performance of Novel Magnetic Catalysts for Efficient Photocatalytic Degradation of the Dye Orange G. Mater. Res. Bull. 2024, 170, 112598. [Google Scholar] [CrossRef]
Figure 1.
Effect of Ni doping amount on nickel-based bimetallic catalyst.
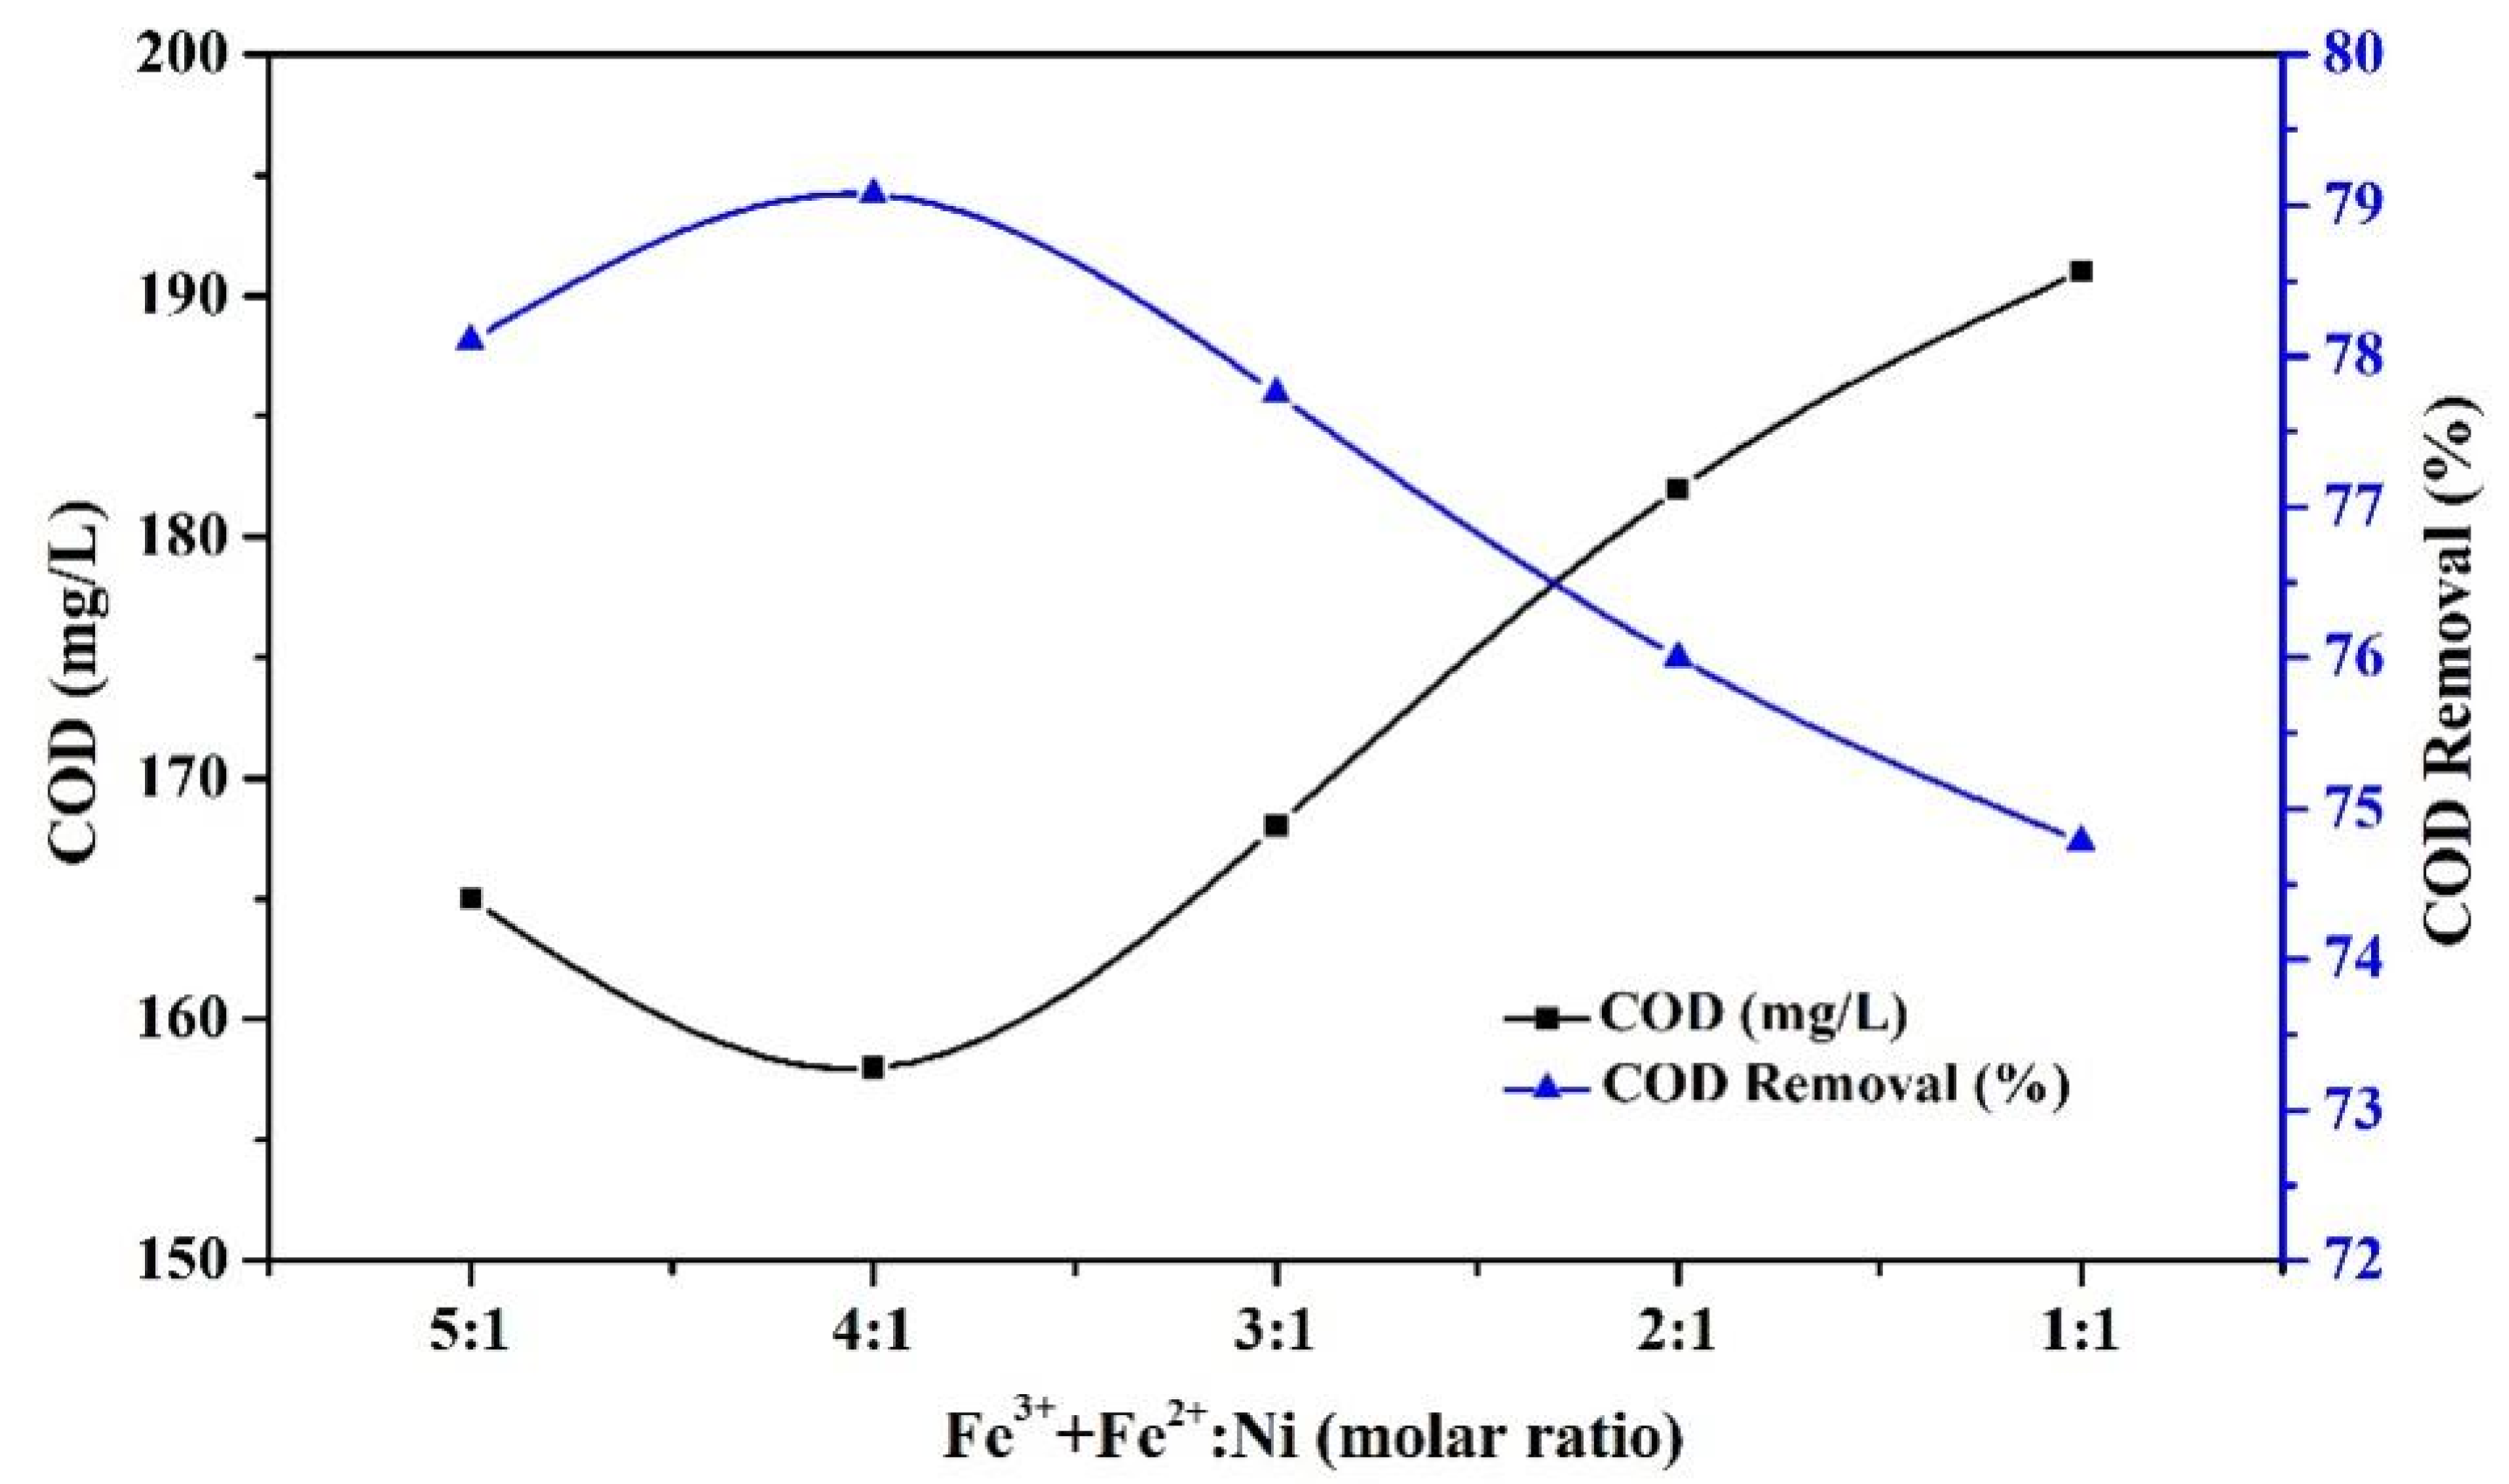
Figure 2.
Effect of PAC addition on nickel-based bimetallic catalyst.

Figure 3.
Effect of calcination temperature on nickel-based bimetallic catalyst.
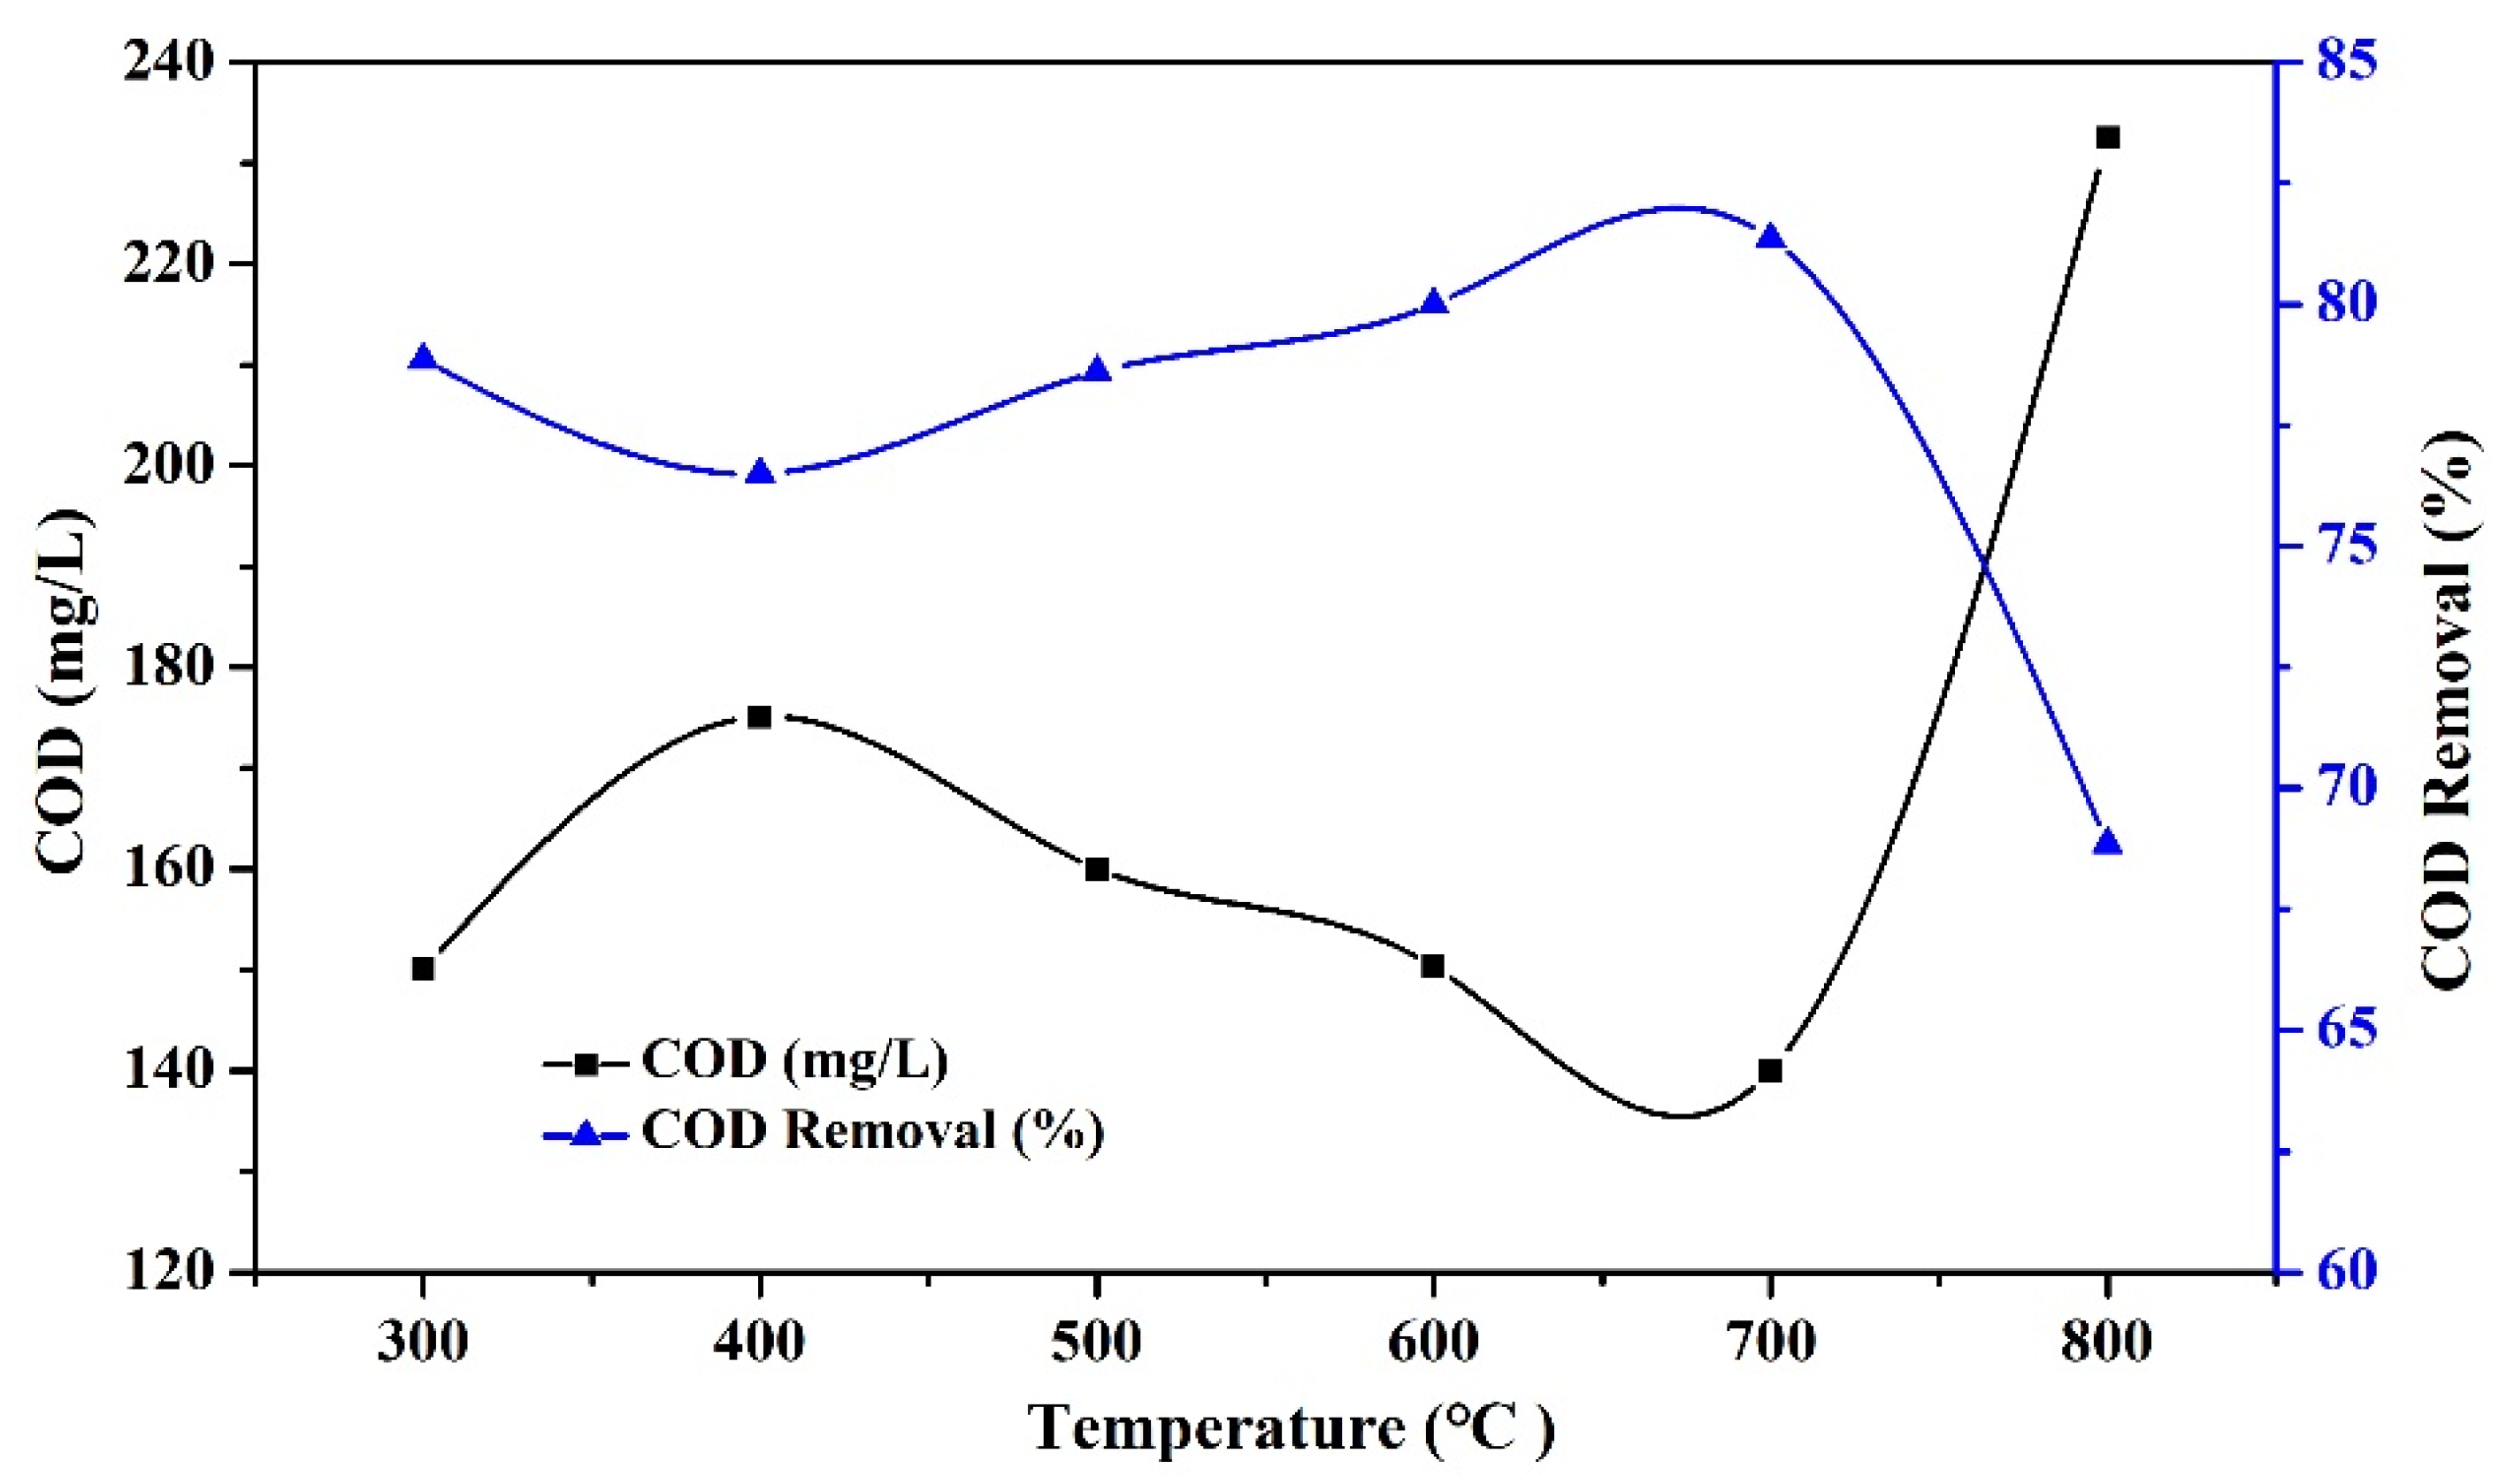
Figure 4.
Effect of calcination time on nickel-based bimetallic catalyst.

Figure 5.
SEM pattern of PAC and nickel-based bimetallic catalyst: (a,b) nickel-based bimetallic catalyst; (c,d) PAC.
Figure 5.
SEM pattern of PAC and nickel-based bimetallic catalyst: (a,b) nickel-based bimetallic catalyst; (c,d) PAC.

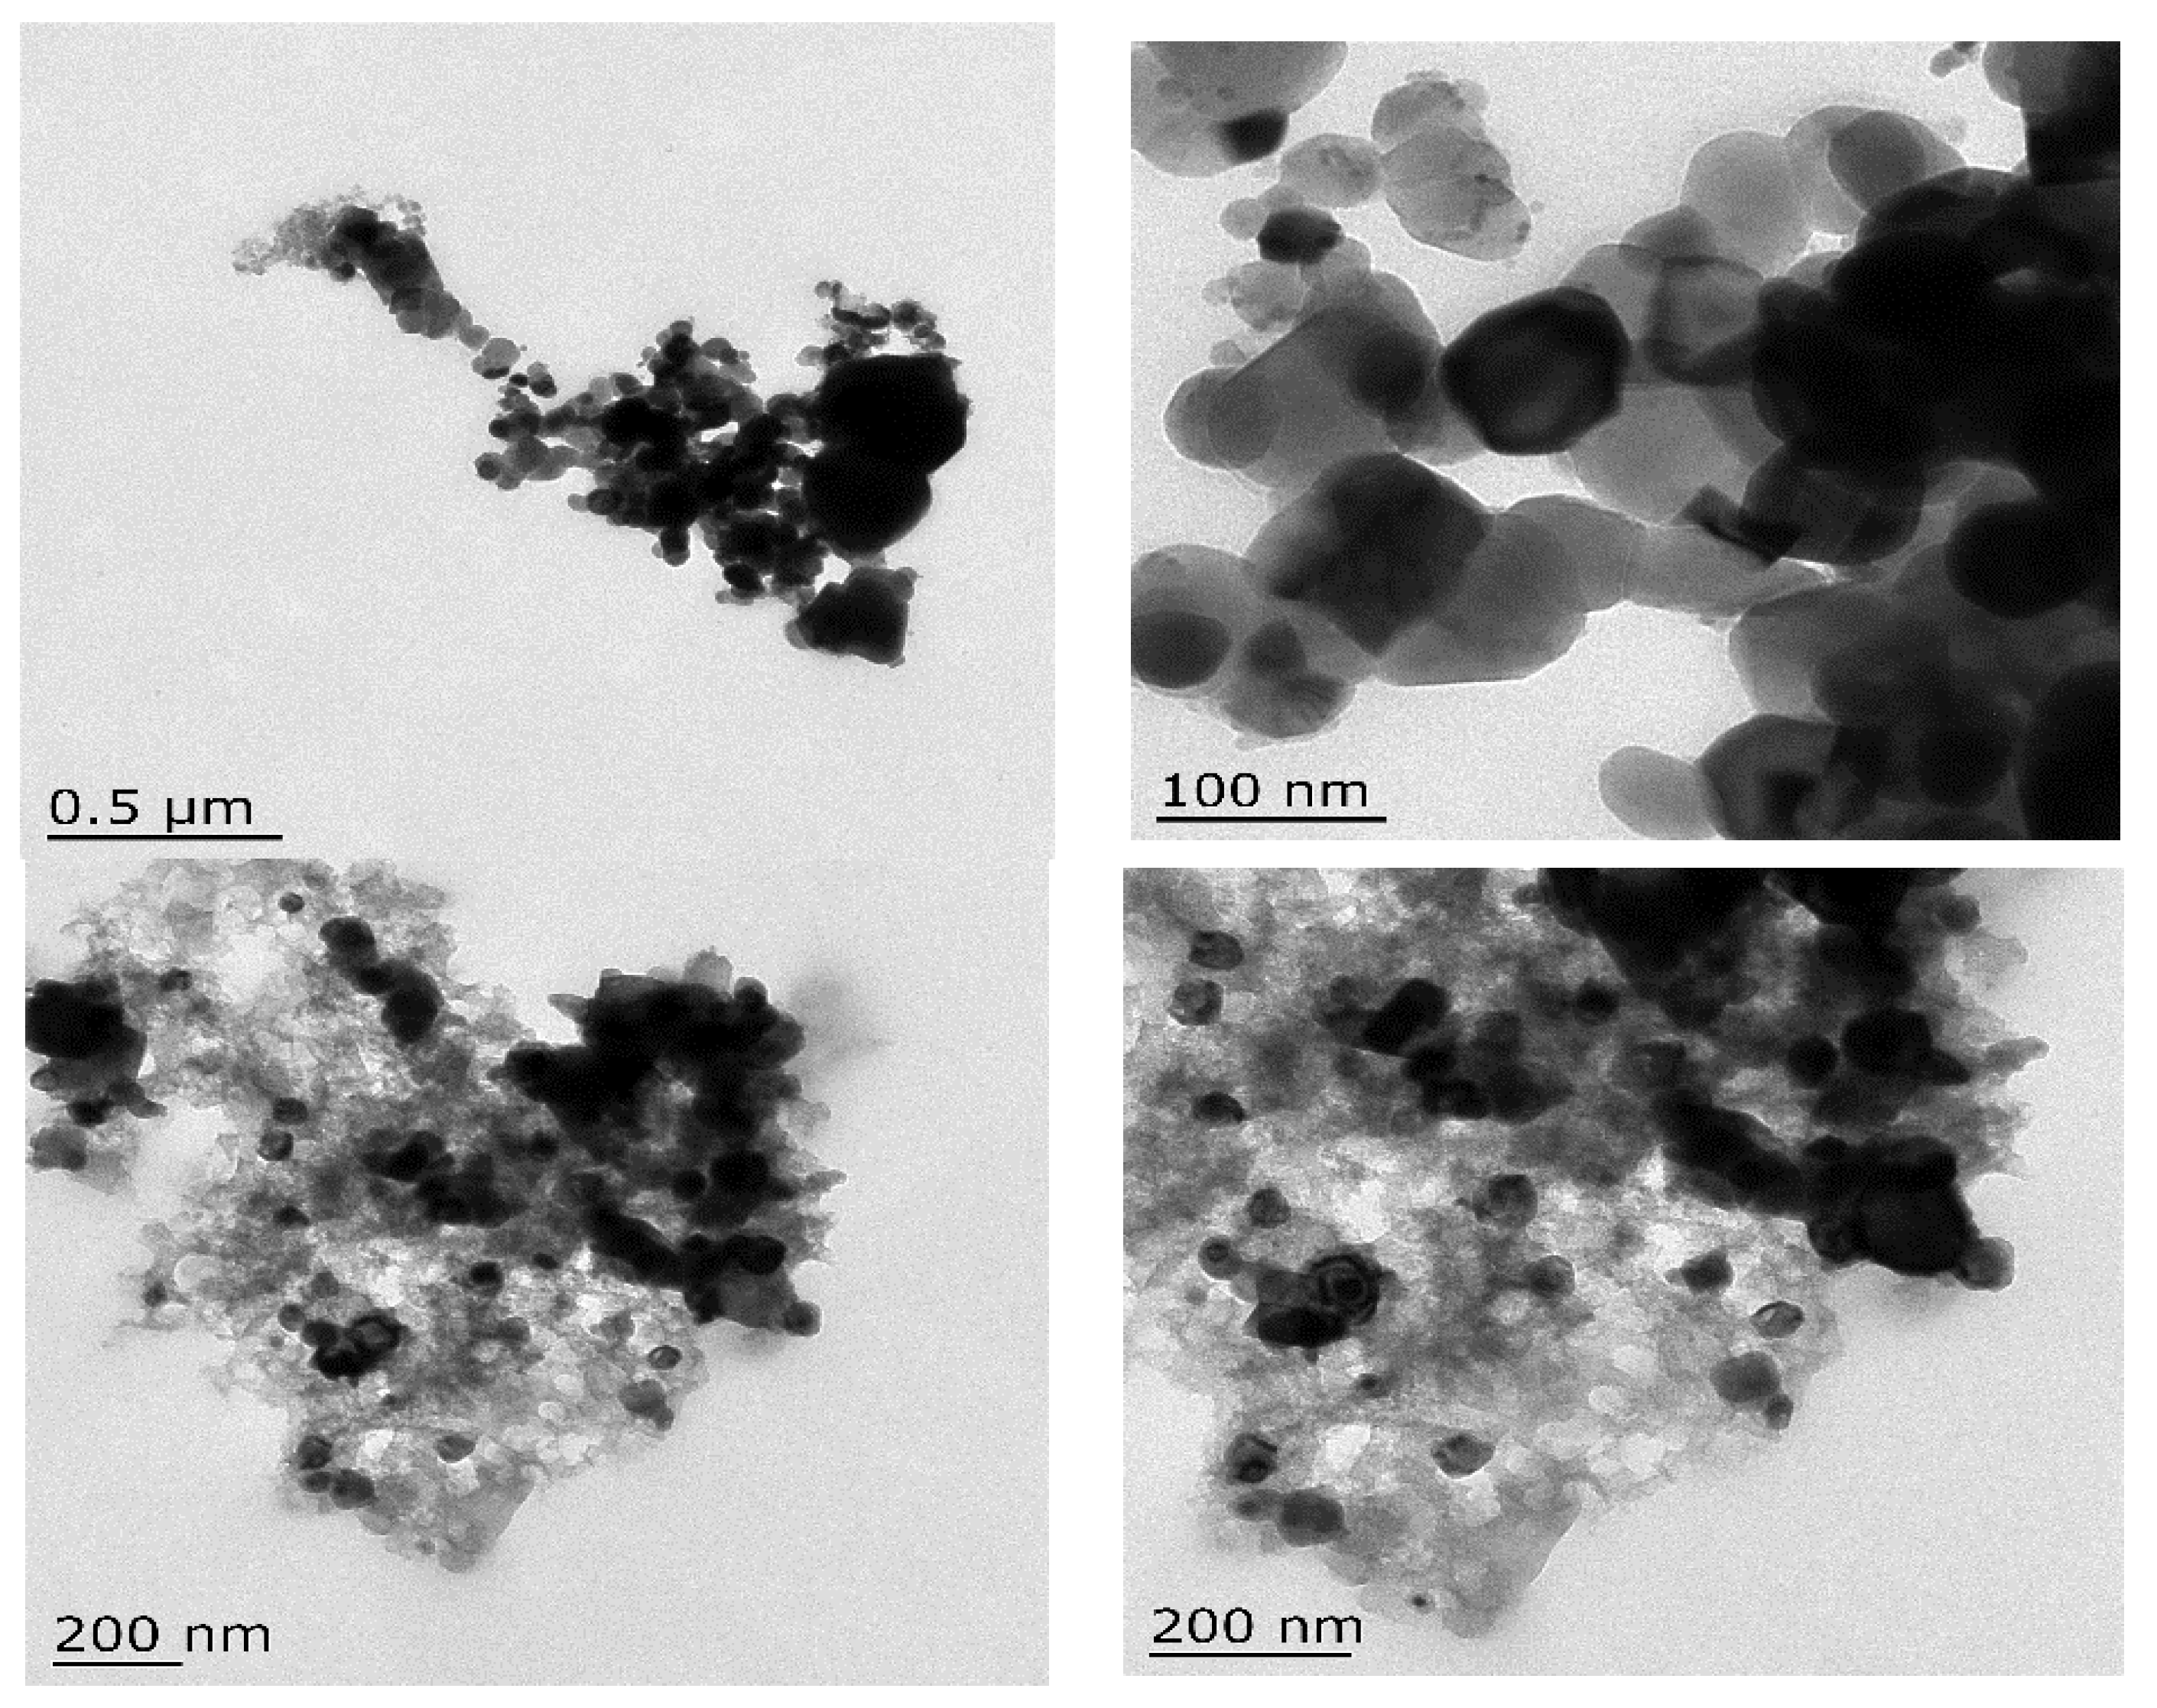
Figure 6.
TEM pattern of nickel-based bimetallic catalyst.
Figure 7.
EDS pattern of catalyst surface.

Figure 8.
XRD pattern of the catalyst.
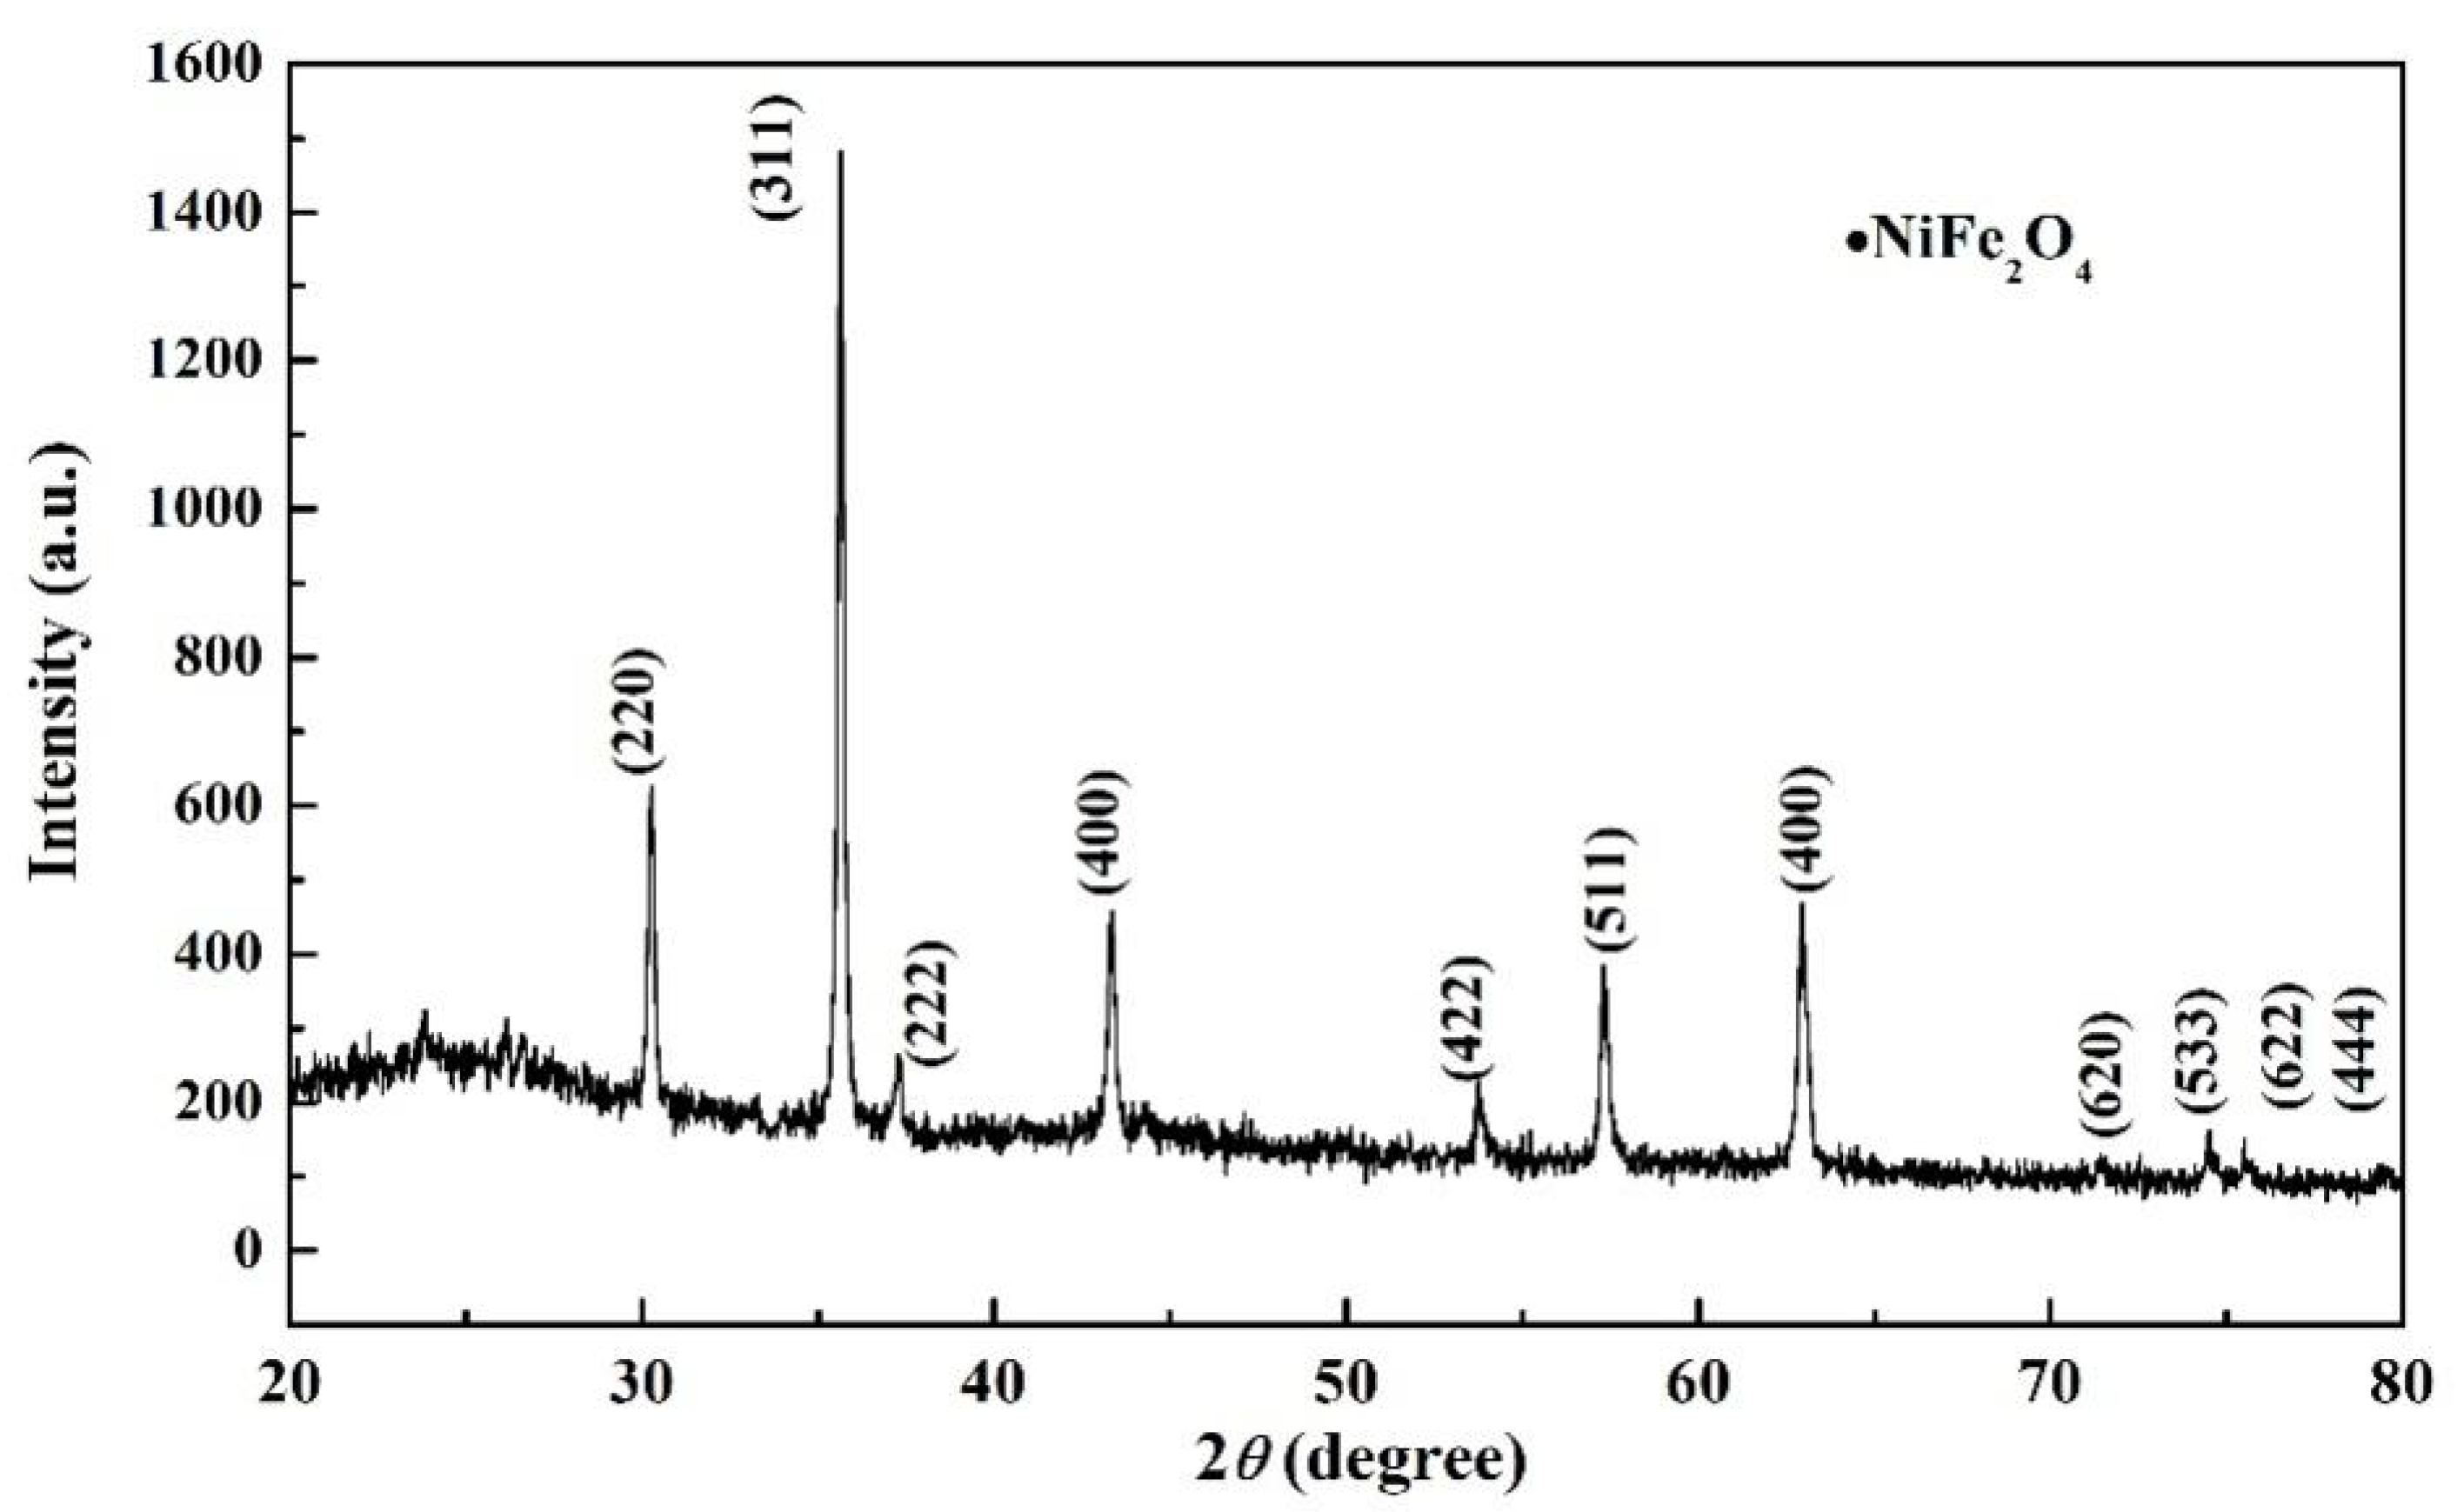
Figure 9.
Effect of initial pH on COD removal rate.
Figure 10.
Effect of catalyst dosage on COD removal rate.
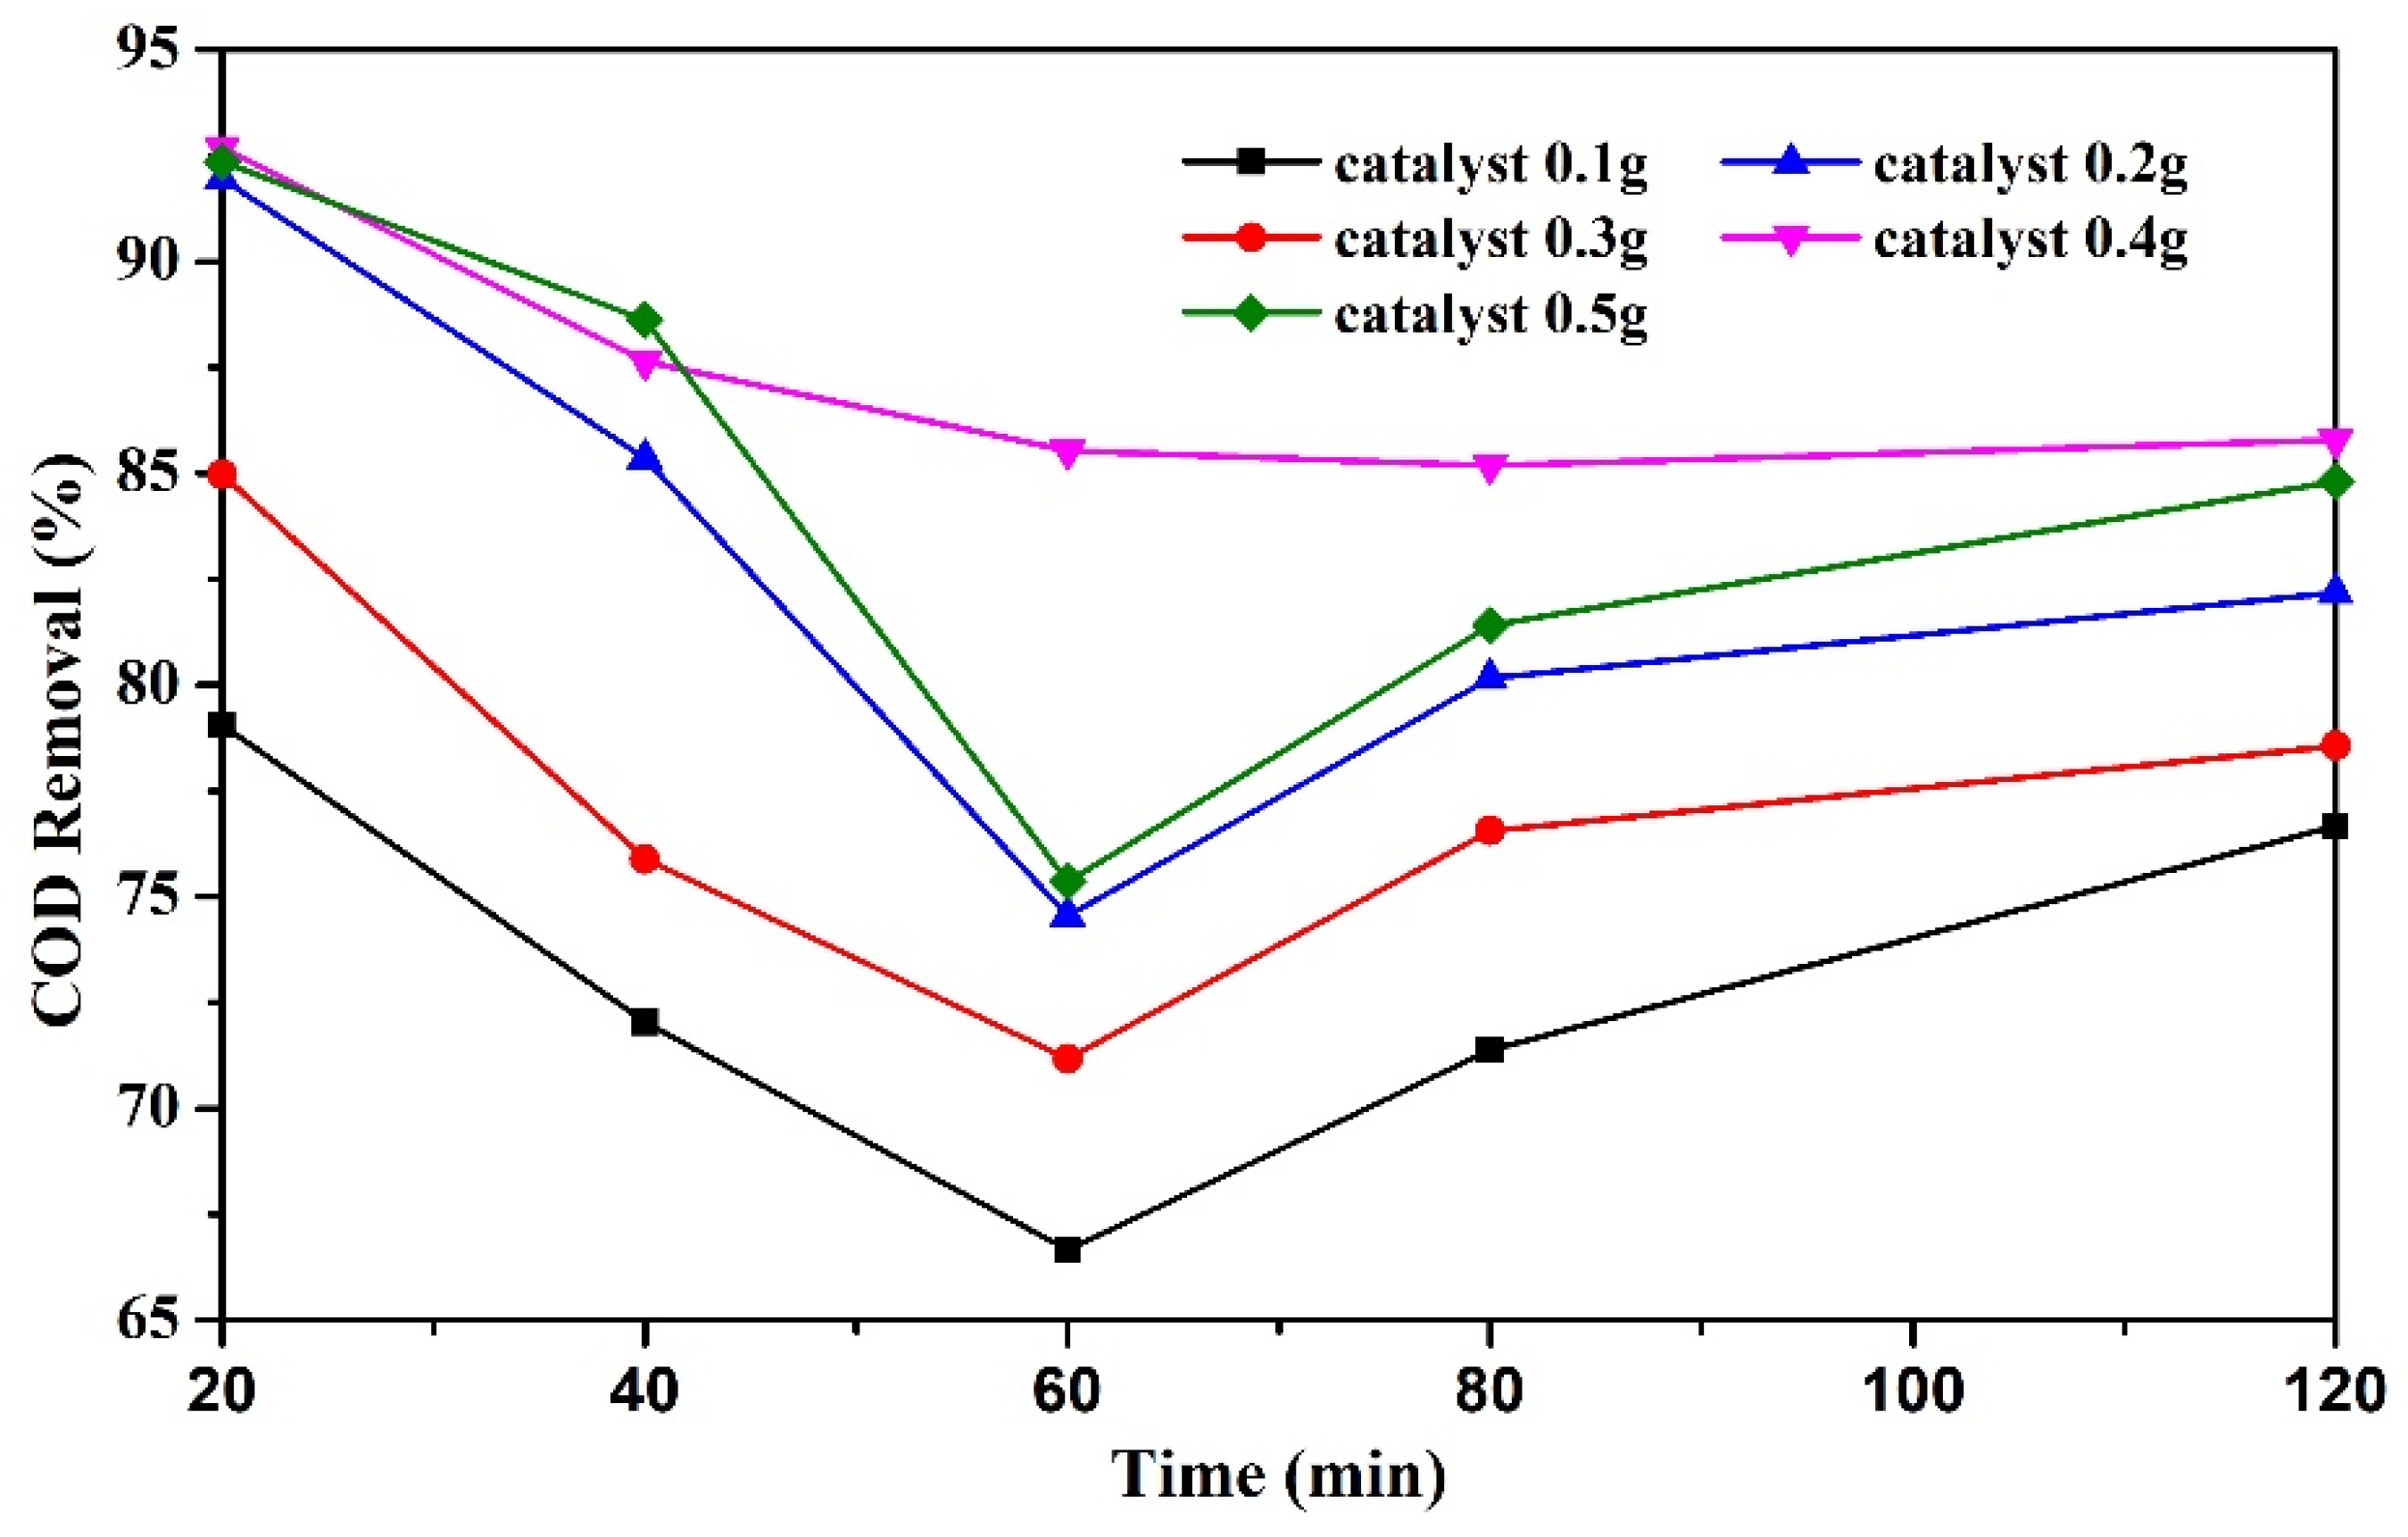
Figure 11.
Effect of sodium persulfate dosage on COD removal rate.
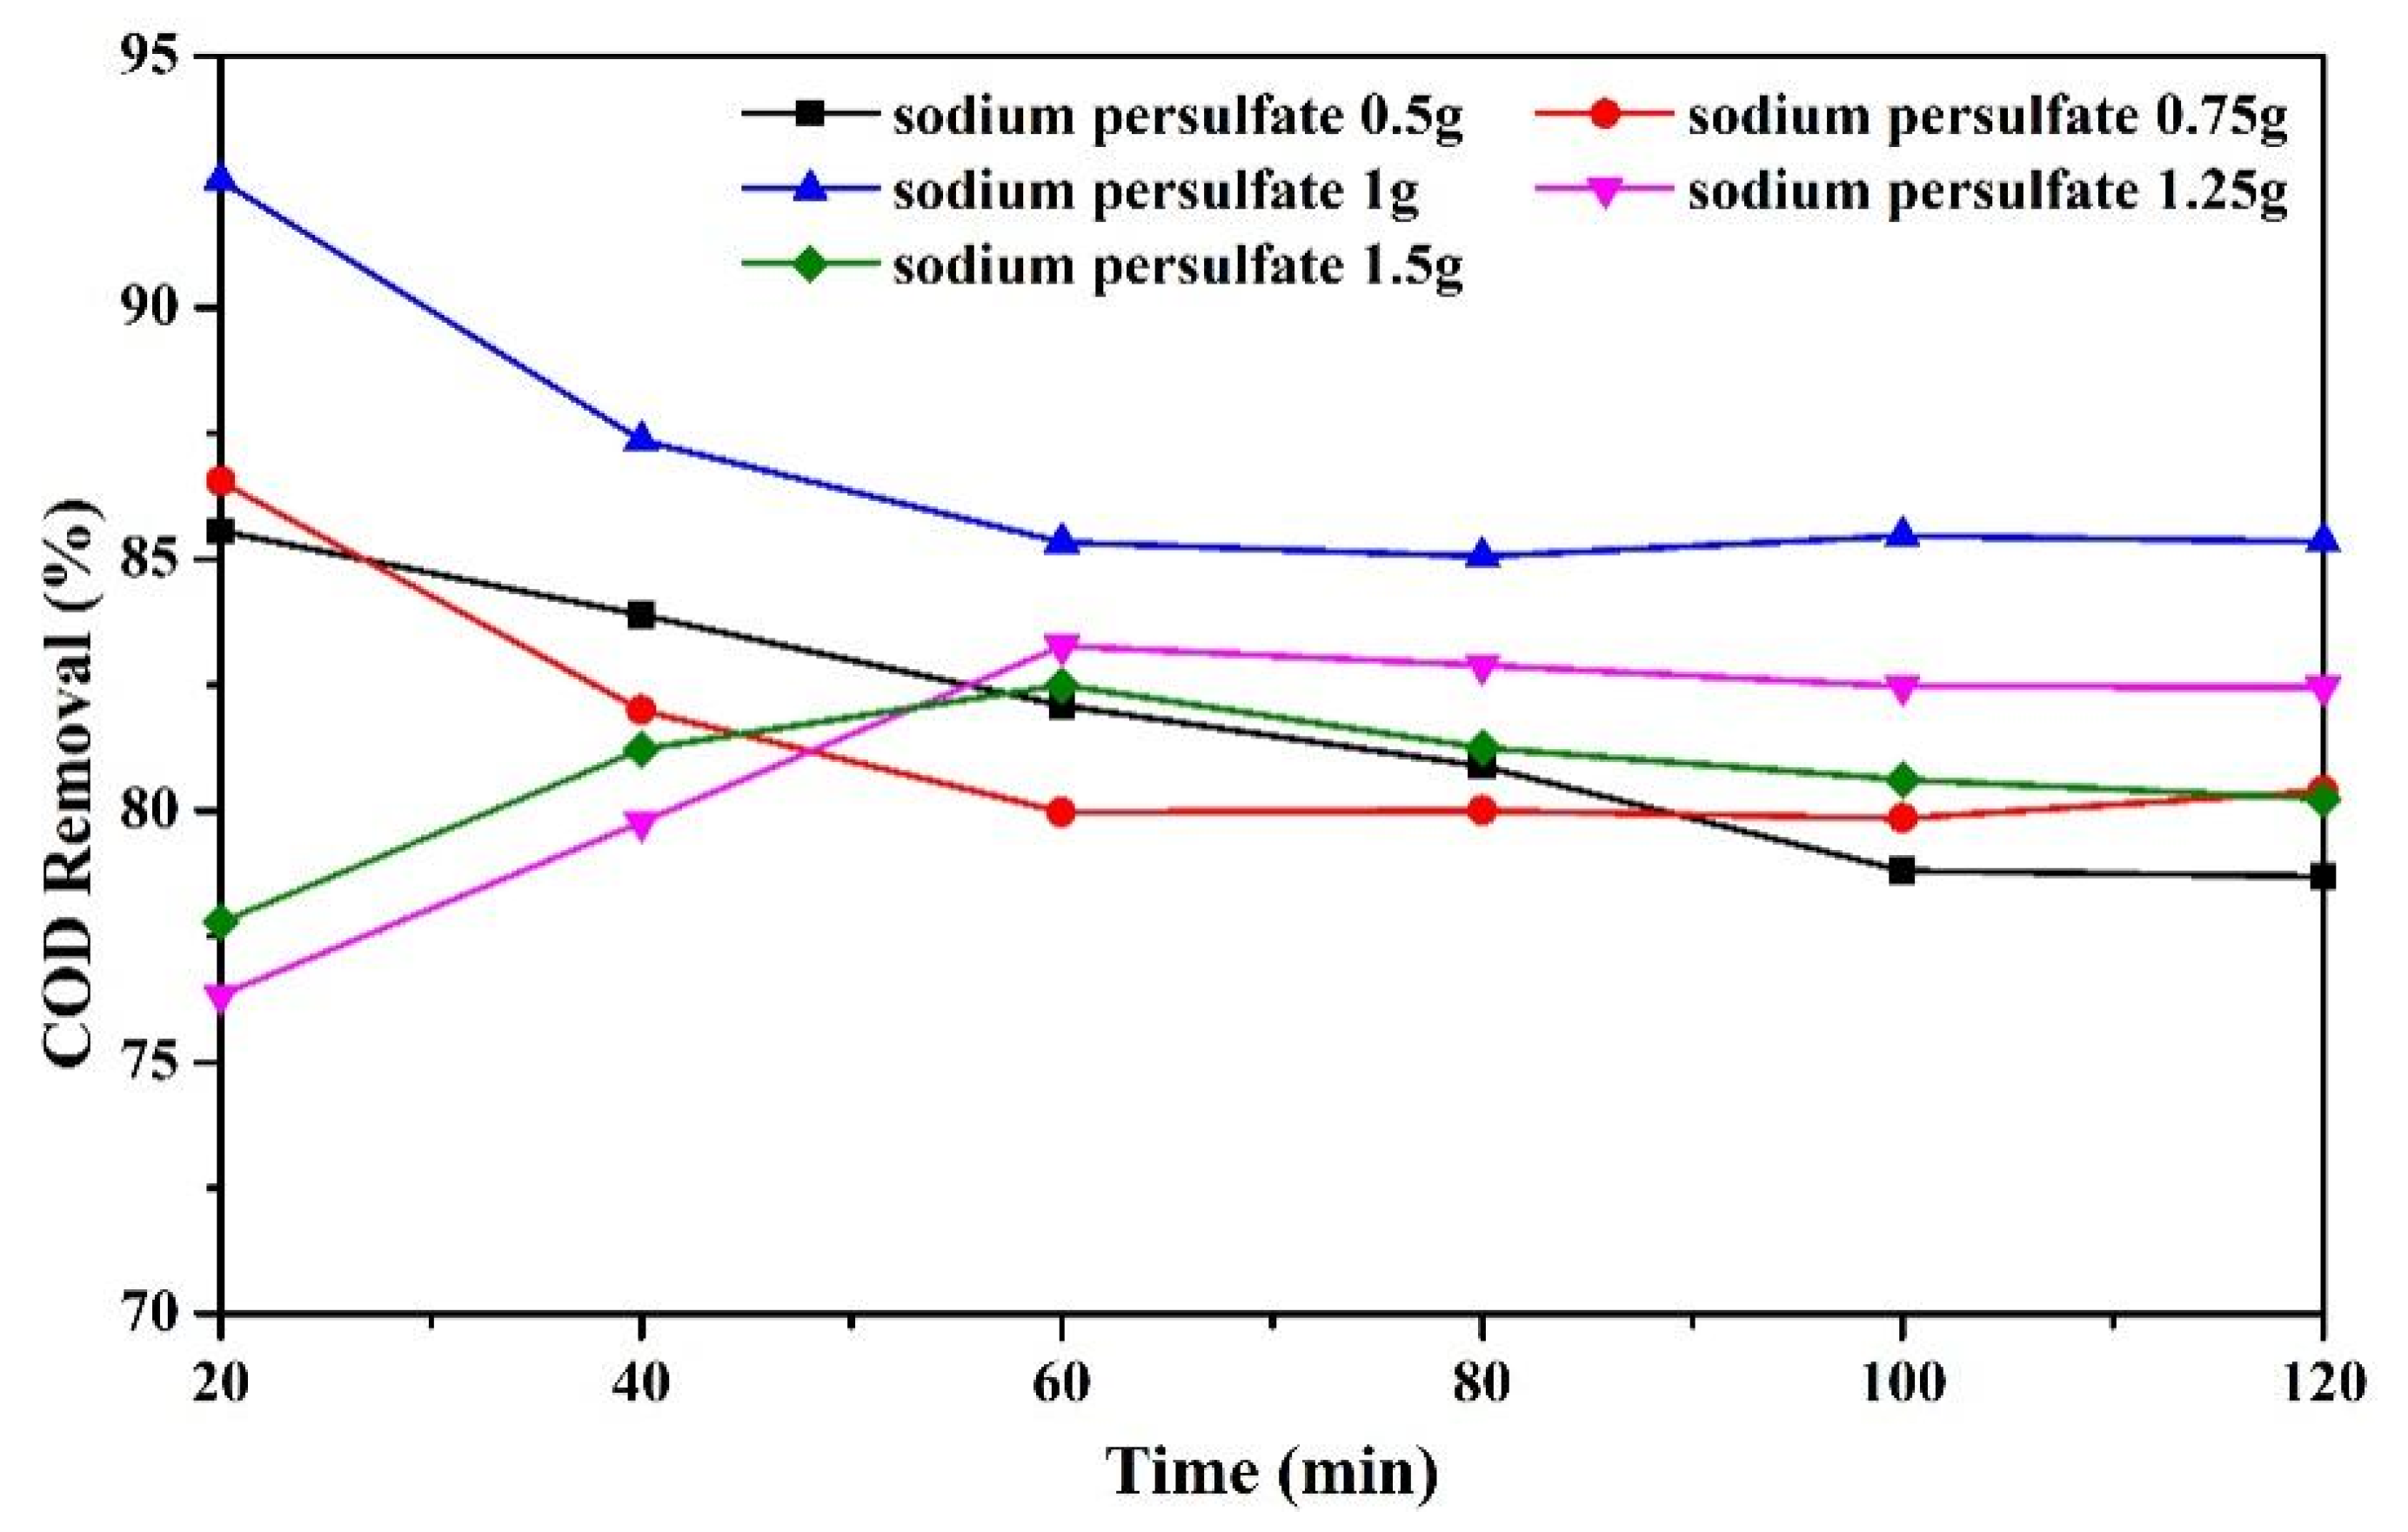
Figure 12.
Catalyst separation in magnetic field: (a) catalyst dispersed in solution; (b) catalyst separated in magnetic field.
Figure 12.
Catalyst separation in magnetic field: (a) catalyst dispersed in solution; (b) catalyst separated in magnetic field.
Figure 13.
Effect of catalyst reuse on COD removal rate.

Table 1.
Catalyst surface element weight ratios and atomic ratios.
| Weight/% | ||||
| Element | C | O | Fe | Ni |
| Proportion | 72.84 | 16.76 | 8.37 | 2.03 |
| Atom/% | ||||
| Element | C | O | Fe | Ni |
| Proportion | 83.11 | 14.36 | 2.05 | 0.47 |
Disclaimer/Publisher’s Note: The statements, opinions and data contained in all publications are solely those of the individual author(s) and contributor(s) and not of MDPI and/or the editor(s). MDPI and/or the editor(s) disclaim responsibility for any injury to people or property resulting from any ideas, methods, instructions or products referred to in the content. |
© 2024 by the authors. Licensee MDPI, Basel, Switzerland. This article is an open access article distributed under the terms and conditions of the Creative Commons Attribution (CC BY) license (https://creativecommons.org/licenses/by/4.0/).
Share and Cite
MDPI and ACS Style
Zhang, B.; Li, J.; Xu, Z.; Xu, X.; Wu, C. Preparation of Nickel-Based Bimetallic Catalyst and Its Activation of Persulfate for Degradation of Methyl Orange. Processes 2024, 12, 322. https://doi.org/10.3390/pr12020322
AMA Style
Zhang B, Li J, Xu Z, Xu X, Wu C. Preparation of Nickel-Based Bimetallic Catalyst and Its Activation of Persulfate for Degradation of Methyl Orange. Processes. 2024; 12(2):322. https://doi.org/10.3390/pr12020322
Chicago/Turabian StyleZhang, Bo, Jiale Li, Zhizhi Xu, Xiaohong Xu, and Chundu Wu. 2024. "Preparation of Nickel-Based Bimetallic Catalyst and Its Activation of Persulfate for Degradation of Methyl Orange" Processes 12, no. 2: 322. https://doi.org/10.3390/pr12020322
Note that from the first issue of 2016, this journal uses article numbers instead of page numbers. See further details here.