
Experimental and Theoretical Analysis of the Thermostatic Drying Process in Wetted Porous Sand Beds with Different Pore Sizes
Institute of Science and Technology for Carbon Neutrality, Southeast University, Nanjing 210096, China
*
Author to whom correspondence should be addressed.
Processes 2024, 12(2), 337; https://doi.org/10.3390/pr12020337
Submission received: 9 January 2024
/
Revised: 27 January 2024
/
Accepted: 1 February 2024
/
Published: 4 February 2024
(This article belongs to the Section Energy Systems)
Abstract
:The drying kinetics of porous media are crucial for controlling the drying process, which is a vital component in many processes. A mathematical model of the drying process in a granular bed was developed using Whitaker’s model, and its accuracy was verified through experimental results. The results indicated that the three stages of porous media drying are closely linked to the heat flow to the media and the latent heat of evaporation required by the liquid water inside it. Moreover, as the influence of gravity weakens and the capillary force strengthens, specifically due to the gradual decrease in the pore size of the bed, significant differences in the drying kinetics of the bed are observed, particularly in the third stage of drying, which is most affected. The onset of saturation in the third stage of bed drying varies with the pore size of the particles, with smaller pore sizes exhibiting an earlier onset. Additionally, the temperature change in this stage demonstrates the occurrence of secondary warming as the pore size decreases.
1. Introduction
The drying process is used in various production processes across multiple industries, involving materials such as concrete [1], hydrogels [2,3], foodstuffs [4,5], and wood [6], etc. The quality of the final product is greatly influenced by this process. During drying, the moisture within the drying medium undergoes a gas–liquid phase change, resulting in a complex multiphase heat and mass transfer phenomenon. The evolution of this process is mainly determined by the porous structure of the medium and the drying environment [7]. The geometry of the porous media, specifically the pore size and pore size distribution, directly affects the capillary flow of the liquid phase and the vapor diffusion behavior of the gas phase within the medium. The drying kinetics of the porous media, such as temperature, drying rate, and moisture content, vary with time depending on the size of the pores. Understanding the drying characteristics of porous media accurately and utilizing optimal drying conditions are crucial for achieving high-quality production [8,9]. Failure to do so can lead to issues such as a low drying efficiency for food, the cracking of concrete and wood, the transition shrinkage of hydrogels, and the loss of soil water affecting crop growth. Therefore, conducting experimental and theoretical studies to analyze the drying characteristics of porous media within different pore size ranges is of great significance for various engineering applications.
Currently, experimental studies on the heat and mass transfer behavior within porous media for drying processes can be categorized into two approaches. The first approach involves using advanced microscale processing techniques to generate micro-models for studying the pore-scale transport process [10]. However, this approach usually requires simplifying the porous structure, which may not accurately represent real porous media; the second approach involves using particle-filled beds to simulate real porous media [11]. Different particle size ranges are used to regulate the media pore size and maintain medium porosity stability [12]. This approach is used to study various aspects of the drying process, such as the medium temperature [13], porous medium thickness [14], drying stage evolution [15], drying characteristic length LC [16], the average depth of the end of the constant velocity period Lcap [17], and validating Whitaker’s model [18]. P. Coussot et al. [11] investigated the drying rate variation with pore size (particle size 4.5–200 μm) in an ethanol-soaked granular bed at 23 °C. The results showed that the descending drying period was caused by evaporation and capillary flow within the medium, with the intensity of the capillary flow depending mainly on the granular particle size. However, they did not consider the influence of gravity on the drying process. Ratthasak Prommas et al. [19] conducted drying experiments using particle-filled beds with particle diameters of 150 μm and 400 μm, respectively. The study showed that the drying rate of the medium was strongly correlated with the moisture content at the convective drying interface. Higher moisture content at the convective drying interface resulted in faster drying rates. Smaller particle sizes were found to be more effective in utilizing capillary forces in the drying process, resulting in faster drying rates compared to larger particles. Furthermore, smaller particle sizes promoted more uniform saturation distribution inside the filled bed and maintained a longer wetting time at the media convection drying interface. However, none of the above experimental studies discussed the effect of temperature on the kinetic properties of packed bed drying.
The study of heat and mass transfer processes in porous media includes two main approaches: the pore network model [20,21], considering the microstructure, and Whitaker’s model [22], establishing control equations from a macroscopic perspective through homogenization. The pore network model simplifies the tiny pore space inside the porous medium as “holes”, connected by tiny “throats” [23]. However, it has limitations in terms of simulation size and can only simulate a specific region within the porous medium. On the other hand, Whitaker’s model ignores the microstructural differences within the medium and assumes homogenized parameters for each region of the medium, such as porosity, saturation, and absolute osmotic dilution. According to the existing literature [24], such a simplified treatment is able to effectively simulate the overall heat and mass transfer process within the medium. Tang et al. [18] proposed a water film coverage model, which is able to better fit the phenomenon of slow internal warming during the constant velocity period. However, the model’s reliability was not verified for capillary action when only larger particles were used in the experiments. Lu et al. [25] analyzed how the microscopic pore structure affects the macroscopic parameters within Whitaker’s model using a pore network model. Their analysis showed that the internal pore structure affects the moisture transfer capacity at the surface and in the two-phase region of the medium, which is mainly related to the average size of the throat channel in the pore network model and is independent of the standard deviation of the throat channel. Hong Thai Vu et al. [26] established the connection between the structural parameters such as pore size and its distribution and the transport parameters required by Whitaker’s model, simulating the drying process of porous media with three different pore size distributions (100 ± 5 nm, 1000 ± 100 nm, 100 ± 10 nm, and 200 ± 20 nm) at 80 °C. The results showed that the differences in pore size and distribution had a significant effect on the total drying time, and, in general, the larger the pore size of the porous media, the shorter the total drying time. However, the above study focuses on the influence of structural changes caused by deviation in pore size on the drying kinetic properties and does not consider the influence of mean pore size on the drying kinetic properties at different scales. Therefore, using Whitaker’s model to establish a porous media drying model and to study the drying problem of porous media with different pore sizes can help to reveal the differences in drying characteristics caused by structural changes in porous media.
The above experimental and theoretical studies of heat and mass transfer processes in porous media were all influenced by the internal pore structure of the target parameters. However, a comparison of drying kinetics when the pore diameter changes is lacking, particularly when gravity-dominated seepage is gradually replaced by capillary force. Therefore, conducting experimental and theoretical analyses to study the thermostatic drying characteristics under pore diameter differences can enhance our understanding of the drying process in porous media.
This paper describes the experimental method and corresponding data processing in Section 2.1. Then, it introduces the mathematical model of the filled bed drying process established in this paper in Section 2.2 The accuracy of the model is verified in Section 3, followed by a discussion of the effects of pore size and temperature on the drying characteristics of the filled bed. Finally, Section 4 presents the conclusion. A proposed drying boundary condition is presented that agrees well with the experimental results of drying kinetics in porous media with varying pore size distributions. The results of this paper help to understand the process of soil evaporation and provide some help in soil moistening.
2. Materials and Methods
2.1. Experiment
2.1.1. Experimental Methods
Quartz-sand-filled beds are the traditional means for studying the drying characteristics of porous media. Pore size can be selected by changing the particle size, which affects the seepage inside the medium. Meanwhile, the capillary inside the medium will increase with a reduction in pore size. Thus, this paper utilizes three quartz sand samples of varying particle sizes: coarse-grained (430–700 μm), medium-grained (48–75 μm), and fine-grained (4–6 μm). The samples are 20 mm thick and have a diameter of 60 mm. The filled beds are 20 mm thick and have a diameter of 60 mm, and the container material for the quartz-sand-filled bed is pearl foam, which is dried in a blast drying oven (DHG-907385-III, XINMIAO|CIMO, Shanghai, China, operating temperature range ≤250 °C, temperature control accuracy ±0.1 °C) (see Figure 1a). The experiment is conducted at three different drying temperatures: 35 °C, 45 °C, and 55 °C.
Temperature measurement samples are set up during the drying process, and the temperature change data inside them are measured by thermocouples (T-type thermocouple, Omega Inc., Norwalk, CT, USA, measurement range −200–350 °C, accuracy 0.5 °C). There are a total of 9 temperature measurement points in the filled bed, as shown in Figure 1b. In addition to the temperature measurement samples, four groups of weighing samples are set up in the experimental process. The mass of the weighing samples before the start of the experiment is recorded as m0. Then, distilled water is added to the temperature measurement samples and the weighing samples until the surface of the filled bed is completely submerged, and the mass of the weighing samples is recorded as mwater. The weighing samples are sent to the blower drying oven after the blower drying oven has reached the specified temperature. During the experiment, the weighing samples are removed from the blower drying oven every 1 h (rapid removal and measurement to minimize the effect of sudden temperature change on the drying process), and the mass of the samples is measured by an electronic balance (YP20002B, Lichen Inc., Taiwan, China, measurement range 0.01–2000 g, accuracy 10 mg). The end of the drying process can be identified by various signs, such as the temperature of the dried sample reaching ambient temperature or the sample mass no longer changing, indicating zero saturation or reaching residual saturation. For subsequent discussion, this paper considers the temperature of the filled bed rising to the ambient temperature as the indicator of the end of the drying process.
2.1.2. Experimental Data
To conveniently illustrate the extent to which the quartz-sand-filled bed is affected by pore space and temperature, the experimental results are processed as follows.
The temperature change data within the filled bed obtained from the experimental measurements are averaged, and the results are considered to be the overall average drying temperature of the filled bed, Tp. Additionally, to determine the specific start and termination times of each stage of drying, the rate of temperature change in the filled bed T* is calculated at intervals ∆td, as shown in Equation (1).
The symbol tn (n = 1, 2, 3, …) is used sequentially in the formula to denote the filled bed temperature Tp per minute.
During the mass measurement process, a total of four groups of samples are dried simultaneously in each group of conditions. This paper compares the changes in the mass of the filled bed under different conditions using the saturation Sbed and the average drying rate Jrate, defined in Equations (2) and (3), due to the small difference between the quartz sand and its moisture content in each group of conditions.
where m is the mass of the filled bed weighed at different moments, m0 is the mass of the filled bed after complete drying, and mwater is the mass of the filled bed in the initial wetting state.
where ∆tm is the mass measurement interval i.e., 1 h, and A is the horizontal cross-sectional area of the filled bed.
2.2. Mathematical Model
2.2.1. Physical Model
Figure 2 illustrates a simplified two-dimensional model of filled bed drying. The material of the filled-bed container is pearl foam, and it is assumed that convective mass transfer processes in the bed during drying occur only on the upper surface, which is surrounded by an adiabatic boundary at the bottom. Liquid flow, evaporation, and gas diffusion processes exist inside the bed. In addition, pearl foam provides excellent thermal insulation. Therefore, the perimeter of the bed, specifically the bottom, is considered to be an adiabatic boundary.
2.2.2. Mass Conservation Equation
There is gas phase, liquid phase, and solid phase at the same time inside the porous media convective drying process. The amount of solid phase is always constant in the drying process, while the liquid phase and gas phase are always in a state of change due to the presence of the evaporation of porous media. For the liquid phase, the following equation is obtained from the conservation of the amount of liquid substance [27,28].
where is the molar concentration of liquid water within the microelement volume of the unit characterization body (mol/m3), ul is the actual seepage velocity vector of liquid water within the porous medium (m/s), is the evaporation rate of liquid water within the pores in the microelement volume of the unit characterization unit (mol/(m3·s)), and the following formula is used to calculate the evaporation rate [27,28]:
where b is the material-related constant (s/m2), ϕ is the porosity of the porous medium, R is the gas constant (J·mol−1·K−1), T is the gas temperature (K), Mw is the molar mass of the water (kg/mol), and s and sir denote the volume fraction of the liquid phase within the pores and the volume fraction of the residual liquid phase, respectively. ρv,eq = cv,eqMw, and ρv = cvMw denote the saturated and actual water vapor densities at the corresponding temperatures, respectively. bϕ(s − sir)RT/Mw is the mass transfer coefficient, the value of which is related to the equilibrium time τeq = lp/Dv, where lp is the porous medium characteristic scale and Dv is the diffusion coefficient of the liquid-phase vapors; thus, the value of b can be estimated from the equilibrium time [27]. Here, assuming that the water vapor is an ideal gas, the molar concentration of equilibrium water vapor is:
Due to the weak adsorption capacity of the solid skeleton (quartz sand) for water vapor, it can be assumed that pv,eq = pv,sat, which is equal to the saturated water vapor pressure at the corresponding temperature. Then:
where the constants A, B, and C are 4.6543, 1435.264, and 64.848, respectively [29].
For the gas inside the porous medium, it is regarded as a binary mixture of water vapor and air. The conservation of matter is upheld in the porous media drying process with regard to the two components of gas involved: water vapor and air. The equation for the conservation of the amount of matter is as follows:
where and denote the characterized molar concentrations of water vapor and air (mol/m3), respectively, and uv and ua are the actual seepage velocity vectors (m/s) of water vapor and air inside the porous medium.
Combining Equations (8) and (9), the mass conservation equation for wet air can be obtained as:
where the amount concentration of the wet air is characterized as , and ug is the actual seepage velocity vector of the wet air inside the porous medium (m/s).
For a porous medium with porosity ϕ, the internal fluid should satisfy volume conservation:
In the above equation, Mw and Ma denote the molar masses of water and air (kg/mol), respectively, while the three parameters ρl, ρv, and ρa are the true densities of liquid water, water vapor, and air (kg/m3), respectively.
2.2.3. Momentum Equation
The flow process of each component within the fluid phase inside the porous medium obeys Darcy’s law, so that the pressure of the gas phase, i.e., wet air, is pg, and therefore:
where ug is the actual seepage velocity vector of the gas phase (m/s) and K is the absolute permeability of the porous medium (m2). The absolute permeability is calculated according to the Hagen–Poiseuille flow equation for single-phase flow with a simplified formula derived from [30,31]:
where Rp is the average pore radius. Considering the change in gas-phase permeability caused by the liquid phase occupying the pore space, the relative permeability kg is used here to correct the gas-phase permeability. Since the air mass is much smaller than that of the liquid phase, the effect of gravity on the air percolation process is ignored here.
The gas in the pores of the water-containing porous medium is simplified as a binary mixture of water vapor and air, and when the gas inside the porous medium percolates and flows, the actual flow velocity of the water vapor uv is the sum of the gas-phase percolation velocity ug and the diffusion velocity of water vapor molecules. The diffusion rate of water vapor within the pores can be calculated by Fick’s first law of diffusion:
where Dg,v is the diffusion coefficient of water vapor molecules in air (m2/s), and the diffusion path of the gas molecules inside the porous medium deviates from a straight line due to the obstruction of the solid skeleton of the porous medium; thus, the actual diffusion coefficient must be corrected for the tortuosity of the porous medium. Based on the theoretical and quantitative derivations, diffusion coefficients of the following forms are used [32]:
where Dv is the diffusion coefficient of water vapor in air, calculated by the following equation [33]:
where Dr is the water vapor diffusion coefficient at the reference temperature and pressure, and pr and Tr are the reference pressure and temperature, respectively. In addition, the tortuosity ϖ in Equation (15) is [34,35]:
In summary, the percolation rate of water vapor is given by:
Wet air is a binary mixture of air and water vapor, and the molar diffusion velocity between the two components is equal and in opposite directions, so the percolation rate of air is:
According to the Young–Laplace equation Δp = γ(1/R1 + 1/R2), where the pressure difference between the inside and outside the liquid surface Δp is mainly determined by the gas–liquid surface tension coefficient γ and the radius of curvature of the liquid surface R1 and R2, the capillary pressure inside the pore varies with the saturation inside the pore [36]. When porous media are dry, liquid water saturation differences exist between the pores. When the pore size is small (<1 mm), there is a significant capillary pressure difference between the liquids in neighboring pores, and the transport of the liquid water phase inside the porous medium is dominated by seepage due to the capillary pressure gradient. After considering the capillary pressure difference at the gas–liquid interface, the liquid water phase pressure inside the porous medium is:
where the capillary pressure pc is calculated using Leverett’s formula and can be expressed as:
where the liquid water saturation s = , the liquid water surface tension is:
where surface tension σr = 0.1212 N/m, coefficient κ = 1.67 × 10⁻⁴ N/(m·K) [37]. The Leverett-type J-function, i.e., J(s), is calculated using the following equation [18,38]:
In the above equation, sir is the residual water saturation, i.e., the saturation of bound water adsorbed on the surface of the porous skeleton due to chemical adsorption, the value of which is measured experimentally. From Equation (20) and Darcy’s seepage law, the actual seepage velocity of liquid water is known as:
2.2.4. Energy Conservation Equation
The conservation of energy in porous media during the drying process requires simultaneous consideration of the solid skeleton, the convection between gas–liquid-phase fluids, and the heat transfer due to the evaporation process, as well as the heat transfer in the multiphase mixture composed of the three phases. Thus, the energy conservation equation for porous media can be obtained after considering the above effects as follows:
where Cp,l, Cp,v, Cp,a, and Cp,s are the specific heat capacities of the liquid phase, vapor phase, air phase, and solid phase (J/(kg·K)), hvap is the enthalpy of the evaporation of the liquid phase, and the effective thermal conductivity of the porous medium is calculated by using the mass average.
The enthalpy of the vaporization of the liquid phase hevp = hv − hl, where hl and hv are the enthalpies of the liquid phase and its vapor phase, respectively, at the same temperature (J/mol), and their values are linearly correlated as a function of temperature.
where i = v, l, αi is the reference enthalpy of the corresponding substance.
2.2.5. Initial and Boundary Conditions
At the initial moment, the whole device is placed under the environmental conditions of Te = 20 °C and 100% relative air humidity, and, after the overall temperature of the porous medium is stabilized, it is quickly put into the set drying environment. Thus, at the initial moment, the initial drying conditions of the porous media are:
where s0 = 1 is the initial liquid-phase saturation inside the pores and the ambient pressure pg,e = 101,325 Pa.
As shown in Figure 2, the computational domain is surrounded by adiabatic and humidity-insensitive air. Thus, there are:
For the convective boundary of the porous medium, where the pressure is the same as the atmospheric pressure, the evaporated water vapor inside the porous medium diffuses and convects outward through the boundary and eventually migrates to the environment, while the heat required for evaporation comes from the air at the interface with the porous medium convective heat transfer process; thus:
In the above equation, χ is the correction coefficient of the gas–liquid contact area in the boundary pores. This is because gas–liquid mass transfer in the drying process primarily occurs at the gas–liquid phase interface. The mass transfer area between the gas and liquid phases in the pores changes due to the decrease in moisture concentration at the boundary pores, and the following formula is used to calculate it [39]:
where the coefficients a1 and a2 are fitted from experimental data, respectively:
2.2.6. Mesh-Independent Verification
Mesh independence is performed to demonstrate that the model calculation results are not dependent on the specific way the geometrical model is divided into meshes. This ensures the reliability of the model calculation results. The result of mesh independence is shown in Figure 3. The difference between the sand bed temperature versus time curves gradually decreases as the number of meshes increases. Especially when the number of meshes is 4000, the calculation results no longer change with the number of meshes, thus indicating that the calculation results are not related to the mesh, and a mesh of 4000 is chosen to reduce the calculation volume.
3. Results and Discussion
3.1. Drying Mechanism
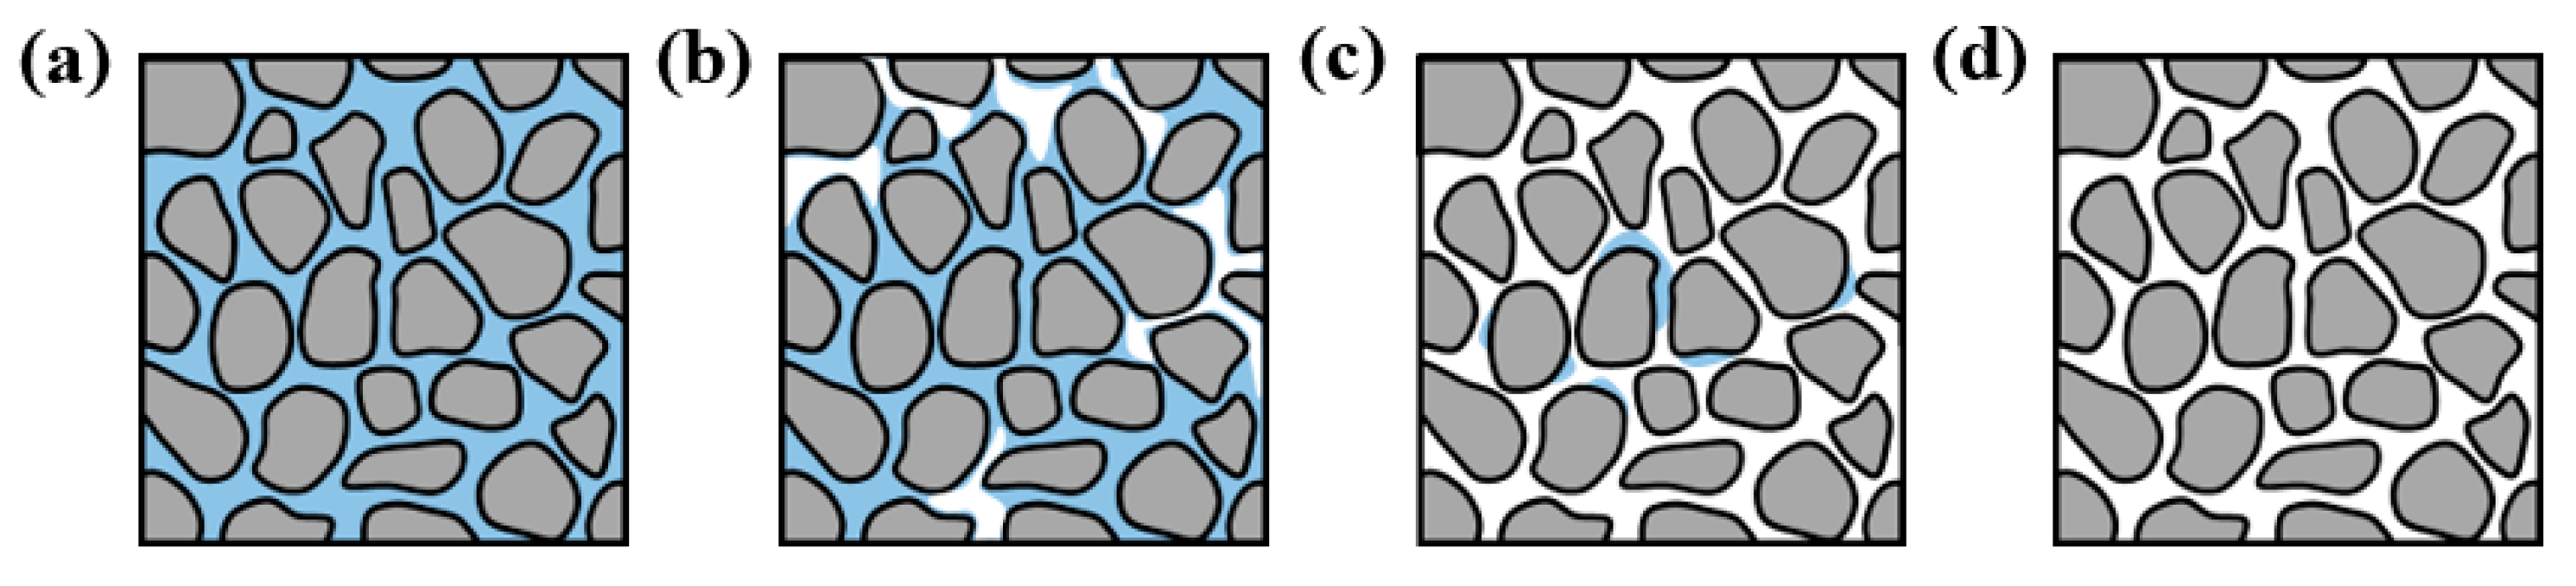
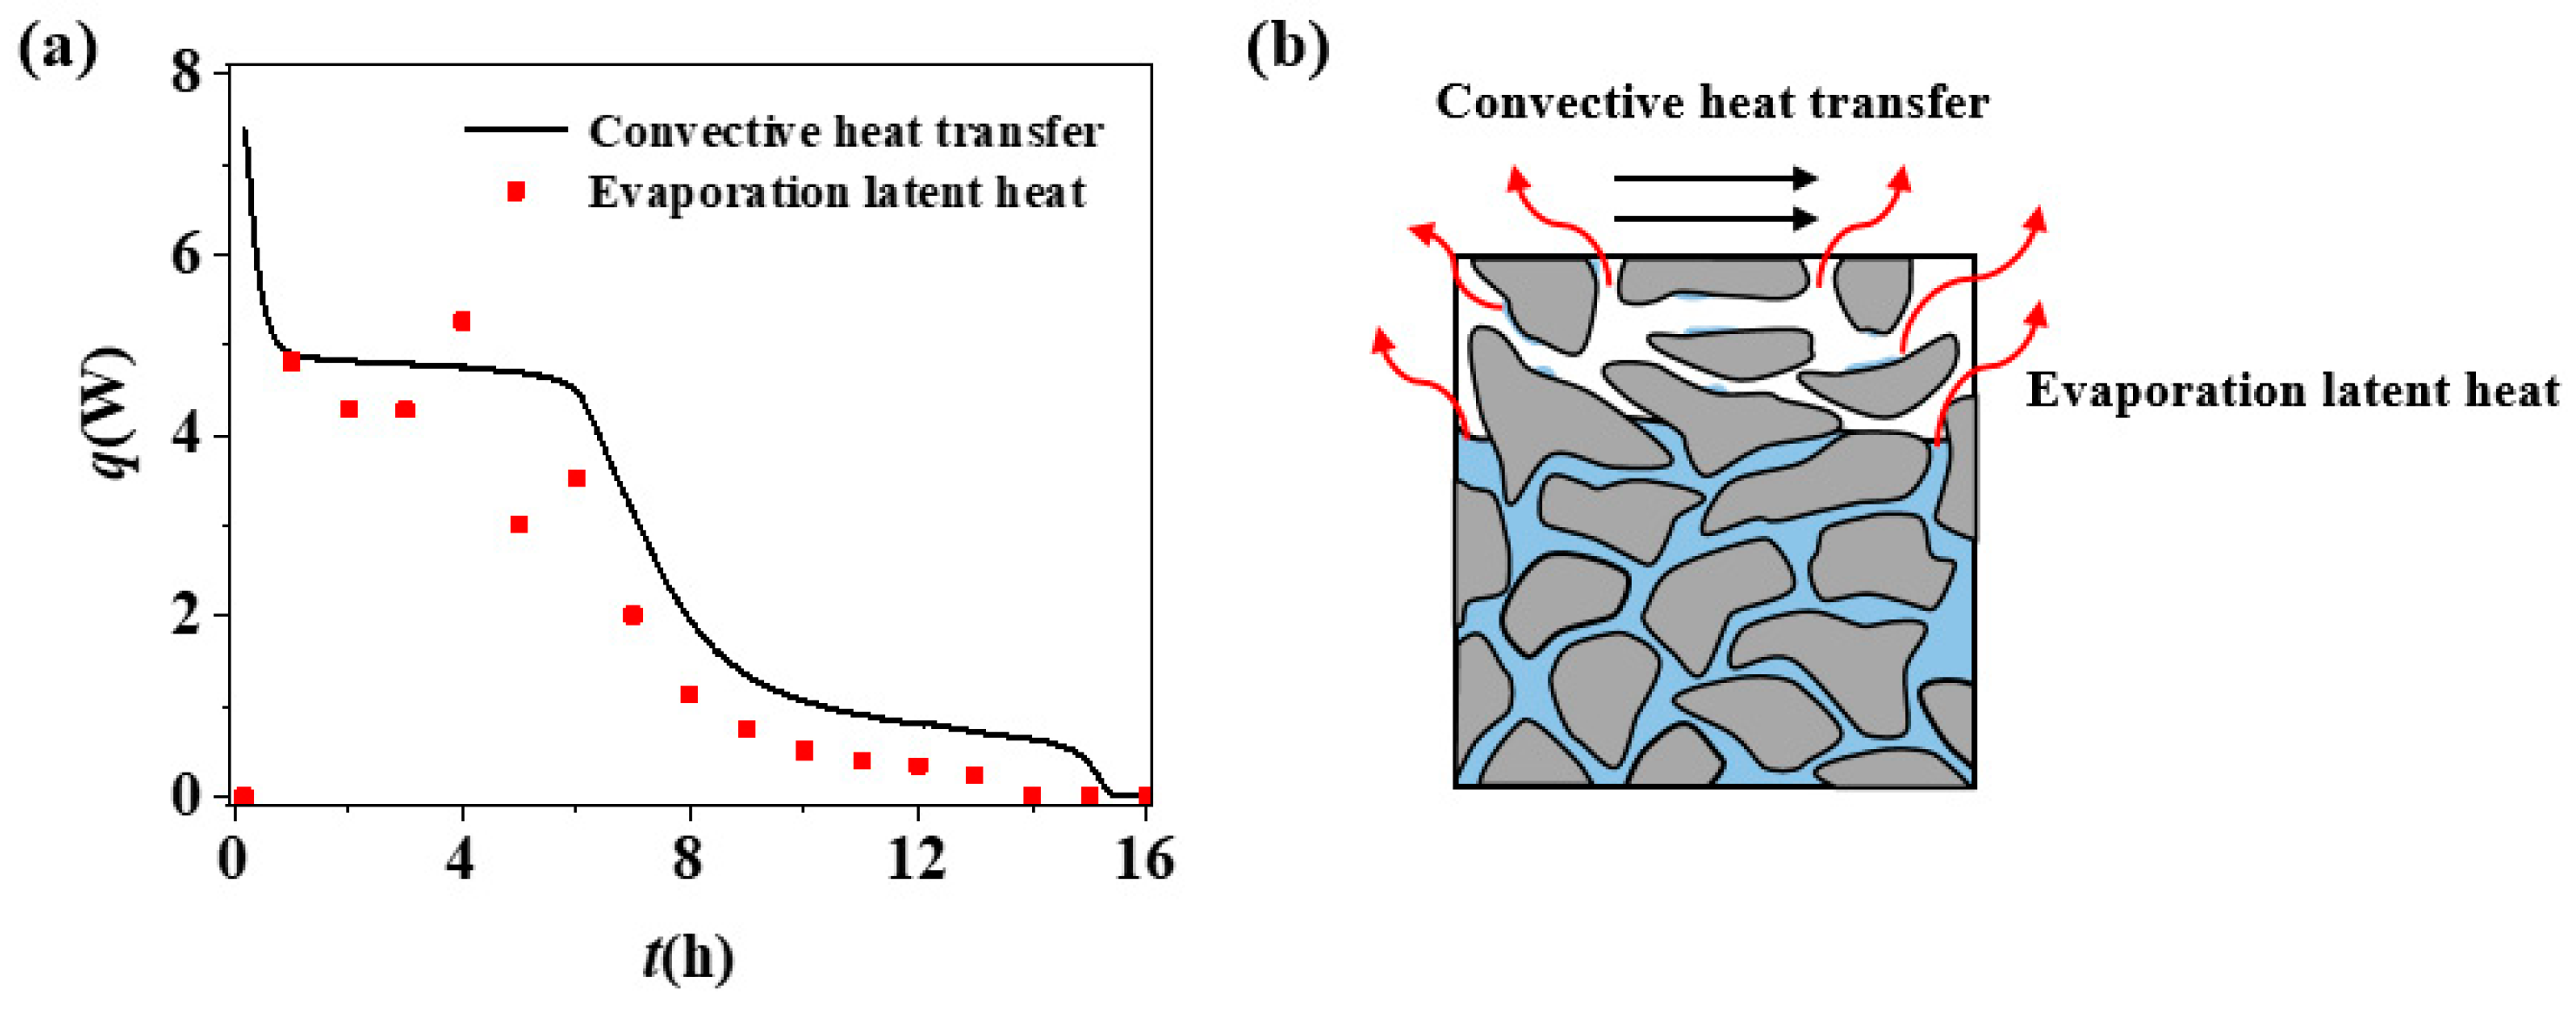
Figure 4 demonstrates the temperature versus mass change process during the drying process of an aqueous filled bed composed of medium-grained samples at 45 °C. According to the temperature change characteristics shown in Figure 4a, the drying process components can be divided into three stages: the primary warming period in Stage I, the constant temperature period in Stage II, and the secondary warming period in Stage III, (ti in the figure indicates a certain moment of the drying process). Stage I (t0 − t1) is affected by the ambient temperature. The temperature of the filled bed rises rapidly and reaches equilibrium in a short time into Stage II. The rapid increase in the filled bed temperature is due to, at this time, the state of water inside the porous media, as shown in Figure 5a. Water evaporation occurs only on the upper surface of the media and the water vapor pressure at the upper surface boundary is the saturation pressure of liquid water at the corresponding temperature. Therefore, in the initial period of drying, i.e., Stage I corresponding to the cycle, when the heat flow to the filled bed is greater than the latent heat of the evaporation of the liquid water in the filled bed (see Figure 4), the filled bed temperature rises until the two reach equilibrium, at which point Stage I ends.
In Stage II (t1 − t2), the temperature of the filled bed is approximately constant, and the drying rate fluctuates within a certain range. As the drying process continues, the moisture content of the filled bed decreases, and the drying enters Stage III, when it decreases to a specific moisture content SCLC, which is also known as the critical liquid content (CLC) [40]. Within Stage II, the saturation of the filled bed decreases from 1 to SCLC. The liquid water in the pores is in a continuous state under the action of capillary force, which is able to cover the quartz sand particles uniformly and form a uniform water film on their surface. The wet portion inside the porous medium is transported to the surface of the filled bed by capillary seepage through the water film. It is then transferred to the environment through evaporation on the upper surface due to the existence of the continuous water film. At this time, the evaporation of the filled bed mainly occurs at the vapor–liquid interface on the surface of the filled bed. Thus, at this stage, the water vapor pressure inside the filled bed is relatively uniform, as shown in Figure 6b. The saturation decreases steadily until the liquid water can only cover the surface of the quartz sand, and the drying process enters Stage III.
In the first half of Stage III (t2 − t3), the temperature inside the filled bed rises and the drying rate decreases rapidly. Stage III enters its second half (t3 − t4), and the temperature inside the filled bed climbs slowly, which is nearly constant but lower than the drying ambient temperature Te. At the same time, the drying rate is much lower than that of Stage II and decreases slowly until the end of the filled bed drying. However, comparing Figure 4a,c, it can be found that, after the evaporation of water in the filled bed is completed, the temperature in the filled bed is slightly lower than the dry ambient temperature at this time. In Stage III, due to the saturation being lower than SCLC, the liquid water can no longer be continuously distributed on the surface of the quartz sand particles, resulting in a reduction in evaporation within the pores. The conduction of heat is mainly used to enhance the sensible heat of the quartz particles (see Figure 5c), and the temperature of the filled bed Tp rises. On the other hand, the temperature of the filled bed Tp continues to rise, resulting in a decrease in the heat flow received by the bed (refer to Figure 7). Based on the settlement model results shown in Figure 6, it is evident that the saturation inside the filled bed decreases to CLC at t = 5 h. There is a noticeable difference in the saturation inside the filled bed. Currently, the filled bed approaches Stage III, where the flow behavior resulting from wettability and capillary force ceases due to the discontinuity of liquid water within the bed. This causes the water inside the pores to evaporate. The model settlement results indicate that the water vapor pressure within the medium increases by a factor of approximately three during the drying period from t = 5 h to t = 10 h. The water vapor pressure affects the evaporation and diffusion processes, as described in Equations (5) and (12). During Stage III, also known as the deceleration period, the drying rate of the filled bed decreases due to the increasing water vapor pressure in the pore channel (refer to Figure 6b). Simultaneously, the partial pressure of water vapor in the pore channel continuously increases and the accompanying diffusion process of water vapor also intensifies, and eventually the two reach equilibrium, and the drying rate begins to slowly decrease. In the filled bed, when all the liquid water has evaporated, the latent heat of the vaporization of liquid water is far greater than the sensible heat of the quartz sand particles as a whole, and the heat flow to the filled bed is used for the evaporation of liquid water. Therefore, at this time, in order to maintain the evaporation of liquid water, the temperature of the filled bed needs to be lower than the drying ambient temperature. Subsequently, the filled bed temperature reaches the ambient temperature, and the drying process ends.
In summary, the porous media drying process is mainly divided into three stages. Stage I is the warming stage, when the porous media are heated to the point where the heat flow is equal to the latent heat required for the evaporation of liquid water in the media, the temperature increase ends, and Stage II begins. In Stage II, water evaporation is concentrated on the upper surface of the media. At this time, the liquid water is continuous inside the media. When the media saturation reaches the CLC, Stage III begins; Stage III is the same as Stage I in terms of the heating stage, but within this stage, the drying rate decreases rapidly, resulting in the occurrence of convective heat transfer over the evaporative heat absorption in the filled bed. Then, Tp begins to rise to maintain the equilibrium of the heat flow applied to the filled bed, and the dry zone appears to evolve until the wet zone disappears and the medium reaches the dry ambient temperature.
3.2. Sand Bed Particle Size Effect
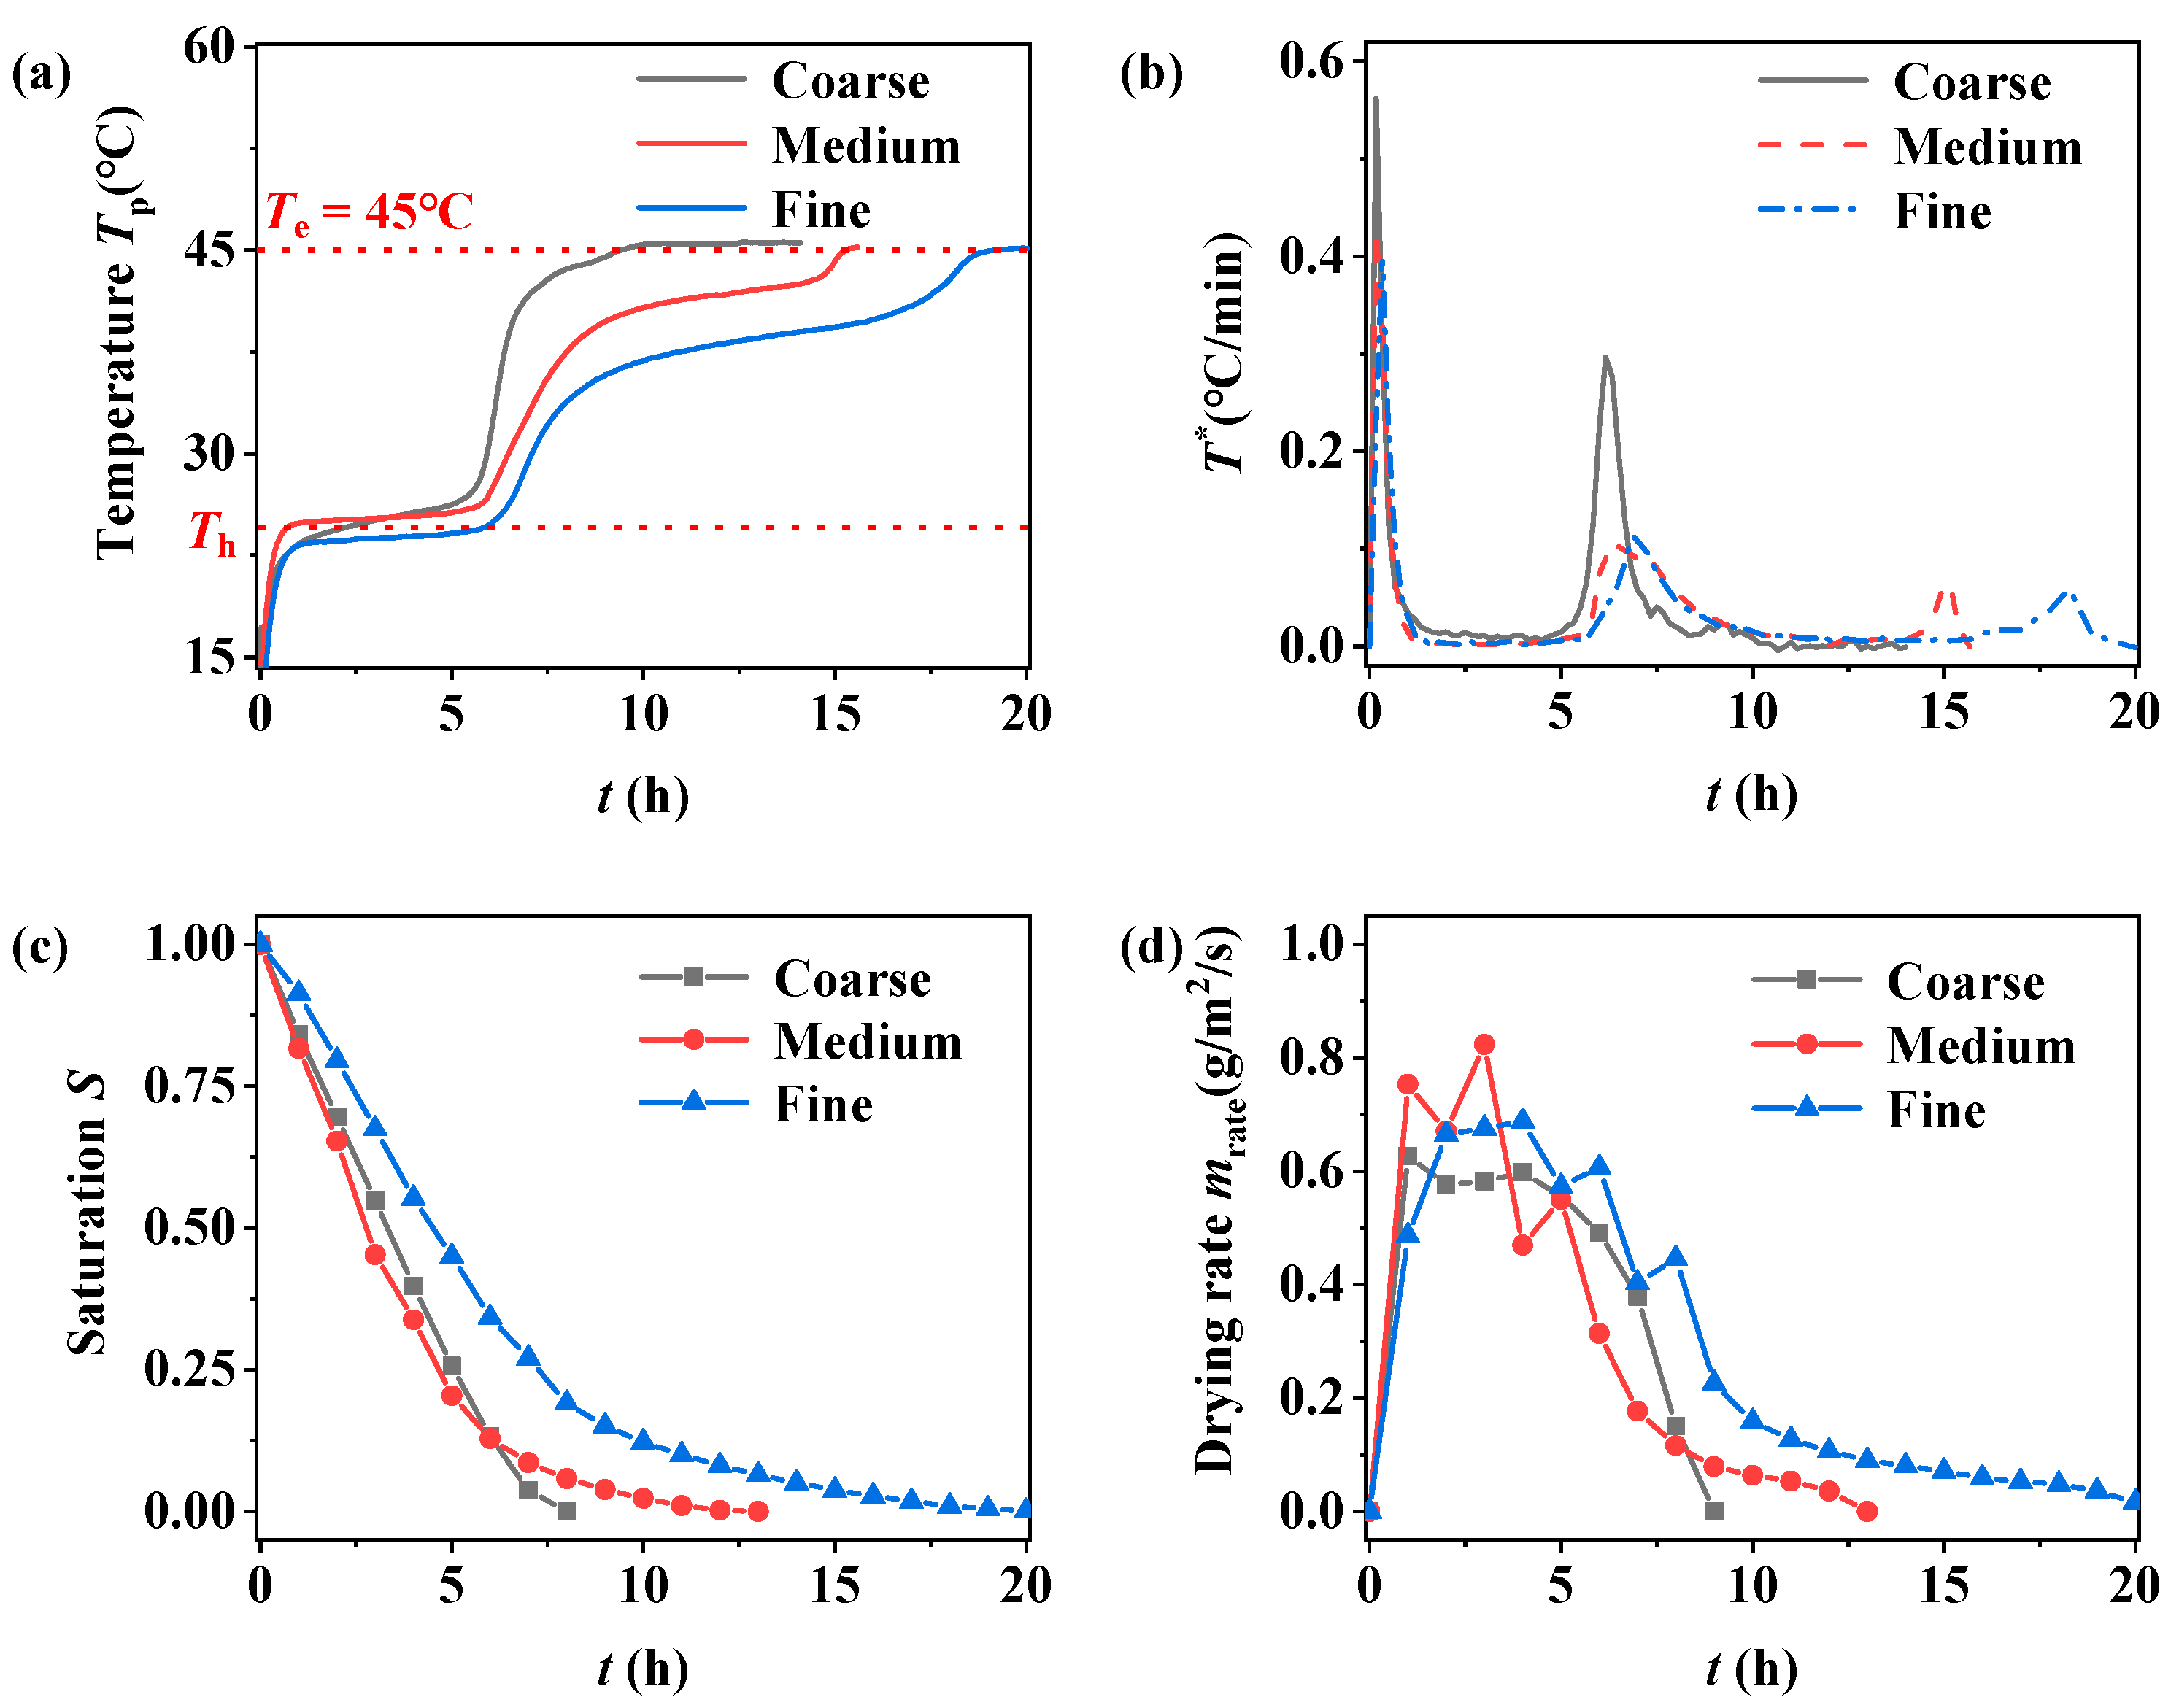
Figure 8 illustrates the temperature and mass changes during the drying process of three samples at 45 °C, and Figure 9 illustrates the model predictions for three particle size ranges. In Stage I, the temperature within the filled bed rapidly increases to Th, where the heat flow input from the environment to the filled bed reaches equilibrium, with the flow carried away by evaporation. As mentioned in Section 3.1, the equilibrium temperature and drying rate in this stage are affected by the drying environment. The experimental results in this section also show that the drying rates of different pore diameters are maintained within the same range (~0.6 g/m2/s) (see Figure 8d). In addition, the Th achieved by the filled beds with different pore sizes is similar, with a deviation of no more than 2 °C, which may be due to the different parameters of the wet air in the drying environment.
In Stage II, the saturation in the filled bed decreases steadily. This process was described in detail in Section 3.1, however, with an increase in particle size, the temperature change in coarse-grained samples appears to be a slow “climb” in this stage (see Figure 8a), which is significantly different from that of medium- and fine-grained samples. This could be attributed to the weakening of capillary forces in the filled bed as the particle size increases. As a result, the free water in coarse-grained samples gravitates to the bottom, causing incomplete wetting of the surface layer of quartz sand and a slower temperature increase in the filled bed. Before Stage III, the drying rate of the filled bed is mainly affected by the ambient wet air parameters, resulting in similar drying rates for filled beds with different particle sizes at the same drying temperature. When the filled bed enters Stage III, as described in Section 3.1, the liquid water inside the filled bed is not continuous, leading to noticeable differences in the drying kinetics of filled beds with different particle size compositions. The temperature data in Figure 8a clearly show that the duration of Stage III increases as the particle size decreases. Coarse-grained samples do not exhibit a second temperature rise in Stage III, as shown in Figure 8b. On the other hand, the temperature gradient of coarse-grained samples in the pre-Stage III period is much larger than that of the medium- and fine-grained samples. With the continuous evolution of the dry and wet zones in Stage III, the differences in pore size between the medium- and fine-grained samples become apparent. The temperature Tb of the fine-grained samples is lower than that of the medium-grained samples when the evaporation and diffusion reach equilibrium in Stage III. However, both of them showed a slow “climbing” phenomenon in Stage II.
In order to better analyze this phenomenon, this paper calculated the starting saturation of Stage III for different particle sizes (see Table 1). The results show that, as the particle size decreases, the starting saturation of Stage III gradually increases, indicating that pore size has an important influence on the development of the end of drying. At the beginning of Stage III, the temperature of the filled bed rises rapidly, but the rate of temperature rise decreases with a decreasing pore size due to the difference in saturation. The amount of apparent heat of temperature rise in the liquid phase of the filled bed is positively correlated with the saturation. At the end of the initial warming of Stage III, a new equilibrium is established between the heat flow input from the environment and its internal sensible heat of warming and latent heat of water evaporation, which depends on the partial pressure of water vapor in the filled bed, as described in Section 3.1. The decrease in pore size results in a decrease in temperature above equilibrium. This is because, when the pore size is small, the saturation in the filled bed is relatively high and the drying rate is relatively fast. Thus, a greater heat flow and a greater temperature difference between the filled bed and the ambient environment are required, resulting in the aforementioned phenomenon.
In summary, pore size is one of the influential factors in the drying process of porous media. With a decreasing pore size, the effect of gravity on the liquid inside the porous medium weakens, while the effect of capillary forces strengthens. This makes the CLC and temperature variation in the medium appear different. In Stage III, the discontinuous distribution of liquid water and the joint transportation process of gas and liquid further highlight the impact of pore size, resulting in noticeable differences in temperature and drying rate.
3.3. Drying Temperature Effect
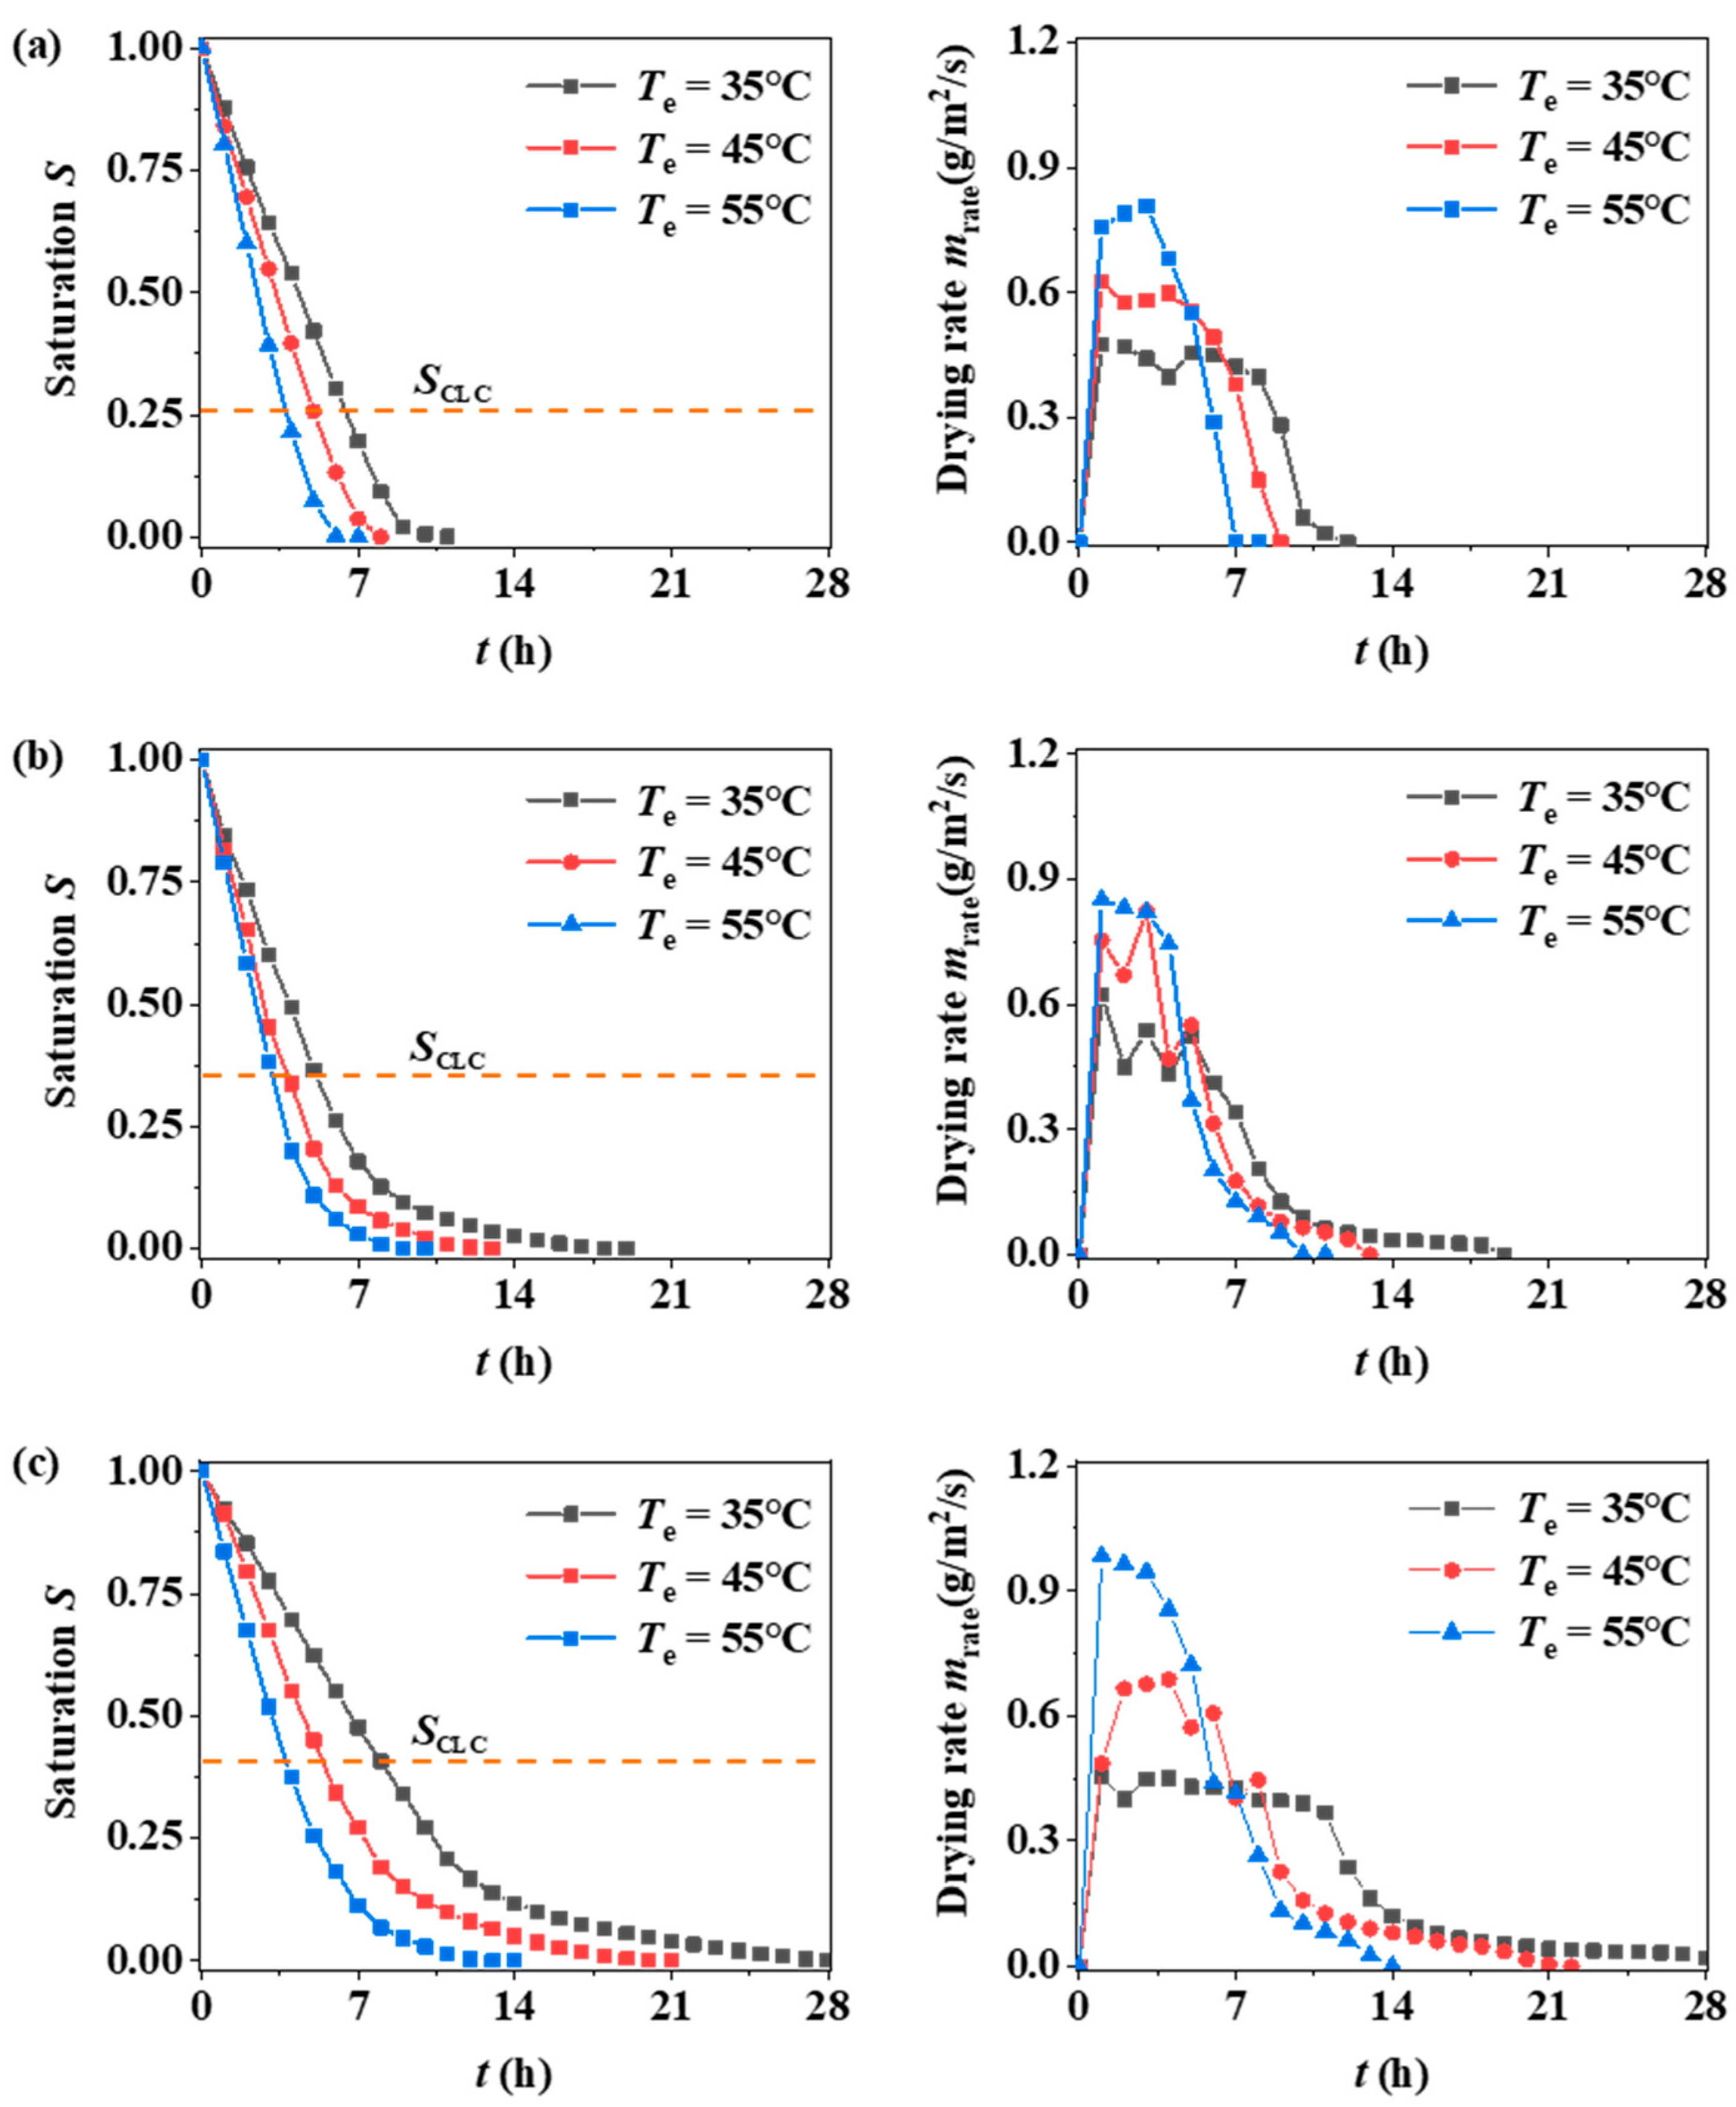
Drying temperature is a crucial environmental parameter in hot air drying (see Figure 10), and its influence is felt throughout the entire drying process. In Stage I, the drying temperature affects the heating rate of this stage, and the end time of this stage is the same for the same particle size sand bed under different drying temperatures. This is because, during the initial period of drying, the drying rate is relatively low, and the thermal and physical parameters of the sand bed under different working conditions are the same. Additionally, since the drying environment is also similar, the convection heat transfer coefficient does not vary significantly. As a result, the relationship between the temperature rise rate and the heat transfer temperature difference is proportional, resulting in a similar end time for Stage I. In Stage II, the Th increases with the rise in drying temperature, and the drying temperature does not affect the trend of the filled bed in this stage. Coarse samples still maintain a slow “climbing” phenomenon in this stage, while medium and fine samples remain constant. A higher ambient temperature results in a greater heat flow through the porous medium at this stage, as it is equal to the latent heat of the evaporation of liquid water within the medium, leading to a higher Th. At different drying temperatures, the trend of temperature changes inside the filled bed is the same, which indicates that this trend, as analyzed in Section 3.2, in general, is primarily due to differences in capillary action caused by variations in pore size.
On the other hand, the drying temperature also affects the drying rate, which can be seen from the experimental results in Figure 11, and the drying rate is positively correlated with the drying temperature. Meanwhile, it can be observed that the variation in saturation remains within the same range under the same trend, and the end of saturation in Stage II is consistent. Additionally, when comparing filled beds with different particle sizes, the drying rate remains within the same range at the same drying temperature. This further supports the aforementioned view that this stage of drying is primarily influenced by the drying environment.
Pre-Stage III, the filled bed heats up rapidly and the heating rate increases with the drying environment temperature. This is because, as entering Stage III, the temperature difference between the filled bed and environment increases. As the drying temperature rises, the difference between the temperature Tb and drying temperature also increases when evaporation and diffusion reach equilibrium inside the filled bed. Stage III is also shortened gradually. The reason for this phenomenon is that as the drying environment temperature gradually increases, Tb in Stage III rises. This leads to a rise in the evaporation mass transfer rate of the filled bed. At the same time, the saturation SCLC of the filled bed with the same particle size in Stage III at different temperatures is the same. This results in a significant shortening of the time duration in Stage III. In addition, because of the influence of particle size, the saturation of different filled beds entering Stage III is different, which causes the heating rate of the filled bed pre-Stage III.
In summary, the drying ambient temperature affects the heat flow applied to the filled bed, causing Tp to increase with an increase in the drying temperature in the same stage during the drying process of the filled bed in different conditions. On the other hand, under different drying ambient temperatures, the SCLC of filled beds with the same particle size is the same, and the temperature trend in late Stage III is similar. This indicates that temperature has a lesser impact on the state of the medium in Stage III.
4. Conclusions
In this paper, the experimental method of a quartz-sand-filled bed was used to determine the temperature, saturation, and drying rate changes in a quartz-sand-filled bed with different pore size distributions at different temperatures. The heat–wet coupling mathematical model, considering the capillary moisture transport inside the porous medium, evaporative phase change, and heat transfer in the porous medium, was established and verified. Based on the mathematical model theory, the heat and mass transfer characteristics and mechanism inside the filled bed were analyzed, and the following conclusions can be drawn:
- 1.
- There are three stages of porous media drying: Stage I, in the primary warming period, Stage II, in the constant temperature period, and Stage III, in the secondary warming period. With a reduction in the porous media particle size, a temperature plateau occurs in the secondary heating period (Stage III) and the maintenance time of the plateau period is extended with the reduction in the particle size of the filled bed.
- 2.
- Pore size is one of the factors affecting the drying process of porous media. With a reduction in pore size, the capillary effect inside the media is enhanced, gravity is constantly reduced, and the transport of moisture is mainly controlled by the capillary force gradient. This makes the critical liquid content inside the filled bed increase, the temperature rise rate within the second heating period (Stage III) slow down, and the drying rate increase.
- 3.
- The drying environment temperature mainly affects the drying rate, so it has less effect on the critical liquid content controlled by the pore structure of the filled bed.
There are some shortcomings in the research approach of this paper, such as the inability to obtain the detailed saturation distribution inside the media. Therefore, the content of this paper can be further deepened by using NMR or CT to obtain the real moisture distribution inside the media. This will further deepen the understanding of the capillary effect on the drying process of porous media and deepen the comprehension of the soil evaporation process.
Author Contributions
W.S.: data curation, methodology, investigation, writing—review and editing. X.C.: methodology, supervision. Z.D.: supervision, conceptualization, methodology, writing—review and editing. All authors have read and agreed to the published version of the manuscript.
Funding
This research was funded by National Natural Science Foundation of China (Grant No. 52276054).
Data Availability Statement
The data presented in this study are available on request from the corresponding author.
Conflicts of Interest
The authors declare no conflicts of interest.
References
- Huang, Q.; Jiang, Z.; Gu, X.; Zhang, W.; Guo, B. Numerical simulation of moisture transport in concrete based on a pore size distribution model. Cem. Concr. Res. 2015, 67, 31–43. [Google Scholar] [CrossRef]
- Pu, S.R.; Su, J.X.; Li, L.X.; Wang, H.S.; Chen, C.Y.; Hu, X.J. Bioinspired sweating with temperature sensitive hydrogel to passively dissipate heat from high-end wearable electronics. Energy Conv. Manag. 2019, 180, 747–756. [Google Scholar] [CrossRef]
- Lerouge, T.; Maillet, B.; Coutier-Murias, D.; Grande, D.; Le Droumaguet, B.; Pitois, O.; Coussot, P. Drying of a Compressible Biporous Material. Phys. Rev. Appl. 2020, 13, 044061. [Google Scholar] [CrossRef]
- Hnin, K.K.; Zhang, M.; Mujumdar, A.S.; Zhu, Y.L. Emerging food drying technologies with energy-saving characteristics: A review. Dry. Technol. 2019, 37, 1465–1480. [Google Scholar] [CrossRef]
- Radojčin, M.; Pavkov, I.; Bursać Kovačević, D.; Putnik, P.; Wiktor, A.; Stamenković, Z.; Kešelj, K.; Gere, A. Effect of Selected Drying Methods and Emerging Drying Intensification Technologies on the Quality of Dried Fruit: A Review. Processes 2021, 9, 132. [Google Scholar] [CrossRef]
- Zhao, J.; Fu, Z.; Jia, X.; Cai, Y. Modeling conventional drying of wood: Inclusion of a moving evaporation interface. Dry. Technol. 2015, 34, 530–538. [Google Scholar] [CrossRef]
- Wu, R.; Cui, G.-M.; Chen, R. Pore network study of slow evaporation in hydrophobic porous media. Int. J. Heat Mass Transf. 2014, 68, 310–323. [Google Scholar] [CrossRef]
- Khaled, A.Y.; Kabutey, A.; Selvi, K.Ç.; Mizera, Č.; Hrabe, P.; Herák, D. Application of Computational Intelligence in Describing the Drying Kinetics of Persimmon Fruit (Diospyros kaki) During Vacuum and Hot Air Drying Process. Processes 2020, 8, 544. [Google Scholar] [CrossRef]
- Royen, M.J.; Noori, A.W.; Haydary, J. Experimental Study and Mathematical Modeling of Convective Thin-Layer Drying of Apple Slices. Processes 2020, 8, 1562. [Google Scholar] [CrossRef]
- Guzmán-Meza, M.; Laurindo, J.B.; Jarpa-Parra, M.; Segura-Ponce, L. Isothermal drying of plant-based food material: An approach using 2D polydimethylsiloxane (PDMS) micromodels. Chem. Eng. Sci. 2020, 215, 115385. [Google Scholar] [CrossRef]
- Coussot, P. Scaling approach of the convective drying of a porous medium. Eur. Phys. J. B 2000, 15, 557–566. [Google Scholar] [CrossRef]
- Kumar, N.; Arakeri, J.H. Evaporation From Layered Porous Medium in the Presence of Infrared Heating. Water Resour. Res. 2018, 54, 7670–7687. [Google Scholar] [CrossRef]
- Kumar, N.; Arakeri, J.H. Investigation on the effect of temperature on evaporative characteristic length of a porous medium. Dry. Technol. 2019, 38, 1194–1206. [Google Scholar] [CrossRef]
- Ceaglske, N.H.; Hougen, O.A. Drying Granular Solids. Ind. Eng. Chem. 2002, 29, 805–813. [Google Scholar] [CrossRef]
- Thiery, J.; Rodts, S.; Weitz, D.A.; Coussot, P. Drying regimes in homogeneous porous media from macro- to nanoscale. Phys. Rev. Fluids 2017, 2, 074201. [Google Scholar] [CrossRef]
- Lehmann, P.; Assouline, S.; Or, D. Characteristic lengths affecting evaporative drying of porous media. Phys. Rev. E Stat. Nonlin Soft Matter Phys. 2008, 77, 056309. [Google Scholar] [CrossRef]
- Kumar, N.; Arakeri, J.H. Evaporation From Confined Porous Media Due to Controlled IR Heating From Above. Transp. Porous Media 2018, 125, 311–340. [Google Scholar] [CrossRef]
- Tang, Y.; Min, J. Water film coverage model and its application to the convective air-drying simulation of a wet porous medium. Int. J. Heat Mass Transf. 2019, 131, 999–1008. [Google Scholar] [CrossRef]
- Prommas, R. Theoretical and experimental study of heat and mass transfer mechanism during convective drying of multi-layered porous packed bed. Int. Commun. Heat Mass Transf. 2011, 38, 900–905. [Google Scholar] [CrossRef]
- Jean-François Daian, J.S. Determination d’un réseau aleatoire de pores pour modéliser la sorption et la migration d’humidité dans un mortier de ciment. Int. J. Heat Mass Transf. 1991, 34, 2081–2096. [Google Scholar] [CrossRef]
- Nowicki, S.C.; Davis, H.T.; Scriven, L.E. Microscopic determination of transport paraheters in drying porous media. Dry. Technol. 1992, 10, 925–946. [Google Scholar] [CrossRef]
- Whitaker, S. Simultaneous Heat, Mass, and Momentum Transfer in Porous Media: A Theory of Drying. In Advances in Heat Transfer; Academic Press: Cambridge, MA, USA, 1977; Volume 13, pp. 119–203. [Google Scholar]
- Prat, M. Recent advances in pore-scale models for drying of porous media. Chem. Eng. J. 2002, 86, 153–164. [Google Scholar] [CrossRef]
- Whitaker, S. The Method of Volume Averaging; Springer Science & Business Media: Berlin/Heidelberg, Germany, 1998; Volume 13. [Google Scholar]
- Lu, X.; Tsotsas, E.; Kharaghani, A. Scale transition: Pore network study of how pore structure affects the macroscopic parameters of the continuum model for drying. Dry. Technol. 2023, 41, 948–967. [Google Scholar] [CrossRef]
- Vu, H.T.; Tsotsas, E. A Framework and Numerical Solution of the Drying Process in Porous Media by Using a Continuous Model. Int. J. Chem. Eng. 2019, 2019, 9043670. [Google Scholar] [CrossRef]
- Li, Z.; Vanderborght, J.; Smits, K.M. Evaluation of model concepts to describe water transport in shallow subsurface soil and across the soil–air interface. Transp. Porous Media 2019, 128, 945–976. [Google Scholar] [CrossRef]
- Nuske, P.; Joekar-Niasar, V.; Helmig, R. Non-equilibrium in multiphase multicomponent flow in porous media: An evaporation example. Int. J. Heat Mass Transf. 2014, 74, 128–142. [Google Scholar] [CrossRef]
- Stull, D.R. Vapor pressure of pure substances. Organic and inorganic compounds. Ind. Eng. Chem. 1947, 39, 517–540. [Google Scholar] [CrossRef]
- Hegde, V.H.; Doherty, M.F.; Squires, T.M. A two-phase model that unifies and extends the classical models of membrane transport. Science 2022, 377, 186–191. [Google Scholar] [CrossRef]
- Rogers, J.A.; Kaviany, M. Funicular and evaporative-front regimes in convective drying of granular beds. Int. J. Heat Mass Transf. 1992, 35, 469–480. [Google Scholar] [CrossRef]
- Ullman, W.J.; Aller, R.C. Diffusion-coefficients in nearshore marine-sediments. Limnol. Oceanogr. 1982, 27, 552–556. [Google Scholar] [CrossRef]
- Devries, D.A. The theory of heat and moisture transfer in porous-media revisited. Int. J. Heat Mass Transf. 1987, 30, 1343–1350. [Google Scholar] [CrossRef]
- Bruggeman, V.D. Berechnung verschiedener physikalischer Konstanten von heterogenen Substanzen. I. Dielektrizitätskonstanten und Leitfähigkeiten der Mischkörper aus isotropen Substanzen. Ann. Phys. 1935, 416, 636–664. [Google Scholar] [CrossRef]
- Shen, L.; Chen, Z.X. Critical review of the impact of tortuosity on diffusion. Chem. Eng. Sci. 2007, 62, 3748–3755. [Google Scholar] [CrossRef]
- Moseley, W.A.; Dhir, V.K. Capillary pressure-saturation relations in porous media including the effect of wettability. J. Hydrol. 1996, 178, 33–53. [Google Scholar] [CrossRef]
- Huang, C.; Siang, H.; Best, C. Heat and moisture transfer in concrete slabs. Int. J. Heat Mass Transf. 1979, 22, 257–266. [Google Scholar] [CrossRef]
- Ilic, M.; Turner, I.W. Convective drying of a consolidated slab of wet porous material. Int. J. Heat Mass Transf. 1989, 32, 2351–2362. [Google Scholar] [CrossRef]
- Autengruber, M.; Lukacevic, M.; Füssl, J. Finite-element-based moisture transport model for wood including free water above the fiber saturation point. Int. J. Heat Mass Transf. 2020, 161, 120228. [Google Scholar] [CrossRef]
- Sherwood, T.K. The drying of solids—II. Ind. Eng. Chem. 1929, 21, 976–980. [Google Scholar] [CrossRef]
Figure 1.
Experimental setup diagram: (a) schematic diagram of the experimental setup for filled-bed drying and (b) three-dimensional arrangement of thermocouples in the filled bed.
Figure 1.
Experimental setup diagram: (a) schematic diagram of the experimental setup for filled-bed drying and (b) three-dimensional arrangement of thermocouples in the filled bed.

Figure 2.
Schematic diagram of physical model.

Figure 3.
Mesh-independent verification.

Figure 4.
Experimental results of medium-grained samples (particle size 48–75 μm) at 45 °C: (a) temperature change, (b) rate of temperature change, (c) saturation change, and (d) drying rate.
Figure 4.
Experimental results of medium-grained samples (particle size 48–75 μm) at 45 °C: (a) temperature change, (b) rate of temperature change, (c) saturation change, and (d) drying rate.
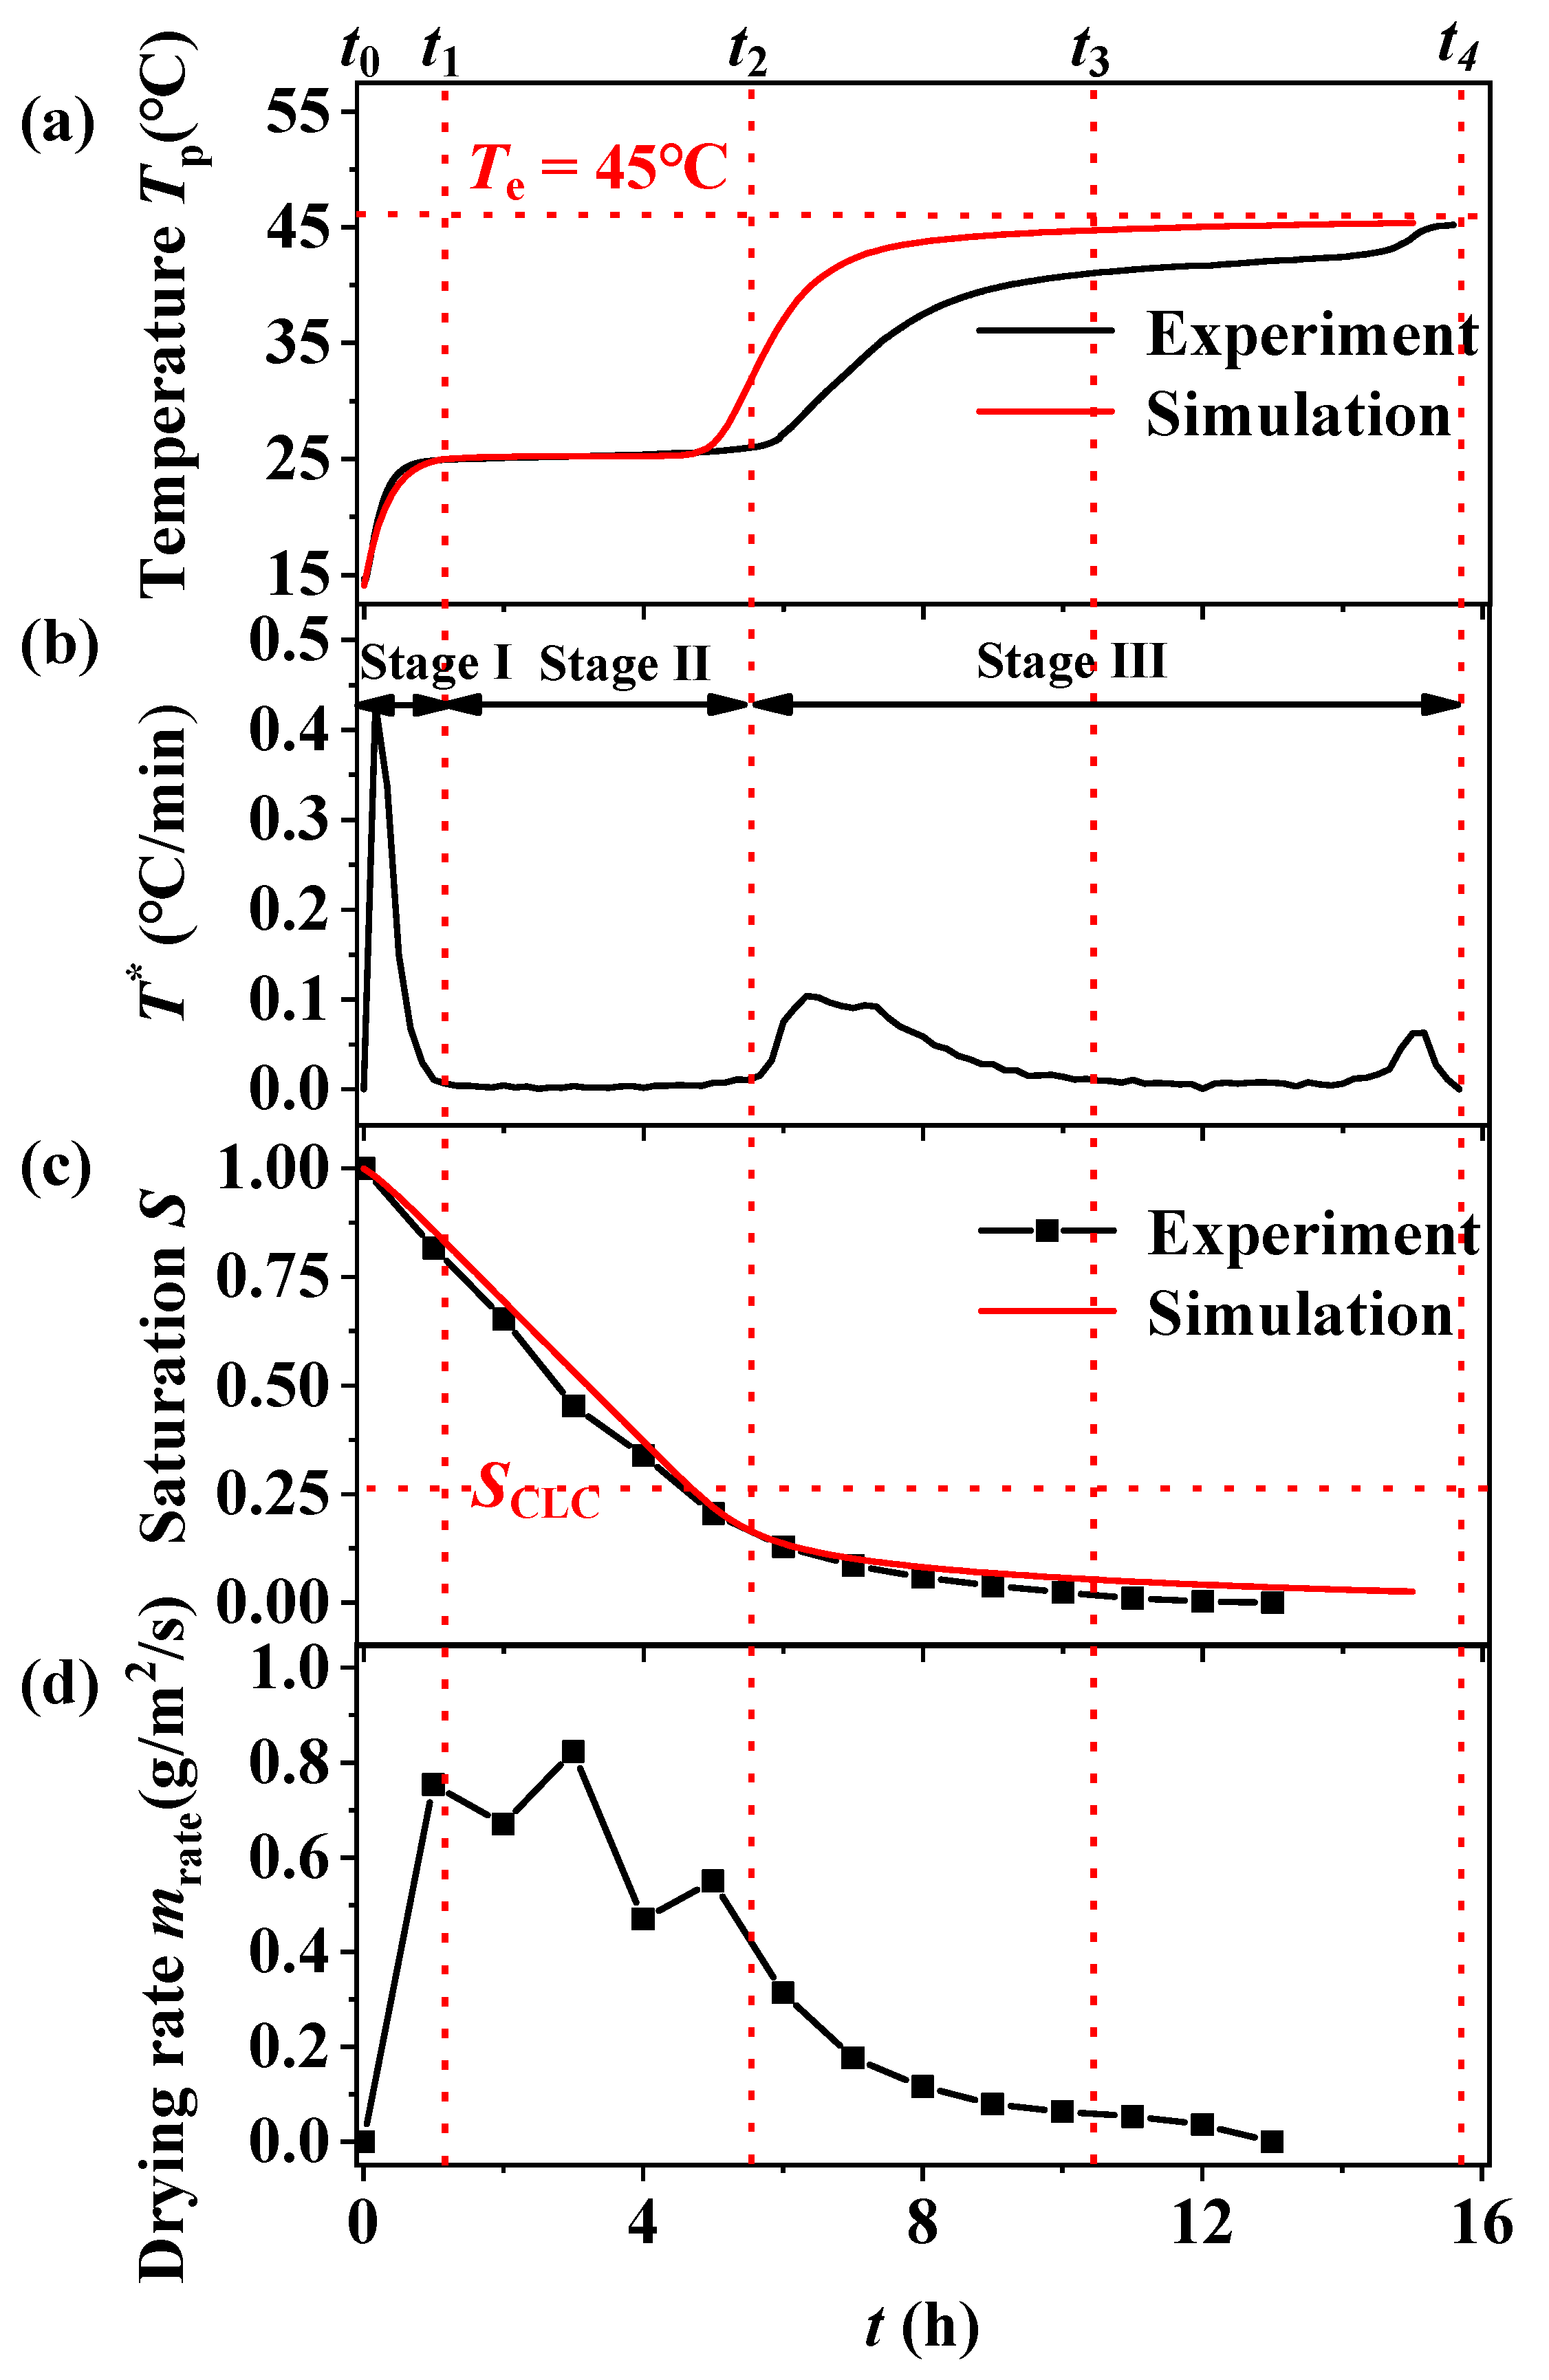
Figure 5.
Description of the drying process: (a) initial drying state, (b) intermediate drying period, (c) late drying period, and (d) end of drying.
Figure 5.
Description of the drying process: (a) initial drying state, (b) intermediate drying period, (c) late drying period, and (d) end of drying.

Figure 6.
Simulation results of internal parameters of the filled bed: (a) saturation and (b) water vapor pressure.
Figure 6.
Simulation results of internal parameters of the filled bed: (a) saturation and (b) water vapor pressure.

Figure 7.
Variation in convective heat transfer and evaporative heat absorption in the drying process: (a) convective heat transfer and evaporation of latent heat over time and (b) schematic diagrams.
Figure 7.
Variation in convective heat transfer and evaporative heat absorption in the drying process: (a) convective heat transfer and evaporation of latent heat over time and (b) schematic diagrams.

Figure 8.
Variation in drying characteristics with particle size at 45 °C: (a) temperature change, (b) rate of temperature change, (c) saturation change, and (d) drying rate.
Figure 8.
Variation in drying characteristics with particle size at 45 °C: (a) temperature change, (b) rate of temperature change, (c) saturation change, and (d) drying rate.

Figure 9.
Model prediction results: (a) coarse samples (particle size 430–700 μm), (b) medium samples (particle size 48–75 μm), and (c) fine samples (particle size 4–6 μm).
Figure 9.
Model prediction results: (a) coarse samples (particle size 430–700 μm), (b) medium samples (particle size 48–75 μm), and (c) fine samples (particle size 4–6 μm).
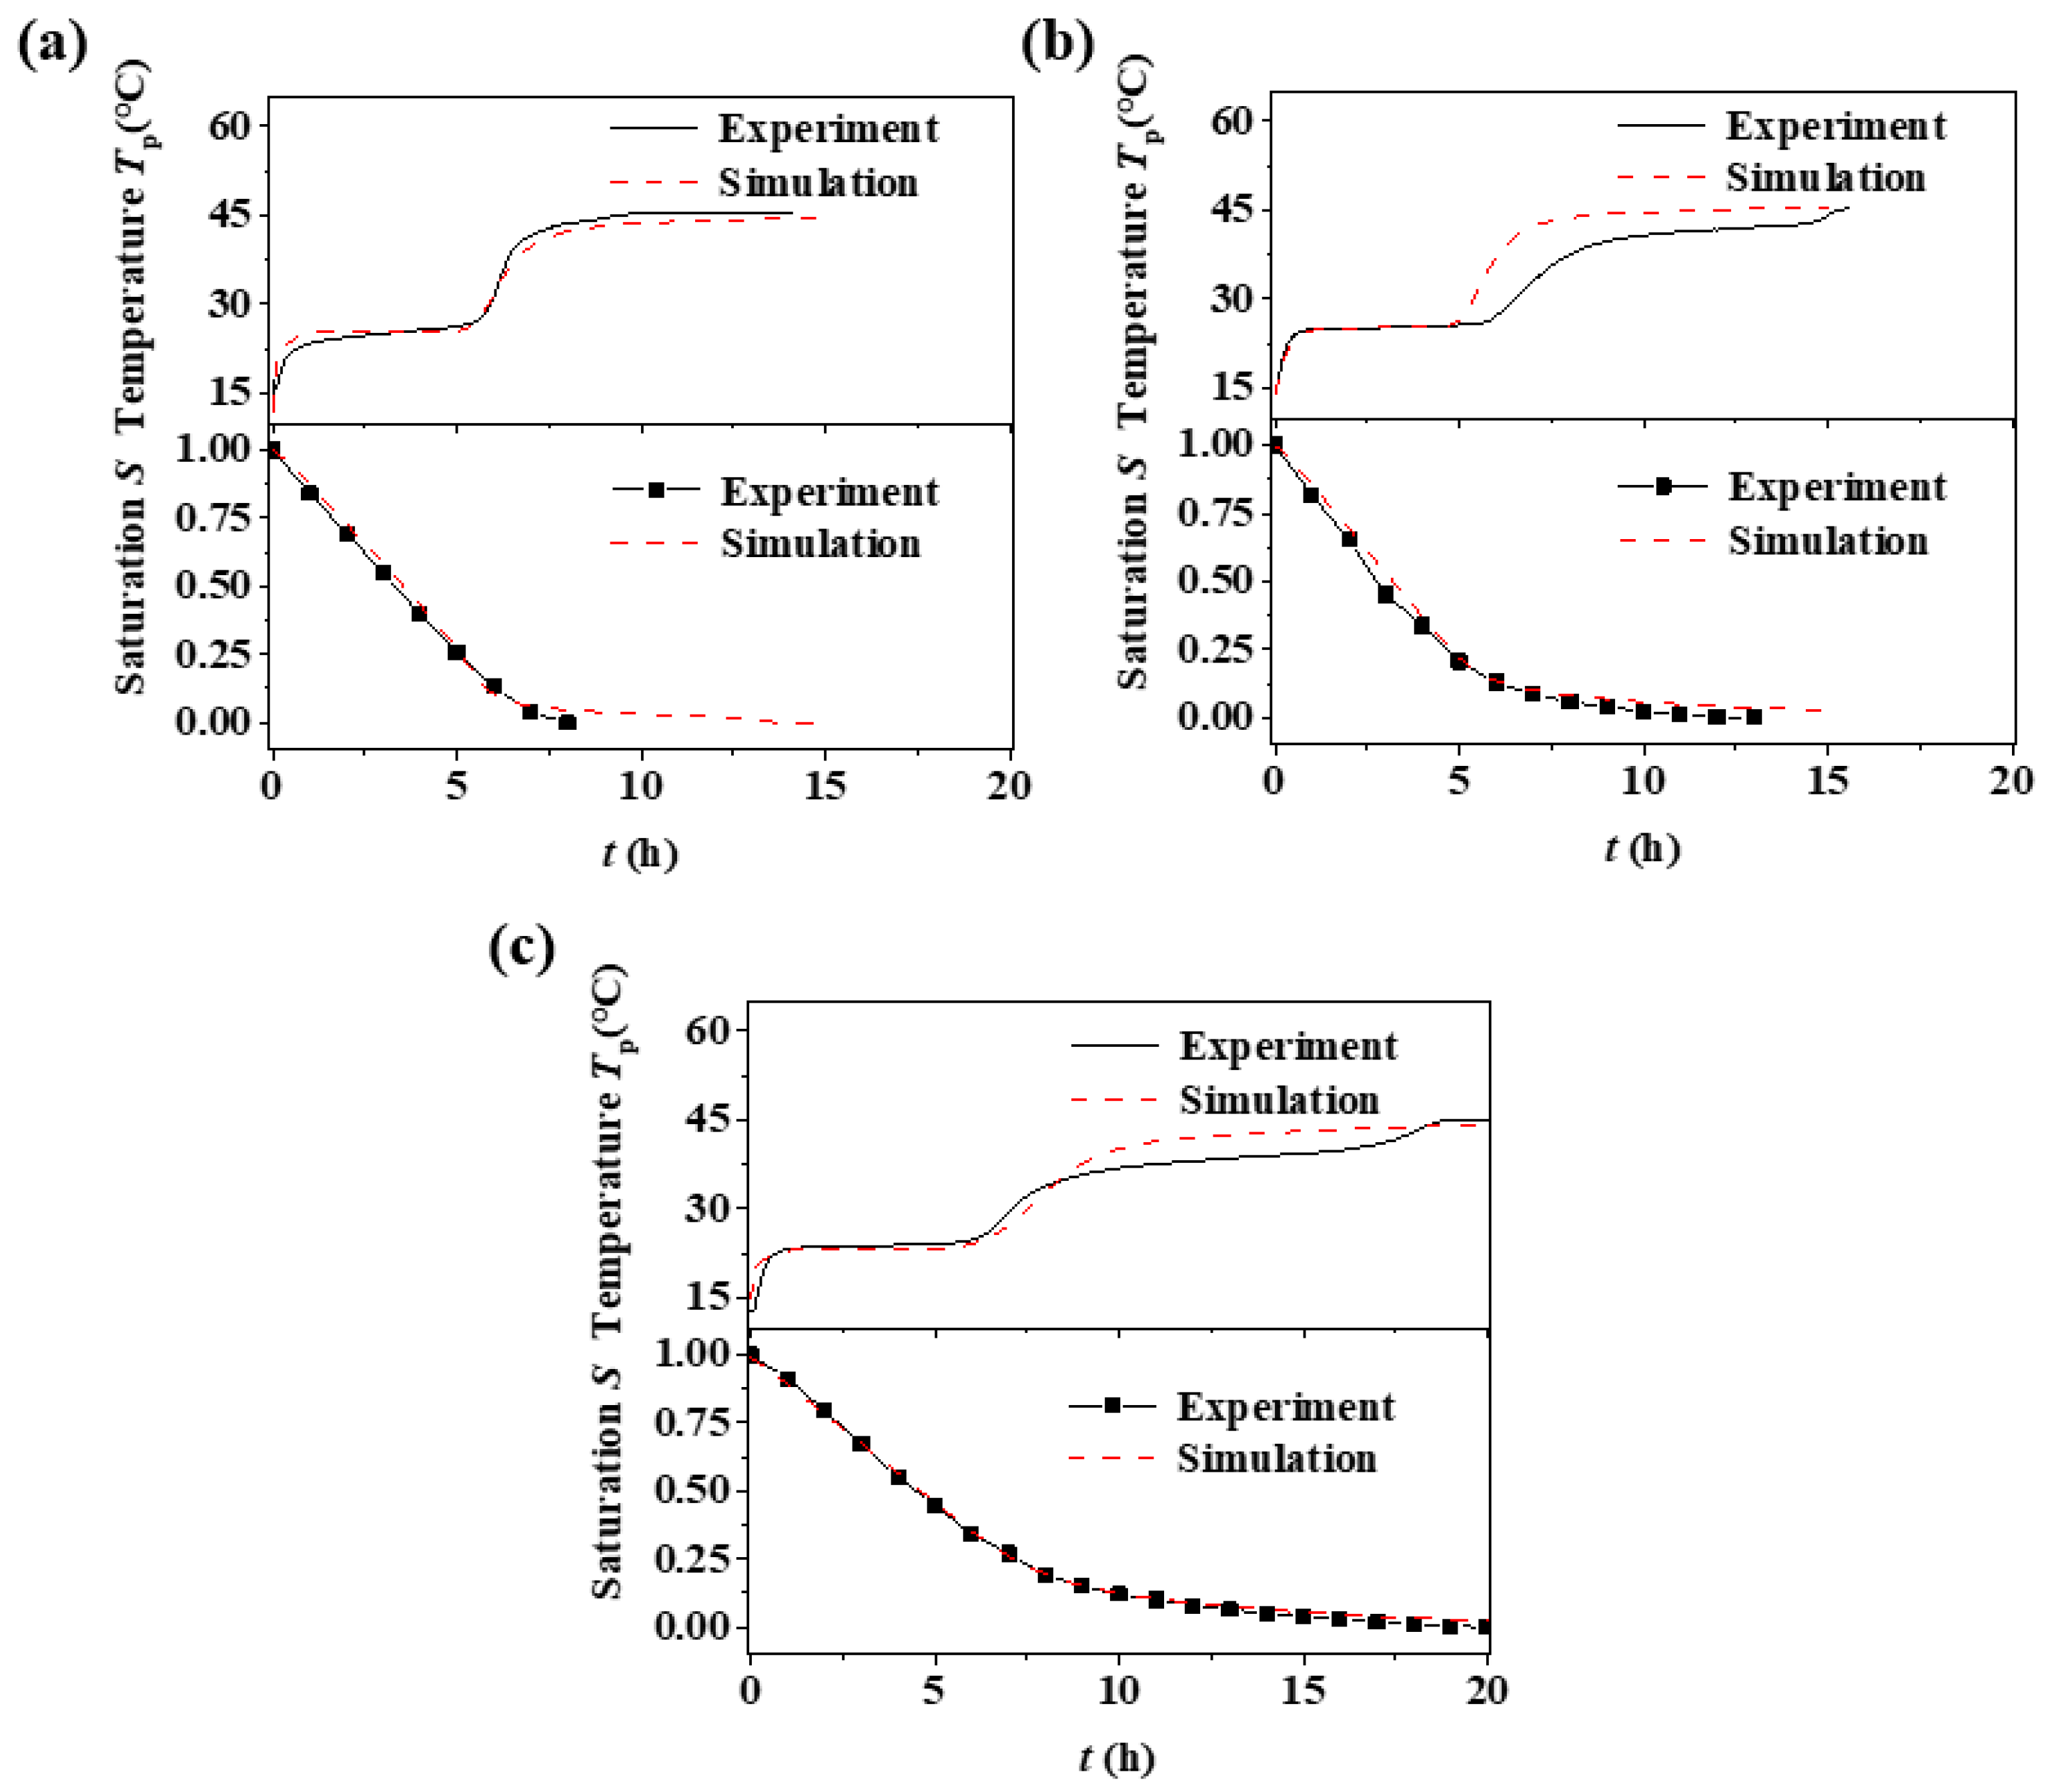
Figure 10.
Temperature change and rate of temperature change for different samples at different drying temperatures: (a) coarse samples (particle size 430–700 μm), (b) medium samples (particle size 48–75 μm), and (c) fine samples (particle size 4–6 μm).
Figure 10.
Temperature change and rate of temperature change for different samples at different drying temperatures: (a) coarse samples (particle size 430–700 μm), (b) medium samples (particle size 48–75 μm), and (c) fine samples (particle size 4–6 μm).
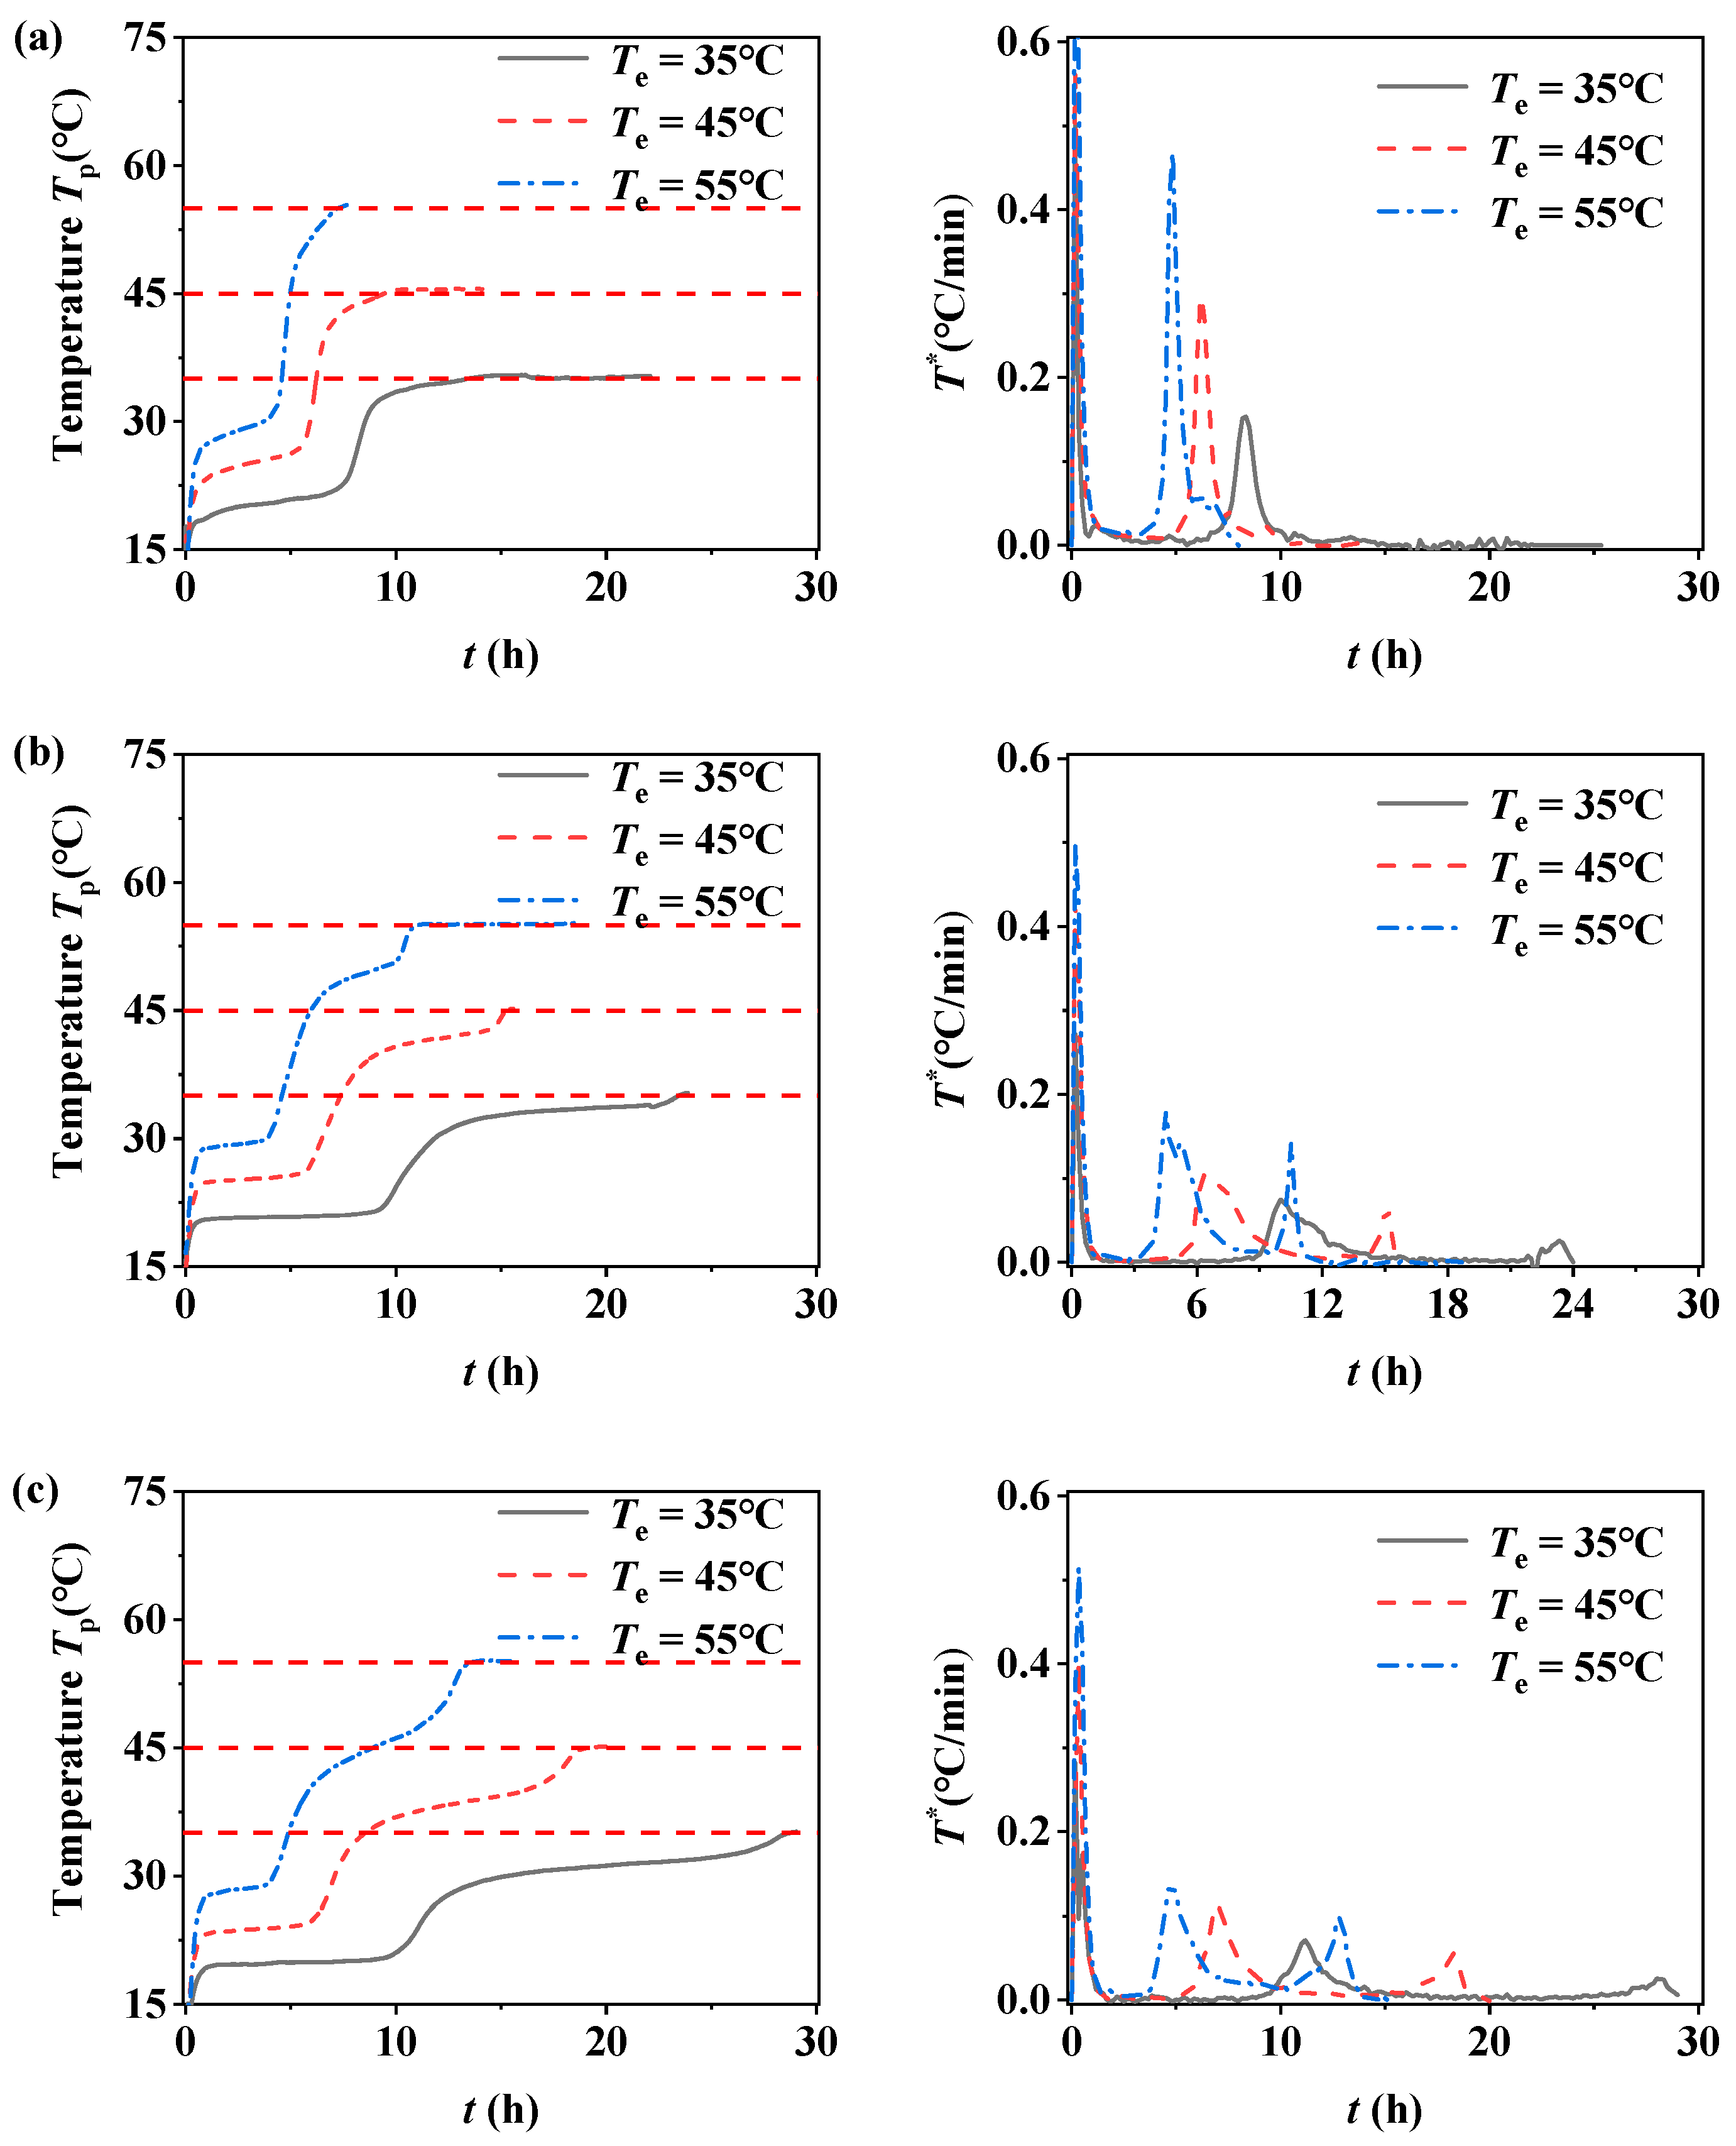
Figure 11.
Variation in saturation and drying rate for different samples at different drying temperatures: (a) coarse samples (particle size 430–700 μm), (b) medium samples (particle size 48–75 μm), and (c) fine samples (particle size 4–6 μm).
Figure 11.
Variation in saturation and drying rate for different samples at different drying temperatures: (a) coarse samples (particle size 430–700 μm), (b) medium samples (particle size 48–75 μm), and (c) fine samples (particle size 4–6 μm).


Table 1.
Starting saturation of Stage III for different particle sizes.
| Stage | Particle Size dp(μm) | Starting Saturation |
|---|---|---|
| Stage III | 4–6 | 0.342 |
| 48–75 | 0.338 | |
| 430–700 | 0.257 |
Disclaimer/Publisher’s Note: The statements, opinions and data contained in all publications are solely those of the individual author(s) and contributor(s) and not of MDPI and/or the editor(s). MDPI and/or the editor(s) disclaim responsibility for any injury to people or property resulting from any ideas, methods, instructions or products referred to in the content. |
© 2024 by the authors. Licensee MDPI, Basel, Switzerland. This article is an open access article distributed under the terms and conditions of the Creative Commons Attribution (CC BY) license (https://creativecommons.org/licenses/by/4.0/).
Share and Cite
MDPI and ACS Style
Su, W.; Cao, X.; Deng, Z. Experimental and Theoretical Analysis of the Thermostatic Drying Process in Wetted Porous Sand Beds with Different Pore Sizes. Processes 2024, 12, 337. https://doi.org/10.3390/pr12020337
AMA Style
Su W, Cao X, Deng Z. Experimental and Theoretical Analysis of the Thermostatic Drying Process in Wetted Porous Sand Beds with Different Pore Sizes. Processes. 2024; 12(2):337. https://doi.org/10.3390/pr12020337
Chicago/Turabian StyleSu, Weijie, Xiang Cao, and Zilong Deng. 2024. "Experimental and Theoretical Analysis of the Thermostatic Drying Process in Wetted Porous Sand Beds with Different Pore Sizes" Processes 12, no. 2: 337. https://doi.org/10.3390/pr12020337
Note that from the first issue of 2016, this journal uses article numbers instead of page numbers. See further details here.