Article

Supercritical Direct-Methane-to-Methanol Coupled with Gas-to-Wire for Low-Emission Offshore Processing of CO2-Rich Natural Gas: Techno-Economic and Thermodynamic Analyses

by
Alessandra de Carvalho Reis
,
Ofélia de Queiroz Fernandes Araújo
and
José Luiz de Medeiros
*
Escola de Química, Federal University of Rio de Janeiro, CT, E, Ilha do Fundão, Rio de Janeiro 21941-909, RJ, Brazil
*
Author to whom correspondence should be addressed.
Processes 2024, 12(2), 374; https://doi.org/10.3390/pr12020374
Submission received: 16 January 2024 / Revised: 7 February 2024 / Accepted: 10 February 2024 / Published: 13 February 2024
(This article belongs to the Special Issue Energy Process Systems Simulation, Modeling, Optimization and Design)

Abstract

:
A greater H/C ratio and energy demand are factors that boost natural gas conversion into electricity. The Brazilian offshore pre-salt basin has large reserves of CO2-rich associated gas. Selling this gas requires high-depth long-distance subsea pipelines, making gas-to-pipe costly; in particular, gas-to-wire instead of gas-to-pipe is more practical since it is easier to transmit electricity via long subsea distances. This research proposes and investigates an innovative low-emission gas-to-wire alternative consisting of installing supercritical direct-methane-to-methanol upstream to gas-to-wire, which is embedded in an exhaust-gas recycle loop that reduces the subsequent carbon capture costs. The process exports methanol and electricity from remote offshore oil-and-gas fields with available CO2-rich natural gas, while capturing CO2. Techno-economic, thermodynamic and lost work analyses assess the alternative. Supercritical direct-methane-to-methanol is conducted in supercritical water with air. This route is chosen because supercritical water readily dissolves methanol and CO2, helping to preserve methanol via stabilization against further oxidation by gaseous air. Besides being novel, this process has intensification since it implements exhaust-gas recycle for –flue-gas reduction, CO2 abatement via post-combustion capture with aqueous monoethanolamine, CO2 dehydration with triethylene glycol and CO2 densification for enhanced oil recovery. The process is fed with 6.5 MMS m3/d of CO2-rich natural gas (CO2 > 40%mol) exporting methanol (2.2 t/h), electricity (457.1 MW) and dense CO2 for enhanced oil recovery, with an investment of 1544 MMUSD, 452 MMUSD/y in manufacturing costs and 820 MMUSD/y in revenues, reaching 1021 MMUSD net present value (50 years) and a 10 year payback time. The Second Law analysis reveals overall thermodynamic efficiency of 28%. The lost work analysis unveils the gas-combined-cycle sub-system as the major lost work sink (76% lost work share), followed by the post-combustion capture plant (14% lost work share), being the units that prominently require improvements for better economic and environmental performance. This work demonstrates that the newly proposed process is techno-economically feasible, environmentally friendly, thermodynamically efficient and competitive with the gas-to-wire processes in the literature.

1. Introduction

Fossil fuels still lead the global energy matrix, despite the increasing utilization of renewable sources. A huge rise in power generation from natural gas is predicted for the next few decades, considering that natural gas (NG) is the cleanest fossil fuel and its reserves are expanding [1]. In the Brazilian pre-salt offshore basin, the deep-water oil reserves have a high gas-to-oil ratio with an associated gas that is very rich in terms of carbon dioxide (CO2) (above 40%mol) [2]. The commercialization of this low-quality gas requires large investments in high-depth long-distance subsea pipelines to deliver such NG to the market [3]. In this context, a suitable solution to overcome both the NG and CO2 transport infrastructures (gas-to-pipe) is to implement floating gas-to-wire (GTW) plants comprising NG combined cycles (NGCC) [4]. An important issue for the technical feasibility of GTW is the gas availability in order to guarantee its conversion into electricity [5]. Implemented on floating rigs over offshore gas fields, GTW converts the raw gas directly into electricity, which is sent to onshore sites by using high-voltage direct-current (HVDC) cables [6] for lower transmission losses [7]. However, GTW per se is not sufficient given the current climate concerns, i.e., GTW must be accompanied by carbon capture and storage (CCS) or carbon capture and utilization (CCU) in order to guarantee low CO2 emissions.

1.1. Offshore Gas-to-Wire with CCS

Given the global warming scenario, GTW must be combined with CCS or CCU to reach emission targets [8], lowering the carbon footprint of the produced power [9]. A suitable solution for the captured CO2 is its reinjection into the reservoir as enhanced oil recovery (EOR) fluid [10], since it increases oil production [11], offering additional monetary leverage [12]. Thus, EOR is considered a CCU strategy. Assessing several CCS configurations (such as chemical absorption, physical absorption, membrane permeation and hybrids), Araújo et al. [13] identified that chemical absorption attains the minimum CO2 emissions per ton of CO2 injected. Hetland et al. [14] studied a GTW-CCS plant evaluating the coupling of post-combustion carbon capture (PCC) with a floating Siemens NGCC. In their configuration, the NGCC flue gas feeds a PCC unit using an aqueous monoethanolamine (aqueous MEA) solvent. Despite not considering important techniques like exhaust gas recycling (EGR) and CO2-EOR stream dehydration, the authors demonstrated the theoretical feasibility of a floating GTW-CCS.
In the context of low-emission GTW-CCS processes, EGR is being considered in the literature [15]. EGR favors the CO2 separation step, since it lowers the exhaust gas flow rate and raises the flue gas CO2 content. Higher CO2 content increases the driving force for CO2 capture, decreasing the column height, while the lower flue gas flow rate lowers the column diameter, i.e., both EGR consequences reduce the CCS/CCU investment [16]. As the circulating nitrogen and oxygen flow rates diminish in the flue gas, EGR also reduces NOX emissions [17]. Thus, GTW-CCS implementation on offshore rigs over deep-water oil-and-gas fields must consider (i) EGR; (ii) post-combustion carbon capture from enriched flue gas through absorption in aqueous monoethanolamine (aqueous MEA), i.e., the PCC-MEA plant; (iii) a high-pressure CO2 dehydration unit (CDU) to reduce the water content (below ≈160 ppm-mol), preventing CO2 hydrate formation [18]; and (iv) the injection of dense CO2 in the reservoir as an EOR agent.

1.2. Direct Methane-to-Methanol

Direct methane (conversion) to methanol (DMTM) has been widely investigated in the literature as an alternative for the production of methanol from methane, dismissing the expensive reforming and synthesis gas route. Zakaria and Kamarudin [19] discuss several pathways for DMTM, including gas-phase DMTM, liquid-phase DMTM and supercritical DMTM. Zhang et al. [20] carried out gas-phase DMTM, obtaining methanol selectivity of 60% at 13% methane conversion at 50 bar and 430–470 °C. Holmen [21] also studied gas-phase DMTM and claimed that the best results occurred at methanol selectivity values of 30–40%, with methane conversion of 5–10% under 30–60 bar and 450–500 °C. In liquid-phase DMTM routes, a crucial factor is the selection of a convenient solvent [22]. The major obstacle is the need for catalysts that not only exhibit adequate selectivity and reactivity, but also tolerate oxidation and protic solvents. Liquid-phase DMTM reactions generally present methane conversion limited to ≈10% [23]. The main challenge of gas-phase and liquid-phase DMTM is to preserve the formed methanol, stabilizing it to prevent further oxidation, since the reaction medium conditions are aggressive and usually promote methanol degradation.
In this context, supercritical DMTM conducted in supercritical water (SCW) emerges as an alternative to the DMTM reaction. In supercritical DMTM, the properties of the reaction medium (supercritical solvent properties) can be adjusted by manipulating the pressure and temperature [24]. Supercritical water (SCW) (P > 22.12 MPa, T > 374.3 °C) is an effective supercritical DMTM solvent since it readily dissolves the formed methanol, stabilizing it and preventing further oxidation perpetrated by the gaseous air, i.e., creating a special reaction medium [25]. Savage et al. [24] investigated DMTM-SCW’s feasibility (T = −481 °C) and obtained methane conversion of up to 6%, oxygen conversion of up to 100% and methanol selectivity ranging from 4 to 75%. The authors noted that the highest selectivity occurred at lower conversion rates. Lee and Foster [26] investigated DMTM in supercritical water (DMTM-SCW) using an isothermal laminar reactor at 250 bar, at varying temperatures in the 400–450 °C range. The authors showed that methane was oxidized mainly to CO, CO2 and methanol, wherein the highest methanol selectivity reached ≈35% for 1–3% methane conversion at 400–410 °C. The authors also detected the small formation of hydrogen and attributed it to the water–gas shift reaction. Regarding the operational difficulties brought by supercritical DMTM, they are obviously the high pressure and temperature [25], but these conditions would be also encountered in the case of methanol production through the conventional NG reforming and synthesis gas conversion route [25], which, in fact, is a much more complex and expensive process. Moreover, NG production and NG processing on oil-and-gas offshore rigs are essentially characterized by high pressure (e.g., membrane skids operating at 70 bar or higher, gas lift injection lines at pressures around 200 bar or higher, CO2 injection lines at 400 bar or higher, water injection lines above 200 bar, etc.). Thus, particularly high pressures are not a major concern on deep-water gas-and-oil offshore rigs. It is reasonable to suppose that these severe conditions of supercritical DMTM are not especially problematic in the offshore rig context. Moreover, the proposed supercritical DMTM is a once-through version with a short-residence-time reactor, to avoid methanol selectivity losses through parasitic oxidations, i.e., supercritical DMTM does not prescribe a recycle loop around the small DMTM reactor, in spite of the low methane conversion. This fact considerably simplifies the process because high-pressure recycle compressors, pumps, intercoolers, knock-out vessels, several heat exchangers and complex large reactors are eliminated. Lastly, the high pressure and high temperature investment of supercritical DMTM is somewhat recovered via power generation through adiabatic expanders after the DMTM.

1.3. The Present Work

The present work proposes supercritical DMTM insertion upstream of the GTW without DMTM recycling. The intention here is to evaluate the conversion of a part of the CO2-rich NG into valuable methanol products before burning the rest of the NG in the GTW. The supercritical DMTM route is chosen due to its high selectivity to methanol and the non-requirement for another chemical solvent, and water is a safe and inexpensive raw material whose reposition is not necessary. Offshore DMTM-SCW coupled to GTW employing EGR, CCS and CDU configures a new processing route for CO2-rich NG available at remote offshore locations. This new route is denoted here by DMTM-GTW-CCU. There is a clear literature gap concerning DMTM-GTW-CCU with DMTM-SCW. To fill this gap, the present work designs and investigates—via techno-economic and thermodynamic (Second Law) analyses—an innovative conceptual offshore DMTM-GTW-CCU with DMTM-SCW and explores its peculiarities.

2. Methods

Offshore DMTM-GTW-CCU fed with CO2-rich NG exports methanol and power and dispatches CO2-to-EOR. The DMTM-GTW-CCU system was designed and simulated in Aspen-HYSYS for technical, economic and thermodynamic evaluations. The necessary theoretical frameworks are discussed in this section.

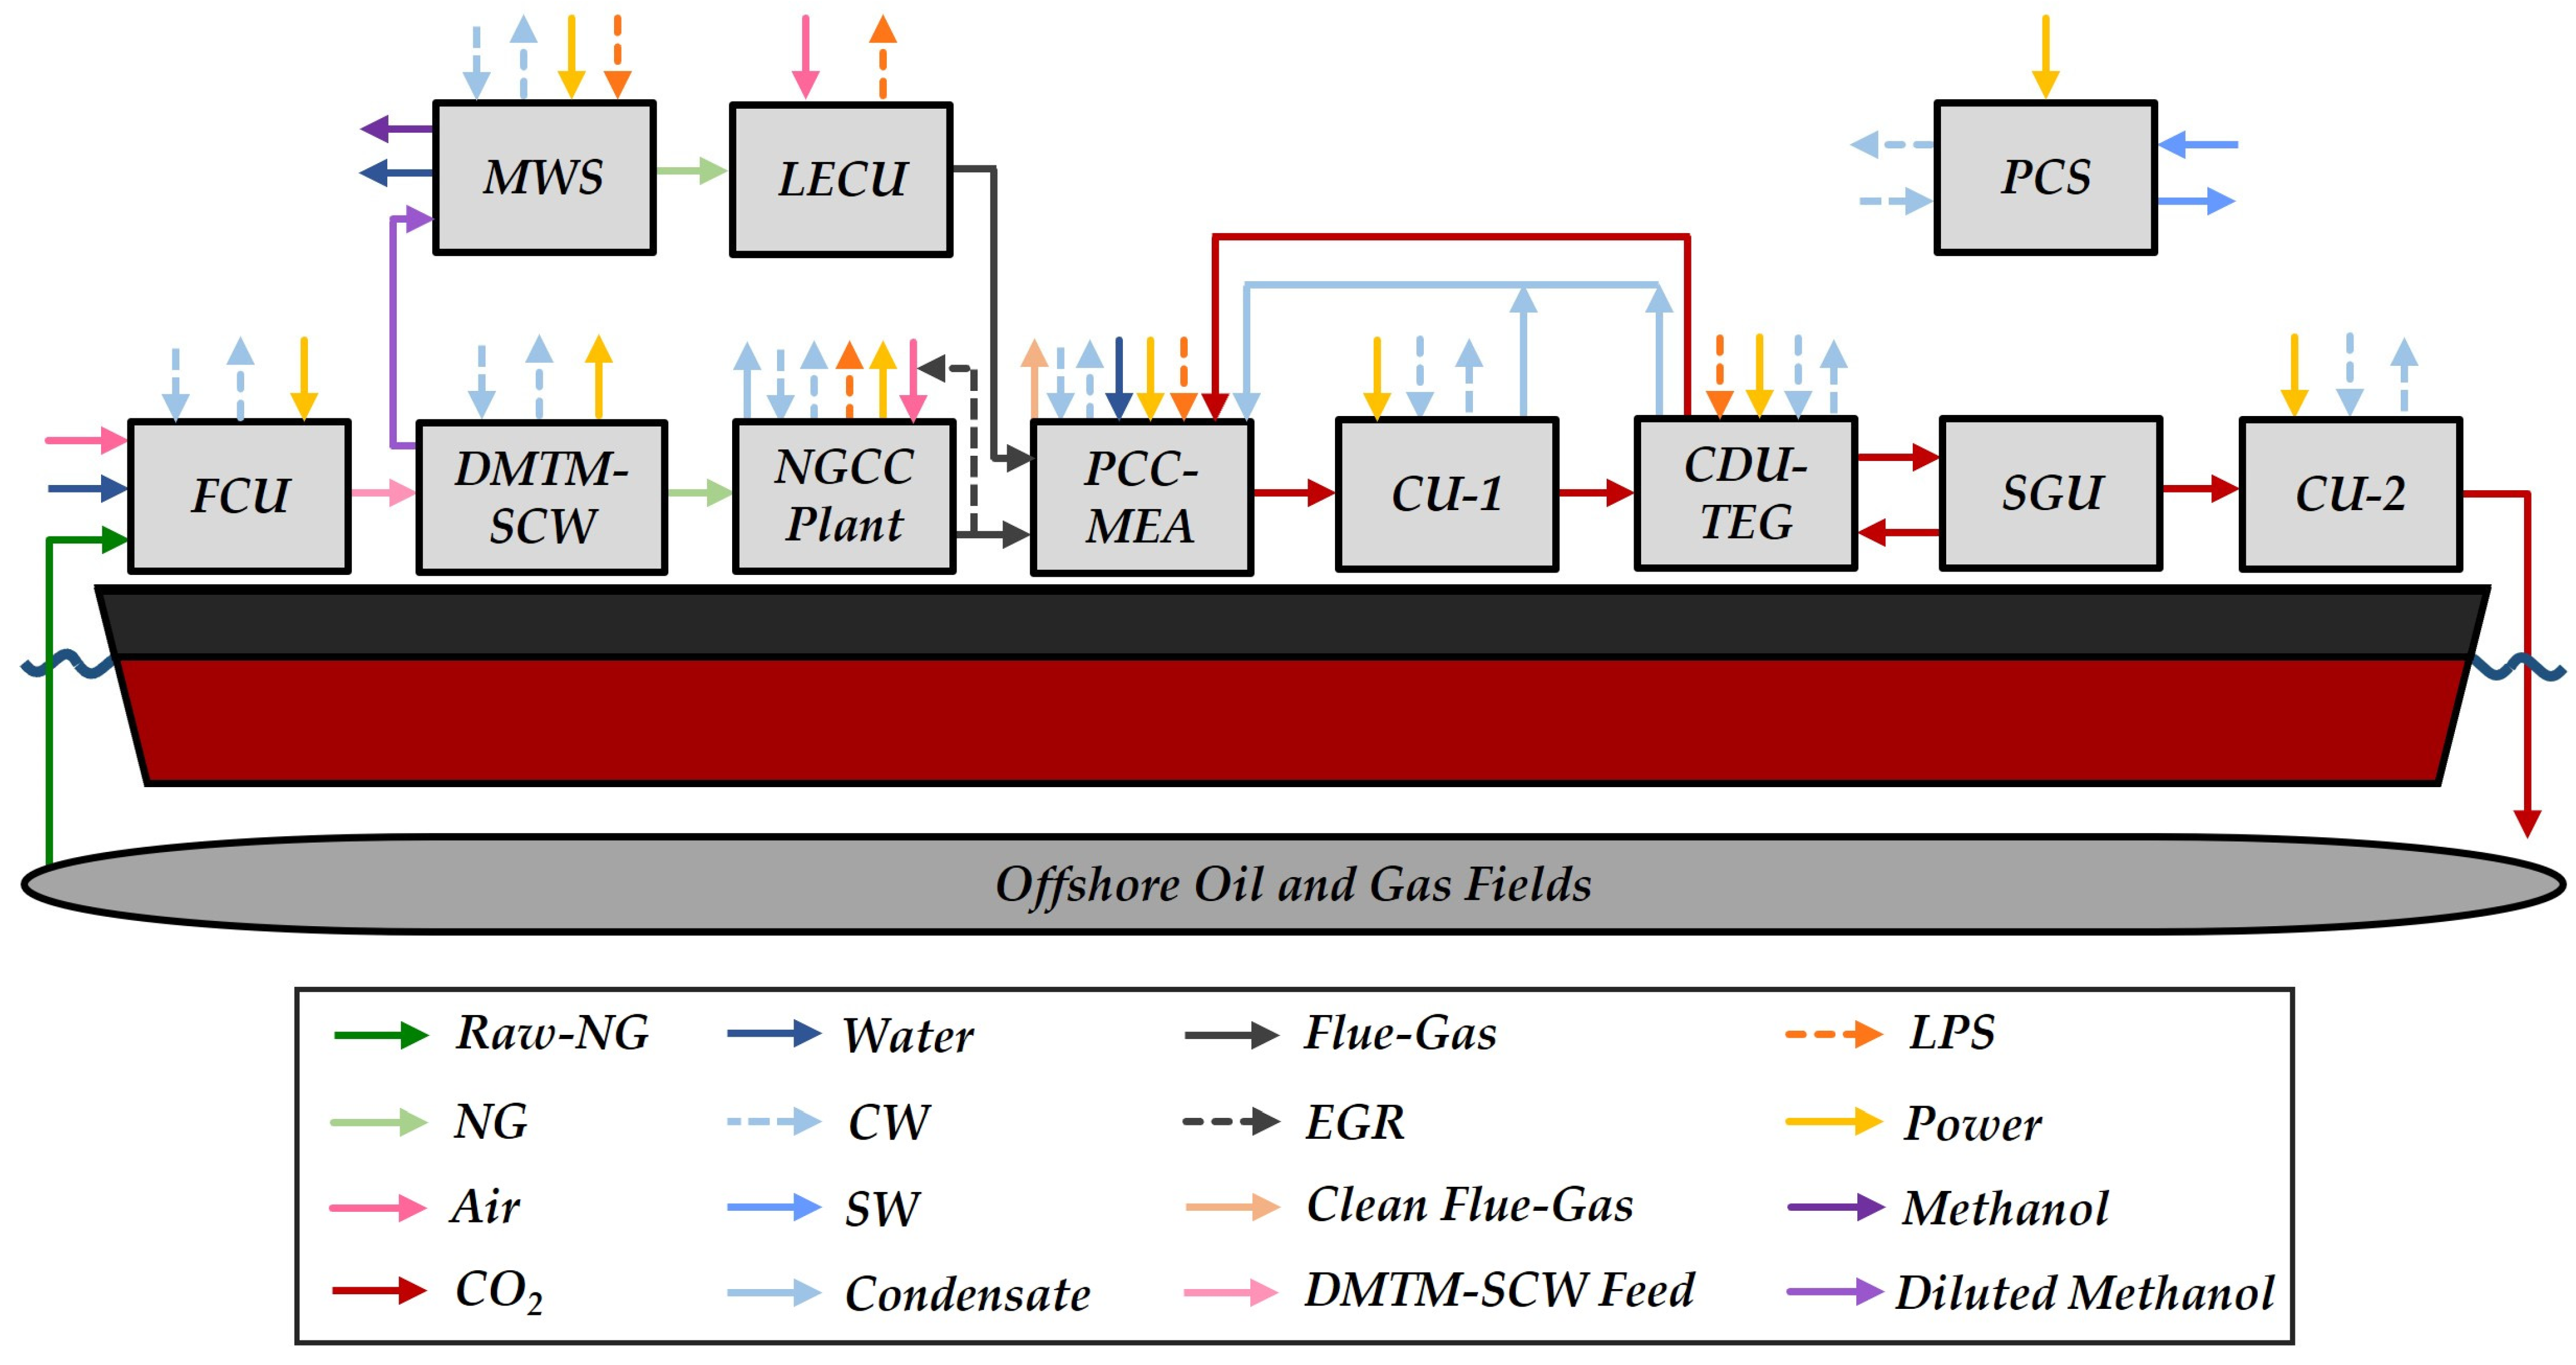
2.1. Process Structure

Figure 1 displays a block diagram defining the DMTM-GTW-CCU sub-systems, while Table 1 depicts the simulation and design assumptions. The skeleton of the medium-capacity (≈450 MW) offshore DMTM-GTW-CCU comprises (i) a feed compression unit (FCU) to achieve DMTM at a supercritical water (DMTM-SCW) reactor pressure; (ii) the DMTM-SCW reactor; (iii) methanol–water separation (MWS); (iv) a light-ends combustion unit (LECU) that fires light residual hydrocarbons (methane, ethane and propane) from MWS; (v) the NGCC plant; (vi) low-pressure PCC-MEA for CO2 capture; (vii) the first CO2 compression unit (CU-1); (viii) CO2 dehydration via high-pressure absorption with triethylene glycol (TEG) for water removal from the CO2-to-EOR stream (CDU-TEG); (ix) a stripping gas unit (SGU) that adjusts the stripping gas to the CDU-TEG reboiler; (x) the second CO2 compression unit (CU-2) that addresses CO2-to-EOR; (xi) the EGR structure; and (xii) a primary cooling system (PCS).

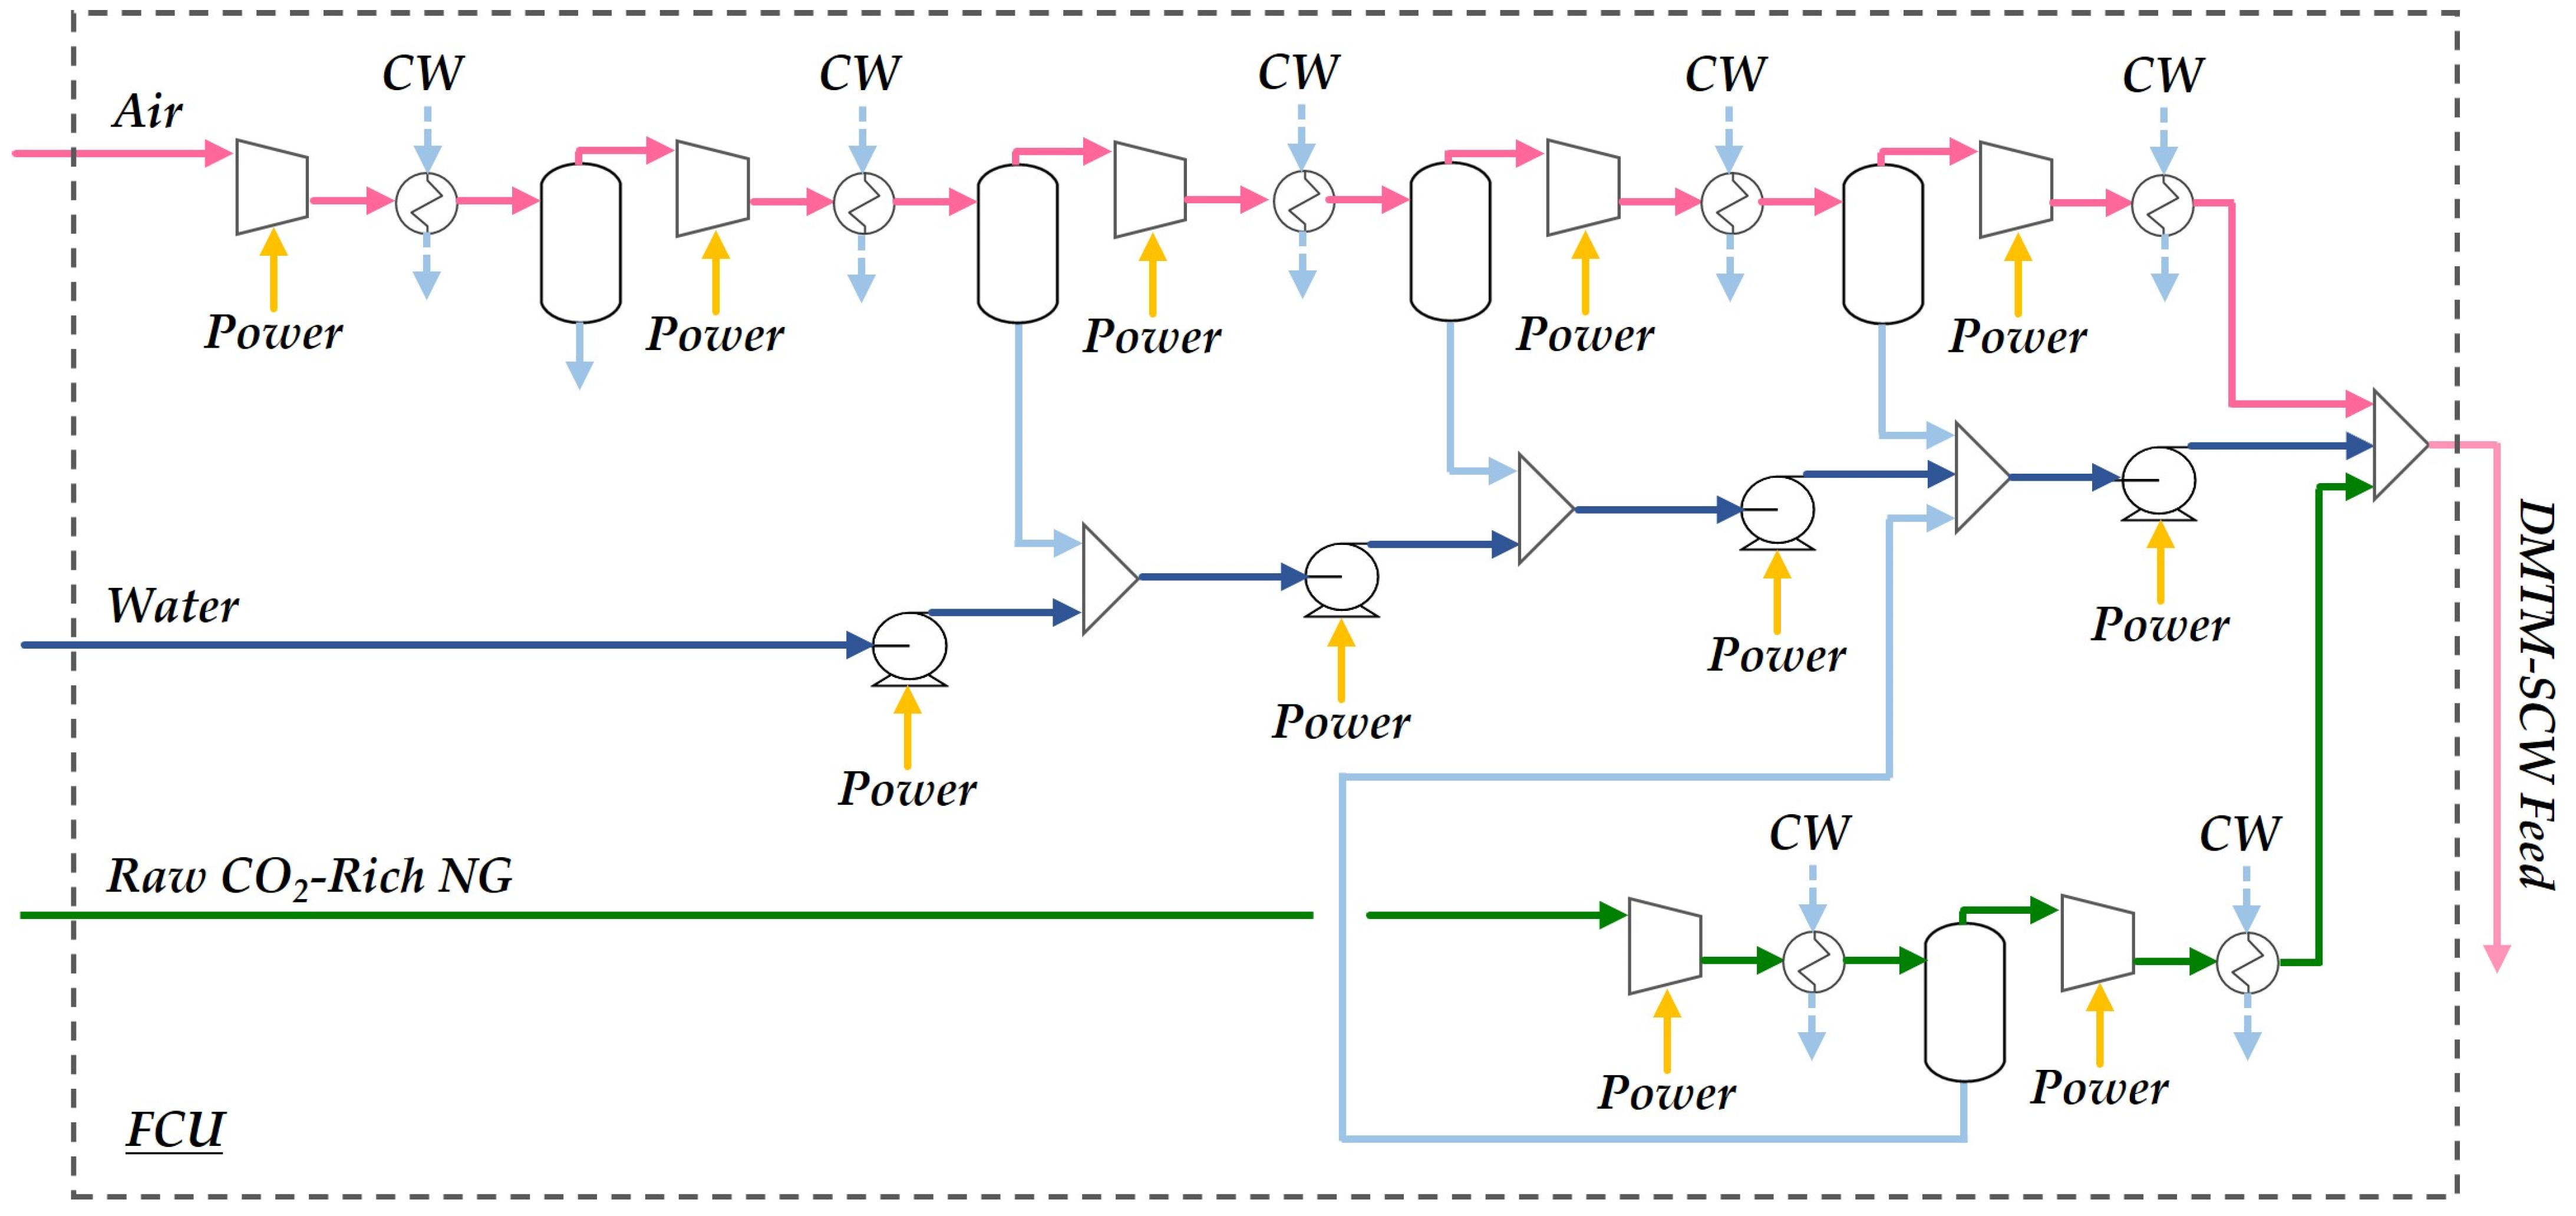
2.1.1. Feed Compression Unit

The supercritical DMTM step proposed in this research is an adaptation of the experiment carried out by Lee and Foster [26], which uses, in addition to water, raw CO2-rich NG (CH4 = 49.82%mol) and air (O2 = 20.60%mol), as feeds, instead of pure CH4 and O2, respectively. The reactant streams (Figure 2) need to pass through compression trains (compressors with stage compression ratio ≈ 3 and pumps with stage compression ratio = 4) to reach the DMTM-SCW reaction pressure (P = 250 bar). The aqueous condensates generated by air and NG compression are mixed, according to their pressure, in the water compression train.

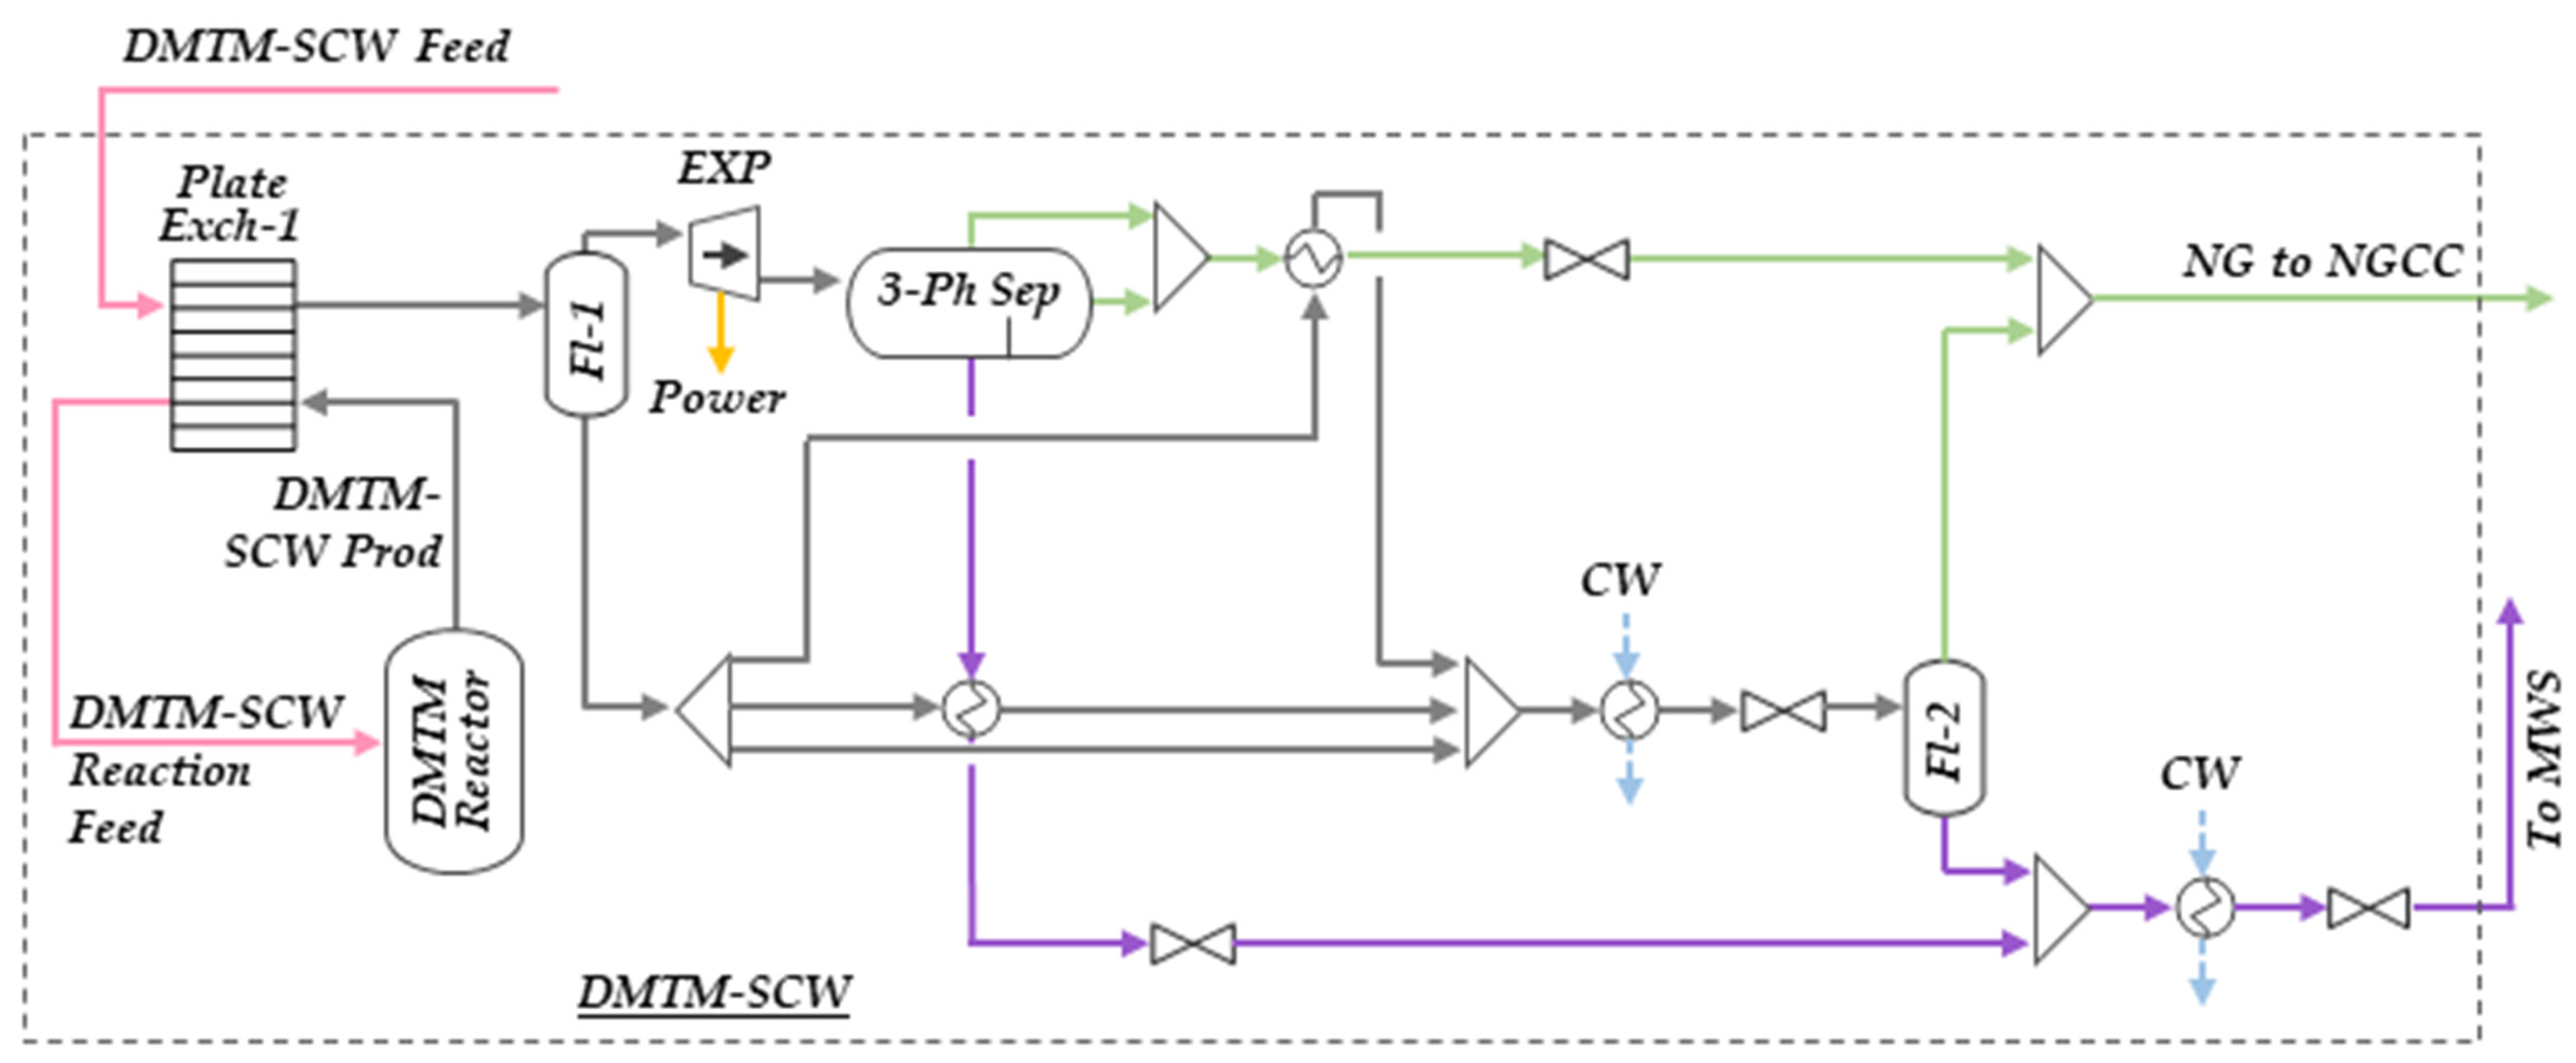
2.1.2. Direct Methane-to-Methanol in Supercritical Water (DMTM-SCW)

The high-pressure stream that leaves the FCU (T = 31.4 °C, P = 250 bar) is heated with the reactor product stream (T = 410 °C) in a plate exchanger (Plate Exch-1). To simulate the DMTM-SCW reaction in Aspen-HYSYS, an adiabatic conversion reactor was used (O2Conv = 100%, CH4Conv = 4.5%), considering CO, CO2 and methanol as products and using 50%, 22% and 28% for their selectivities, respectively [26]. After the reactor (Figure 3), the cooled product stream passes through a flash separator (Fl-1), where the generated gas stream is first sent to an expander (EXP), reducing its temperature and pressure (T = 11.6 °C, P = 35 bar) while generating power, and subsequently to a three-phase separator, which separates the gas, liquid hydrocarbon and aqueous phases. The Fl-1 liquid stream (T = 410 °C, P = 250 bar) heats the streams leaving the three-phase separator and, after being cooled and having its pressure reduced (T = 70.2 °C, P = 25 bar), passes to another flash separator (Fl-2). The Fl-2 gas stream mixes with the other gas and hydrocarbon streams, forming the fuel gas that feeds the NGCC, and the Fl-2 liquid stream mixes with the aqueous stream and is sent to the methanol–water separation system (MWS).
The Peng–Robinson–Twu equation of state was selected in sub-systems that operate with the supercritical phase (FCU and DMTM-SCW) due to the fact that this equation of state guarantees adequate thermophysical property calculations in the supercritical region and the suitable calculation of VLE in multicomponent systems containing polar species such as water and methanol [27,28].

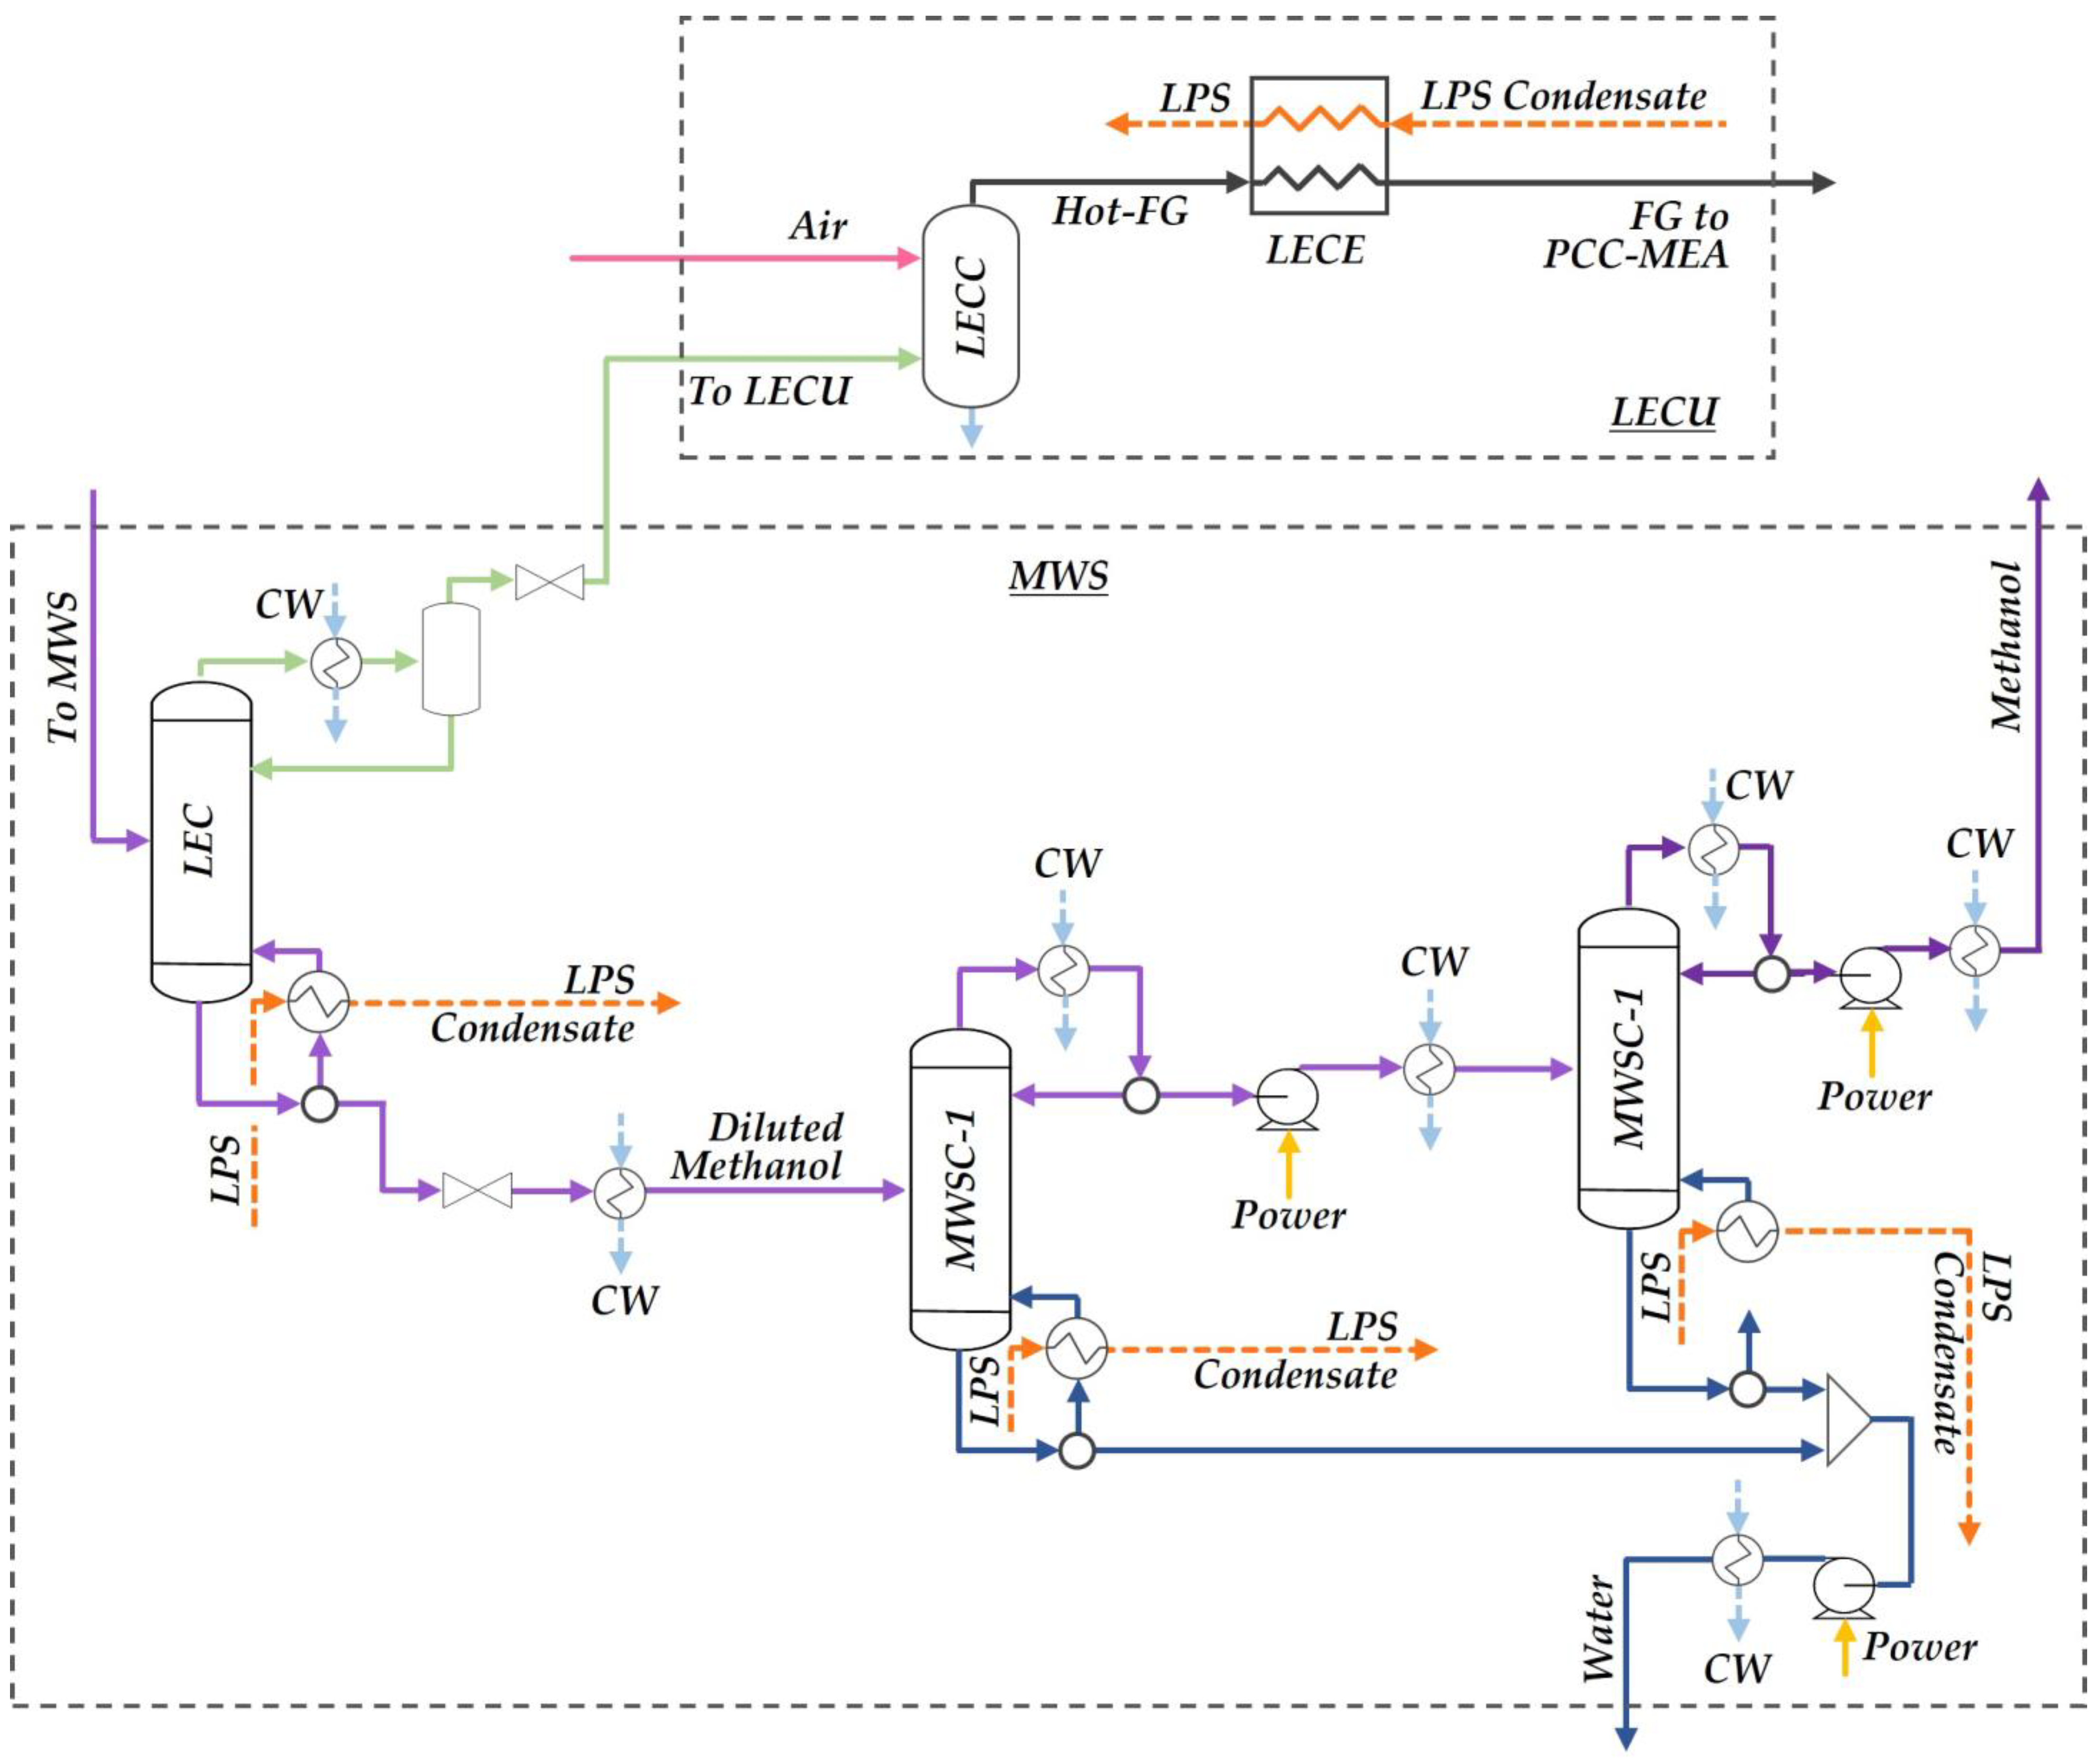
2.1.3. Methanol–Water Separation and Light-Ends Combustion

As shown in Figure 4, MWS is composed of three distillation columns: (i) the light-ends column (LEC), (ii) methanol–water separation column 1 (MWSC-1) and (iii) methanol–water separation column 2 (MWSC-2). The LEC is a 20-staged column (P = 7 bar) and aims to remove nitrogen, hydrogen, CO, CO2 and light hydrocarbons (methane, ethane and propane) from the methanol–water mixture. The LEC top stream current (T = 35 °C) is sent to the light-ends combustion chamber (LECC), generating a hot flue gas (FG) (T = 425.6 °C) that produces LPS (TLPS = 154.6 °C, PLPS = 5.4 bar) in the light-ends combustion exchanger (LECE). The cooled flue gas (T = 40 °C) that leaves the LECE is sent to PCC-MEA. A combustion chamber is modeled as an adiabatic conversion reactor in Aspen-HYSYS.
MWSC-1 is a 20-staged column (P = 1.013 bar) that receives the LEC bottom stream and aims to concentrate the methanol. The MWSC-1 top stream is directed to MWSC-2 (20 stages, P = 1.013 bar), which has the function of reaching Grade AA methanol purity (99.85%w/w) [30]. Pure water is produced in the MWSC-1 and MWSC-2 bottom streams. All columns require LPS (TLPS = 154.6 °C, PLPS = 5.4 bar) to heat their reboilers.

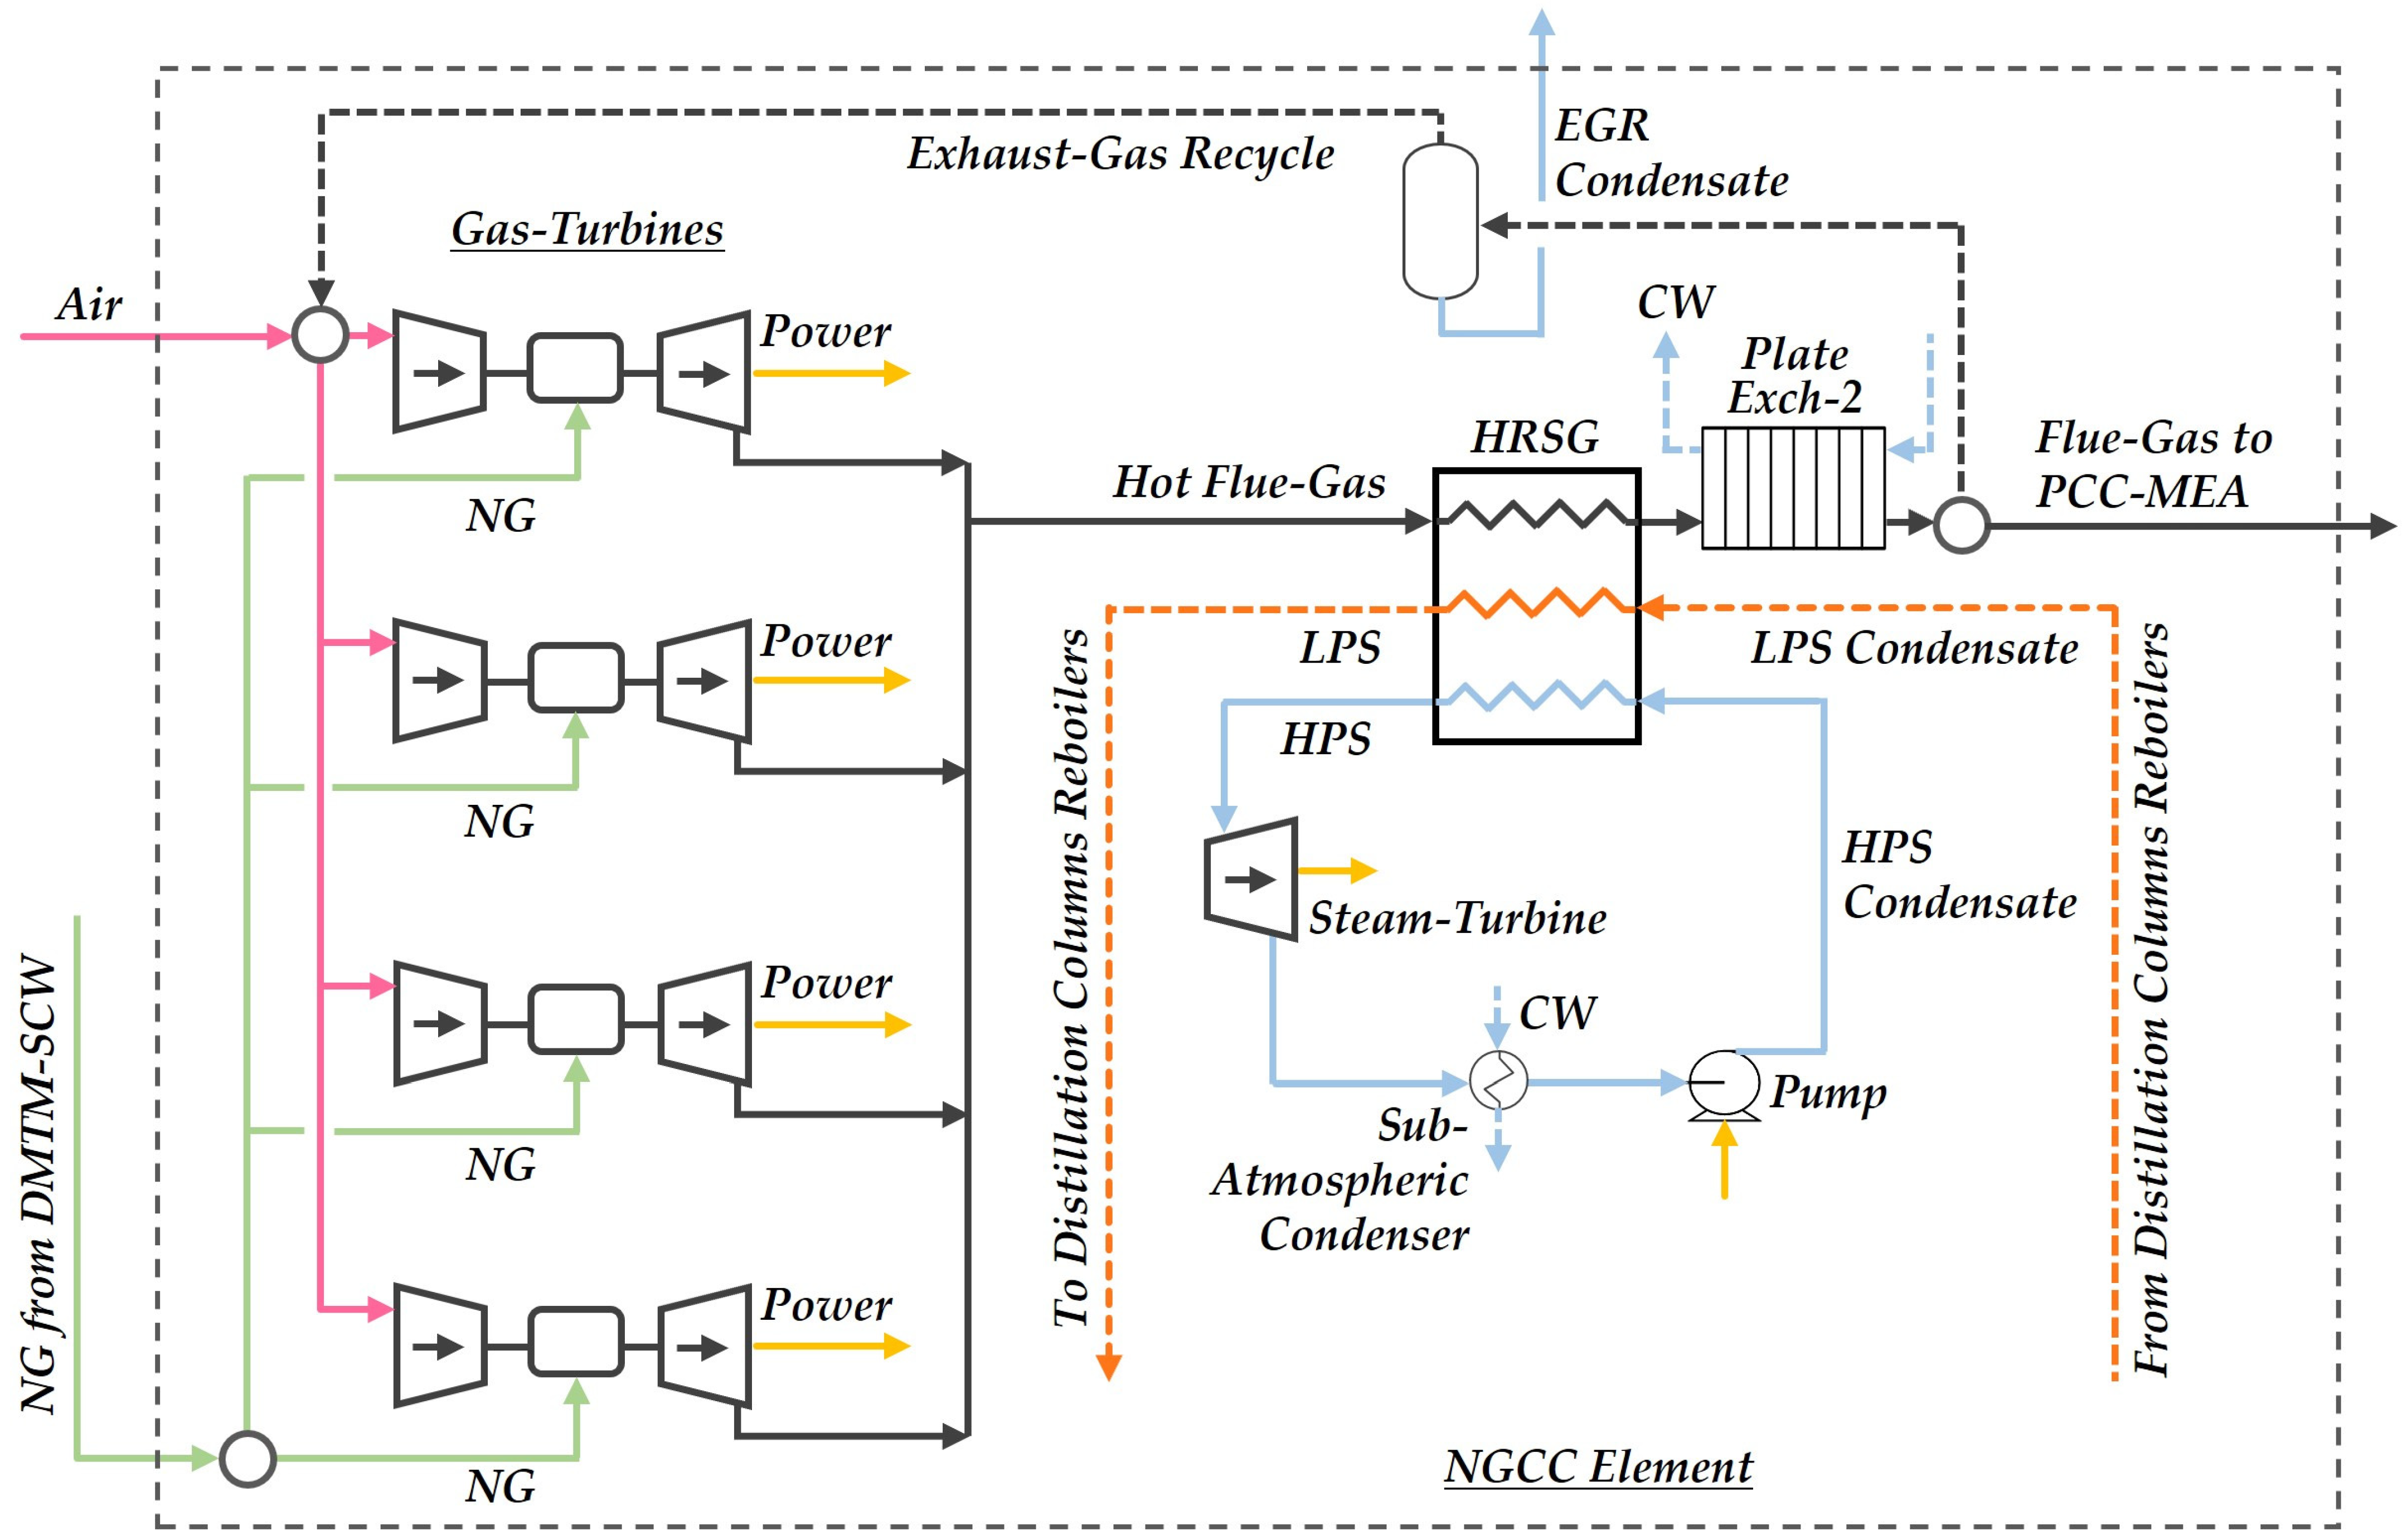
2.1.4. Natural Gas Combined Cycle Plant

The NGCC plant contains four parallel NGCC elements for suitable electricity generation (≈550 MW). Each NGCC element (Figure 5) consists of four gas turbines sending hot flue gas to one heat recovery steam generator (HRSG), which heats a steam Rankine cycle. Compared with a gas turbine simple cycle, the combined cycle substantially lowers the ratio of CO2 emitted per MWh generated [33]. Gas turbines of the aero-derivative type (Table 1) are more appropriate in offshore rigs thanks to their lower weight-to-power [34] and footprint-to-power ratios [35], besides enhanced crew safety and simple maintainability [36]. Gas turbines directly burn raw CO2-rich NG (CO2 > 40%mol), producing a flue gas (FG) that feeds the HRSG at T = 484 °C [32], where low-pressure steam (LPS) (TLPS = 154.6 °C, PLPS = 5.4 bar) and high-pressure superheated steam (HPS) (THPS = 459 °C, PHPS = 24 bar) are produced from liquid water at the respective pressures. HPS expands in the steam turbine to P = 0.12 bar and is cooled down in the sub-atmospheric condenser with cooling water (CW), recycled as a condensate to HRSG at T = 45 °C. The HRSG- and LECE-produced LPS heats the MWS, PCC-MEA and CDU-TEG reboilers. Hence, the Rankine cycle power is restrained by the LPS demand.
The gas turbine model in Aspen-HYSYS includes (i) an adiabatic single-stage air compressor; (ii) a combustion chamber modeled as an adiabatic conversion reactor; and (iii) an adiabatic expander. This model was calibrated to factory settings by manipulating the adiabatic efficiencies of the air compressor and expander. Air is supplied at stoichiometric proportions for complete NG combustion. To limit the combustion temperature to manufactory constraints, stoichiometric air is mixed with the EGR stream. Recycled flue gas is extracted after Plate Exchanger 2 (T = 40 °C) and its flow rate is adjusted to match the recommended flue gas temperature at the expander outlet (T = 484 °C).

2.1.5. Post-Combustion Capture with Aqueous MEA

The flue gas (FG) (T = 40 °C) that leaves Plate Exchanger 2 from the four NGCC elements is connected to the flue gas (FG) from the LECE (T = 40 °C) and both are sent to the PCC-MEA for decarbonation with aqueous MEA (MEA ≈ 30%w/w). The flue gas feed is distributed in the PCC-MEA absorber through four plates (Figure 6) for better overall mass transfer [37]. The PCC-MEA is designed to abate 90% of the CO2 in the flue gas. Two parameters that define the solvent recirculation and stripper duty are critical in PCC-MEA design: (i) the capture ratio (CR—kg of fresh solvent per kg of captured CO2) and (ii) the stripper heat ratio (HR—kJ per kg of captured CO2). Ideal values for the CR (10–15 kgSolvent/kgCO2) and HR (2000–4500 MJ/tCO2) are reported by Araújo et al. [38].
The atmospheric PCC-MEA stripper (Figure 6) demands LPS (TLPS = 154.6 °C, PLPS = 5.4 bar) to heat the reboiler (T = 102.6 °C). The stripper condenser operates in total reflux (i.e., 100% condensate reflux) and releases water-saturated CO2 (P = 1 atm) through its vent. In order to keep CO2 restricted within the CO2 loop between the PCC-MEA and CDU-TEG units, all condensed carbonated waters (T = 35 °C) from the CU-1 knock-out vessels and from the TEG stripper condenser (T = 35 °C) are recycled to PCC-MEA stripper tray #1, while wet CO2 from the TEG stripper condenser vent (T = 35 °C) is recycled to tray #10. This water recycling lowers the water make-up and condenser heat duty and avoids fugitive liberations of CO2 from the CU-1 and CDU-TEG units. Lean MEA is recycled to the PCC-MEA absorber through a pump after the addition of water and MEA make-ups.

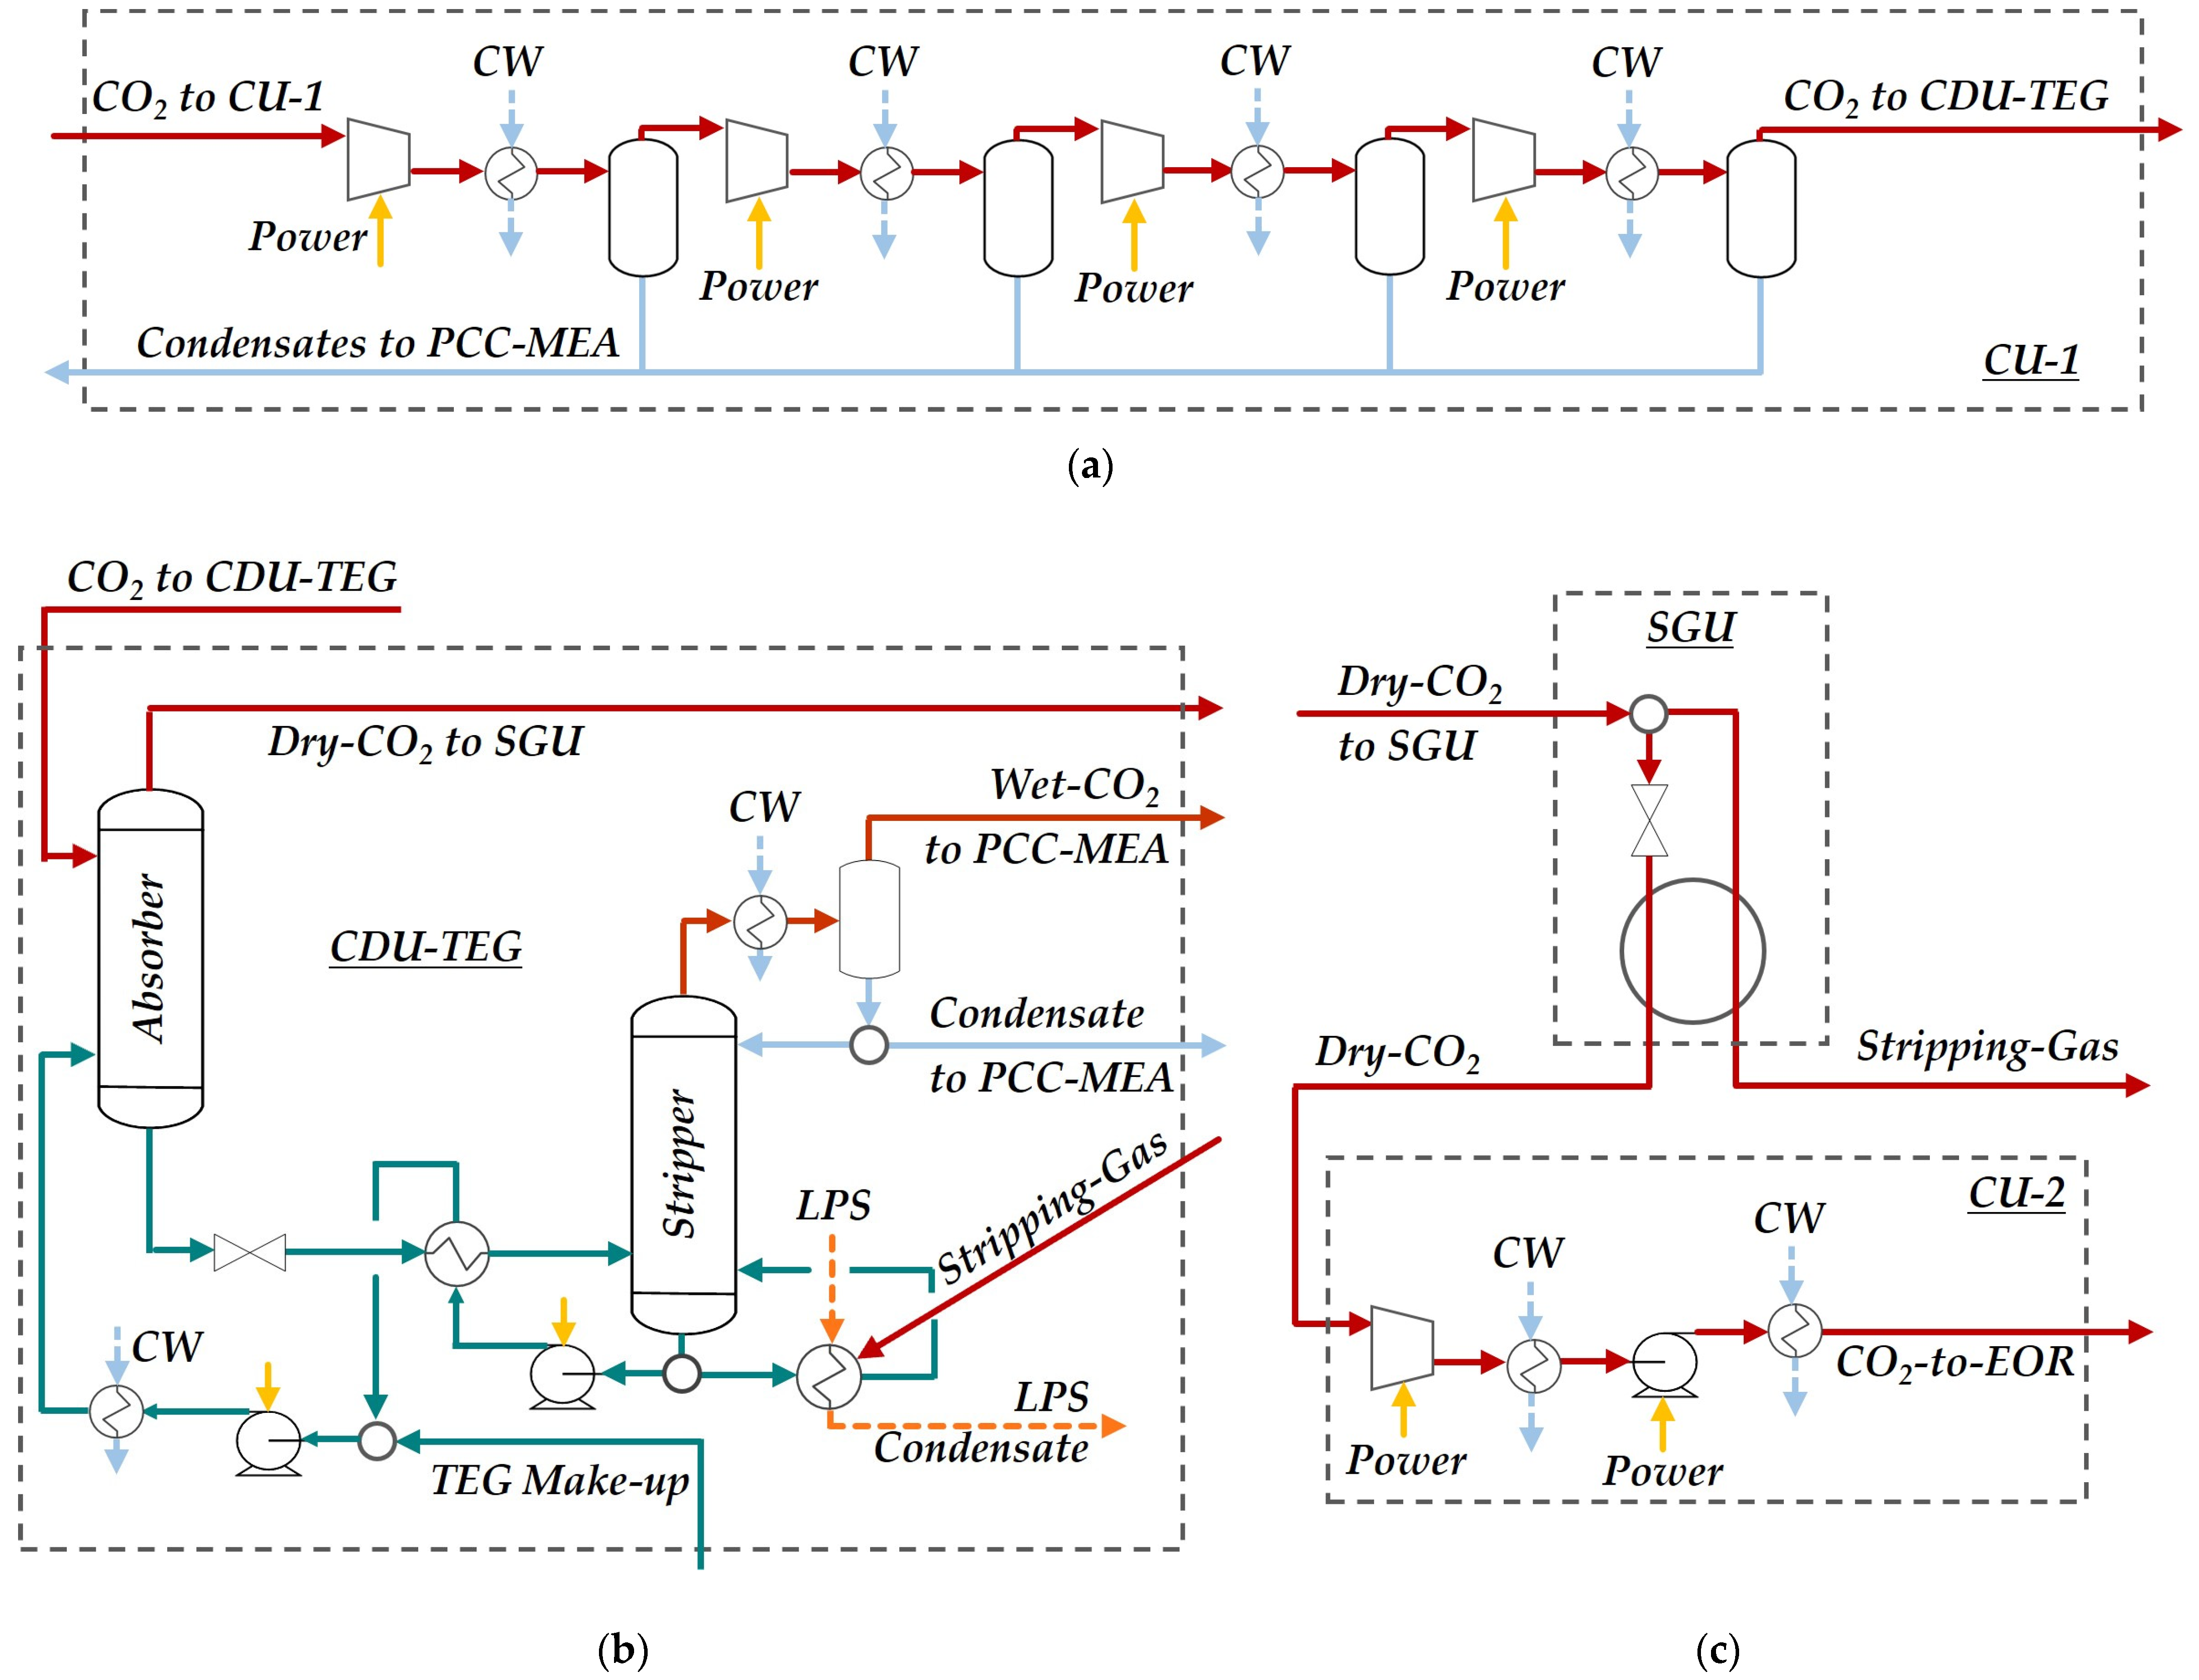
2.1.6. CO2 Compression Units, CO2 Dehydration Unit and Stripping Gas Unit

CU-1 (Figure 7a) is a four-staged intercooled compression train (stage compression ratio ≈ 3) to raise the CO2 stream pressure up to 50 bar for CO2 dehydration, favoring water removal [39]. The CO2 to CDU-TEG stream (≈2730 ppm-mol H2O) and TEG solvent (98.5%w/w TEG) feed the 15-staged TEG absorber (Figure 7b), producing dry CO2 (≈160 ppm-mol H2O) for the SGU unit as the top product and rich TEG (H2O ≈ 55%mol) as the bottom product. The TEG solvent is regenerated in the 10-staged TEG stripper, which produces lean TEG as the bottom product (T = 138.9 °C) and vapor wet CO2 and carbonated liquid water as top distillate products in the partial condenser. Both the water and wet CO2 distillates are recycled to the PCC-MEA, blocking CO2 emissions. The SGU is a small-scale unit that adjusts the stripping gas (1.5% of dry CO2) in order to control the TEG stripper reboiler temperature below 140 °C [31]. These two dry CO2 streams feed a countercurrent heat exchanger (Figure 7c), granting a slight temperature reduction (≈0.5 °C) in the EOR-CO2 stream. The remaining dry CO2 is sent to CU-2 (Figure 7c) to achieve the EOR pipeline pressure (P = 300 bar).

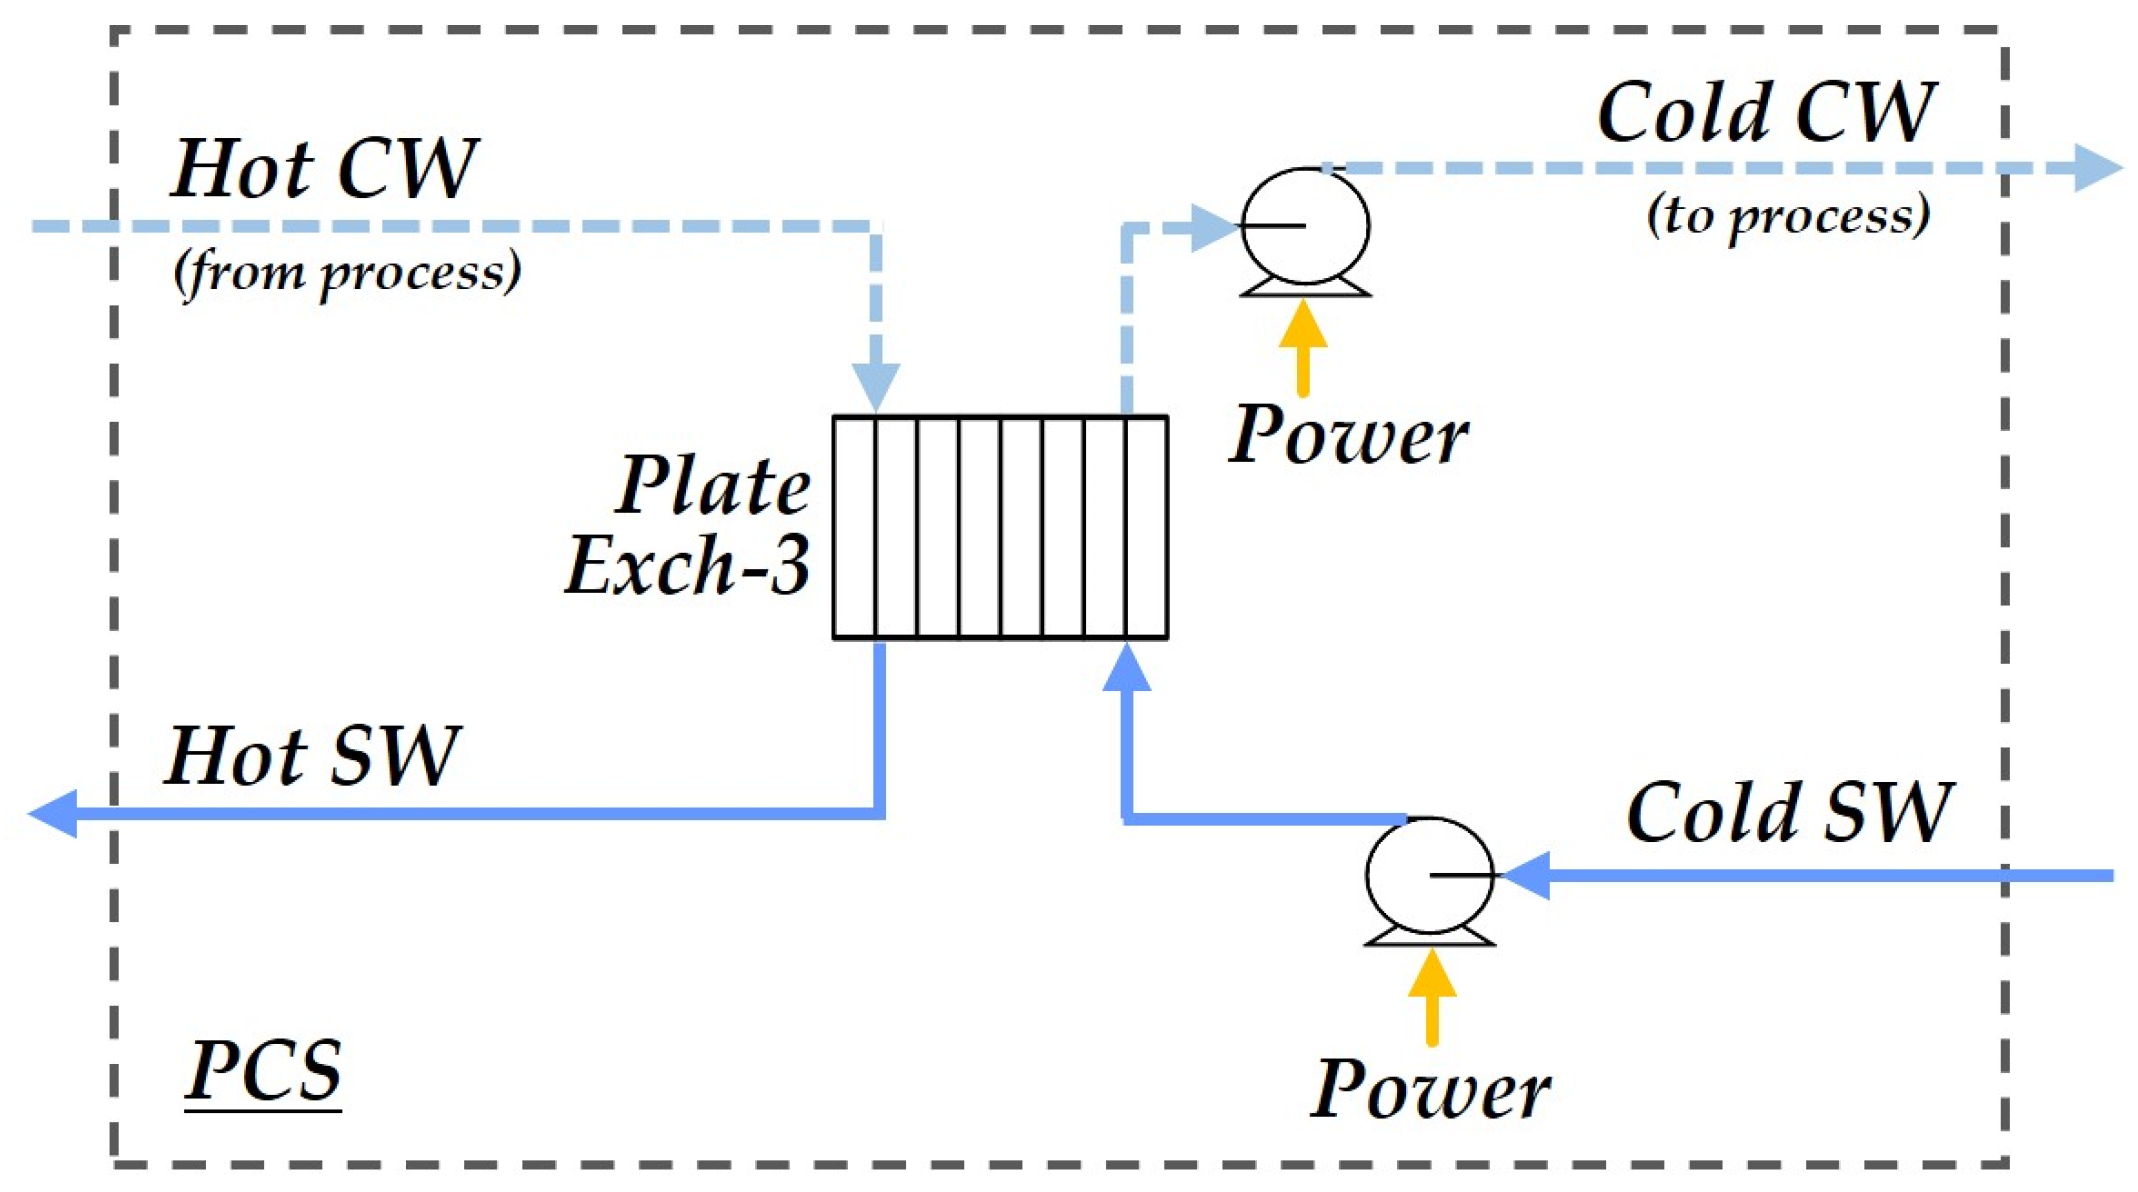
2.1.7. Primary Cooling System

Figure 8 exhibits the primary cooling system (PCS) that regenerates cold CW (T = 30 °C) by cooling down hot CW (T = 45 °C) from the intercoolers, condensers and Plate Exchanger 2 (NGCC). Sea water (SW) is the cooling medium and it is collected from the sea surface at tropical latitudes (T = 25 °C) and returns to the sea at T = 35 °C. After this heat exchange carried out through Plate Exchanger 3, cold CW (T = 30 °C) is pumped back to be processed (P = 4 bar).

2.2. Process Economic Analysis

The economic analysis of DMTM-GTW-CCU was performed via Turton et al. [40] to calculate the (i) fixed capital investment FCI (MMUSD); (ii) cost of manufacturing COM (MMUSD/y); (iii) revenues REV (MMUSD/y); (iv) gross annual profit GAP (MMUSD/y) and annual profit AP (MMUSD/y); and (v) net present value NPV (MMUSD). FCI (MMUSD) was estimated via Equation (1) through the bare module costs (CBM) determined from the reference purchase costs, which are updated with the CEPCI Chemical Engineering Plant Cost Index (CEPCI = 816, for 2022 [41]). CBM was calculated via the Six-Tenth Rule (Equation (2)) for equipment capacities above/below correlation limits using the equipment capacity (CAP) at limiting and design conditions. The data used for FCI calculation can be found in Table S1 in the Supplementary Materials file. CUT (MMUSD/y) represents the cost of utilities given by Equation (3) and COM (MMUSD/y) is calculated through Equation (4), where COL (MMUSD/y) and CRM (MMUSD/y) stand for the annual costs of labor and raw materials. GAP (MMUSD/y), AP (MMUSD/y) and NPV (MMUSD) are found via Equations (5) and (6), wherein REV (MMUSD/y), DEPR (MMUSD/y), ITR (%), i (%) and N(y), respectively, represent annual revenues, annual depreciation, the income tax rate, the annual interest rate and the project lifetime (Table 2). Offshore DMTM-GTW-CCU revenues include electricity and methanol exportation, besides the increment in oil production from the EOR yield generated by CO2 injection in the reservoir.
F C I = 1.18 j = 1 N E q C B M ( j )
C B M = C B M L i m ( C A P / C A P L i m ) 0.6
C U T = C U T E E + C U T L P S + C U T C W
C O M = 0.18 F C I + 2.73 C O L + 1.23 ( C U T + C R M )
G A P = R E V C O M ; A P = G A P ( G A P D E P R ) I T R / 100 ( D E P R < G A P ) G A P ( D E P R G A P )
N P V = F C I ( 0.4 + 0.6 / q ) + k = 2 N + 2 A P k / q k     ,   q = ( 1 + i / 100 )

2.3. Process Thermodynamic Analysis

Thermodynamic analysis is effective to identify the degradation of resources throughout the process. The steady-state offshore DMTM-GTW-CCU and sub-systems are assessed via an analysis of processes known as the Second Law analysis or thermodynamic analysis. In the Second Law analysis, the overall system and each of its sub-systems have to be previously identified as either a power-producing system or a power-consuming system. Figure 9a displays a steady-state open system for Second Law analysis showing various feed and product streams (arrows). The open system only makes thermal contact with an infinite and isothermal heat reservoir R0 kept at temperature T0. It is important to understand that any system under Second Law analysis (i.e., the overall system or its sub-systems) complies with Figure 9a and is either a power-producing system ( W ˙ > 0 ) or a power-consuming system ( W ˙ < 0 ), but only has heat interactions with R0 via heat absorption ( Q ˙ > 0 ) or via heat rejection ( Q ˙ < 0 ). G n , H ¯ G n , S ¯ G n , respectively, designate the molar flow rate (kmol/s), enthalpy (MJ/kmol) and entropy (MJ/kmol·K) of the nth feed stream (n = 1..Nf). K n , H ¯ K n , S ¯ K n are analogous symbols for the nth product stream (n = 1..Np).

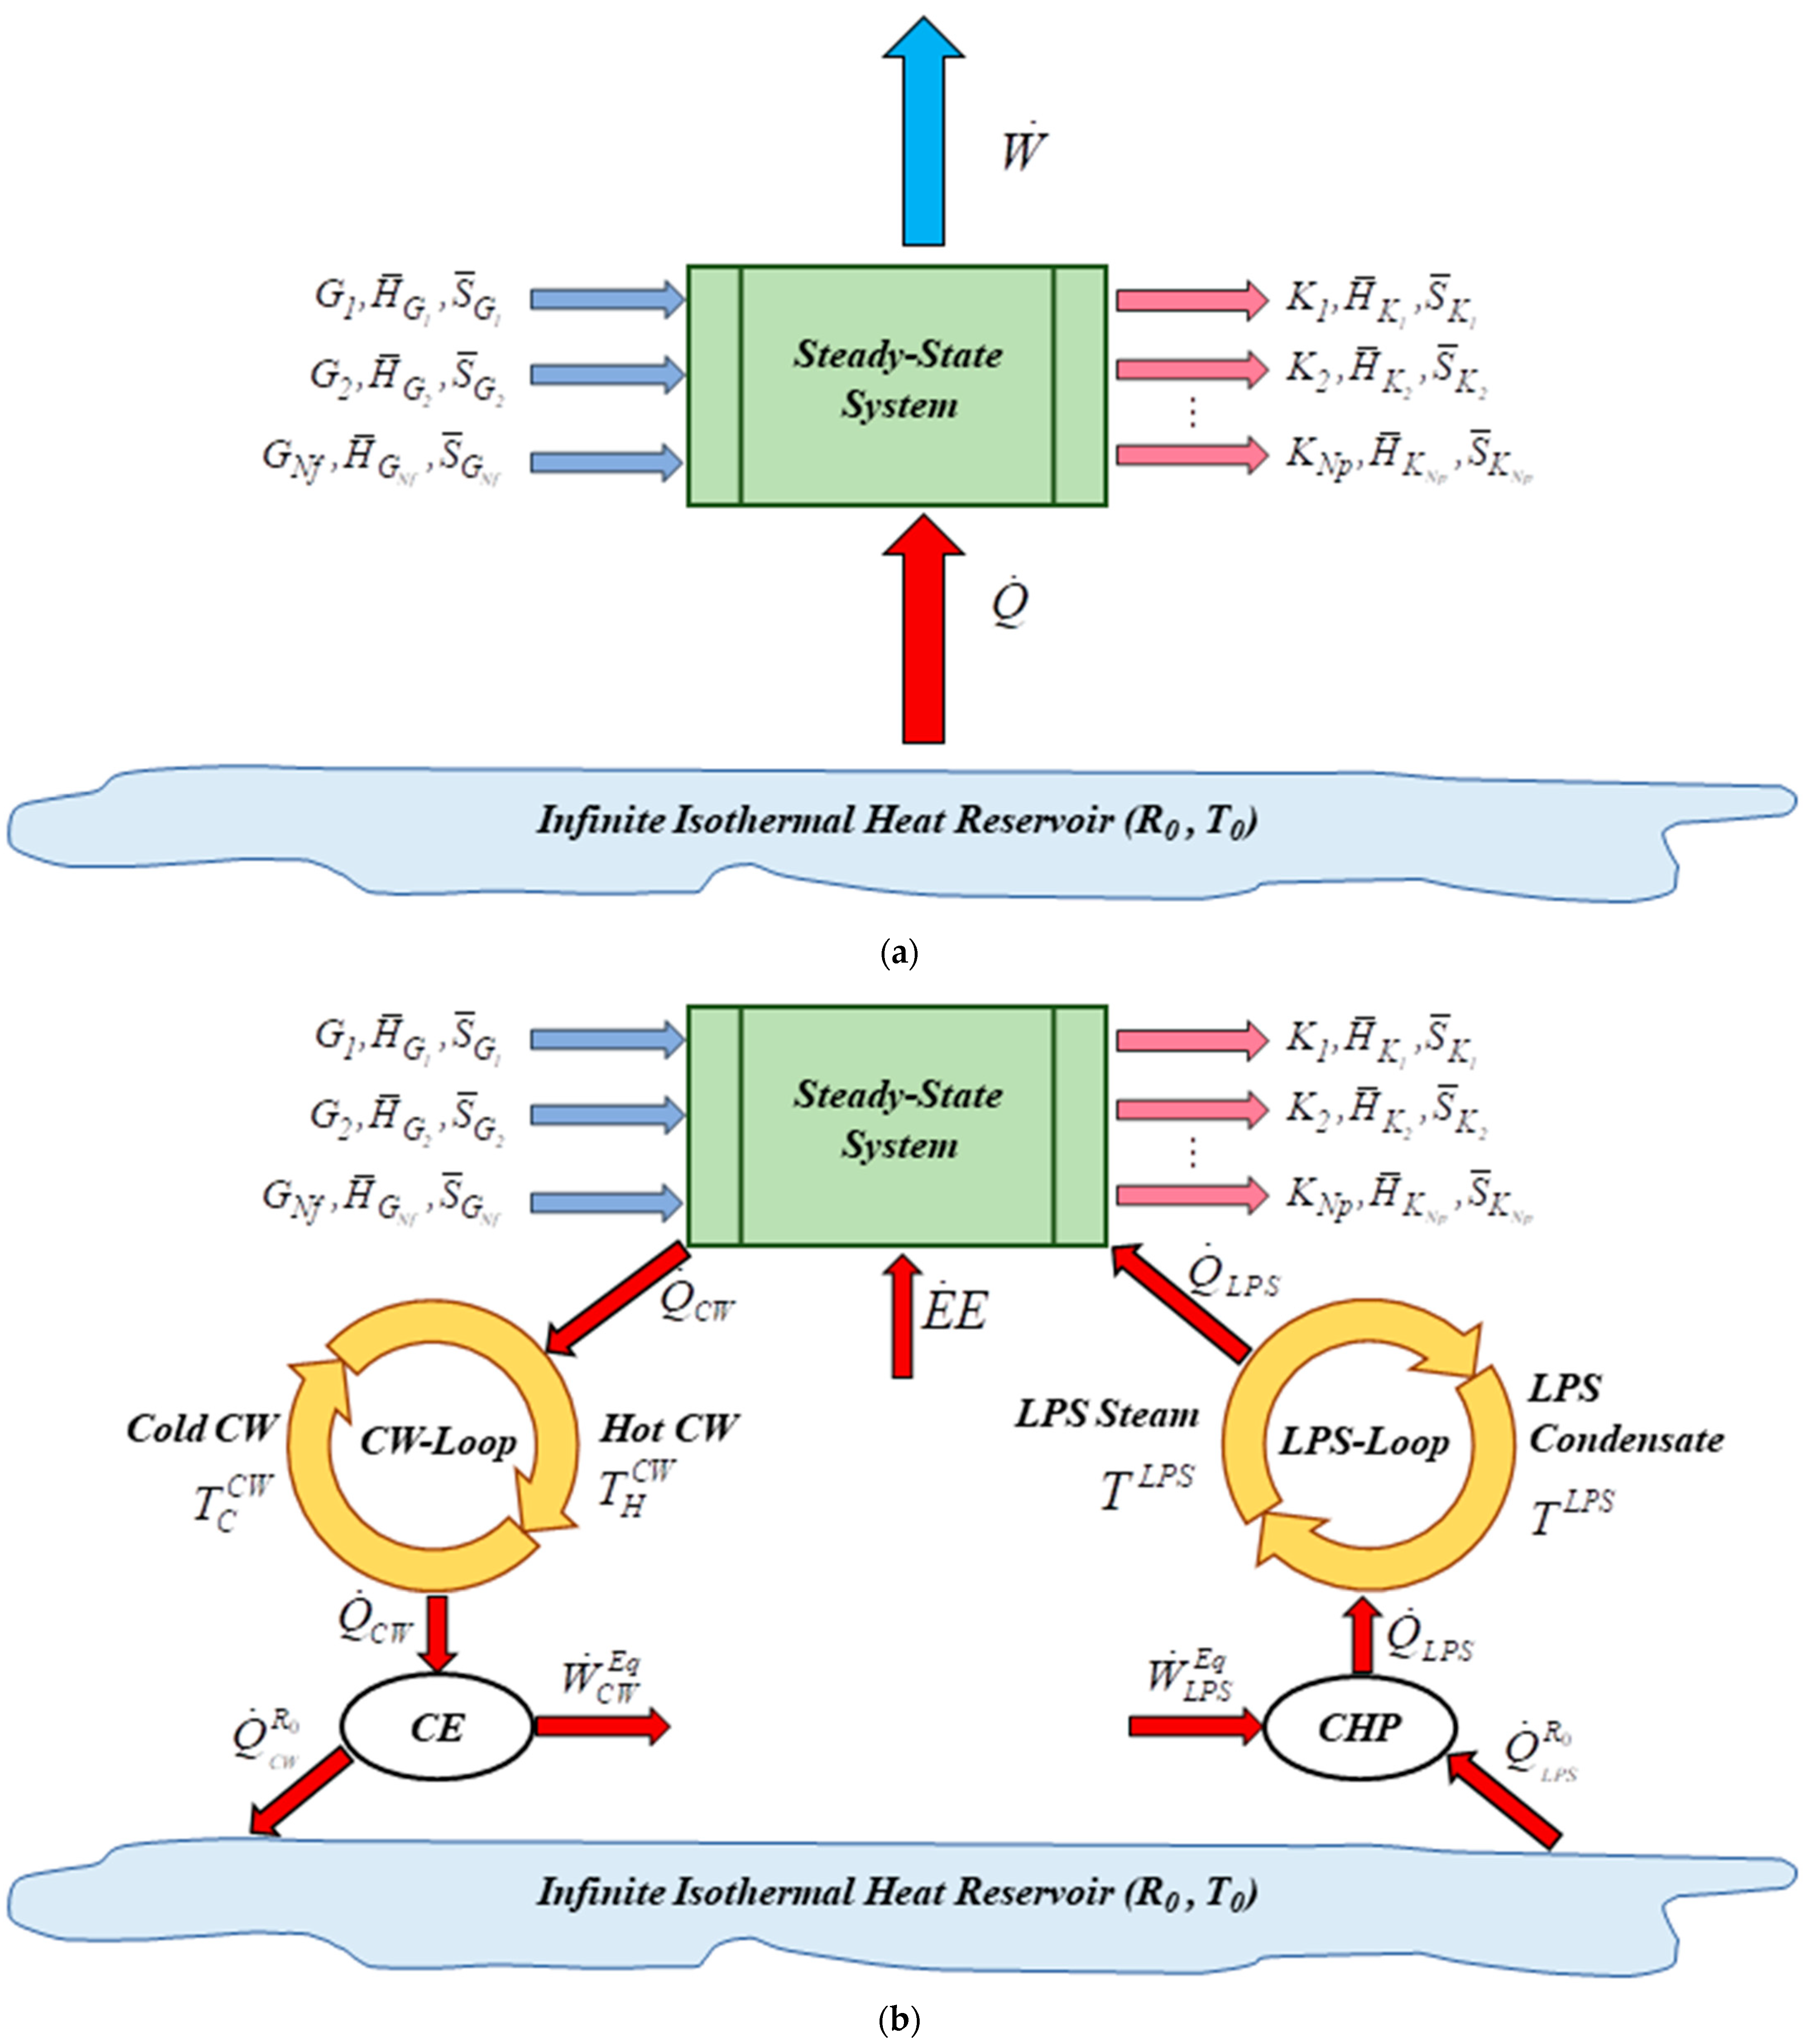
2.3.1. Maximum Power

Equations (7) and (8) implement the First Law of Thermodynamics for the steady-state open system depicted in Figure 9a. The system maximum power (maximum work) W ˙ M A X is calculated via the Second Law at reversibility using Equations (9)–(12). Equation (10) symbolizes the entropy balance of the Universe at reversibility, being S ˙ U N I V R E V the entropy creation rate of the Universe. Equation (11) is obtained from Equation (8) under reversible conditions, and Equation (12) comes from Equation (10). Finally, W ˙ M A X is calculated by means of Equation (13) or Equation (14). For power-producing systems (in general, systems performing spontaneous chemical reactions and/or spontaneous mixing or heat/mass transfers, like the DMTM-SCW, LECU, NGCC plant, SGU and PCS), Equation (14) gives a positive W ˙ M A X , while, for power-consuming systems (in general, non-spontaneous changes provided by compression/pumping systems and separation systems like the FCU, MWS, PCC-MEA, CU-1, CU-2 and CDU-TEG), a negative W ˙ M A X results.
i = 1 N f G i H ¯ G i + Q ˙ W ˙ = i = 1 N p K i H ¯ K i
W ˙ = i = 1 N p K i H ¯ K i i = 1 N f G i H ¯ G i + Q ˙
W ˙ = W ˙ M A X , Q ˙ = Q ˙ R E V
i = 1 N p K i S ¯ K i i = 1 N f G i S ¯ G i Q ˙ R E V T 0 = S ˙ U N I V R E V = 0
W ˙ M A X = i = 1 N p K i H ¯ K i i = 1 N f G i H ¯ G i + Q ˙ R E V
Q ˙ R E V = T 0 i = 1 N p K i S ¯ K i i = 1 N f G i S ¯ G i
W ˙ M A X = i = 1 N p K i H ¯ K i i = 1 N f G i H ¯ G i + T 0 i = 1 N p K i S ¯ K i i = 1 N f G i S ¯ G i
W ˙ M A X = i = 1 N p K i ( H ¯ K i T 0 S ¯ K i ) i = 1 N f G i ( H ¯ G i T 0 S ¯ G i )

2.3.2. Equivalent Power

Equivalent power W ˙ E q represents the thermodynamic power equivalence of electricity production (consumption) and utility production (consumption) [29] and is always positive for regular systems. However, it can be negative for “outlaw” systems, like a theoretically power-producing system (i.e., spontaneous system) that consumes power instead of producing power (e.g., CW tower). For instance, the consumption (production) of LPS is equivalent to the consumption (production) of W ˙ E q , while the consumption of CW is always equivalent to the production of W ˙ E q . The offshore DMTM-GTW-CCU uses three utility types: (i) CW with flow rate J C W (kmol/s), isobaric heat capacity C ¯ P C W (MJ/kmol·K) and hot/cold temperatures T H C W (K), T C C W (K); (ii) LPS with flow rate J L P S (kmol/s), vaporization enthalpy Δ H ¯ L P S V A P (MJ/kmol) and temperature T L P S (K); and (iii) electricity E ˙ E (MW). C ¯ P C W and Δ H ¯ L P S V A P are assumed constant, considering that CW and LPS operate within narrow temperature ranges.
The equivalence of heat and power is settled through reversible heat engines that can attain the maximum yields of heat–work conversion. These maximum yield engines are well known as the Carnot engine (CE) and the Carnot heat pump (CHP) [29]. The CE receives heat from a hot source, generates power and discharges heat to a colder source. Analogously, the CHP absorbs power while drawing heat from a cold source and discharging heat to a hotter one. Figure 9b depicts a configuration compatible with Figure 9a, i.e., it depicts a steady-state open system thermally interacting only with the heat reservoir R0, generating a work effect associated with E ˙ E and other work streams. The difference is that the system in Figure 9b is a power-consuming System with the following utility effects: it absorbs E ˙ E , rejects heat Q ˙ C W to the CW loop (exports power W ˙ C W E q ) and absorbs heat Q ˙ L P S from the LPS loop (imports power W ˙ L P S E q ). Figure 9b shows that the CW loop and LPS loop are external to the original system (but are added to it, defining a newer system compatible with Figure 9a), R0 is always a cold heat reservoir (cold source), and W ˙ C W E q , Q ˙ C W , W ˙ L P S E q , Q ˙ L P S are always positive. It is not difficult to create an analogous version of Figure 9b for a power-producing system (i.e., in which CW is imported and electricity and LPS are exported).
The steady-state power-consuming system (Figure 9b) rejects heat ( Q ˙ C W ) to cold CW, producing hot CW, which is restored to cold CW via a CW loop using the CE that exports power ( W ˙ C W E q ) and rejects heat ( Q ˙ C W R 0 ) to R0. Equivalently, the power-consuming system absorbs heat ( Q ˙ L P S ) from LPS, becoming an LPS condensate, which is restored to LPS via an LPS loop, using the CHP that imports power ( W ˙ L P S E q ) and absorbs heat ( Q ˙ L P S R 0 ) from R0. W ˙ C W E q is obtained by Equation (16) using Equation (15a), Equation (15b) and CE entropy conservation in Equation (15c). Appropriately, W ˙ L P S E q is obtained by Equation (18) using Equation (17a), Equation (17b) and CHP entropy conservation in Equation (17c). Equation (18) also works for W ˙ L P S E q in power-producing systems, but with the difference that the LPS loop now spins counter-clockwise, the CE replaces the CHP, and all effects are reversed.
Equation (19a) calculates the equivalent power produced by a power-producing system that exports E ˙ E and LPS (counter-clockwise LPS loop in Figure 9b) and consumes CW. Analogously, Equation (19b) is the equivalent power consumed by a power-consuming system that consumes E ˙ E , CW and LPS. The substitution of Equations (16) and (18) into Equation (19a,b) creates Equation (20a,b), respectively, leading to the equivalent power produced by a power-producing system and the equivalent power consumed by a power-consuming system, respectively.
W ˙ C W E q = Q ˙ C W Q ˙ C W R 0
Q ˙ C W = J C W C ¯ P C W ( T H C W T C C W )
Q ˙ C W R 0 T 0 + J C W C ¯ P C W l n T C C W T H C W = 0
W ˙ C W E q = J C W C ¯ P C W T H C W T C C W T 0 · l n T H C W T C C W
W ˙ L P S E q = Q ˙ L P S Q ˙ L P S R 0
Q ˙ L P S = J L P S Δ H ¯ L P S V A P
Q ˙ L P S R 0 T 0 + J L P S Δ H ¯ L P S V A P T L P S = 0 ,
W ˙ L P S E q = J L P S Δ H ¯ L P S V A P 1 T 0 T L P S
W ˙ E q = E ˙ E + W ˙ C W E q + W ˙ L P S E q {Power-Producing System}
W ˙ E q = E ˙ E W ˙ C W E q + W ˙ L P S E q {Power-Consuming System}
W ˙ E q = E ˙ E + J C W C ¯ p C W T H C W T C C W T 0 · l n T H C W T C C W + J L P S Δ H ¯ L P S V A P 1 T 0 T L P S
W ˙ E q = E ˙ E J C W C ¯ p C W T H C W T C C W T 0 · l n T H C W T C C W + J L P S Δ H ¯ L P S V A P 1 T 0 T L P S

2.3.3. Thermodynamic Efficiency

Second Law analysis allows the calculation of the thermodynamic efficiency and the lost work (lost power) of the overall system and also of its sub-systems. This corresponds to estimating the degree of resource degradation in the system and its sub-systems. With W ˙ M A X (Equation (14)) and W ˙ E q (Equation (20a,b), the thermodynamic efficiencies of power-producing systems and power-consuming systems are calculated via Equation (20a,b), respectively.
η % = 100 · W ˙ E q / W ˙ M A X {Power-Producing System}
η % = 100 · ( W ˙ M A X ) / W ˙ E q {Power-Consuming System}

2.3.4. Lost Work

Equation (22a,b) are intuitive formulas for the lost work (lost power) of power-producing systems and power-consuming systems, respectively. An alternative way to calculate lost work can be derived from the Second Law formula in Equation (23a) that represents all Universe changes resulting from system transitions, where S ˙ U N I V is the entropy creation rate of the Universe owing to the system operation. Hence, Equation (23b,c) are the lost work formulas generated by Equation (23a) for power-producing systems and power-consuming systems, respectively, where S ˙ R 0 is replaced by Equation (24a,b), again, for power-producing systems and power-consuming systems.
W ˙ L O S T = W ˙ M A X W ˙ E q {Power-Producing System}
W ˙ L O S T = W ˙ E q ( ) W ˙ M A X {Power-Consuming System}
W ˙ L O S T = T 0 S ˙ U N I V = T 0 S ˙ R 0 + i = 1 N p K i S ¯ K i i = 1 N f G i S ¯ G i
W ˙ L O S T = J C W C ¯ p C W T 0 · l n T H C W T C C W + J L P S Δ H ¯ L P S V A P T 0 T L P S + T 0 i = 1 N p K i S ¯ K i i = 1 N f G i S ¯ G i
W ˙ L O S T = J C W C ¯ p C W T 0 · l n T H C W T C C W J L P S Δ H ¯ L P S V A P T 0 T L P S + T 0 i = 1 N p K i S ¯ K i i = 1 N f G i S ¯ G i
S ˙ R 0 = Q ˙ C W R 0 T 0 + Q ˙ L P S R 0 T 0 = J C W C ¯ P C W l n T H C W T C C W + J L P S Δ H ¯ L P S V A P T L P S
S ˙ R 0 = Q ˙ C W R 0 T 0 Q ˙ L P S R 0 T 0 = J C W C ¯ P C W l n T H C W T C C W J L P S Δ H ¯ L P S V A P T L P S

3. Results and Discussion

The results from the technical, economic and thermodynamic analyses of the offshore DMTM-GTW-CCU are next presented and discussed.

3.1. Technical and Economic Performance

Table 3 summarizes the technical and economic results of the offshore DMTM-GTW-CCU. The DMTM plant, which encompasses the FCU, DMTM-SCW, MWS and LECU sub-systems, produces methanol (2.2 t/h) from methane (91.7 t/h, contained in 342.4 t/h of raw CO2-rich NG). Grade AA methanol purity (99.85%w/w) [30] is achieved through two distillation columns: (i) MWSC-1, which aims to concentrate the methanol stream (from 1.1 to 49.0%mol), and (ii) MWSC-2, which obtains methanol specification. Pure water was generated as MWSC-1 and MWSC-2 bottom products.
The NGCC plant (with four parallel NGCC elements) of the offshore DMTM-GTW-CCU produces 564.5 MW of gross power (≈97.8% from gas turbines), allowing 457.1 MW of net exported power. Each gas turbine burns ≈23.4 t/h of fuel-gas and produces ≈34 MW at 33.8% LHV efficiency. EGR entails that a single NGCC element produces 1890.7 t/h flue gas at 16.7%mol CO2. The HRSG cools down the gas turbine flue gas from 484 °C to 160 °C, the minimum temperature for maximum HPS generation, ensuring sufficient LPS to heat the MWS, PCC-MEA and CDU-TEG reboilers.
The PCC-MEA stripper requires 694.5 MW of LPS and discharges 515.0 t/h of water-saturated CO2 as the top product. CU-1 pressurizes the CO2 stream up to 50 bar to reach the CDU-TEG’s ideal conditions for CO2 dehydration. The CDU-TEG removes ≈94% of the water from its feed and produces 498.4 t/h of dry CO2 (≈160 ppm-mol H2O). The SGU sends 7.1 t/h of low-pressure dry CO2 to the TEG stripper reboiler to maintain its temperature below 140 °C to avoid TEG degradation [31]. Considering the small flow rate of the water removed from the CO2 stream, the TEG stripper reboiler demands 1.1 MW of LPS. CU-2 exports 491.3 t/h of dry CO2 (P = 300 bar, T = 35 °C) to EOR, avoiding the emission of this CO2 to the atmosphere. Thus, EOR is classified as a carbon capture and utilization (CCU) process, since it produces oil from the injected CO2 (EOR yield = 1.5 bblOil/tCO2 [29]) and consequently monetizes it.
The offshore DMTM-GTW-CCU power demand corresponds to 19.0% of its gross power. The FCU, CU-1 and CU-2 are the main electricity consumers (considering their compressor trains), while the PCC-MEA leads the CW and LPS consumption.
Figure 10a shows the process of water generation or consumption of the overall system and its sub-systems. As the offshore DMTM-GTW-CCU produces water, it becomes self-sufficient in terms of this resource. Thus, it is not necessary to import water.
The calculated economic variables (FCI, COL, CUT, CRM, REV, NPV) are presented in Table 3. One can note that the cost of utilities (CUT) is zero, since the power, LPS and CW are produced on site. Although DMTM-GTW-CCU plant implementation requires a high fixed capital investment (FCI = 1544.4 MMUSD), the project is economically feasible, considering the scenario described in Table 2. Figure 10b shows the NPV for a 50 year horizon, highlighting a payback time of 10 years.

3.2. Thermodynamic Analysis Results

Thermodynamic and lost work analyses were executed for the offshore DMTM-GTW-CCU overall system and its sub-systems, i.e., the (i) FCU; (ii) DMTM-SCW; (iii) MWS; (iv) LECU; (v) NGCC plant; (vi) PCC-MEA; (vii) CU-1; (viii) CDU-TEG; (ix) SGU; (x) CU-2; (xi) EGR structure; and (xii) PCS. The DMTM-GTW-CCU was correctly partitioned among the previously cited sub-systems (there was no sub-system missed), meaning that the respective sums of W ˙ M A X , W ˙ E q and W ˙ L O S T for all sub-systems must provide the same values as for the overall system, which are determined independently of the sub-systems. The paralleling of the overall system values with the respective sum over the sub-systems leads to a consistency check of the thermodynamic investigation. There is always some divergence between the sums over the sub-systems and the overall system in practice. Therefore, divergences below 1% could be established to confirm consistency in the thermodynamic analysis.

3.2.1. Performance of Maximum Power, Equivalent Power and Thermodynamic Efficiency

Table 4 depicts the thermodynamic efficiencies and other results of the Second Law analysis of the overall offshore DMTM-GTW-CCU and its sub-systems. The DMTM-SCW, LECU, NGCC, SGU, PCS and the overall system are power-producing systems ( W ˙ M A X > 0 ); therefore, Equations (19a), (20a), (21a), (22a), (23b) and (24a) were adopted for the W ˙ E q , η % , W ˙ L O S T calculations. Meanwhile, the FCU, MWS, PCC-MEA, CU-1, CDU-TEG and CU-2 sub-systems are power-consuming systems ( W ˙ M A X < 0 ), requiring Equations (19b), (20b), (21b), (22b), (23c) and (24b) for the W ˙ E q , η % , W ˙ L O S T calculations. The thermodynamic efficiency of the overall offshore DMTM-GTW-CCU reached 27.99% (Table 4).
The DMTM-SCW is a sub-system driven by spontaneities, i.e., it is a power-producing system ( W ˙ M A X = 47.34 MW). The DMTM-SCW W ˙ E q production (11.62 MW) is calculated with the E ˙ E produced by the expander (EXP), added to the W ˙ C W E q exported as hot CW from two cooling water heat exchangers. There is no LPS production or consumption ( W ˙ L P S E q = 0). The DMTM-SCW’s thermodynamic efficiency reached 24.55%.
The LECU is also a power-producing system ( W ˙ M A X = 0.22 MW). The W ˙ E q produced (0.04 MW) comes from LPS exportation ( W ˙ L P S E q ). The LECU’s thermodynamic efficiency was 16.79%.
With a highly positive W ˙ M A X = 1686.34 MW, the NGCC plant is incontestably a power-producing system as a result of its extremely spontaneous combustion transformations in the NGCC elements. The W ˙ E q generated by each NGCC element is calculated as follows: the W ˙ L P S E q from HRSG LPS exportation is added to the W ˙ C W E q produced by the Rankine cycle condenser and added to the E ˙ E that is generated in the gas turbines and in the steam turbine minus the Rankine cycle pump power (Figure 5). The thermodynamic efficiency of the NGCC plant reached 46.98%.
As with any separation process, the MWS is a power-consuming system. As predicted, the MWS W ˙ M A X is negative (−0.01 MW), due to the equivalent power required for methanol and water separation. The MWS imported W ˙ E q (10.30 MW) is measured as the W ˙ L P S E q consumed in the LEC, MWSC-1 and MWSC-2 reboilers, minus the W ˙ C W E q produced as hot CW from the LEC, MWSC-1 and MWSC-2 condensers and from four cooling water heat exchangers, added to the E ˙ E demanded in three pumps. The MWS’ thermodynamic efficiency reached 0.12%.
As with any separation process, the PCC-MEA is a power-consuming system ( W ˙ M A X = −28.23 MW) due to the equivalent power demanded for CO2 separation from flue gas. The PCC-MEA W ˙ E q consumed (187.95 MW) is obtained as follows: the W ˙ L P S E q imported by the PCC-MEA stripper reboiler, minus the W ˙ C W E q exported as hot CW from the stripper condenser and from the lean MEA cooler, added to the E ˙ E required by the solvent recirculation pump and water and MEA make-up pumps. The PCC-MEA’s thermodynamic efficiency was 15.02%.
CDU-TEG is also a separation process, so it should be a power-consuming system ( W ˙ M A X = −0.003 MW). The slight W ˙ M A X value is a result of the very low flow rate of the water removed from the CO2 stream (≈2730 ppm-mol H2O to ≈160 ppm-mol H2O). The CDU-TEG W ˙ E q (0.31 MW) imported is calculated as follows: the W ˙ L P S E q consumed in the CDU-TEG stripper reboiler, subtracted from the W ˙ C W E q produced through hot CW from the stripper condenser and from the lean TEG cooler, added to the E ˙ E demanded in the TEG recirculation pump and in the TEG make-up pump. The CDU-TEG thermodynamic efficiency reached 1.11%.
The SGU is another sub-system driven by spontaneities, being a power-producing system ( W ˙ M A X = 0.40 MW). However, since W ˙ L P S E q , W ˙ C W E q and E ˙ E are all zero, the SGU’s thermodynamic efficiency is 0%, meaning that the SGU has sufficient spontaneity to produce power, but this potential is wasted and no power is actually produced.
The FCU, CU-1 and CU-2 perform non-spontaneous (compression) changes. Therefore, they are undeniably power-consuming systems ( W ˙ M A X = −16.45 MW, W ˙ M A X = −28.19 MW and W ˙ M A X = −4.82 MW, respectively). The respective W ˙ E q is measured as follows: the E ˙ E imported in the compressors and pumps, minus the W ˙ C W E q produced as hot CW from the compressor intercoolers. There is no LPS consumption ( W ˙ L P S E q = 0 ). The FCU, CU-1 and CU-2’s thermodynamic efficiencies were, respectively, 49.54%, 59.12% and 42.95%.
The PCS is a power-producing system ( W ˙ M A X = 23.99 MW) since it performs spontaneous changes. Nevertheless, the PCS actually consumes E ˙ E in the CW/SW pumps, i.e., E ˙ E contributes negatively to W ˙ E q . It is worth highlighting that CW is a process stream in the PCS, so it should not be counted as a CW utility (i.e., W ˙ C W E q = 0 ). Moreover, the PCS does not produce LPS ( W ˙ L P S E q = 0 ). Hence, the PCS has negative thermodynamic efficiency (−34.69%).

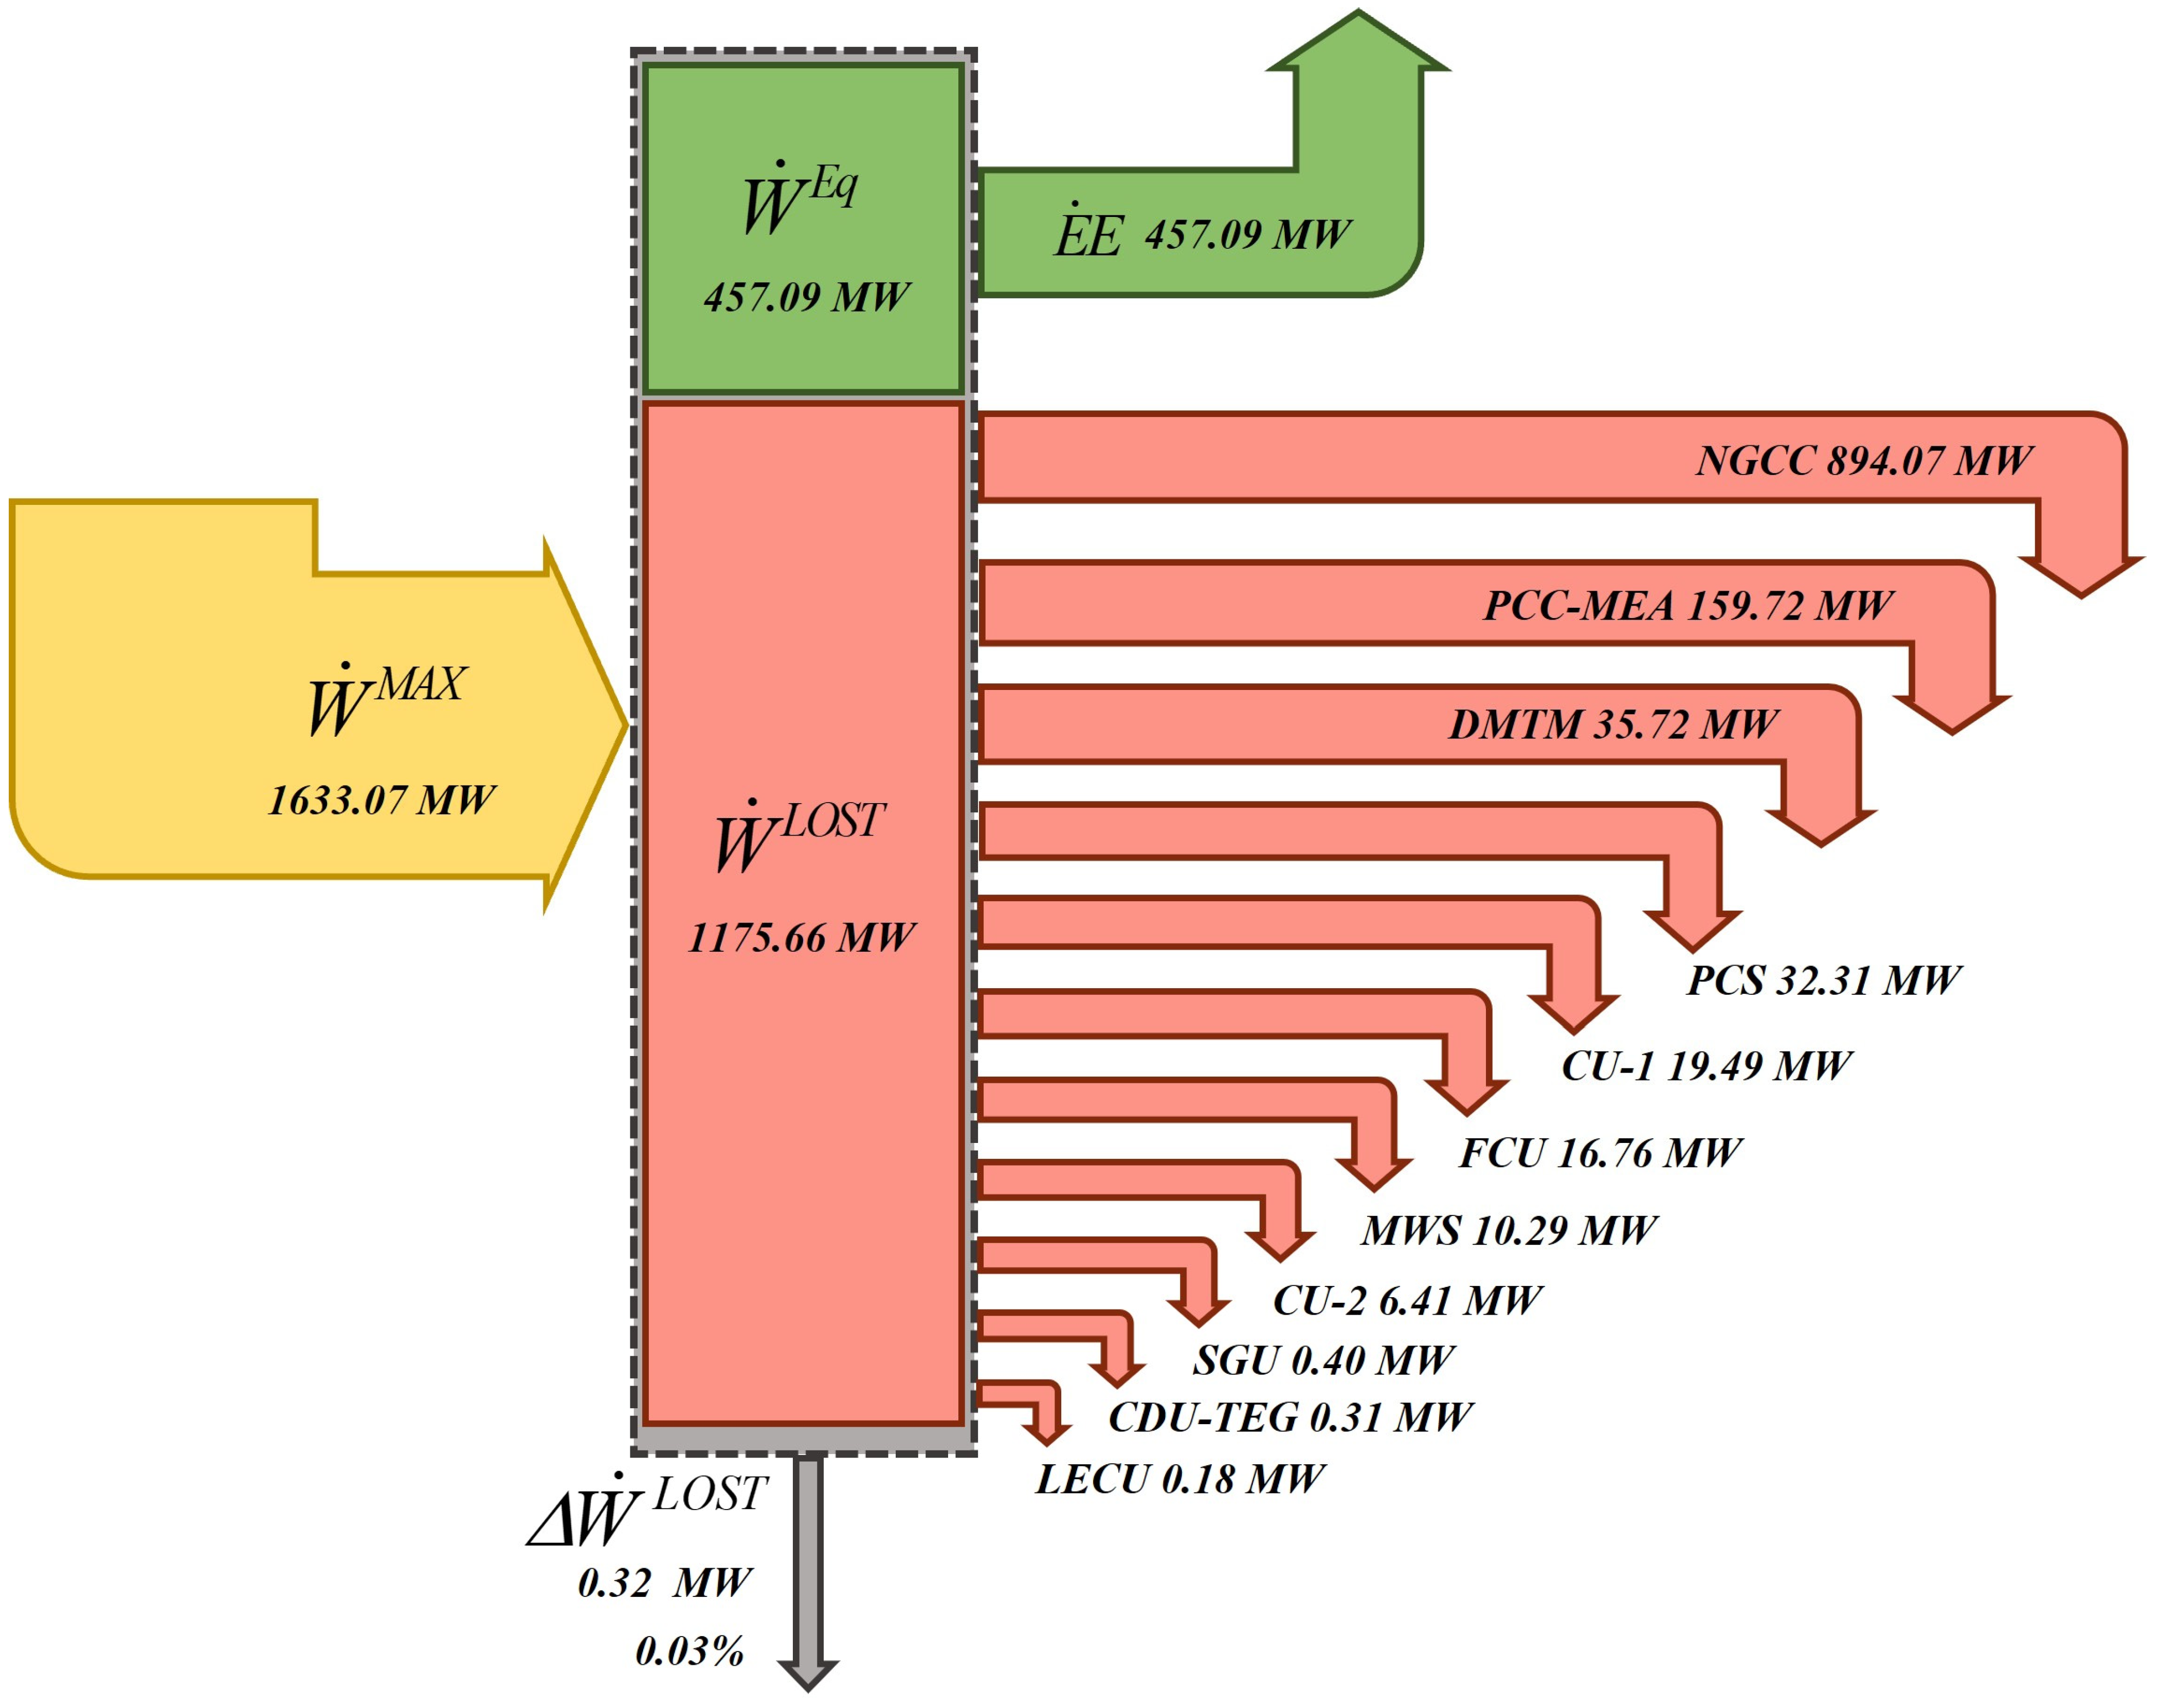
3.2.2. Lost Work Performance

Lost work corresponds to the power potential wasted in the DMTM-GTW-CCU and its sub-systems from irreversible (spontaneous) effects. Table 4 depicts the lost work results and also verifies the consistency of the present thermodynamic analysis via a comparison of the lost work values estimated through two thermodynamically independent methods, namely (i) via W ˙ M A X and W ˙ E q in Equation (22a,b) and (ii) via T 0 S ˙ U N I V in Equation (23b,c), for power-producing and power-consuming systems, respectively. In addition, Table 4 also illustrates a consistency crosscheck regarding the sum of lost work over the sub-systems, which, in theory, should equal the lost work of the overall system (numerical divergences were all smaller than 1%).
Figure 11 presents Sankey diagrams for the W ˙ M A X , W ˙ E q and W ˙ L O S T flows for the overall system and its sub-systems. In Figure 11, W ˙ L O S T corresponds to the sum of lost work over all sub-systems (light maroon flows), while Δ W ˙ L O S T is its difference compared to the lost work of the overall system (Table 4). Overall, ≈72% of the offshore DMTM-GTW-CCU’s available power ( W ˙ M A X = 1633.07 MW) is wasted as lost work thanks to process irreversibilities.
The NGCC plant has the largest W ˙ L O S T (894.07 MW, 76.05% share), considering its extremely spontaneous combustion reactions. It is followed by the PCC-MEA (159.72 MW, 13.59% share), due to its columns/exchangers’ head losses, the mass transfer finite potentials in the columns, the thermal approaches in the exchangers and stream mixing. The other sub-systems’ lost work is modest, since these sub-systems are of low importance: DMTM-SCW (35.72 MW, 3.04% share), PCS (32.31 MW, 2.75% share), CU-1 (19.49 MW, 1.66% share), FCU (16.76 MW, 1.43% share), MWS (10.29 MW, 0.88% share), CU-2 (6.41 MW, 0.55% share), SGU (0.40 MW, 0.03% share), CDU-TEG (0.31 MW, 0.03% share) and LECU (0.18 MW, 0.02% share).

3.3. Comparison with the Literature

Hetland et al. [14] is a classical and essential reference on floating GTW-CCS. The authors carried out a theoretical GTW-CCS study evaluating PCC-MEA implementation downstream of a floating Siemens NGCC (450 MW). The authors pointed out that the floating GTW-CCS was technically feasible, although they did not consider intensification factors, as considered here, such as the EGR and CO2-EOR stream dehydration (both are realistically necessary to radically reduce the CCS costs and to prevent CO2 hydrate formation in the exported CO2 stream). Additionally, they did not perform economic, thermodynamic or exergy analyses of the floating GTW-CCS. On the other hand, the present work filled these gaps as it considered a floating DMTM-GTW-CCU with a DMTM-SCW process coupled to gas-to-wire, achieving low emissions and producing methanol, wherein complete techno-economic, thermodynamic and lost work analyses were conducted. The present DMTM-GTW-CCU is able to generate 550 MW at low emissions and reasonable thermodynamic efficiency. Above all, it was demonstrated that the overall offshore DMTM-GTW-CCU process is potentially profitable, thermodynamically efficient and without environmental impacts.
In a recent work, using the same raw CO2-rich NG conditions, Milão et al. [29] obtained thermodynamic efficiency of 35.5% for their offshore GTW-CCS (677 MW) overall process without considering DMTM, EGR and CO2 dehydration. The present work found similar NGCC and PCC-MEA sub-system thermodynamic efficiencies and lost work but with differences in efficiency in the overall system (28% versus 35.5%). The underlying factor is that the DMTM addition upstream of the GTW-CCS in the present case made the offshore DMTM-GTW-CCU overall process more irreversible, consequently generating more lost work, despite the production of methanol. Moreover, the inclusion of EGR improves the PCC-MEA efficiency in the present case, reducing the lost work, while the inclusion of the TEG dehydration unit and the small stripping gas unit has the opposite effect, consuming power and generating lost work, resulting in lower overall thermodynamic efficiency of 28.0% for the present case. However, evidently, the present analysis is more complete and much more realistic.
These facts confirm that the proposal and the full analysis of the DMTM-GTW-CCU (with DMTM-SCW), as conducted here, constitute a novel study with reasonable contributions vis-à-vis the literature so far.

4. Conclusions

This work proposed and techno-economically and thermodynamically analyzed an innovative low-emission offshore DMTM-GTW-CCU process using CO2-rich NG available at remote deep-water offshore sites as raw material. The DMTM-GTW-CCU partially converts methane from ≈6.5 MMSm3/d of CO2-rich NG (CO2 > 40%mol) into methanol (2.2 t/h) by conducting DMTM in supercritical water and then exports low-emission electricity (457.1 MW of net power) and liquid dry CO2 as EOR fluid, bringing additional economic and environmental advantages. Offshore DMTM-GTW-CCU is an intensified power production process whose main intensification elements are (i) exhaust gas recycling (EGR), which reduces the flue gas flow rate while increasing its CO2 content; (ii) post-combustion carbon capture via PCC-MEA from enriched flue gas; and (iii) high-pressure CO2 dehydration in CDU-TEG, which removes ≈94% of the water from the CO2-to-EOR stream to achieve the final content of ≈160 ppm-mol H2O, preventing hydrate formation in EOR pipelines. EGR reduces the PCC-MEA investment and operational costs by lowering the column diameter/height, consequently increasing the DMTM-GTW-CCS’ profitability. The process proves to be self-sufficient in process water, thus overcoming a fundamental aspect that would represent a serious shortcoming: at deep-water offshore sites, the continuous importation of water would be an obstacle to plant sustainability.
The PCC-MEA plant abates 491.3 t/h of the flue gas CO2 (≈90%). The captured CO2 is compressed, dehydrated, compressed again and transported to EOR practically as pure dry CO2 (CO2 ≈ 99.97%mol). This EOR stream is assumed to be traded at 1.5 bblOil/tCO2, generating extra revenue. Considering the adopted economic assumptions, offshore DMTM-GTW-CCU with DMTM-SCW is economically feasible, with the following economic results: (i) 1544 MMUSD capital investment; (ii) 452 MMUSD/y cost of manufacturing; (iii) 820 MMUSD/y revenues (comprising methanol, electricity and CO2-to-EOR); (iv) 1021 MMUSD NPV50years; and (v) a 10 year payback time.
The Second Law analysis of the offshore DMTM-GTW-CCU overall system reveals 28% thermodynamic efficiency with ≈72% of lost work, with the NGCC sub-system being the greatest lost work sink (≈76% share of overall lost work) due to the highly spontaneous gas turbine firing process. The second lost work sink lies in the PCC-MEA sub-system (≈14% share of overall lost work), while the DMTM-SCW system is the third lost work sink, with a ≈3% lost work share, probably because the extension of the DMTM reaction is appreciably small to prevent methanol selectivity degeneracy. Thereby, the NGCC plant and PCC-MEA are the leading DMTM-GTW-CCU sub-systems that demand thermodynamic improvement in order to generate higher economic and environmental benefits. The consistency of the thermodynamic analysis was demonstrated through lost work sum crosschecks and lateral checks applying the alternative Second Law formula T 0 S ˙ U N I V for the lost work (Table 4). In summary, this work demonstrates that the newly proposed DMTM-GTW-CCU process is techno-economically feasible, environmentally friendly, thermodynamically efficient and competitive with other gas-to-wire processes from the literature, as shown in Section 3.3.

5. Suggestions for Future Work

The results of the technical, economic and thermodynamic analyses of the offshore DMTM-GTW-CCU were obtained in the context presented in Table 1 and Table 2. These results could be influenced by the variations in some parameters. Therefore, it is relevant to implement a sensitivity analysis varying the major factors that influenced the present work’s results (especially the prices of NG, oil, methanol and electricity). It is worth mentioning that other factors, such as the geographical location and climate factors, could have influenced the results obtained in this work and should also be considered. In the same way, there are other different and important analyses that could be proposed to investigate the system, such as an exergy analysis of the process and an environmental impact analysis, among others.

Supplementary Materials

The following supporting information can be downloaded at: https://www.mdpi.com/article/10.3390/pr12020374/s1, Table S1 belongs to the Supplementary Materials file related to this article, which can be found in the online version.

Author Contributions

A.d.C.R.: Software, Writing—Original Draft, Validation, Investigation, Data Curation, Visualization, Writing—Review and Editing, Formal Analysis. O.d.Q.F.A.: Supervision, Project Administration, Writing—Review and Editing. J.L.d.M.: Conceptualization, Software, Methodology, Investigation, Supervision, Writing—Original Draft, Writing—Review and Editing, Visualization, Formal Analysis. All authors have read and agreed to the published version of the manuscript.

Funding

J.L.d.M. and O.d.Q.F.A. acknowledge financial support from CNPq-Brazil (313861/2020-0, 312328/2021-4) and from FAPERJ Brazil (E-26/200.522/2023, E-26/201.178/2021). A.d.C.R. acknowledges financial support from FAPERJ Brazil (E-26/203.508/2023).

Data Availability Statement

Data are contained within the article and Supplementary Materials.

Conflicts of Interest

The authors declare no conflicts of interest.

Abbreviations

CCS: Carbon Capture and Storage; CCU: Carbon Capture and Utilization; CDU-TEG: CO2 Dehydration Unit with TEG; CE: Carnot Engine; CHP: Carnot Heat Pump; CU: Compression Unit; CW: Cooling Water; DMTM: Direct Methane-to-Methanol; EGR: Exhaust Gas Recycling; EOR: Enhanced Oil Recovery; FCU: Feed Compression Unit; FG: Flue Gas; GTW: Gas-to-Wire; HPS: High-Pressure Steam; HRSG: Heat Recovery Steam Generator; HVDC: High-Voltage Direct Current; LEC: Light-Ends Column; LECC: Light-Ends Combustion Chamber; LECE: Light-Ends Combustion Exchanger; LECU: Light-Ends Combustion Unit, LHV: Lower Heating Value; LPS: Low-Pressure Steam; MEA: Monoethanolamine; MWS: Methanol–Water Separation; MWSC: Methanol–Water Separation Column; NG: Natural Gas; NGCC: Natural Gas Combined Cycle; PCC-MEA: Post-Combustion Capture with Aqueous MEA; PCS: Primary Cooling System; SCW: Supercritical Water; SGU: Stripping Gas Unit; SW: Sea Water; TEG: Triethylene Glycol.

Nomenclature

AP, GAPNet and gross annual profits (MMUSD/y)
CAP Equipment capacity
CBMBare module cost (MMUSD)
COL, COMCosts of labor and of manufacturing (MMUSD/y)
CRM, CUTCosts of raw materials and of utilities (MMUSD/y)
DEPRDepreciation (MMUSD/y)
E ˙ E Electricity (MW)
FCIFixed capital investment (MMUSD)
GiFlow rate of ith feed stream (kmol/s)
H ¯ , S ¯ Molar enthalpy (MJ/kmol), molar entropy (MJ/K·kmol)
KiFlow rate of ith product stream (kmol/s)
Nf Number of feed streams (inputs)
Np Number of product streams (outputs)
NPVNet present value (MMUSD)
PPressure (bar)
Q ˙ , WHeat duty, power (MW)
REVRevenues (MMUSD/y)
TTemperature (K)
Greeks
ηThermodynamic efficiency (%)
Superscripts
CW, Eq, LPS Cooling water, equivalent, low-pressure steam

References

  1. Neseli, M.A.; Ozgener, O.; Ozgener, L. Energy and exergy analysis of electricity generation from natural gas pressure reducing stations. Energy Convers. Manag. 2015, 93, 109–120. [Google Scholar] [CrossRef]
  2. de Freitas, V.A.; Vital, J.C.S.; Rodrigues, B.R.; Rodrigues, R. Source rock potential, main depocenters, and CO2 occurrence in the pre-salt section of Santos Basin, southeast Brazil. J. S. Am. Earth Sci. 2022, 115, 103760. [Google Scholar] [CrossRef]
  3. Andrei, M.; Sammarco, G. Gas to wire with carbon capture & storage: A sustainable way for on-site power generation by produced gas. In Proceedings of the Abu Dhabi International Petroleum Exhibition & Conference, Abu Dhabi, United Arab Emirates, 13–16 November 2017. [Google Scholar] [CrossRef]
  4. Ojijiagwo, E.; Oduoza, C.F.; Emekwuru, N. Economics of gas to wire technology applied in gas flare management. Eng. Sci. Technol. Int. J. 2016, 19, 2109–2118. [Google Scholar] [CrossRef]
  5. Orisaremi, K.K.; Chan, F.T.S.; Chung, N.S.H. Potential reductions in global gas flaring for determining the optimal sizing of gas-to-wire (GTW) process: An inverse DEA approach. J. Nat. Gas Sci. Eng. 2021, 93, 103995. [Google Scholar] [CrossRef]
  6. Watanabe, T.; Inoue, H.; Horitsugi, M.; Oya, S. Gas to Wire (GTW) system for developing “small gas field” and exploiting “associated gas”. In Proceedings of the International Oil & Gas Conference and Exhibition in China, Beijing, China, 5–7 December 2006. [Google Scholar] [CrossRef]
  7. Sayed, S.; Massoud, A. Minimum transmission power loss in multi-terminal HVDC systems: A general methodology for radial and mesh networks. Alex. Eng. J. 2019, 58, 115–125. [Google Scholar] [CrossRef]
  8. Brito, T.L.F.; Galvão, C.; Fonseca, A.F.; Costa, H.K.M.; dos Santos, E.M. A review of gas-to-wire (GtW) projects worldwide: State-of-art and developments. Energy Policy 2022, 163, 112859. [Google Scholar] [CrossRef]
  9. Zhou, D.; Li, P.; Liang, X.; Liu, M.; Wang, L. A long-term strategic plan of offshore CO2 transport and storage in northern South China Sea for a low-carbon development in Guangdong province, China. Int. J. Greenh. Gas Control 2018, 70, 76–87. [Google Scholar] [CrossRef]
  10. Roussanaly, S.; Aasen, A.; Anantharaman, R.; Danielsen, B.; Jakobsen, J.; Heme-De-Lacotte, L.; Neji, G.; Sødal, A.; Wahl, P.; Vrana, T.; et al. Offshore power generation with carbon capture and storage to decarbonise mainland electricity and offshore oil and gas installations: A techno-economic analysis. Appl. Energy 2019, 233–234, 478–494. [Google Scholar] [CrossRef]
  11. Zhao, H.; Chang, Y.; Feng, S. Influence of produced natural gas on CO2-crude oil systems and the cyclic CO2 injection process. J. Nat. Gas Sci. Eng. 2016, 35, 144–151. [Google Scholar] [CrossRef]
  12. Monson, C.C.; Korose, C.P.; Frailey, S.M. Screening methodology for regional-scale CO2 EOR and storage using economic criteria. Energy Procedia 2014, 63, 7796–7808. [Google Scholar] [CrossRef]
  13. Araújo, O.d.Q.F.; Reis, A.d.C.; de Medeiros, J.L.; Nascimento, J.F.D.; Grava, W.M.; Musse, A.P.S. Comparative analysis of separation technologies for processing carbon dioxide rich natural gas in ultra-deepwater oil fields. J. Clean. Prod. 2017, 155, 12–22. [Google Scholar] [CrossRef]
  14. Hetland, J.; Kvamsdal, H.M.; Haugen, G.; Major, F.; Kårstad, V.; Tjellander, G. Integrating a full carbon capture scheme onto a 450 MWe NGCC electric power generation hub for offshore operations: Presenting the Sevan GTW concept. Appl. Energy 2009, 86, 2298–2307. [Google Scholar] [CrossRef]
  15. Hachem, J.; Schuhler, T.; Orhon, D.; Cuif-Sjostrand, M.; Zoughaib, A.; Molière, M. Exhaust gas recirculation applied to single-shaft gas turbines: An energy and exergy approach. Energy 2022, 238, 121656. [Google Scholar] [CrossRef]
  16. Li, H.; Ditaranto, M.; Yan, J. Carbon capture with low energy penalty: Supplementary fired natural gas combined cycles. Appl. Energy 2012, 97, 164–169. [Google Scholar] [CrossRef]
  17. Li, H.; Ditaranto, M.; Berstad, D. Technologies for increasing CO2 concentration in exhaust gas from natural gas-fired power production with post-combustion, amine-based CO2 capture. Energy 2011, 36, 1124–1133. [Google Scholar] [CrossRef]
  18. Ahmadi, M.A.; Soleimani, R.; Bahadori, A. A computational intelligence scheme for prediction equilibrium water dew point of natural gas in TEG dehydration systems. Fuel 2014, 137, 145–154. [Google Scholar] [CrossRef]
  19. Zakaria, Z.; Kamarudin, S.K. Direct conversion technologies of methane to methanol: An overview. Renew. Sustain. Energy Rev. 2016, 65, 250–261. [Google Scholar] [CrossRef]
  20. Zhang, Q.; He, D.; Li, J.; Xu, B.; Liang, Y.; Zhu, Q. Comparatively high yield methanol production from gas phase partial oxidation of methane. Appl. Catal. A Gen. 2002, 224, 201–207. [Google Scholar] [CrossRef]
  21. Holmen, A. Direct conversion of methane to fuels and chemicals. Catal. Today 2009, 142, 2–8. [Google Scholar] [CrossRef]
  22. Han, B.; Yang, Y.; Xu, Y.; Etim, U.; Qiao, K.; Xu, B.; Yan, Z. A review of the direct oxidation of methane to methanol. Chin. J. Catal. 2016, 35, 1206–1215. [Google Scholar] [CrossRef]
  23. Ravi, M.; Ranocchiari, M.; van Bokhoven, J.A. The Direct Catalytic Oxidation of Methane to Methanol—A Critical Assessment. Angew. Chem. Int. Ed. 2017, 56, 16464–16483. [Google Scholar] [CrossRef]
  24. Savage, P.E.; Li, R.; Santini, J.T. Methane to methanol in supercritical water. J. Supercrit. Fluids 1994, 7, 135–144. [Google Scholar] [CrossRef]
  25. Zhang, F.; Li, Y.; Liang, Z.; Wu, T. Energy conversion and utilization in supercritical water oxidation systems: A review. Biomass Bioenergy 2022, 156, 106322. [Google Scholar] [CrossRef]
  26. Lee, J.H.; Foster, N.R. Direct partial oxidation of methane to methanol in supercritical water. J. Supercrit. Fluids 1996, 9, 99–105. [Google Scholar] [CrossRef]
  27. Le Guennec, Y.; Privat, R.; Jaubert, J.-N. Development of the translated-consistent tc-PR and tc-RK cubic equations of state for a safe and accurate prediction of volumetric, energetic and saturation properties of pure compounds in the sub- and super-critical domains. Fluid Phase Equilib. 2016, 429, 301–312. [Google Scholar] [CrossRef]
  28. Le Guennec, Y.; Privat, R.; Lasala, S.; Jaubert, J.-N. On the imperative need to use a consistent α-function for the prediction of pure-compound supercritical properties with a cubic equation of state. Fluid Phase Equilib. 2017, 445, 45–53. [Google Scholar] [CrossRef]
  29. Milão, R.d.F.D.; de Medeiros, J.L.; Interlenghi, S.F.; Araújo, O.d.Q.F. Low-emission Gas-to-Wire with thermodynamic efficiency: Monetization of carbon dioxide rich natural gas from offshore fields. Gas Sci. Eng. 2023, 115, 205021. [Google Scholar] [CrossRef]
  30. Ott, J.; Gronemann, V.; Pontzen, F.; Fiedler, E.; Grossman, G.; Kersebohm, K.B.; Weiss, G.; Witte, C. Methanol—An Industrial Review by Lurgi GmbH, Air Liquide GmbH and BASF AG. In Ullmann’s Encyclopedia of Industrial Chemistry; Wiley-VCH Verlag GmbH & Co. KGaA: Weinheim, Germany, 2012. [Google Scholar]
  31. Chebbi, R.; Qasim, M.; Jabbar, N.A. Optimization of triethylene glycol dehydration of natural gas. Energy Rep. 2019, 5, 723–732. [Google Scholar] [CrossRef]
  32. Siemens Energy. SGT-A35 Aeroderivative Gas Turbine. Available online: https://www.siemens-energy.com/global/en/offerings/power-generation/gas-turbines/sgt-a30-a35-rb.html (accessed on 2 September 2022).
  33. Følgesvold, E.; Skjefstad, H.; Riboldi, L.; Nord, L. Combined heat and power plant on offshore oil and gas installations. J. Power Technol. 2017, 97, 117–126. [Google Scholar]
  34. GE. Aeroderivative LM2500 Gas Turbine (50Hz): Fact Sheet. 2019. Available online: https://www.ge.com/content/dam/gepower/global/en_US/documents/gas/gas-turbines/aero-products-specs/lm2500-50hz-fact-sheet-product-specifications.pdf. (accessed on 2 September 2022).
  35. Kloster, P. Energy Optimization on Offshore Installations with Emphasis on Offshore Combined Cycle Plants. In Proceedings of the SPE Offshore Europe Oil and Gas Conference and Exhibition, Aberdeen, UK, 7–10 September 1999; Society of Petroleum Engineers: Aberdeen, UK, 1999. [Google Scholar] [CrossRef]
  36. GE. LM2500+G4 Marine Gas Turbine. 2021. Available online: https://www.geaviation.com/sites/default/files/datasheet-lm2500plusg4.pdf (accessed on 2 September 2022).
  37. Oh, S.-Y.; Binns, M.; Cho, H.; Kim, J.-K. Energy minimization of MEA-based CO2 capture process. Appl. Energy 2016, 169, 353–362. [Google Scholar] [CrossRef]
  38. Araújo, O.d.Q.F.; de Medeiros, J.L. Carbon capture and storage technologies: Present scenario and drivers of innovation. Curr. Opin. Chem. Eng. 2017, 17, 22–34. [Google Scholar] [CrossRef]
  39. Liu, G.; Zhu, L.; Hong, J.; Liu, H. Technical, Economical, and Environmental Performance Assessment of an Improved Triethylene Glycol Dehydration Process for Shale Gas. ACS Omega 2022, 7, 1861–1873. [Google Scholar] [CrossRef] [PubMed]
  40. Turton, R.; Bailie, R.C.; Whiting, W.B.; Shaeiwitz, J.A. Analysis, Synthesis and Design of Chemical Processes, 4th ed.; Prentice Hall: Columbia, MI, USA, 2012. [Google Scholar]
  41. Towering Skills. 2023. Available online: https://toweringskills.com/financial-analysis/cost-indices/ (accessed on 20 September 2023).
  42. Windén, B.; Chen, M.; Okamoto, N.; Kim, D.K.; McCaig, E.; Shenoi, A.; Wilson, P. Investigation of offshore thermal power plant with carbon capture as an alternative to carbon dioxide transport. Ocean Eng. 2014, 76, 152–162. [Google Scholar] [CrossRef]
  43. EIA. U.S. Energy Information Administration. Natural Gas. 2023. Available online: https://www.eia.gov/dnav/ng/hist/rngwhhdm.htm (accessed on 20 September 2023).
  44. CHEMANALYST. 2023. Available online: https://www.chemanalyst.com/Pricing-data/methanol-1 (accessed on 20 September 2023).
  45. Statista. Petroleum & Refinery. 2023. Available online: https://www.statista.com/statistics/262861/uk-brent-crude-oil-monthly-price-development/ (accessed on 20 September 2023).
Figure 1. Process sub-systems (FCU: feed compression unit; DMTM-SCW: direct-methane-to-methanol in supercritical water; MWS: methanol–water separation system; LECU: light-ends combustion unit; NGCC: NG combined cycle; PCC-MEA: post-combustion capture with aqueous MEA; CU: CO2 compression unit; CDU-TEG: CO2 dehydration unit with TEG; SGU: stripping gas unit; PCS: primary cooling system; EGR: exhaust gas recycling; CW: cooling water; SW: sea water; LPS: low-pressure steam).
Processes 12 00374 g001
Figure 2. Feed compression unit (FCU) (DMTM-SCW: direct methane-to-methanol in supercritical water; CW: cooling water).
Processes 12 00374 g002
Figure 3. Direct methane-to-methanol in supercritical water (DMTM-SCW) (NGCC: natural gas combined cycle; MWS: methanol–water separation system; CW: cooling water; Exch: exchanger; Fl: flash; EXP: expander; 3-Ph Sep: 3-phase separator).
Processes 12 00374 g003
Figure 4. Methanol–water separation system (MWS) and light-ends combustion unit (LECU) (FG: flue gas; PCC-MEA: post-combustion capture with aqueous MEA; LEC: light-ends column; LECC: light-ends combustion chamber; LECE: light-ends combustion exchanger; CW: cooling water; LPS: low-pressure steam).
Processes 12 00374 g004
Figure 5. NG combined cycle (NGCC) element (DMTM-SCW: direct-methane-to-methanol in supercritical water; EGR: exhaust gas recycling; HRSG: heat recovery steam generator; CW: cooling water; LPS: low-pressure steam; HPS: high-pressure steam; PCC-MEA: post-combustion capture with aqueous MEA; Exch: exchanger).
Processes 12 00374 g005
Figure 6. Post-combustion capture with aqueous MEA (PCC-MEA) (CDU-TEG: CO2 dehydration unit with TEG; CU: CO2 compression unit; LPS: low-pressure steam; CW: cooling water).
Processes 12 00374 g006
Figure 7. Compression units CU-1 (a); CU-2 (c); CO2 dehydration unit with TEG (b) (CDU-TEG) and stripping gas unit (SGU) (c) (CW: cooling water; LPS: low-pressure steam; PCC-MEA: post-combustion capture with aqueous MEA; EOR: enhanced oil recovery).
Processes 12 00374 g007
Figure 8. Primary cooling system (PCS) (Exch: exchanger; CW: cooling water; SW: sea water).
Processes 12 00374 g008
Figure 9. (a) Open system for thermodynamic analysis; (b) equivalent power for power-consuming open system (arrows as feed and product streams) that imports electricity ( E ˙ E ), exports equivalent power via CW loop ( W ˙ C W E q ) and imports equivalent power via LPS loop ( W ˙ L P S E q ) (CW: cooling water; LPS: low-pressure steam; CHP: Carnot heat pump; CE: Carnot engine).
Processes 12 00374 g009
Figure 10. Techno-economic results: (a) process water production (+) or consumption (-) and (b) NPV (FCU: feed compression unit; DMTM-SCW: direct-methane-to-methanol in supercritical water; MWS: methanol–water separation system; LECU: light-ends combustion unit; NGCC: NG combined cycle; PCC-MEA: post-combustion capture with aqueous MEA; CU: CO2 compression unit; CDU-TEG: CO2 dehydration unit with TEG; SGU: stripping gas unit; PCS: primary cooling system).
Processes 12 00374 g010
Figure 11. Lost work Sankey diagram ( E ˙ E : electricity; W ˙ M A X : maximum power; W ˙ E q : equivalent power; W ˙ L O S T : lost work; FCU: feed compression unit; DMTM-SCW: direct-methane-to-methanol in supercritical water; MWS: methanol–water separation system; LECU: light-ends combustion unit; NGCC: NG combined cycle; PCC-MEA: post-combustion capture with aqueous MEA; CU: CO2 compression unit; CDU-TEG: CO2 dehydration unit with TEG; SGU: stripping gas unit; PCS: primary cooling system).
Processes 12 00374 g011
Table 1. Design and simulation assumptions.
ItemDescriptionAssumption
A1Thermodynamic ModelsGas, Liquid and Supercritical Streams: Peng–Robinson–Twu Equation of State [27,28];
Rankine Cycle and CW: ASME Steam Table;
MWS: NRTL + Peng–Robinson Equation of State (NRTL-PR);
PCC-MEA: HYSYS Acid Gas Package; CDU-TEG: HYSYS Glycol Package
A2Raw
CO2-Rich NG
6.5 MMSm3/d; T = 40 °C; P = 25 bar; CH4 = 49.82%mol, CO2 = 43.84%mol, C2H6 = 2.99%mol, C3H8 = 1.99%mol, iC4H10 = 0.3%mol, C4H10 = 0.2%mol, iC5H12 = 0.2%mol, C5H12 = 0.1%mol, C6H14 = 0.1%mol, C7H16 = 0.05%mol, C8H18 = 0.03%mol, C9H20 = 0.01%mol, C10H22 = 0.01%mol, H2O = 0.36%mol [2,29]
A3AirT = 25 °C; P = 1.013bar; N2 = 77.49%mol; O2 = 20.60%mol; H2O = 1.91%mol [29]
A4WaterT = 35 °C; P = 1.013bar; H2O = 100%mol
A5DMTM Reaction
(DMTM-SCW)
T = 410 °C; P = 250 bar; DMTM-SCW Reaction Feed: CH4/H2O mol ratio = 1;
Conversions: O2 = 100%; CH4 = 4.5% [26]; Selectivity: CO = 50%; CO2 = 22%; CH3OH = 28% [26]
A6Methanol–Water Separation System
(MWS)
Light-Ends Column (LEC): StagesTheoretical = 20; PTop = 7 bar; TTop = 35 °C; TReboiler = 139.6 °C;
MWSC-1: StagesTheoretical = 20; PTop = 1.013 bar; TTop = 72.7 °C; TReboile r = 100.8 °C;
MWSC-2: StagesTheoretical = 20; PTop = 1.013 bar; TTop = 64.3 °C; TReboiler = 100.8 °C;
Methanol Purity: ≥99.85%w/w (Grade AA) [30]
A7PCC-MEAAbsorber: StagesTheoretical = 40; PTop = 1.013 bar; TInlet-Top = 40 °C; Capture ≈ 90% [29];
Stripper: StagesTheoretical = 10; PTop = 1.013 bar; TTop = 35 °C; TReboiler = 102.6 °C [29];
Lean MEA: H2O = 64.75%w/w, MEA = 30.44%w/w, CO2 = 4.81%w/w [29];
Capture Ratio: CR = 13.7 kgSolvent/kgCO2; Stripping Heat Ratio: HR = 223.5kJ/molCO2 [29]
A8CO2 Dehydration Unit (CDU-TEG)Absorber: StagesTheoretical = 15; P = 50 bar; TInlet = 35 °C; Lean Solvent: TEG = 98.5%w/w;
Stripper: StagesTheoretical = 10; PTop = 1.013 bar; TTop = 35 °C; TReboiler = 138.9 °C [31]
A9Gas TurbineAero-Derivative Siemens SGT-A35; EfficiencyLHV = 33.8% [32];
PInlet = 25 bar; TFlue-Gas = 484 °C [32]
A10Steam TurbineHPS: PInlet = 24 bar; POutlet = 0.12 bar; TInlet = 459 °C; Outlet Quality = 95.0%
A11CompressorsStage Compression Ratio ≈ 3.0 [29]; Intercoolers: TGas-Outlet = 35 °C; ΔTApproach = 5 °C; ΔP = 0.5 bar
A12Adiabatic
Efficiencies
ηPumps = ηCompressors = ηSteam-Turbine = 75% [29];
Gas Turbines: ηAir-Compressor = 87.3%, ηExpander = 86.2%
A13HRSG∆PFlue-Gas = 0.025 bar; ∆PSteam = 0.05 bar; ΔTApproach = 25 °C [33]
A14ExchangersΔTApproach = 10 °C (gas–gas, liq–liq); ΔTApproach = 5 °C (gas–liq); ΔP = 0.5 bar [29]
A15Low-Pressure Steam (LPS)TLPS = 154.6 °C; PLPS = 5.4 bar
A16Steam ProductionPriority: LPSMWS + LPSPCC-MEA + LPSCDU-TEG; Surplus: HPSRankine-Cycle
A17Cooling Water (CW)CW: TInlet = 30 °C; TOutlet = 45 °C; PInlet = 4 bar; POutlet = 3.5 bar [29]
A18Sea WaterSW: TInlet = 25 °C (Tropical Latitudes); TOutlet = 35 °C; ΔPPump = 1.5 bar
A19CO2-to-EORT = 35 °C; P = 300 bar; Purity: CO2 ≥ 99.9%mol [29]
Table 2. Economic assumptions.
ItemDescriptionAssumption
B1Operation Lifetime50 y
B2Construction Time2y (40%FCI + 60%FCI)
B3Operation8400 h/y
B4i10%
B5DEPR (MMUSD/y)10%FCI
B6ITR34%
B7N° of Operators30 [40]
B8Labor Cost89,100 USD/(y.operator) [29]
B9CEPCI816 (2022) [41]
B10FCI GT (Siemens SGT-A35)13.5 MMUSD [32]
B11FCI Subsea HVDC Cables 1970 USD/(MW·km) [42]
B12FCI Rig Hull246 MMUSD [42]
B13NG Value2.58 USD/MMBTU [43]
B14MEA Price2 USD/kg [29]
B15TEG Price2.5 USD/kg [44]
B16Electricity Price0.0821 USD/kWh [43]
B17Methanol Price536 USD/t [44]
B18Oil Price80 USD/bbl [45]
B19EOR Yield1.5 bblOil/tCO2 [29]
Table 3. Techno-economic results.
DMTM-GTW-CCU SystemUtilities Demand
CW (t/h)LPS (t/h)Power (MW)
Gross Power (MW)564.5FCU3052.5-35.34
Power Demand (MW)107.4DMTM-SCW32.4--
Net Power (MW)457.1MWS2511.768.10.002
Methanol Production (t/h)2.2LECU---
CO2 Flue Gas (t/h) (PCC-MEA Feed)554.3NGCC Plant24,175.7-0.04
CO2 Emissions (t/h) (Atmosphere)63.0PCC-MEA32,445.01189.00.35
CO2 Injected (t/h) (EOR)491.3CU-13976.6-50.46
CDU-TEG40.31.90.01
SGU---
CU-22304.0-12.84
PCS--8.32
Total68,538.21259.0107.4
CDU-TEG Results Economic Results
PCC-MEA Results CO2 Inlet (ppm-mol H2O)2731.7FCI (MMUSD)1544.4
Flue Gas Feed (%molCO2)16.7CO2 Outlet (ppm-mol H2O)158.1COL (MMUSD/y)2.7
Clean Flue Gas (%molCO2)2.1Capture-Ratio (kgTEG/kgH2O)5.7CUT (MMUSD/y)0 *
CO2 to CU-1 (%molCO2)92.6Lean-Solvent (t/h)3.3CRM (MMUSD/y)135.5
Capture Ratio (kgSolvent/kgCO2)13.7Absorber: TTop (°C)/TBottom (°C)36.5/35.6REV (MMUSD/y)820.0
CO2Captured (tCO2/h)492.3Stripper: TFeed (°C)/TTop (°C)/TBottom (°C)78/35/139NPV50years (MMUSD)1020.9
Lean Solvent (t/h)6740.0Reboiler Duty (MW)1.1Payback (y)10
Absorber: TTop (°C)/TBottom (°C)61.8/61.2
Stripper: TFeed (°C)/TTop (°C)/TBottom (°C)83/35/103
Heat Ratio (kJ/molCO2) 224
Reboiler Duty (MW)694
* Plant is self-sufficient in terms of electricity, CW and LPS.
Table 4. Second Law analysis and lost work validation.
Second Law AnalysisLost Work Validation
System W ˙ M A X
(MW)
E ˙ E
(MW)
W ˙ C W E q
(MW)
W ˙ L P S E q
(MW)
W ˙ E q
(MW)
η % W ˙ L O S T
(MW) *
W ˙ L O S T
(MW) #
Divergence
(%)
FCU−16.4535.342.13-33.2149.5416.7616.79−0.20
DMTM-SCW47.3411.600.02-11.6224.5535.7235.710.02
MWS−0.010.0021.7512.0510.300.1210.2910.35−0.62
LECU0.22--0.040.0416.790.18190.18180.04
NGCC Plant1686.34552.8216.87222.58792.2746.98894.07893.490.06
PCC-MEA−28.230.3522.64210.24187.9515.02159.72158.980.46
CU-1−28.1950.462.78-47.6959.1219.4919.54−0.23
CDU-TEG−0.0030.010.030.330.311.110.3070.309−0.37
SGU0.40---0.000.000.400.400.00
CU-2−4.8212.841.61-11.2342.956.416.43−0.40
PCS23.99−8.32--−8.32−34.6932.3132.49−0.53
Sum Crosscheck 1175.661174.670.08
Overall1633.07457.09--457.0927.991175.981181.54−0.47
* via Equation (22a,b); # via Equation (23b,c).
Disclaimer/Publisher’s Note: The statements, opinions and data contained in all publications are solely those of the individual author(s) and contributor(s) and not of MDPI and/or the editor(s). MDPI and/or the editor(s) disclaim responsibility for any injury to people or property resulting from any ideas, methods, instructions or products referred to in the content.

