
Investigation on the Lubrication Heat Transfer Mechanism of the Multilevel Gearbox by the Lattice Boltzmann Method

1
College of Mechanical Engineering, Zhejiang University of Technology, Hangzhou 310014, China
2
Key Laboratory of Special Purpose Equipment and Advanced Processing Technology, Ministry of Education & Zhejiang Province, Hangzhou 310014, China
*
Authors to whom correspondence should be addressed.
Processes 2024, 12(2), 381; https://doi.org/10.3390/pr12020381
Submission received: 4 January 2024
/
Revised: 8 February 2024
/
Accepted: 11 February 2024
/
Published: 14 February 2024
Abstract
:In a gear transmission system in a closed space, the heat transfer between gears and fluids presents highly nonlinear characteristics due to the complex physical processes involved in heat exchange and fluid motion, and constructing and solving the thermodynamic model of the gearbox becomes a task that involves considerable difficulty. This paper takes a conical–cylindrical two-stage gearbox as the research object, proposes a fluid–solid coupled dynamics model based on the lattice Boltzmann (LBM) combined with the large eddy simulation (LES) method, and the adopted lattice model is the D3Q27 velocity model, which is used to numerically simulate the distribution of the flow field inside the gearbox and undertake in-depth research on the fluid motion law of the complex gear transmission system in the enclosed space. The model is solved to reveal the laws determining the gear speed and the effects of the lubricant’s dynamic viscosity and thermal conductivity coefficient on the gear heat dissipation efficiency. By adopting the lattice Boltzmann method, we can simulate the fluid flow and heat transfer inside the gearbox more efficiently, which provides a new way to closely understand the thermodynamic behavior of closed complex gear transmission systems. The application of this method is expected to provide strong support for thermal performance optimization and the design of gear transmission systems.
1. Introduction
In a transmission gearing system in a closed space, complex coupled flow occurs between the fluid and the solid (gears), accompanied by strong friction generating a large amount of heat. This process involves heat transfer phenomena between the gears and the fluid, forming a complex thermodynamic problem with highly nonlinear characteristics. The long-term accumulation of unreleased heat may lead to damage to gears, which in turn adversely affects industrial production [1,2,3]. Therefore, studying the fluid motion process during gearing in enclosed spaces is of great scientific research value in revealing the mechanism of heat transfer between gears and fluids. Research in this area can help us to understand the coupled flow behavior inside the gearbox, optimize the gear lubrication and cooling system, and improve the efficiency and durability of the transmission system.
Although heat transfer between fluids and gears occurs frequently in nature, it is a complex thermodynamic problem in which the parameters depend on the fluid’s properties, the gears’ input conditions, and the constrained physical space configuration [4,5,6]. To date, no theoretical model that has been developed can accurately and quantitatively analyze the heat transfer law; instead, it can only be obtained under certain ideal assumptions or in conjunction with experimental studies to yield its limited local characteristics [7,8,9,10]. Since many gear drives are designed for use in industrial production, research on the fluid’s heat transfer mechanism in enclosed spaces during gear drives offers theoretical underpinnings and technical support for these processes, as well as for the dynamic regulation of the lubricant field and the tracking of the mechanical system’s energy consumption.
Focusing on the above vital problems, international scholars have conducted much research. Based on the fluid distribution change of the gearbox during the operation of the transmission system, Miad Yazdani et al. put forward a state diagram that can comprehensively reflect the heat transfer mechanism of the gear teeth during the operation, constructed a transient temperature computation model of the gear teeth during the operation based on the state diagram, and experimentally verified this model [11]. S. Smilos et al. used SPH as the basis for simulation by varying the oil immersion depth and Reynolds number. Finally, they derived the churning speed cloud for the gears with a distribution cloud of the lubricant under various operating conditions [12]. Deshpande et al. proposed a two-way coupling method to predict the gear temperature of transmissions with oil-injected lubrication, and the prediction results had a good correlation [13]. Yang et al. obtained oil pressure and rotational speed cloud diagrams at each time point in the gear transmission system when the train was traveling in a smooth state by constructing a model of the stirring lubrication system of the gearbox of a high-speed train. They found that the flow state in the gear transmission system changed dramatically with the increase in rotational speed [14]. Bao et al. adopted the RNG-ε turbulence model and combined it with the grid reconstruction technique to numerically simulate and analyze the flow in the gearbox. A Multi-Reference Framework (MRF) model was used to investigate the steady-state temperature field of the gearbox. The simulated and experimental results were compared, and it was found that using the mesh reconstruction method, we can more effectively reveal the distribution of the oil and flow velocity fields at each time point. The MRF model can more accurately simulate the transient temperatures of each component in the gear train, thus providing a new method for analyzing the thermofluid flow problem in three-dimensional complex structures [15].
As can be seen from the above literature, although scholars at home and abroad have conducted much research into the optimization of heat transfer in transmission gears and have also achieved research results to a certain extent, the current research on the heat flow field distribution of complex gear transmission mechanisms in closed space is still relatively small. Most studies have mainly focused on single-stage gearing, and the results for multistage complex gearing still show some limitations. Therefore, a lattice Boltzmann technique-based gearbox modeling and solution method is adopted, which avoids the effective reduction of the time used for meshing by automatic point generation and the adaptive optimization function, and effectively observes the heat transfer mechanism between solids and fluids when there is a complex multistage gear movement in a closed space.
This paper takes a conical–cylindrical two-stage gearbox as the research object and proposes a fluid–solid coupled dynamics model based on the lattice Boltzmann (LBM) combined with the large eddy simulation (LES) method, and the adopted lattice model is the D3Q27 velocity model, which is used to numerically simulate the distribution of the flow field inside the gearbox and perform in-depth research on the fluid motion law of the complex gear transmission system in the enclosed space. The effects of different rotational speeds and steering methods on the thermal flow field inside the gearbox are compared, and the changes in the lubrication heat transfer mechanism under different lubricant conditions are further explored. This study provides strong theoretical and technical support for developing a deeper understanding of the heat transfer mechanism of complex gear transmission systems.
2. Mathematical Model and Solution Method
2.1. Lattice Boltzmann Model
The lattice Boltzmann method is a mesoscopic fluid dynamics research method that combines microscopic molecular dynamics and macroscopic continuum mechanics. It has gradually become an essential method for dealing with flow and heat transfer problems due to its advantages of concise and clear principles and broad applicability [16]. The main principle of this method is to transform macro-physics control equations into the rules of motion of microscopic particles, and develop a solution for the corresponding macroscopic equations through the collision, migration, and boundary processing of microscopic particles. The method has already achieved fruitful results in the fields of thermal fluid flow [17,18,19,20,21], multiphase flow [22,23,24,25,26], and porous media flow [27,28].
LBM uses the particle distribution function as the fundamental solution to the physical quantity. The basic idea is to perform discretization on the distribution function in a specific velocity space, to realize fluid flow evolution through collision and migration operations, and to obtain the macroscopic physical quantities of the flow field evolution through the statistics of the velocity distribution function of the grid nodes. The Boltzmann transport equation after velocity discretization is as follows [29,30,31]:
where fi is the velocity distribution function of the particle in direction i, ei the discrete velocity vector in direction i, and Ωi is the collision operator.
where fieq is the equilibrium distribution function affected only by the density ρ and velocity u; τ is the value of the relaxation time; wi is the value of the weights of the selected velocity vector ei; and cs is the sound velocity of the isothermal model.
After solving the discrete velocity distribution function at each location in space, the macroscopic physical quantities such as fluid density ρ, velocity vector u, pressure p, and viscous stress can be calculated using Equations (4) to (7):
where σβα is the viscous stress tensor; ci, ciα and ciβ are the sets of velocity vectors at different spatially oriented positions; τ is the relaxation time.
A critical factor in determining the distribution function of the particle is the lattice discrete velocity model of the LBM, which determines the direction of the particle’s motion. The discrete velocity DdQb models of the LBM (d represents the spatial dimensionality function, and b represents the counting subdistribution function) are D2Q7, D2Q9, D3Q15, D3Q27, and so on. In this paper, the D3Q27 model is used, i.e., 27 discrete velocity directions are used in three-dimensional space, as shown in Figure 1. Compared with the D3Q19 model, the discrete nodes of the D3Q27 model have higher degrees of freedom and higher computational accuracy, which can be used to better express the dynamic characteristics of the fluid.
2.2. Large Eddy Turbulence Modeling
Gearbox splash lubrication exists only in two phases: oil and gas. To analyze the oil distribution accurately, we select the VOF [32] (Volume of Fluid) two-phase flow model to analyze the internal flow field of the gearbox. The basic principle of the VOF model is to use the volume fraction (VOF function) to track and describe the interface location and morphology of different phases. The volume fraction in each grid cell represents the proportion of volume occupied by the liquid or gas phase, and takes a value between 0 and 1. When the volume fraction is 0, it indicates that the cell is in the gas phase; when the volume fraction is 1, it indicates that the cell is in the liquid phase; and when the volume fraction is between 0 and 1, it indicates that a mixture of the two phases is present.
In the VOF model, the flow behavior of different phases is calculated by solving the equations of conservation of mass, momentum, and energy. These equations include the continuity, momentum, and energy equations, and by imposing boundary and initial conditions, as well as by using appropriate numerical algorithms, the interfacial positions, morphological changes, and interaction processes of the two-phase flow can be simulated [33].
A turbulence model is introduced to ensure the accuracy of the computation while reducing the computational time. In this paper, the turbulence model is simulated by Large Eddy Simulation (LES), which introduces an additional viscosity, called turbulent eddy viscosity Vt, to simulate the sub-lattice turbulence. The LES scheme is the Wall-Adapting Wall Adaptive Localized Eddy (WALE) viscosity model, which provides consistent localized eddy viscosity and near-wall behavior [34,35], and the specific equations are as follows:
where Δf = CwΔx is the filter scale, Cw is the WALE model constant (usually 0.325), and Δx is the unit grid scale; Gdαβ is the trace-symmetric portion of the square of the velocity gradient tensor; Sαβ is the strain rate tensor at the decomposition scale; δαβ is the Kronedcker δ function; and α, β, and γ are the tensor subscripts.
After resolving the dynamic viscosity from the WALE model, the relaxation time τ can be obtained from the macroscopic behavior by determining the dynamic shear viscosity v using LBM:
Considering that the numerical solution of boundary layer turbulence requires many grid cells, the wall function can be used to solve the near-wall boundary layer velocity.
2.3. Heat–Fluid–Solid Coupling Solution Process
The key to the thermodynamic analysis of the enclosed space during gear transmission lies in the heat transfer between the fluid and the solid. The research method in this paper is shown in Figure 1. As can be observed, in Figure 2, in the analysis of the flow field inside the gearbox, the differential equation is discretized into a finite difference equation and solved to obtain the oil and gas mixture distribution field, pressure field, and velocity field, which in turn leads to convective heat transfer inside the gearbox. In the thermal analysis inside the gearbox, the gear is the body heat source, and heat transfer is carried out by heat conduction, convection, and convective heat transfer at each fluid–solid contact surface. The energy equations for the fluid and solid are solved to obtain the temperatures of the two-phase fluid and solid components. The heat flux is transferred between the fluid and the solid while the above iterative process continues. In the thermal analysis of the box, the heat flux density on the outer surface of the fluid domain after thermal equilibrium in the box is applied as a heat source on the inner wall surface of the box, and the heat transfer is carried out by heat conduction and convective heat transfer. The solid energy equation is solved to finally obtain the temperature field of the box [36].
3. Numerical Model
3.1. Physical Object Model
For the research topic of this paper, a two-stage conical–cylindrical gear transmission with a total transmission ratio of 8 is designed. The high-speed stage comprises a pair of bevel gears with a ratio of 2, and the low-speed stage comprises a cylindrical spur gear transmission with a ratio of 4. The input power is 5 KW, and the speed of the input gear is 4000 rpm. The materials of high-speed-stage gears are all 40 Cr, and the materials of low-speed-stage gears are all 45#. In this paper, the gearbox model is simplified appropriately, and the box is simplified into a rectangular body model based on retaining the original length, width, and height characteristics of the box. To study the motion process of the fluid in the closed space during gear transmission, the geometric dimension model of the finite physical space is established, as shown in Figure 3. The specific parameters of the main gears are shown in Table 1. Based on the above geometric dimension model, the gear transmission dynamics model of the closed space is established, as shown in Figure 3. The conical pinion gear of the input shaft and the meshing conical large gear, and the cylindrical spur gear of the low-speed stage and the cylindrical spur gear of the high-speed stage are named G1, G2, G3, and G4, respectively.
Based on the above model of geometric dimensions, the motion of the fluid in the enclosed space during gear transmission is studied, and the model is divided into three interfaces: lubricating oil, air and gear. The total height of the oil is 21 mm, the demarcation line between oil and air is located 4 mm below the centerline of the gear, and the rest of the box is air. The initial temperature of the oil is 20 °C and it is in a stationary state.
3.2. Fluid Dynamics Modeling and Initial Boundary Conditions
Meshing is used to discretize the container model, and it deals with finite space. Most traditional types of CFD software, such as STAR-CCM+2020, Phoenics 2019, and ANSYS Fluent 2022 R2, use the finite volume method [37,38,39] for meshing. Researchers need to spend much time delineating the mesh when using it, and the reliability of the calculation results is highly dependent on the mesh quality. However, the division size is directly related to the time and accuracy of numerical calculations. The calculation accuracy does not increase with the reduction in the grid size [40,41,42,43,44]. Reducing the grid size will increase the consumption of computational resources and computational time. Mesh division with high quality and an appropriate scale can also improve the numerical accuracy and computational efficiency. XFlow 2020X is a new generation of CFD software based on lattice Boltzmann technology, which adopts the automatic lattice-like meshing method based on an octree structure, i.e., a multiplication factor of 2, to adapt to the spatial and temporal scales, and LBM multi-level lattice encryption. It is an automatic point lattice generation and adaptive optimization function that avoids manual grid division and effectively shortens pre-processing time [45,46,47,48,49,50]. It can adapt to the complex geometric characteristics of different computational objects in architectural engineering, and has highly efficient and stable computational efficiency and good parallelism.
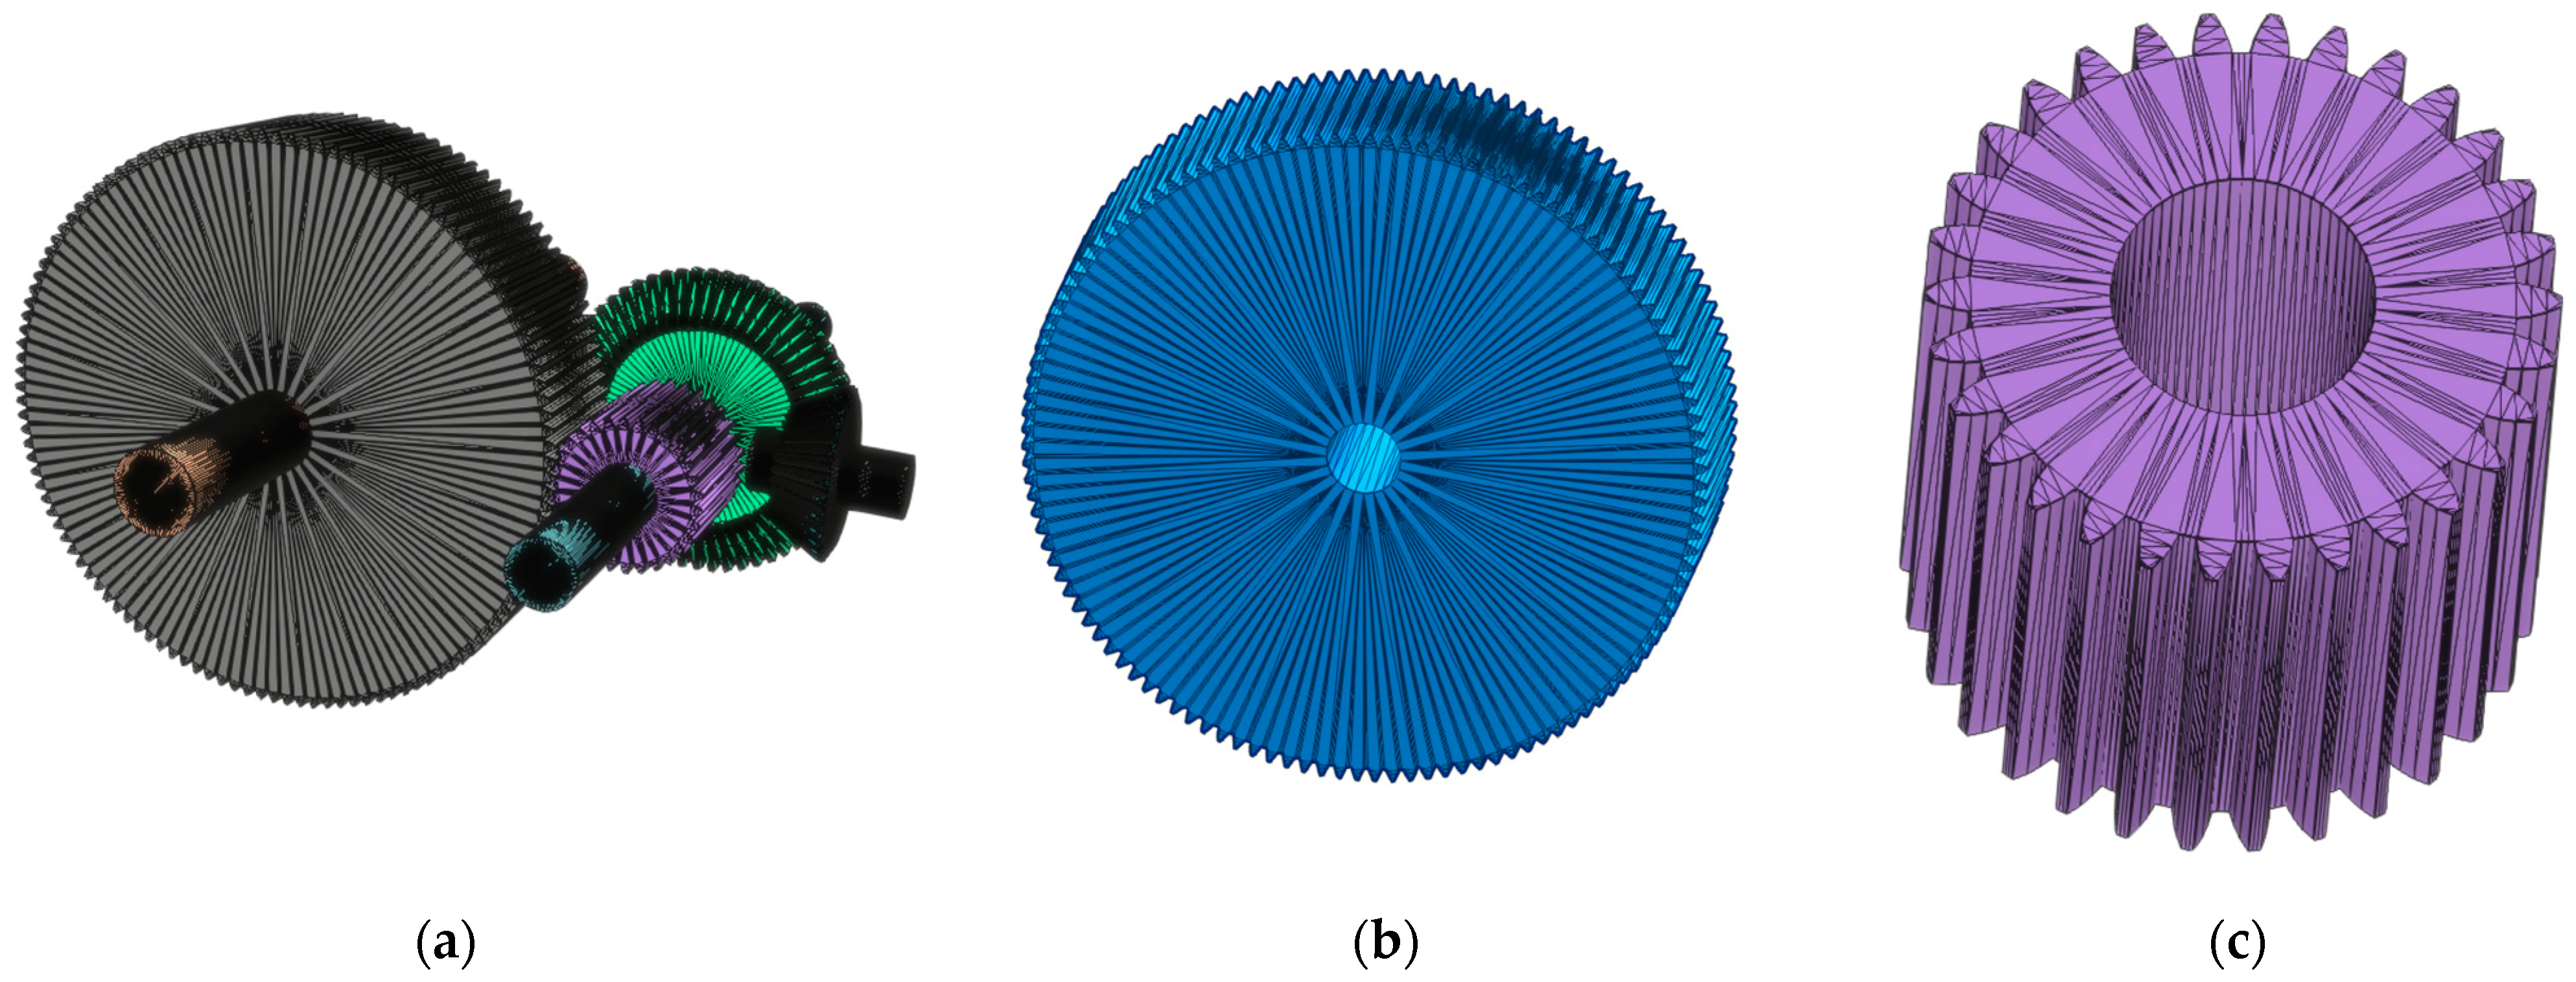
As seen from the mesh division in Figure 4, the mesh division of the shaft mainly employs a structured mesh; the model of mesh division is more uniform than others, and the distribution is roughly even. Due to the geometry, the bevel gear is relatively more complex, with curved surfaces, angles, and other characteristics relevant to the division of the primary use of unstructured mesh. Due to the significant variation in flow velocity on the bevel gear’s surface, the boundary layer mesh is generated in the region near the solid surface. For the meshing of cylindrical spur gears, a structured mesh is used. The meshes are denser near both gears’ tooth gaps and tooth surfaces.
The fluid region is interconnected with the gear model, and the fluid and the solid engage in the mutual transfer of momentum and energy [51,52,53,54,55]. That is, when the gears mesh, they contact with and rub against each other, generating specific pressures and moments. These pressures and moments act on the lubricant, forming a lubricant film of a certain thickness on the contact surfaces of the gears. With the rotation of the gear, the lubricant film will be squeezed, twisted, and sheared so that the lubricant is stirred. Moreover, when the gear rotates, the rotation and meshing process of the gear will produce an eddy current effect so that the lubricant in the gearbox forms a rotating or eddy flow state; this eddy current effect will also cause the lubricant to churn. At the same time, the lubricant takes away the heat generated by the gears by absorbing and conducting heat.
4. Numerical Simulation Results
4.1. Fluid Distribution Analysis
From 0 s to 2 s, the variation in the distribution of the fluid in the gearbox case at different moments is shown in Figure 5.
It can be observed from the above description and illustration that from a time point of 0.01 s, the lubricant starts to be stirred as the bevel gear rotates. The lubricant at the spur gear has not yet been stirred at this stage due to the low rotation speed of the output spur gear. During the period from 0.01 s to 0.1 s, the lubricant at the spur gear is gradually stirred, a small portion of which enters the gear mesh, while a large amount of lubricant has already been stirred at the bevel gear. This lubricant continues to move in the direction of gear rotation and enters the gear mesh. Between 0.1 s and 0.15 s, a portion of the lubricant on the tooth surfaces begins to dislodge and surge toward the top of the case due to the high-speed rotation of the bevel gear. Between 0.15 and 0.2 s, a portion of the lubricant on the spur gears begins to come off the teeth and rush toward the top of the case. This process indicates a gradual increase in the volume of lubricant being churned in the gearbox.
When the gearbox is operating, the distribution of lubricating oil in the gear meshing area inside the box can be used as a fundamental indicator to evaluate the lubrication effectiveness of gears under different operating conditions, and to assess the lubrication performance [19]. Figure 6 shows the lubricant distribution in the gear meshing region during lubrication. As shown in Figure 6a, when the gearbox is working at the beginning, there is only a sporadic presence of lubricant oil at G1 and G2 due to the effect of gear steering, while the content of lubricant oil in the gear meshing region at G3 and G4 is rich. With the gear operation, the content at G3 and G4 of lubricant oil is rich and uniform; at G1 and G2 at the gear meshing area, the content of lubricant oil gradually increased, but remained slightly lower than at G3 and G4, with G1 showing more. Nevertheless, enough oil is distributed on the surface of each gear tooth at the mesh. The gears continue to run, and oil is abundant in the G1 and G2 meshing areas and the G3 and G4 meshing areas. As a result, the oil thoroughly lubricates the gear mesh area.
The high-speed rotation of the gears in the box will cause the lubricant and air inside the box to move together. Since the lubricant and air in the box initially have no kinetic or potential energy, they are in passive motion. During this passive motion, the fluid creates a specific resistance that impedes the rotation of the gears. The change in resistance moment of the four gears is monitored. Real-time resistance moment values are output, as shown in Figure 7. From the figure, it can be seen that the resistance moment starts with a sharp rise and then a sharp fall, with huge fluctuations, followed by a gradual increase in the resistance moment, and finally a slight vibration around the steady state mean value. This is because, when the gearbox starts to work, the lubricant distribution inside the box is relatively chaotic, resulting in sharp fluctuations in the overall resistance moment value of the gear. With the passage of time, the lubricant inside the box gradually tends to stabilize, and the flow field inside the box also begins to enter a steady state; the fluctuation of the resisting moment gradually decreases, and the power loss inside the box gradually tends to stabilize.
4.2. Effect of Speed and Steering on Heat Transfer in the Gearbox
Speed and steering are crucial for studying heat flow coupling and gear power loss. Therefore, it is significant to study the influence of speed and steering on transmission lubrication performance during the lubrication work of electric vehicle transmission. Six different working conditions are obtained by changing the input shaft and steering speed, respectively. The rotational speeds are 2000 r/min, 4000 r/min, and 8000 r/min, respectively.
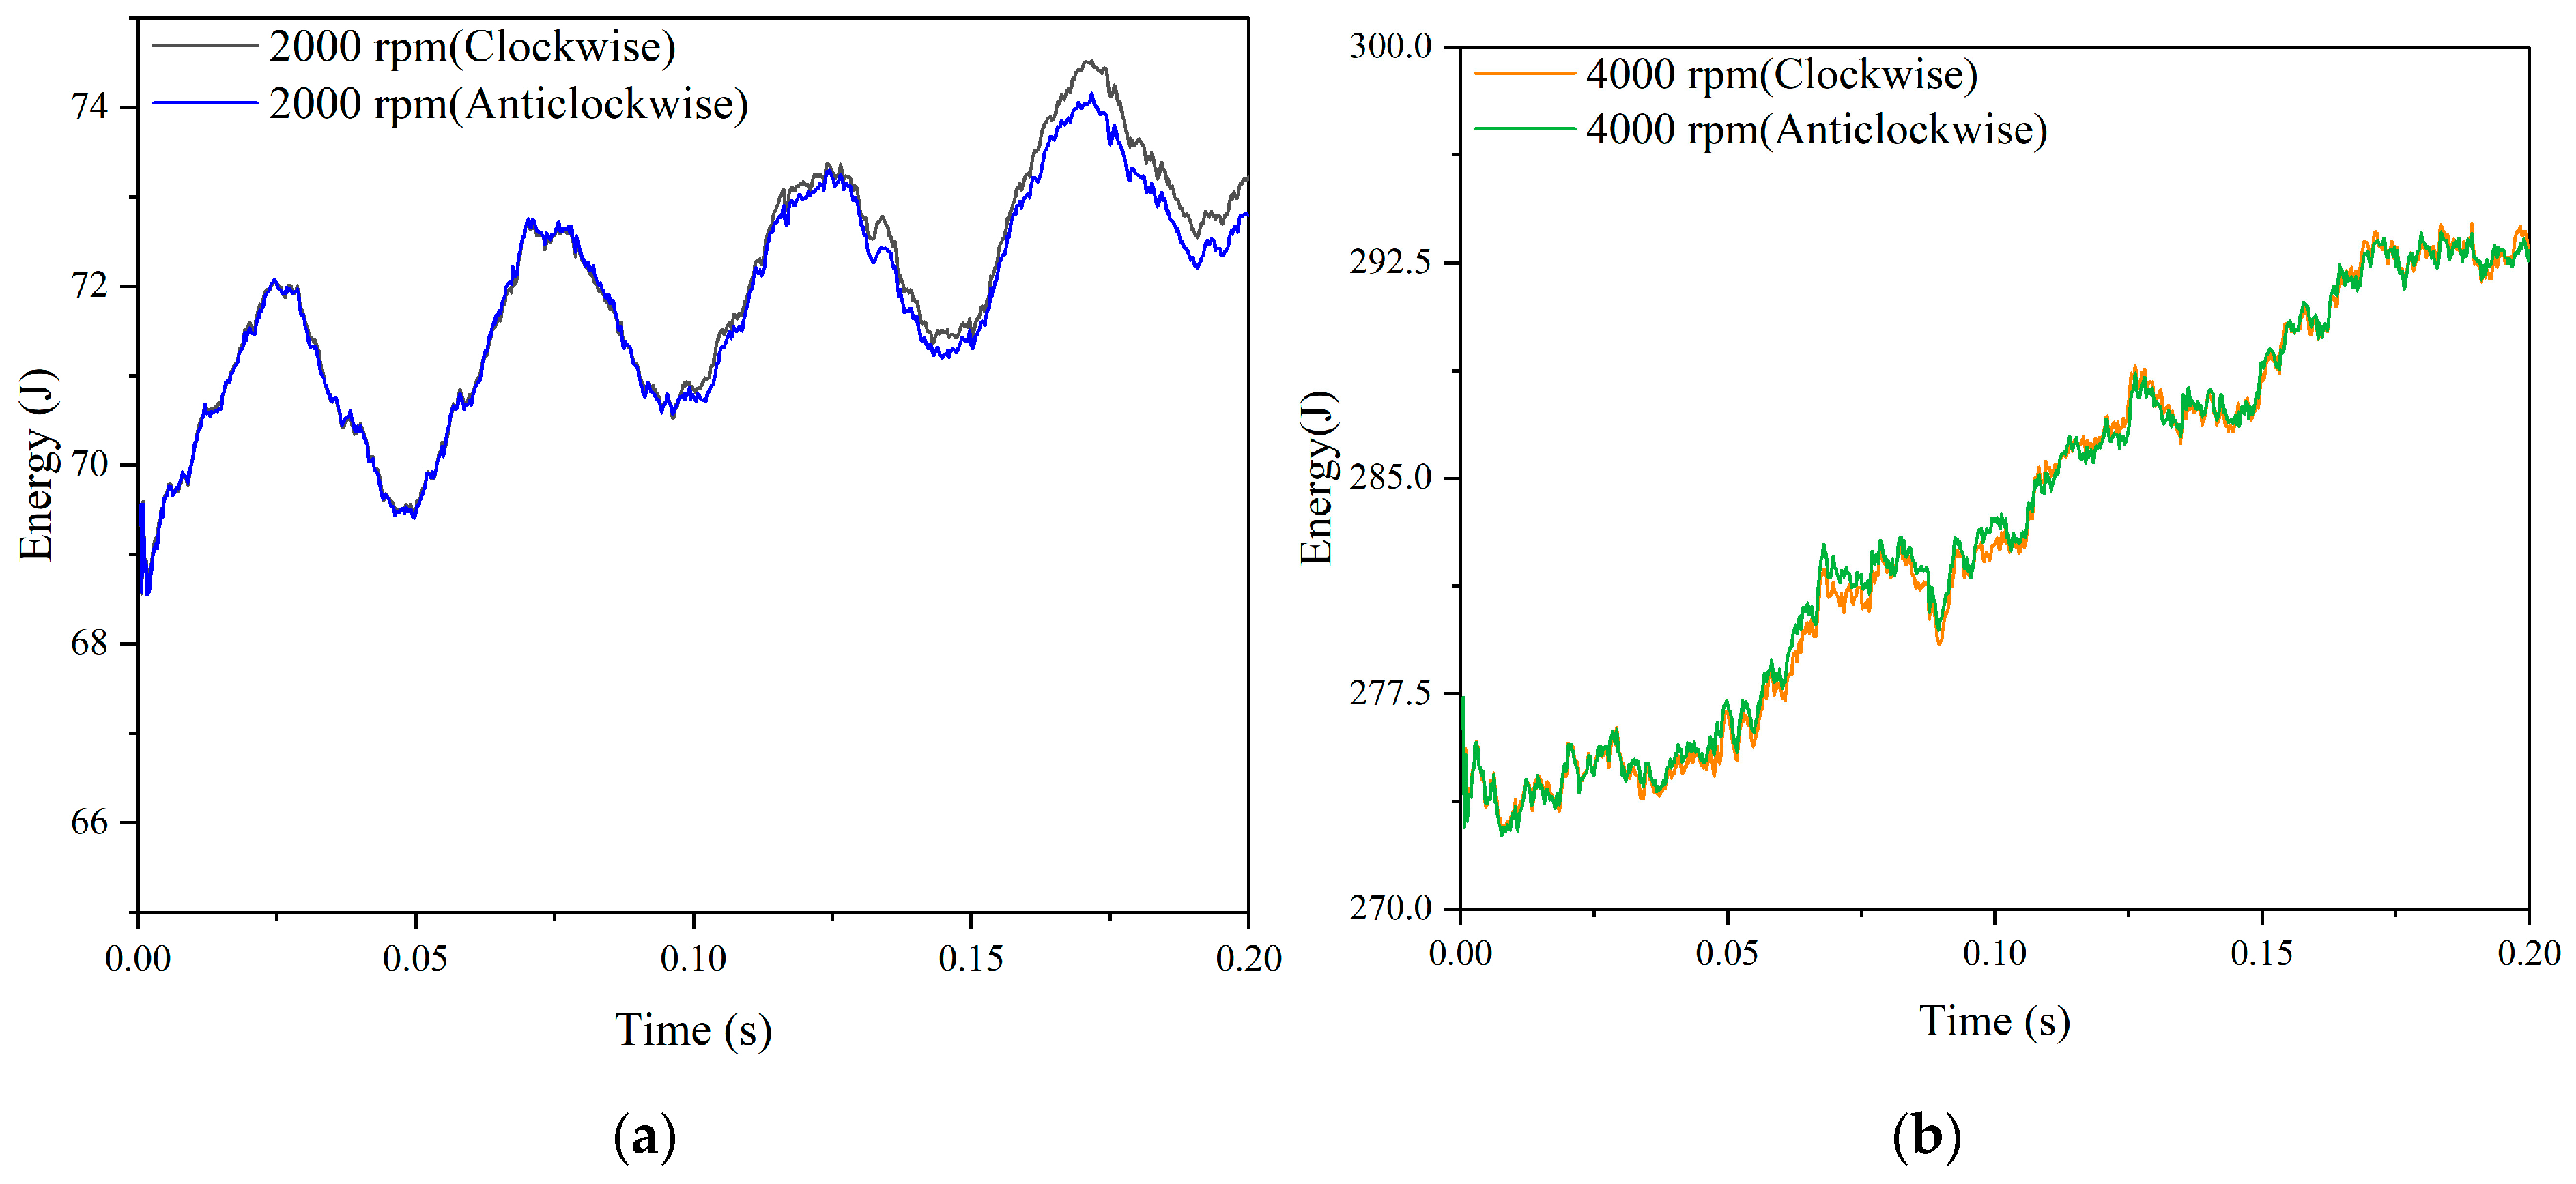
The total kinetic energy of the fluid in the gearbox is measured separately for different operating conditions, as shown in Figure 8.
By observing the figure, we can see that when all other conditions remain constant, the total kinetic energy of the fluid increases significantly as the rotational speed increases. However, when other conditions are kept constant, and only the steering is changed, the total kinetic energy of the fluid does not differ much. When the gear speed increases, the friction frequency between gear and gear, and between gear and fluid, increases, and the power of the transmission system increases. The heat emitted by the gear increases significantly. When the input gear is turned counterclockwise, the total heat generated by the gear is slightly greater than the total heat generated by the gear set when the input gear rotates clockwise, but the difference in the heat generated is sufficiently small to be ignored.
To verify this conjecture, monitoring points were established at distances of 10 mm, 30 mm, and 50 mm below the output gear, as illustrated in Figure 9. The fluid temperature variation at each monitoring point was then measured, resulting in the temperature change function depicted in Figure 10.
Observing Figure 10, it is evident that changing the direction and torque of the input shaft will have a certain impact on the heat transfer and heat dissipation in the lubricating oil. By separately analyzing Figure 10a–c, it can be seen that when the input gear rotates counterclockwise, initially, there is little difference in temperature between the lubricating oil and the clockwise gear. As the flow field evolves, the temperature difference continues to increase, and eventually, the temperature of the lubricating oil when rotating counterclockwise will be significantly higher than when rotating clockwise.
Table 4 shows the results in terms of the temperature increase under different gear rotation conditions. Combining the three graphs and data analysis shows that when the rotational speed increases, the temperature of the lubricant rises significantly, as the heat emitted from the gears increases with the gear rotation. The overall temperature rise of the transmission under the condition of the counterclockwise rotation of the gear is significantly higher than under the condition of the clockwise rotation of the gear, but the temperature difference between clockwise and counterclockwise gear steering is fixed, and it will not increase with the increase in rotational speed. This is because when the input shaft gear rotates counterclockwise, the fluid climbs along the contact area between the gears, and this contact area forms a relatively small gap, so the fluid will be subjected to greater compression and friction, and the amount of heat absorbed increases.
4.3. Influence of Lubricant Dynamic Viscosity and Heat Transfer Coefficient on Heat Transfer in Gearboxes
In order to explore the effect of the fluid’s properties on the heat transfer of the fluid in the enclosed space during gearing, six different working conditions were obtained by changing the thermal conductivity and dynamic viscosity of the lubricant, respectively, while keeping other qualities constant. Monitoring points were set up at 20 mm directly below the large and small gears of the low-speed stage, respectively, and the temperature change at each monitoring point was measured to obtain the temperature change function shown in Figure 11. From Figure 11, Table 5 and Table 6, it can be seen that changing the dynamic viscosity and thermal transfer coefficient of the lubricant will affect the heat dissipation effect of heat transfer in the lubricant. As the dynamic viscosity increases, the fluid’s warming decreases slowly, and the dynamic viscosity has a limited effect on the temperature rise. In contrast, as the thermal conductivity increases, the fluid’s warming increases dramatically. The thermal conductivity has a significant effect on the temperature rise. The higher the thermal conductivity, the lower the dynamic viscosity, and the better the fluid’s heat dissipation effect on the gear.
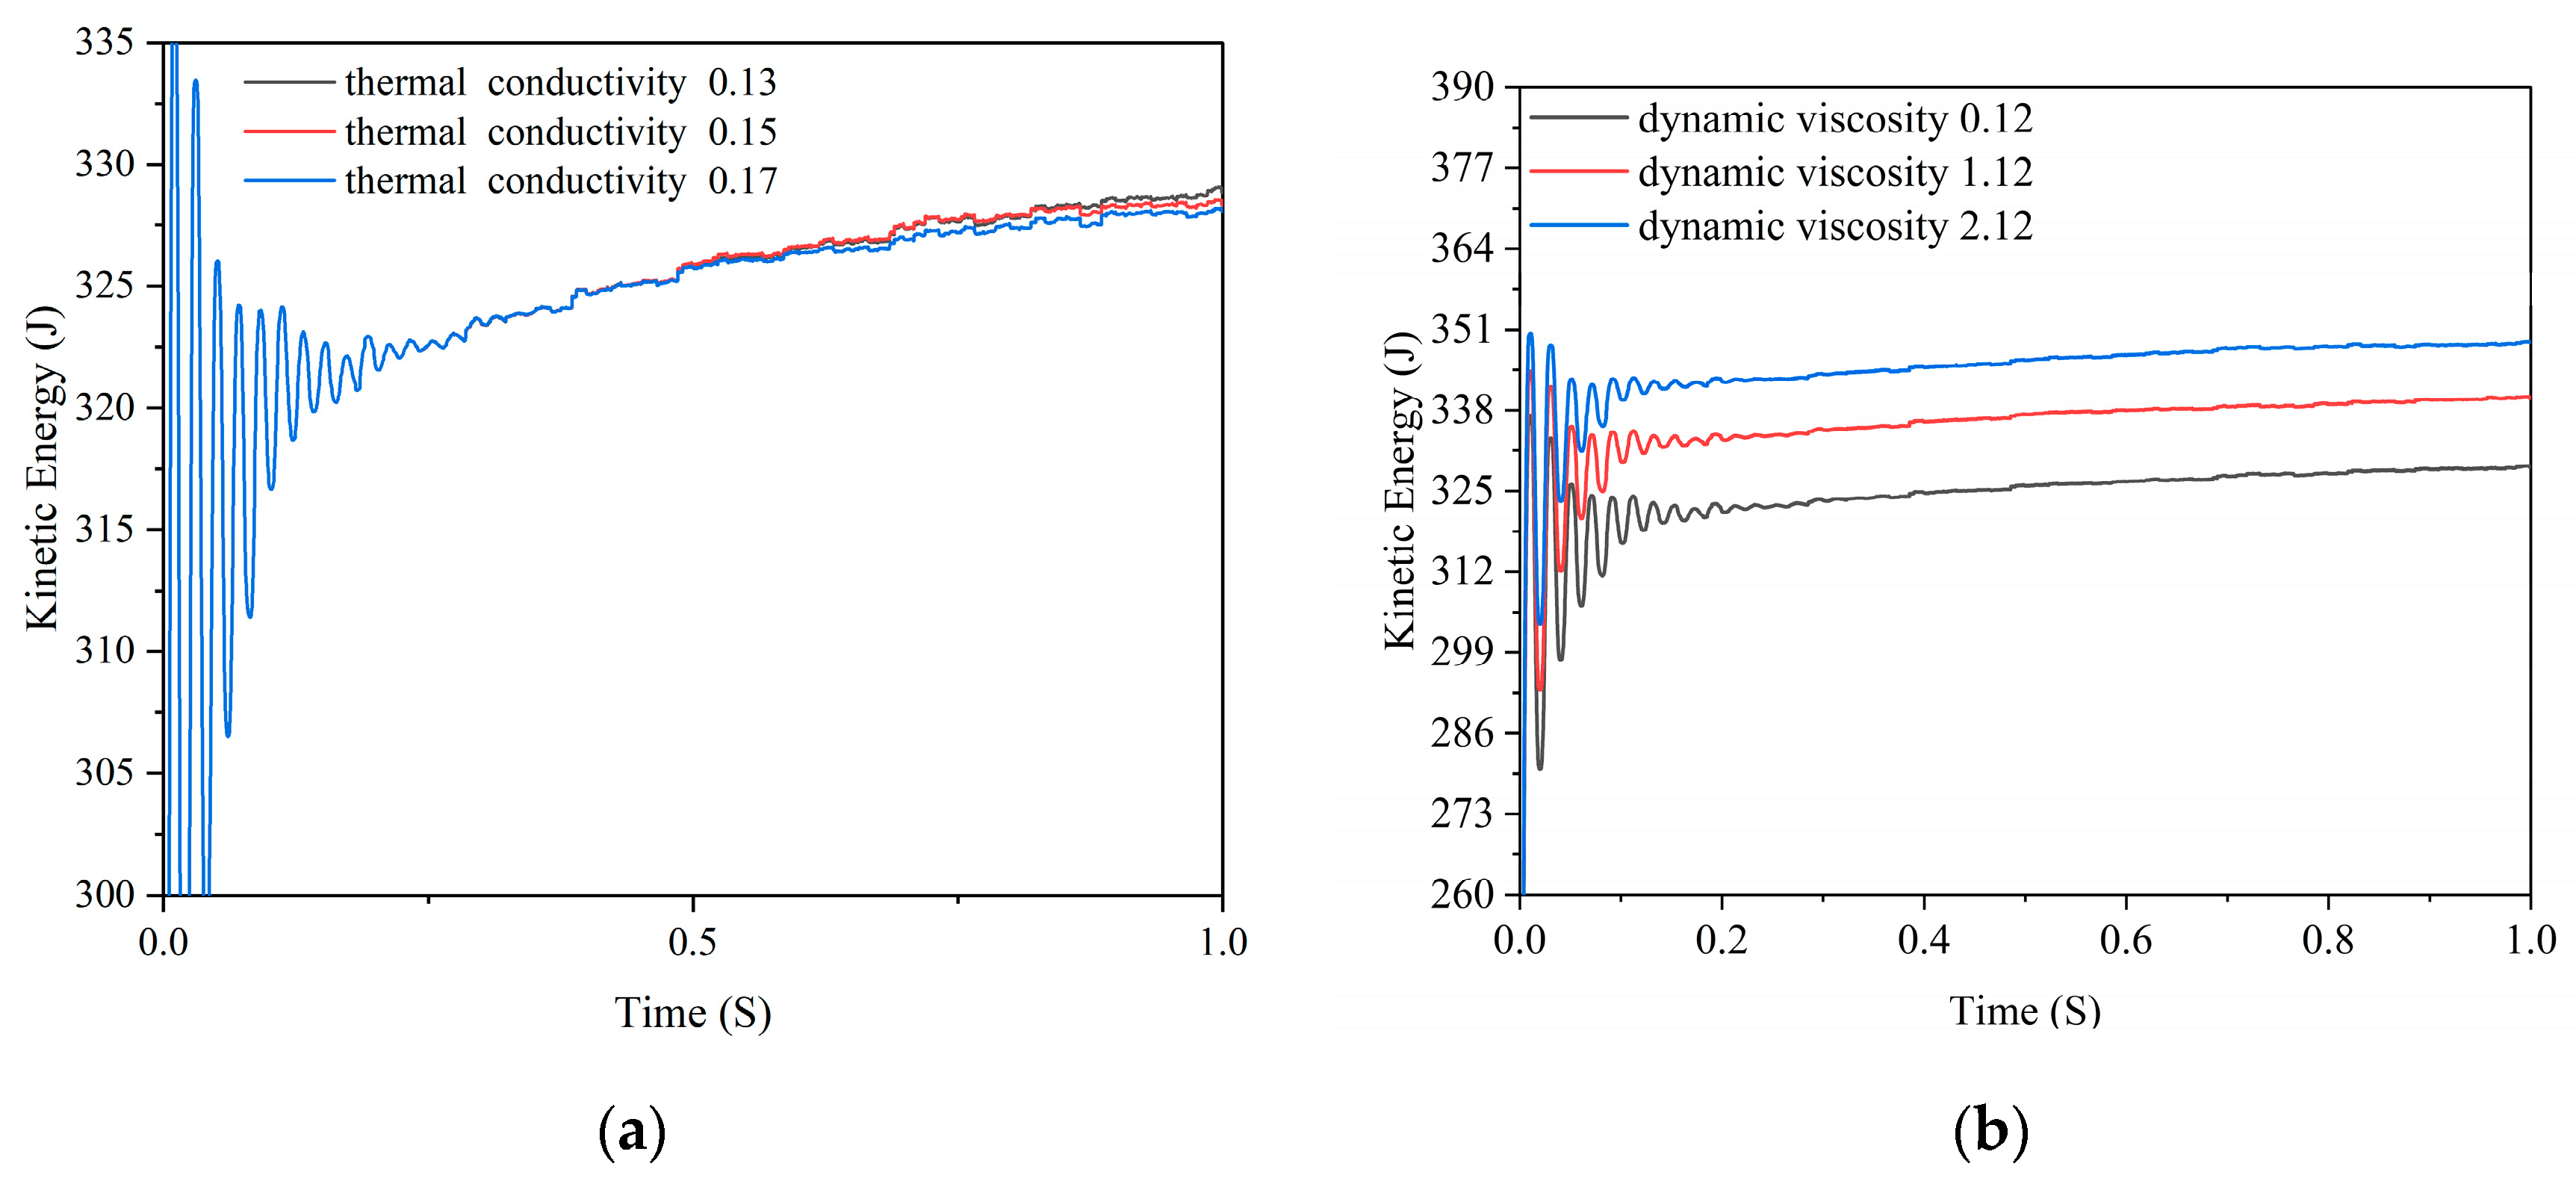
To further explore the effects of different fluid qualities on the fluid motion during gearing in a confined space, the variations in fluid kinetic energy were obtained, as shown in Figure 12. It can be seen that the kinetic energy transferred to the fluid by the gear increased as the heat transfer coefficient decreased with the increase in dynamic viscosity.
The heat transfer process of the lubricant is divided into two essential parts to improve the heat transfer efficiency. First, we consider the gear agitation portion, in which the lubricant and the gear wall are in contact with each other, and heat is transferred from the gear to the lubricant. Second, the heat is dispersed into the lubricant as it falls back into the gearbox, further equalizing the temperature distribution. The drastic warming of the gear meshing region is effectively avoided through heat transfer.
By increasing the thermal conductivity of the lubricant, we have enhanced the two primary heat transfer processes to ensure rapid heat transfer. Adjusting the dynamic viscosity of the lubricant further optimizes the warming phenomenon. We observed that with reduced dynamic viscosity, the increase in fluid kinetic energy resulted in a longer contact time between the gear and the lubricant, which allowed the heat transfer process to be accomplished more efficiently. These improvements not only increase the overall heat transfer efficiency of the lubricant but also help to maintain temperature equilibrium in the gearbox, preventing dramatic warming.
5. Conclusions
The study of heat transfer mechanism in an enclosed space during gear transmission has crucial scientific research value and engineering application prospects. This paper proposes an approach to modeling and solving gear and fluid heat transfer in closed spaces to study the fluid motion process and heat transfer mechanism under different conditions. The main conclusions are as follows:
- (1)
- The lubricating oil thoroughly lubricates the gear meshing area, and is uniformly distributed therein. Initially, some gears are immersed in oil, and gear rotation must overcome oil resistance, resulting in significant power loss. As the gear speed increases, oil splashing occurs gradually, and the degree of oil resistance that is overcome by gear rotation becomes smaller and smaller until a steady state is reached;
- (2)
- The temperature rise curve shows that the gears release more heat during operation, resulting in an increase in lubricant temperature. As the gear speed increases, the lubricant temperature rises significantly, and the overall temperature rises sharply under counterclockwise rotation conditions;
- (3)
- The characteristics of the lubricant itself also affect the heat transfer mechanism. As the lubricant dynamic viscosity decreases, the rate of fluid temperature rise increases slightly, but the degree of fluid kinetic energy enhancement decreases significantly. As the fluid heat transfer coefficient rises, the heat absorbed by the fluid increases, the temperature rises, and the increase in fluid kinetic energy decreases slightly. That is, under the premise of keeping the other properties unchanged, for a certain range of increase in the thermal conductivity of the lubricant, reducing the kinetic viscosity can effectively improve the lubricant’s heat dissipation effect on the gear.
The construction and solution of a thermodynamic model for gears and fluids in a gearbox is a very challenging problem. In this paper, a coupled fluid structure dynamics model of a gearbox is constructed and simulated based on the lattice Boltzmann model (LBM) combined with the Large Eddy Simulation (LES) method. This combination utilizes the advantages of LBM in dealing with complex boundaries and efficient parallel computation, while the LES method is used to improve the accuracy of turbulence simulation. However, in this simulation, we implemented a simplified version of the gearbox model, which introduced uncertainties related to the assumptions made about the model. Concurrently, the experiment faced constraints due to software capabilities and computational resources, potentially causing computational approximations or errors. Together, these factors contribute to what is known as Type B uncertainty.
The theoretical aspect can provide a useful reference for research into the energy transfer and thermodynamic characteristics involved in the fluid during gear movement in the closed space; in the technical aspect, it can provide a useful reference for improving the heat dissipation efficiency of the gears and prolonging the service life of the gearbox, and it has a better prospective engineering application in the fields of the automobile industry and the aerospace industry.
Author Contributions
Conceptualization, Q.L. and L.L.; article identification, screening, retrieval, selection, and analysis, Q.L.; formal analysis and investigation, Q.L.; writing—original draft preparation, Q.L. and P.X.; tables and figures generation, Q.L. and P.X.; review and editing, Q.L., L.L., W.X., D.T. and P.X.; supervision, L.L.; funding acquisition, L.L. All authors have read and agreed to the published version of the manuscript.
Funding
This work was supported in part by the Zhejiang Provincial Natural Science Foundation under Grant No. LQ23E050017; Zhejiang Province Postdoctoral Scientific Research Preferred Funding Project under Grant No. ZJ2022068.
Data Availability Statement
The original contributions presented in the study are included in the article, further inquiries can be directed to the corresponding authors.
Conflicts of Interest
The authors declare no conflicts of interest.
References
- Tashakori-Asfestani, F. Effect of inter-particle forces on solids mixing in fluidized beds. Powder Technol. 2023, 415, 118098. [Google Scholar] [CrossRef]
- Li, L.; Li, Q.H.; Ni, Y.S.; Wang, C.Y.; Tan, Y.F.; Tan, D.P. Critical penetrating vibration evolution behaviors of the gas-liquid coupled vortex flow. Energy 2024, 292, 130236. [Google Scholar] [CrossRef]
- Yan, Q.; Fan, X.H.; Li, L.; Zheng, G.A. Investigations of the mass transfer and flow field disturbance regulation of the gas–liquid–solid flow of hydropower stations. J. Mar. Sci. Eng. 2024, 12, 84. [Google Scholar] [CrossRef]
- Wu, J.F.; Li, L.; Li, Z.; Wang, T.; Tan, Y.F.; Tan, D.P. Mass transfer mechanism of multiphase shear flows and interphase optimization solving method. Energy, 2024; in press. [Google Scholar] [CrossRef]
- Chen, J.; Ge, M.; Li, L.; Zheng, G. Material transport and flow pattern characteristics of gas–liquid–solid mixed flows. Processes 2023, 11, 2254. [Google Scholar] [CrossRef]
- Yin, Z.C.; Ni, Y.S.; Li, L.; Wang, T.; Wu, J.F.; Li, Z.; Tan, D.P. Numerical modelling and experiment investigation for two-phase sink vortex and its fluid-solid vibration characters. J. Zhejiang Univ. Sci. A 2024, 25, 47–62. [Google Scholar] [CrossRef]
- Wang, L.J.; Zhang, S.; Cui, T. Kinetic characteristics of a bionic screen with continuous variable amplitude from front to rear and behaviour of maize mixture on the screen. Powder Technol. 2023, 424, 118370. [Google Scholar] [CrossRef]
- Naderi, V.; Farsadizadeh, D.; Lin, C.; Gaskin, S. A 3D Study of an Air-Core Vortex Using HSPIV and Flow Visualization. Arab. J. Sci. Eng. 2019, 44, 8573–8584. [Google Scholar] [CrossRef]
- Ezure, T.; Kimura, N.; Miyakosh, H.; Kamide, H. Experimental investigation on bubble characteristics entrained by surface vortex. Nucl. Eng. Des. 2011, 241, 4575–4584. [Google Scholar] [CrossRef]
- Saleem, A.S.; Cheema, T.A.; Ahmad, S.M.; Chatta, J.A.; Akbar, B.; Park, C.W. Parametric study of single-stage gravitational water vortex turbine with cylindrical basin. Energy 2020, 200, 117464. [Google Scholar] [CrossRef]
- Miad, Y.; Marios, C.S. A novel approach for modeling the multiscale thermo-fluids of geared systems. Int. J. Heat Mass Transf. 2014, 72, 517–530. [Google Scholar]
- Simon, V.V. Improvements in the mixed elastohydrodynamic lubrication and in the efficiency of hypoid gears. Proc. Inst. Mech. Eng. Part J. Eng. Tribol. 2020, 234, 795–810. [Google Scholar] [CrossRef]
- Deshpande, S.; Joshi, H.; Madhavan, J. Two-Way Coupled CFD Approach for Predicting Gear Temperature of Oil Jet Lubricated Transmissions. SAE Int. J. Commer. Veh. 2018, 11, 163–170. [Google Scholar] [CrossRef]
- Yang, Z.K.; Mu, B.R.; Zhang, X.X. Simulation study on the flow field of high-speed train gearbox. Locomot. Electr. Transm. 2017, 02, 57–59. [Google Scholar]
- Bao, H.Y.; Fan, Y.; Zhu, R.P. Simulation and analysis of flow field and temperature field of gearbox immersion oil lubrication. J. Cent. South Univ. 2019, 50, 1840–1847. [Google Scholar]
- Hep, C.L.; Muy, T. Lattice Boltzmann method simulation of ice melting process in the gas diffusion layer of fuel cell. Int. J. Heat Mass Transf. 2020, 149, 119121. [Google Scholar]
- Javadzadegan, A.; Joshaghani, M.; Moshfegh, A.; Akbari, O.A.; Afrouzi, H.H.; Toghraie, D. Accurate meso-scale simulation of mixed convective heat transfer in a porous media for a vented square with hot elliptic obstacle: An LBM approach. Phys. A Stat. Mech. Its Appl. 2020, 537, 122439. [Google Scholar] [CrossRef]
- Arab, A.; Javadi, M.; Anbarsooz, M.; Moghiman, M. A numerical study on the aerodynamic performance and the self-starting characteristics of a Darrieus wind turbine considering its moment of inertia. Renew. Energy 2017, 107, 298–311. [Google Scholar] [CrossRef]
- Kim, D.; Kim, D. Free-surface vortex formation and aeration by a submerged rotating disk. Chem. Eng. Sci. 2021, 243, 116787. [Google Scholar] [CrossRef]
- Chen, J.C.; Li, T.Y.; You, T. Global-and-Local Attention-Based Reinforcement Learning for Cooperative Behaviour Control of Multiple UAVs. IEEE Trans. Veh. Technol. 2023; in press. [Google Scholar] [CrossRef]
- Du, X.Z.; Zhang, M.; Chang, H.; Wang, Y.; Yu, H. Micro windmill piezoelectric energy harvester based on vortex- induced vibration in tunnel. Energy 2022, 238, 121734. [Google Scholar] [CrossRef]
- Jin, Z.; He, D.; Wei, Z. Intelligent fault diagnosis of train axle box bearing based on parameter optimization VMD and improved DBN. Eng. Appl. Artif. Intell. 2022, 110, 104713. [Google Scholar] [CrossRef]
- Tan, Y.F.; Ni, Y.S.; Xu, W.X.; Xie, Y.S.; Li, L.; Tan, D.P. Key technologies and development trends of the soft abrasive flow finishing method. J. Zhejiang Univ. Sci. 2023, 24, 1064. [Google Scholar] [CrossRef]
- Wang, X.Y.; Gong, L.; Li, Y.; Yao, J. Developments and applications of the CFD-DEM method in particle-fluid numerical simulation in petroleum engineering: A review. Appl. Therm. Eng. 2022, 222, 119865. [Google Scholar] [CrossRef]
- Wu, J.; Xu, S.; Zhao, N. A hybrid method for multiphase flows with large density ratio. Chin. J. Comput. Phys. 2013, 30, 1–10. [Google Scholar]
- Li, L.; Gu, Z.H.; Xu, W.X.; Tan, Y.F.; Fan, X.H.; Tan, D.P. Mixing mass transfer mechanism and dynamic control of gas-liquid-solid multiphase flow based on VOF-DEM coupling. Energy 2023, 272, 127015. [Google Scholar] [CrossRef]
- Wang, K.; Sun, W. An updated Lagrangian LBM–DEM–FEM coupling model for dual-permeability fissured porous media with embedded discontinuities. Comput. Methods Appl. Mech. Eng. 2019, 344, 276–305. [Google Scholar] [CrossRef]
- Wang, Y.D.; Chung, T.; Armstrong, R.T. ML-LBM: Predicting and accelerating steady state flow simulation in porous media with convolutional neural networks. Transp. Porous Media 2021, 138, 49–75. [Google Scholar] [CrossRef]
- Son, J.H.; Park, I.S. Prevention of air entrainment during liquid draining using disc-type vortex suppressor. J. Mech. Sci. Technol. 2018, 32, 4675–4682. [Google Scholar] [CrossRef]
- Koda, Y.; Lien, F.S. The lattice Boltzmann method implemented on the GPU to simulate the turbulent flow over a square cylinder confined in a channel. Flow Turbul. Combust. 2015, 94, 495–512. [Google Scholar] [CrossRef]
- Yu, J.H.; Wang, S.; Kong, D.L. Coal-fueled chemical looping gasification: A CFD-DEM study. Fuel 2023, 345, 128119. [Google Scholar] [CrossRef]
- Kou, B.; Hou, Y.Q.; Fu, W.Q.; Yang, N.; Liu, J.C.; Xie, G. Simulation of multi-phase flow in autoclaves using a coupled CFD-DPM approach. Processes 2023, 11, 890. [Google Scholar] [CrossRef]
- Wu, P.F.; Munoz, D.H.; Constantinescu, G.; Qian, Z.D. Two-phase flow DES and URANS simulations of pump-intake bay vortices. J. Hydraul. Res. 2020, 58, 120–132. [Google Scholar] [CrossRef]
- Kim, H.S.; Kim, B.W.; Lee, K.; Sung, H.G. Application of Average Sea-state Method for Fast Estimation of Fatigue Damage of Offshore Structure in Waves with Various Distribution Types of Occurrence Probability. Ocean Eng. 2022, 246, 110601. [Google Scholar] [CrossRef]
- Liu, L.; Zhang, X.T.; Tian, X.L.; Li, X. Numerical investigation on dynamic performance of vertical hydraulic transport in deepsea mining. Appl. Ocean. Res. 2023, 130, 103443. [Google Scholar] [CrossRef]
- Li, L.; Xu, W.X.; Tan, Y.F.; Yang, Y.S.; Yang, J.G.; Tan, D.P. Fluid-induced vibration evolution mechanism of multiphase free sink vortex and the multi-source vibration sensing method. Mech. Syst. Signal Process 2023, 189, 110058. [Google Scholar] [CrossRef]
- Wang, J.; Ku, X.K. Numerical simulation of biomass steam gasification in an internally interconnected fluidized bed using a two-grid MP-PIC model. Chem. Eng. Sci. 2023, 272, 119608. [Google Scholar] [CrossRef]
- Zhu, X.L.; Liu, Y.B. Bubble behaviors of geldart B particle in a pseudo two-dimensional pressurized fluidized bed. Particuology 2023, 79, 121–132. [Google Scholar] [CrossRef]
- Nazir, K.; Sohn, C.H. Effect of water temperature on air-core generation and disappearance during draining. J. Mech. Sci. Technol. 2018, 32, 703–708. [Google Scholar] [CrossRef]
- Zheng, M.R.; Han, D.; Peng, T. Numerical investigation on flow induced vibration performance of flow-around structures with different angles of attack. Energy 2022, 244, 122607. [Google Scholar] [CrossRef]
- Mulligan, S.; De, C.G.; Casserly, J.; Sherlock, R. Understanding turbulent free-surface vortex flows using a Taylor-Couette flow analogy. Sci. Rep. 2018, 8, 824. [Google Scholar] [CrossRef] [PubMed]
- Afra, B.; Karimnejad, S.; Delouei, A.A.; Tarokh, A. Flow control of two tandem cylinders by a highly flexible filament: Lattice spring IB-LBM. Ocean. Eng. 2022, 250, 111025. [Google Scholar] [CrossRef]
- Conzalez, J.F.; Sanson, L.Z. Linear stability of monopolar vortices over isolated topography. J. Fluid Mech. 2023, 959, A23. [Google Scholar] [CrossRef]
- Su, R.A.; Gao, Z.Y.; Chen, Y.Y.; Zhang, C.Q. Large-eddy simulation of the influence of hairpin vortex on pressure coefficient of an operating horizontal axis wind turbine. Energy Convers. Manag. 2022, 267, 115864. [Google Scholar] [CrossRef]
- Deloue, A.A.; Karimnejad, S.; He, F.L. Direct Numerical Simulation of pulsating flow effect on the distribution of non-circular particles with increased levels of complexity: IB-LBM. Comput. Math. Appl. 2022, 121, 115–130. [Google Scholar] [CrossRef]
- Chen, J.; Han, P.; Zhang, Y.; You, T.; Zheng, P. Scheduling energy consumption-constrained workflows in heterogeneous multi-processor embedded systems. J. Syst. Archit. 2023, 142, 102938. [Google Scholar] [CrossRef]
- Liu, Z.B.; Wang, S.; Chen, Z.R. Electromechanical coupling characteristics analysis of vertical stirred mill based on ECS-MBD-DEM. Powder Technol. 2024, 433, 119245. [Google Scholar] [CrossRef]
- Ni, D.; Zhang, N.; Gao, B.; Li, Z.; Yang, M.G. Dynamic measurements on unsteady pressure pulsations and flow distributions in a nuclear reactor coolant pump. Energy 2020, 198, 117305. [Google Scholar] [CrossRef]
- Wang, Q.; Wang, L.Y.; Li, H.X.; Jiang, J.W.; Zhu, X.W.; Guo, Z.C.; He, J.C. Suppression mechanism and method of vortex during steel teeming process in ladle. Acta Metall. Sin. 2018, 7, 959–968. [Google Scholar]
- Kang, Q.Q.; He, D.P.; Zhao, N.; Feng, X.; Wang, J.T. Hydrodynamics in unbaffled liquid-solid stirred tanks with free surface studied by DEM-VOF method. Chem. Eng. J. 2020, 386, 122846. [Google Scholar] [CrossRef]
- Ge, M.; Zheng, G.A. Fluid-solid mixing transfer mechanism and flow patterns of the double-layered impeller stirring tank by the CFD-DEM method. Energies, 2024; in press. [Google Scholar]
- Yan, W.J.; Feng, Z.Q.; Yang, W.; Yuen, K.V. Bayesian inference for the dynamic properties of long-span bridges under vortex-induced vibration with Scanlan’s model and dense optical flow scheme. Mech. Syst. Signal Process 2022, 174, 109078. [Google Scholar] [CrossRef]
- Yang, Y.; Bashir, M.; Li, C.; Michailides, C.; Wang, J. Mitigation of coupled wind-wave-earthquake responses of a 10 MW fixed-bottom offshore wind turbine. Renew Energy 2020, 157, 1171–1184. [Google Scholar] [CrossRef]
- Yang, M.; Liu, S.; Xu, W.H. Numerical and experimental studies of an oil slick recovery method that uses a free surface vortex. ACS Omega 2020, 5, 31332–31341. [Google Scholar] [CrossRef] [PubMed]
- Chen, Y.C.; Huang, S.L.; Li, Z.Y. A bathtub vortex under the influence of a protruding cylinder in a rotating tank. J. Fluid Mech. 2013, 733, 134–157. [Google Scholar] [CrossRef]
Figure 1.
D3Q27 model diagram.
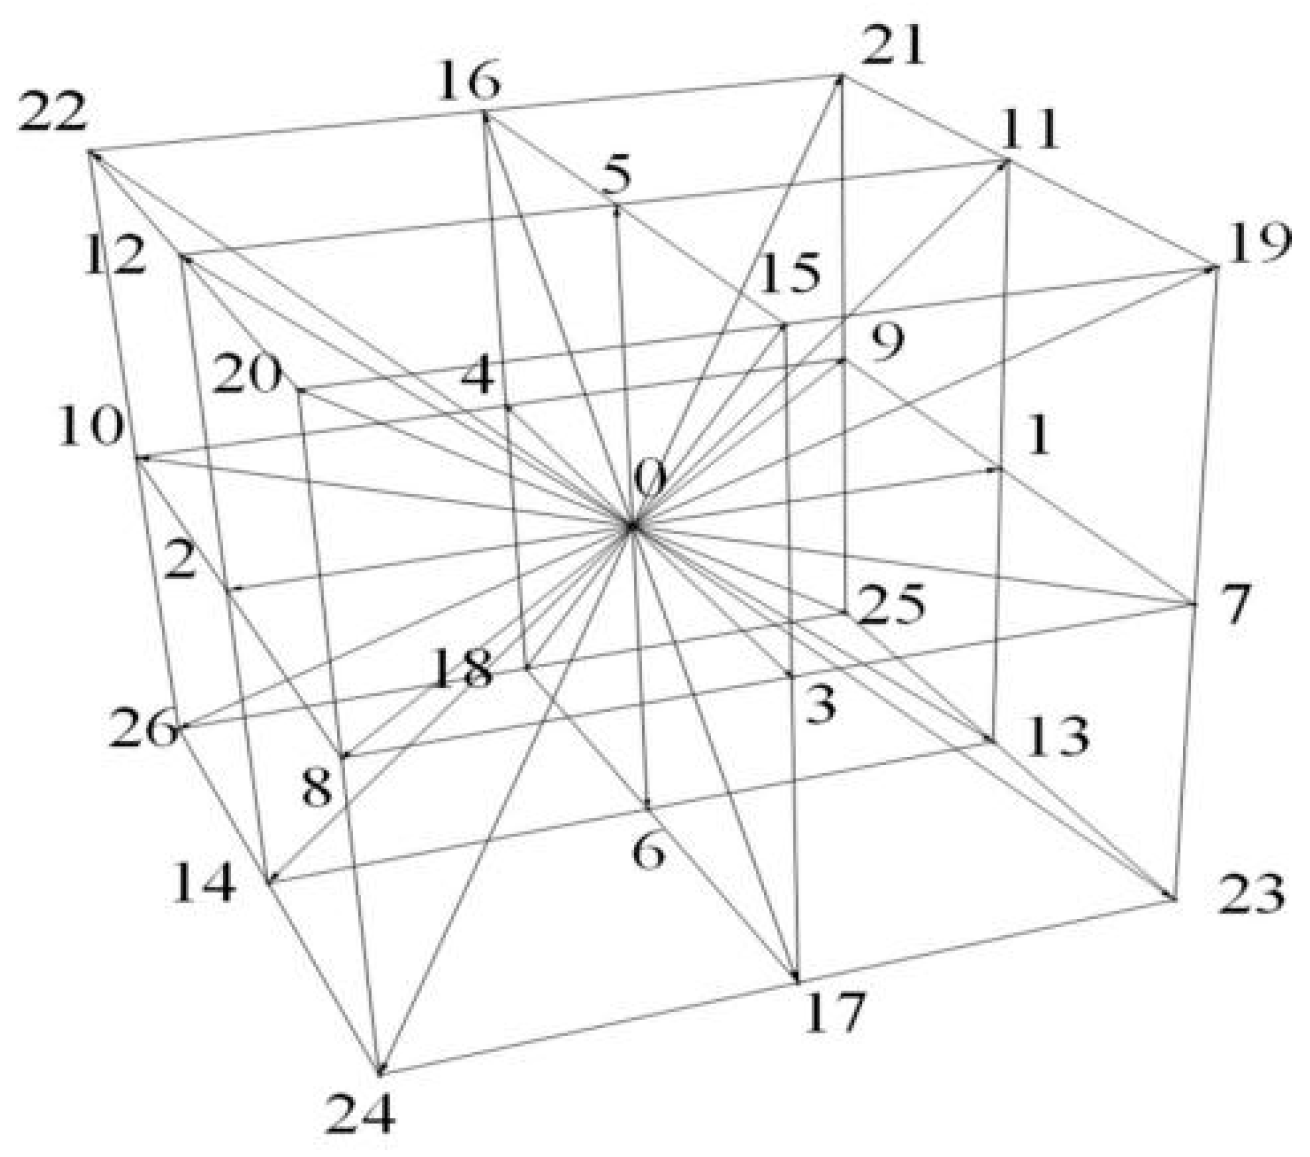
Figure 2.
Flowchart of the solution.
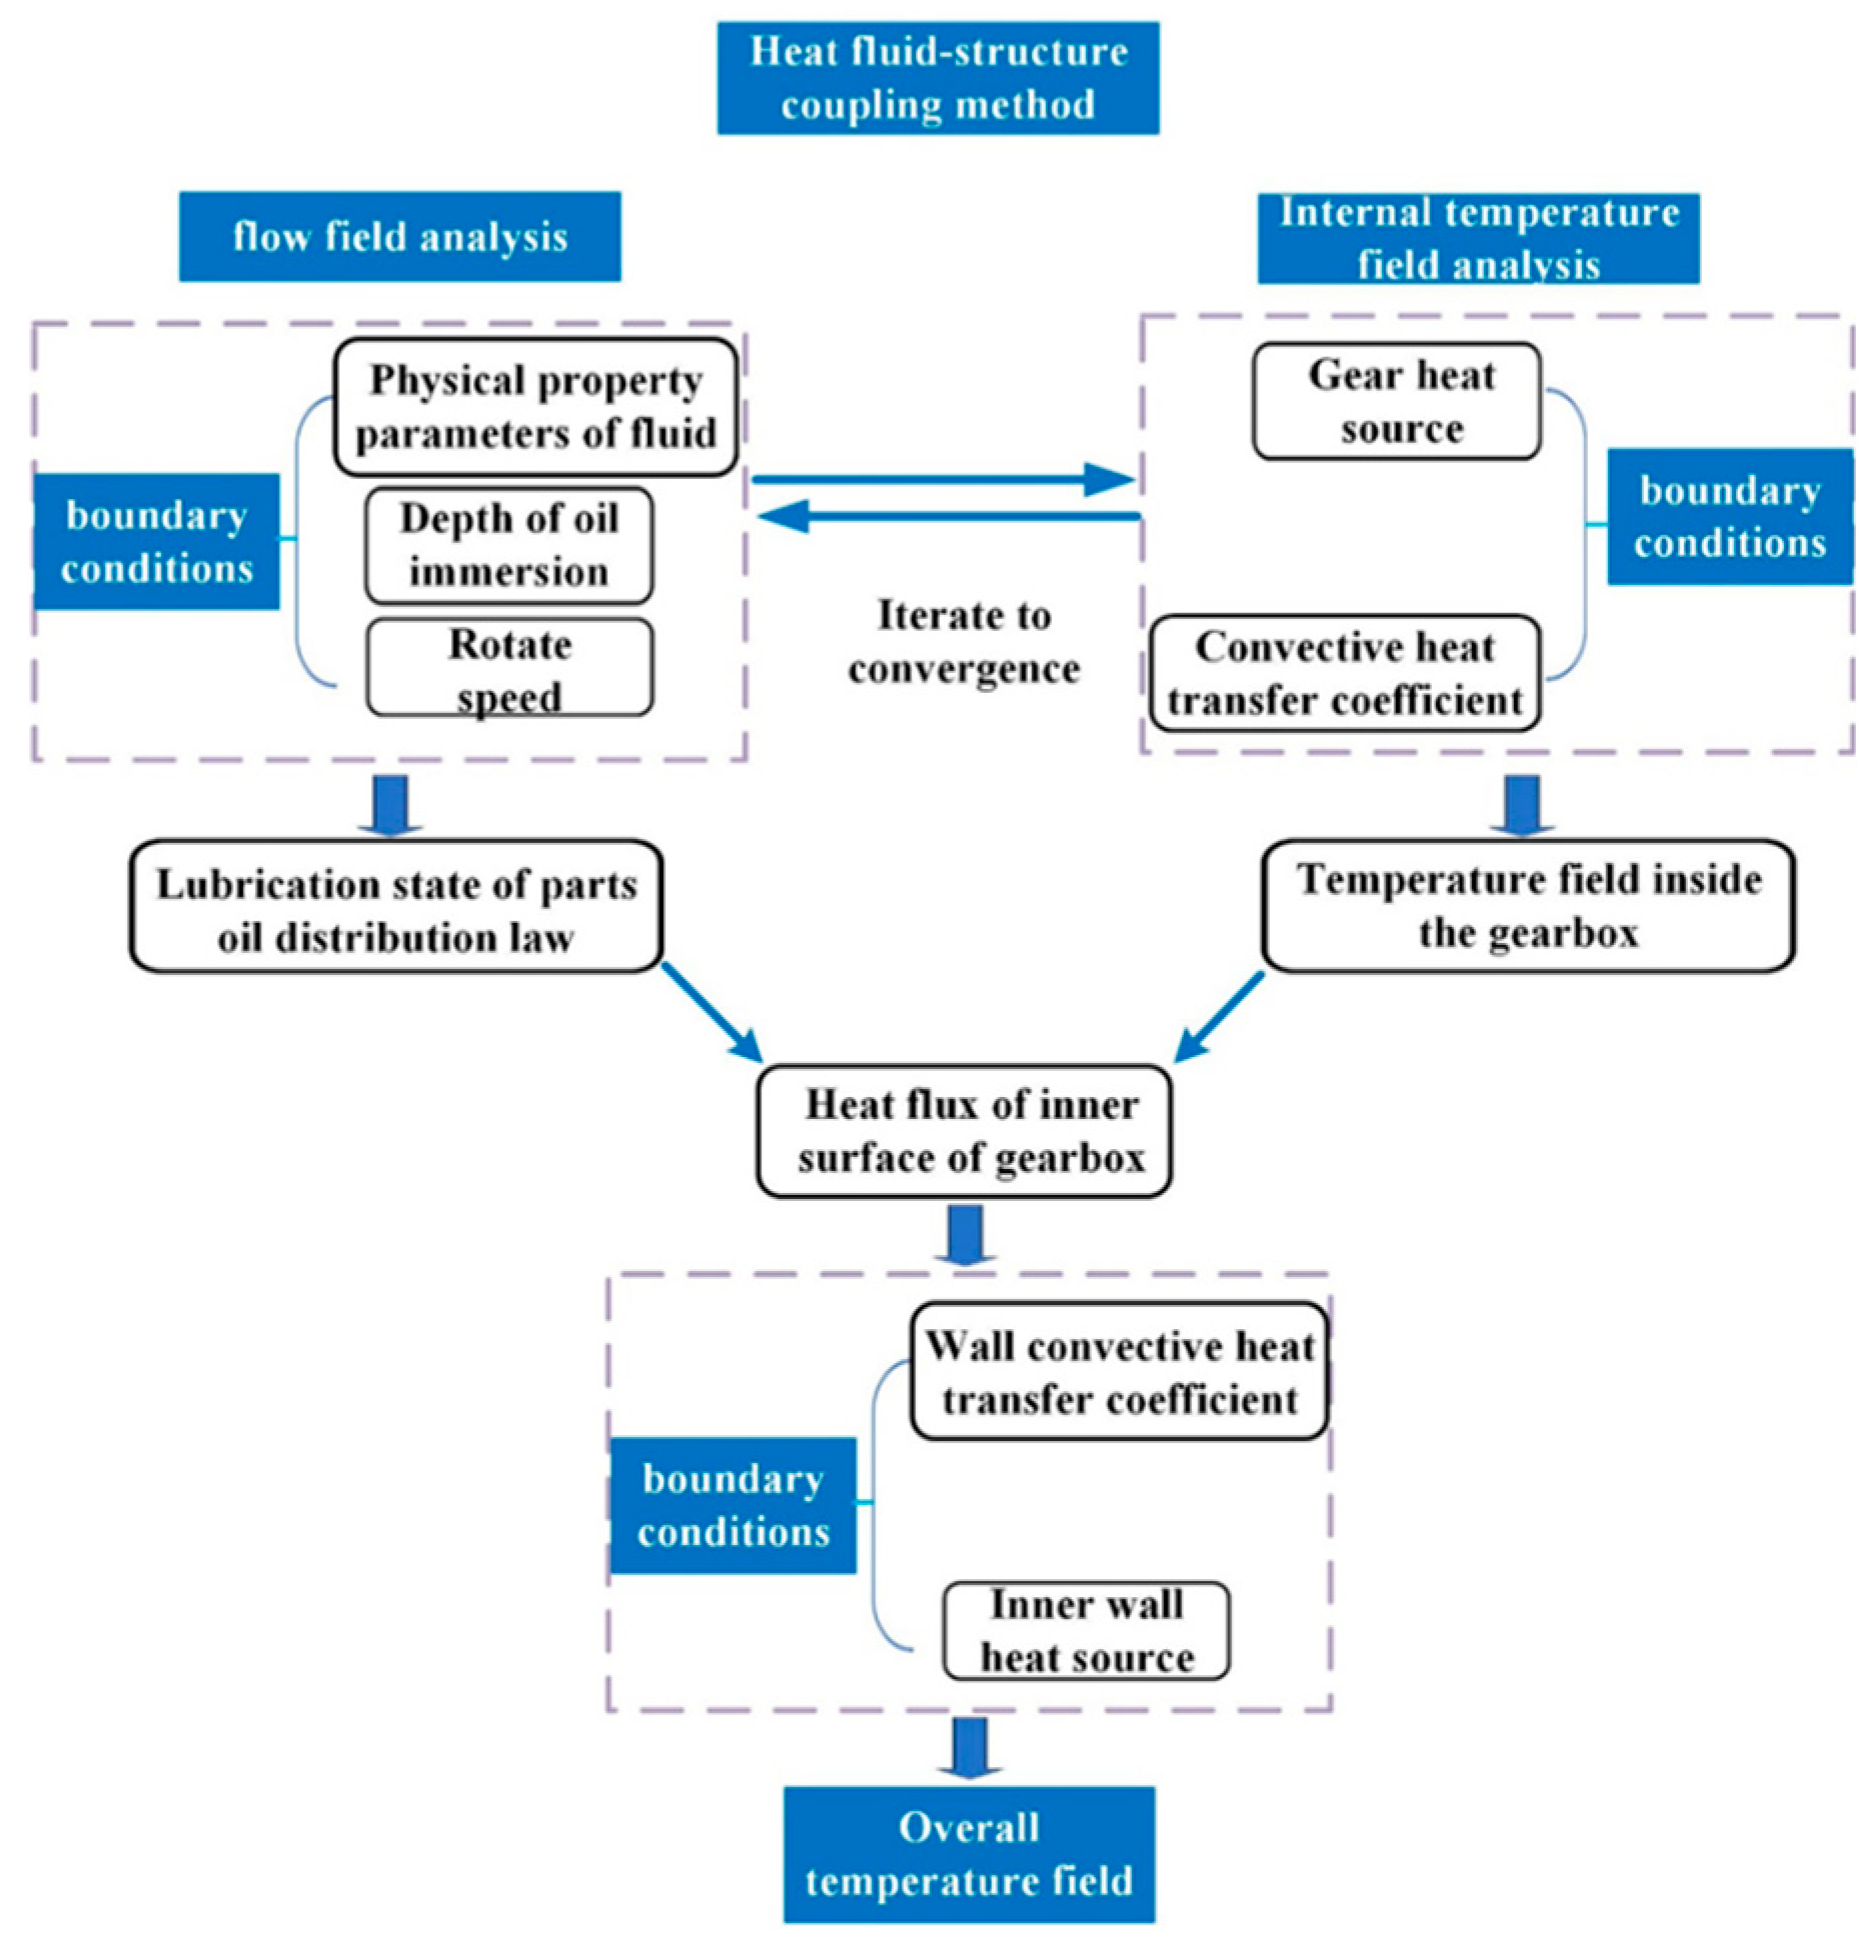
Figure 3.
Model of gearbox geometry.
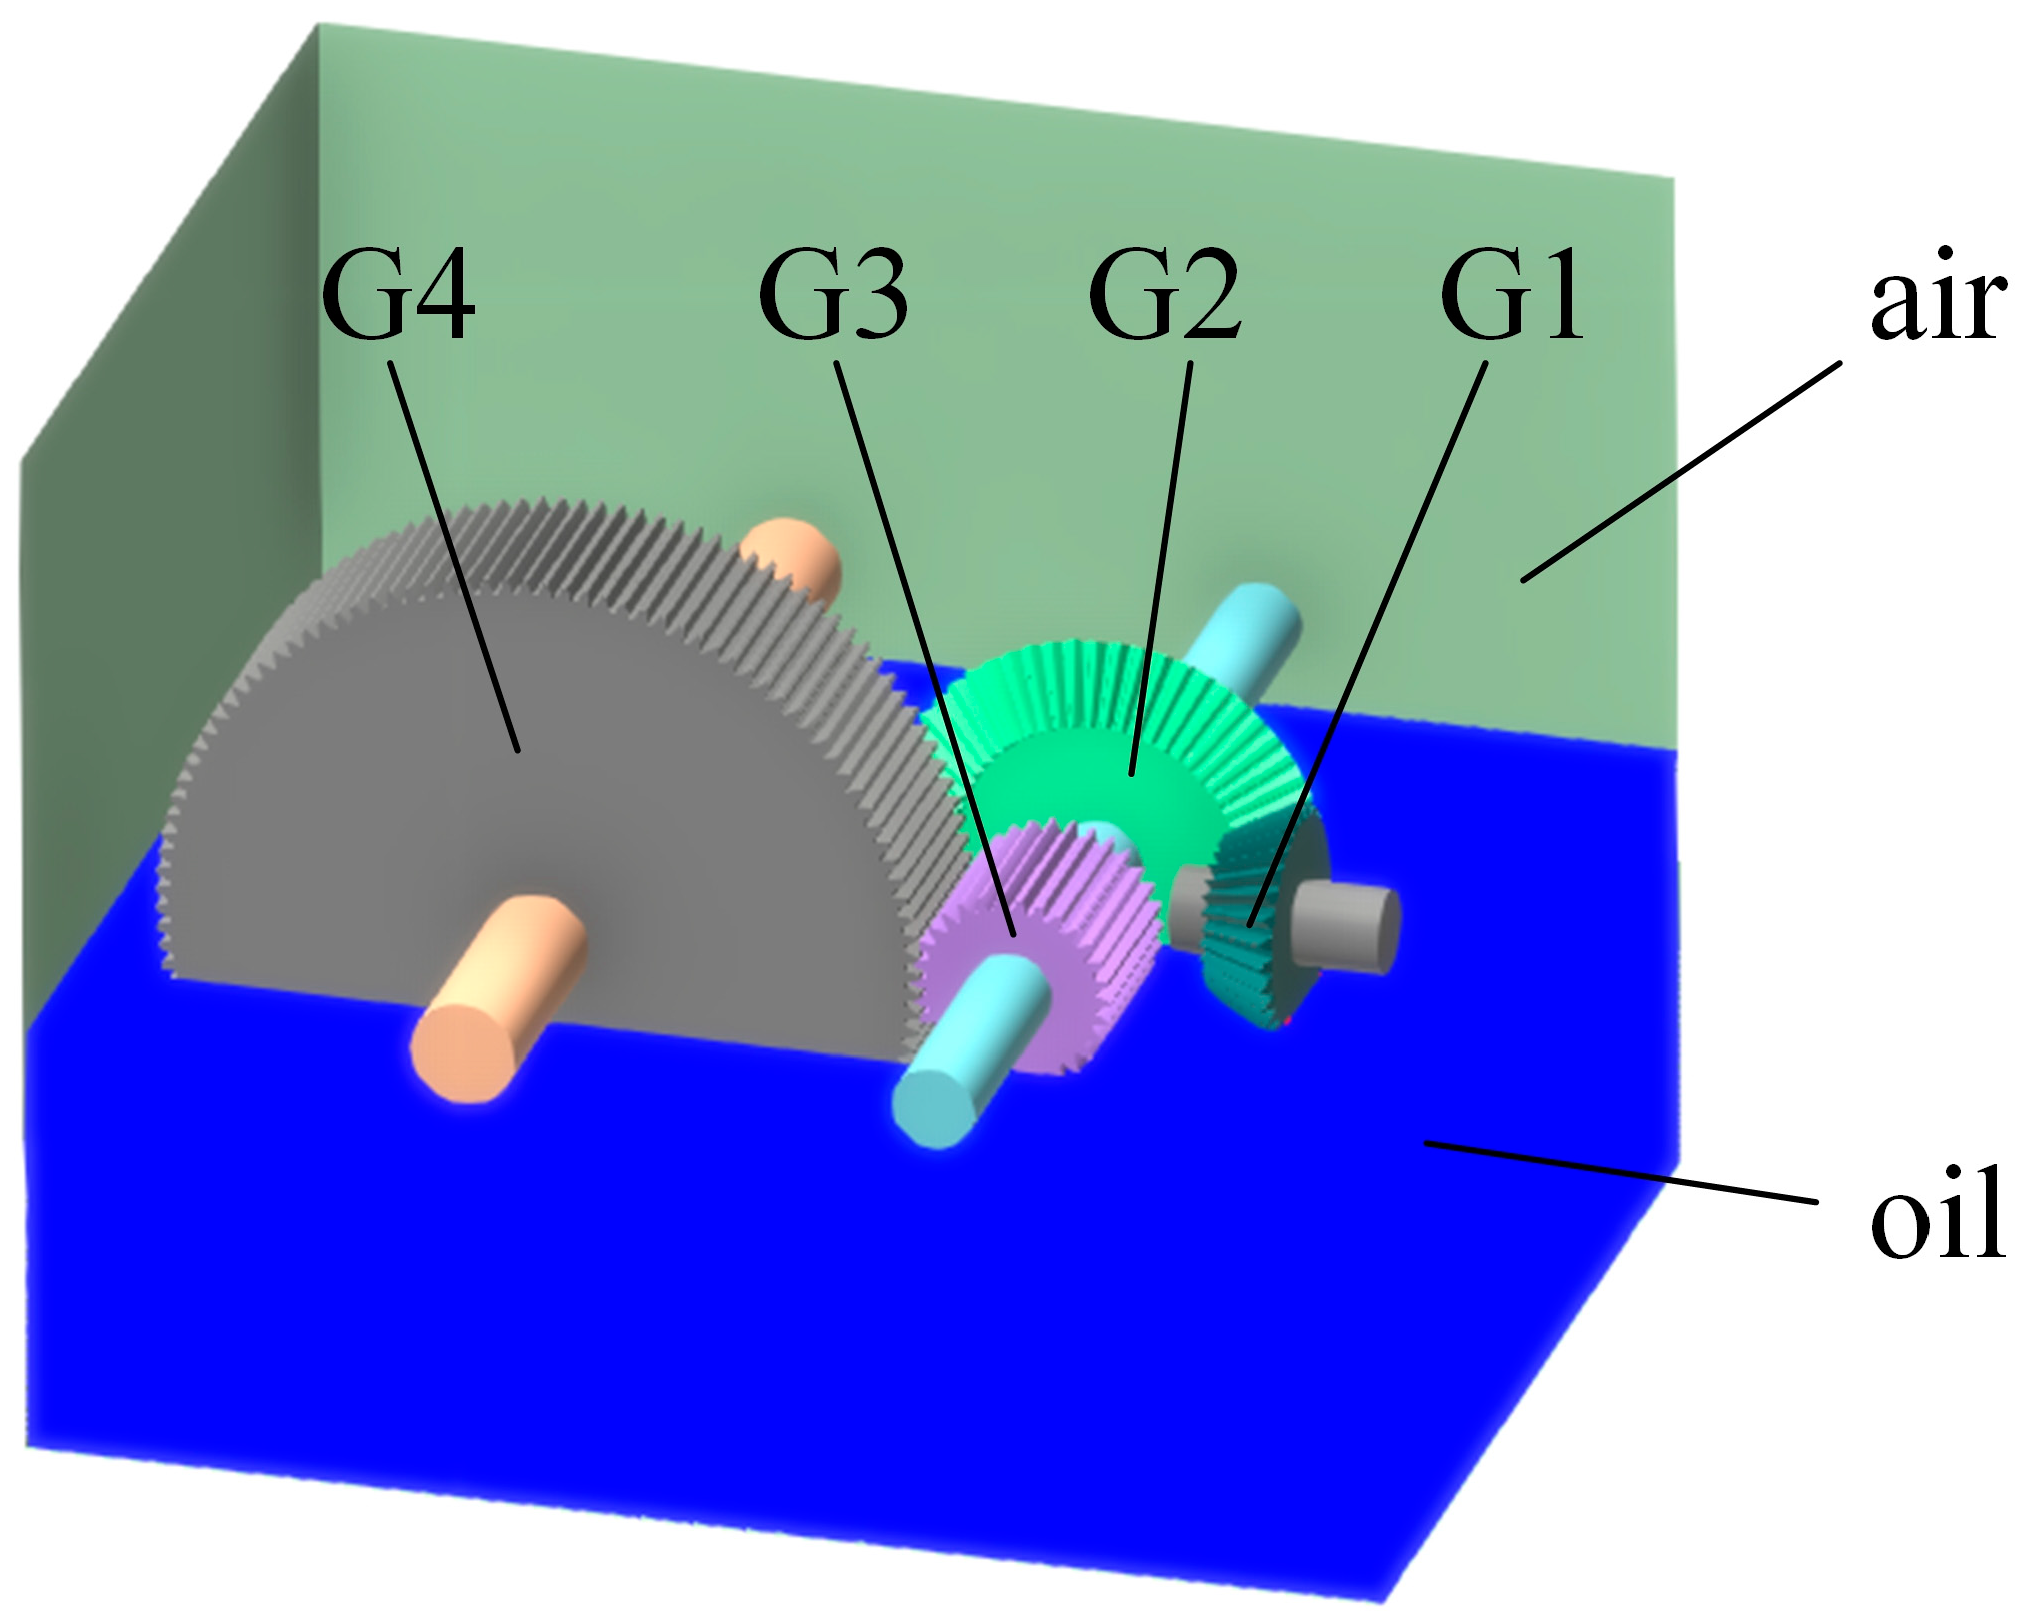
Figure 4.
Transmission dynamics model. (a) Fluid domain model. (b) Localized view of input gear. (c) Localized view of output gear.
Figure 4.
Transmission dynamics model. (a) Fluid domain model. (b) Localized view of input gear. (c) Localized view of output gear.

Figure 5.
Fluid distribution in the gearbox. (a) t = 0.01 s; (b) t = 0.1 s; (c) t = 0.15 s; (d) t = 0.2 s.
Figure 5.
Fluid distribution in the gearbox. (a) t = 0.01 s; (b) t = 0.1 s; (c) t = 0.15 s; (d) t = 0.2 s.

Figure 6.
Lubricant distribution at the point of engagement. (a) t = 0.01 s; (b) t = 0.1 s; (c) t = 0.4 s.
Figure 6.
Lubricant distribution at the point of engagement. (a) t = 0.01 s; (b) t = 0.1 s; (c) t = 0.4 s.
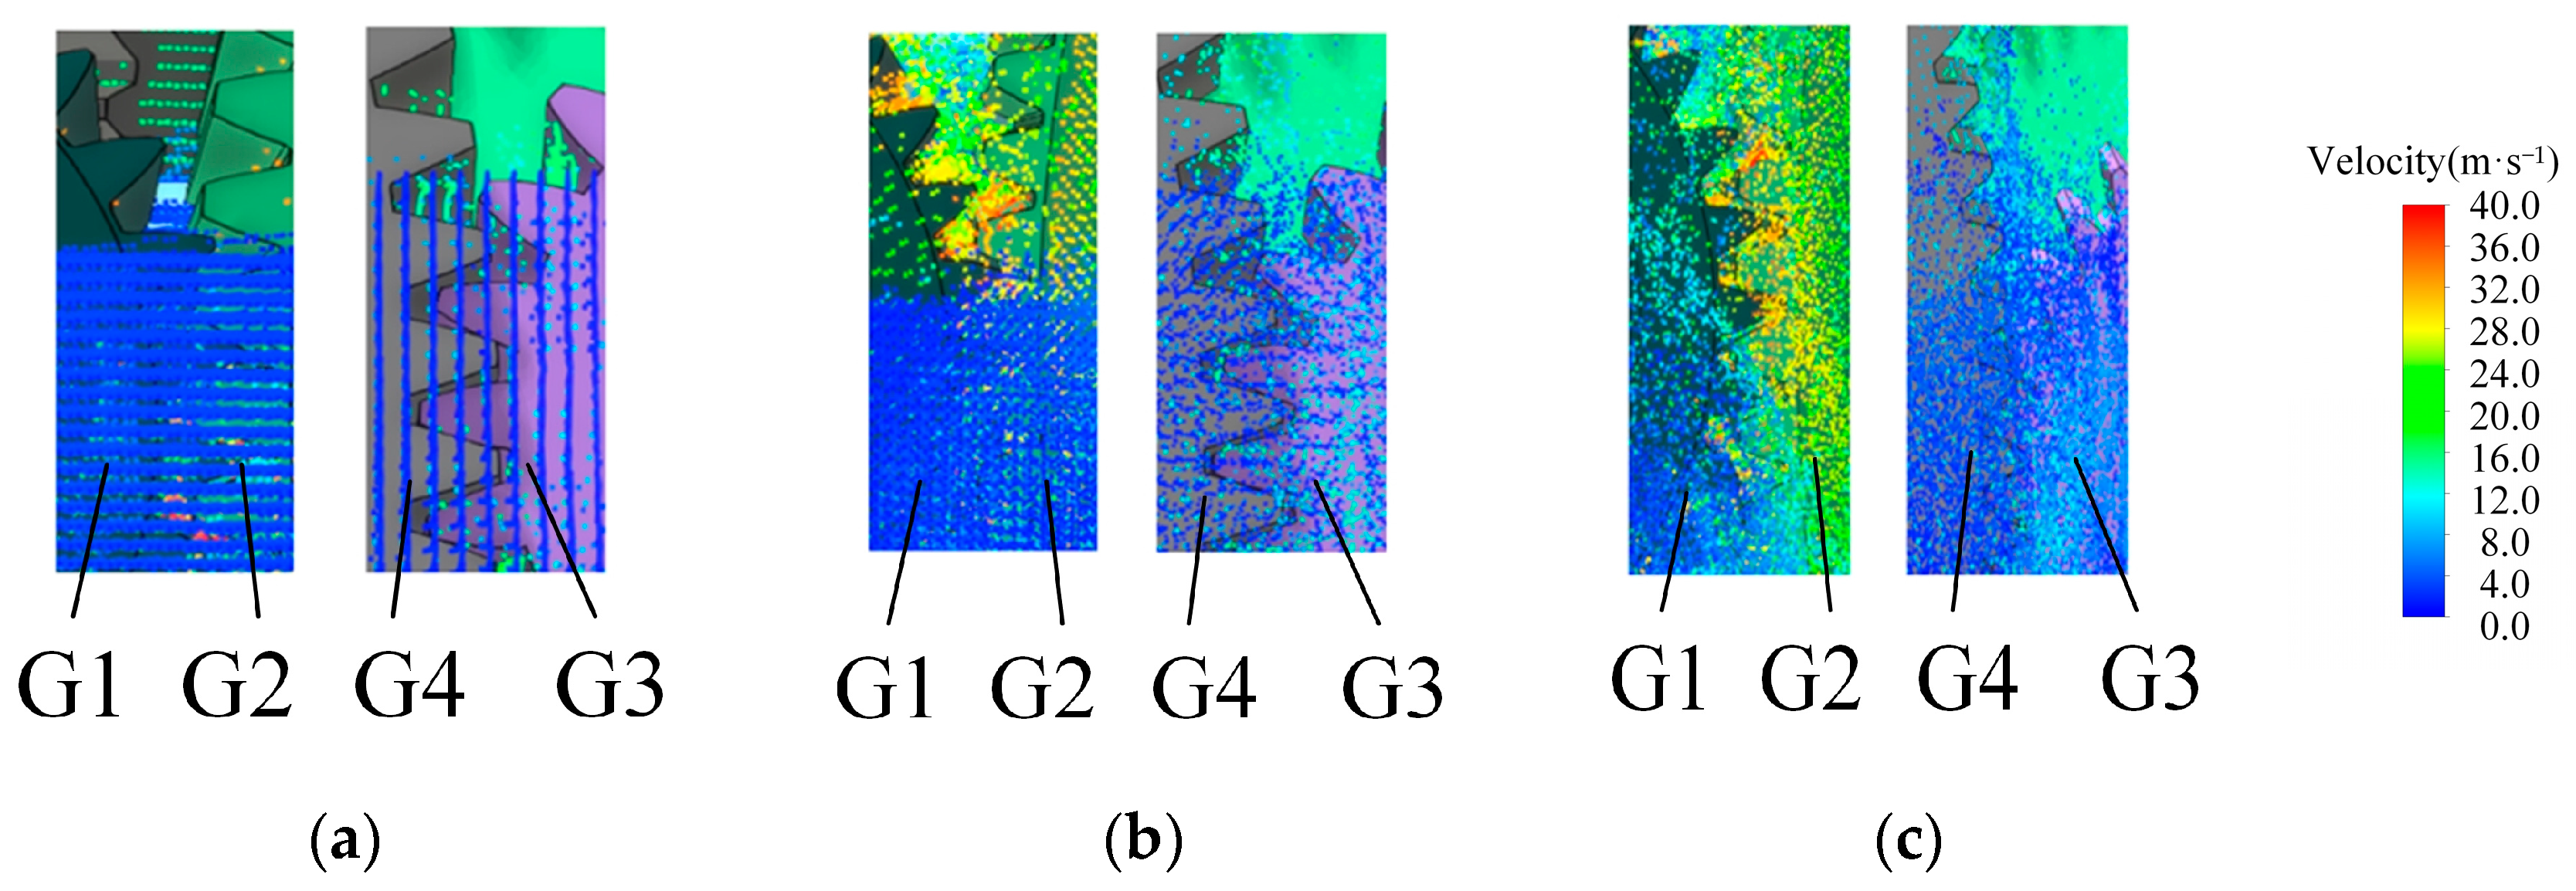
Figure 7.
Torque of each gear.

Figure 8.
Total fluid kinetic energy vs. rotational speed steering. (a) Speed 2000 rpm; (b) speed 4000 rpm; (c) speed 8000 rpm.
Figure 8.
Total fluid kinetic energy vs. rotational speed steering. (a) Speed 2000 rpm; (b) speed 4000 rpm; (c) speed 8000 rpm.

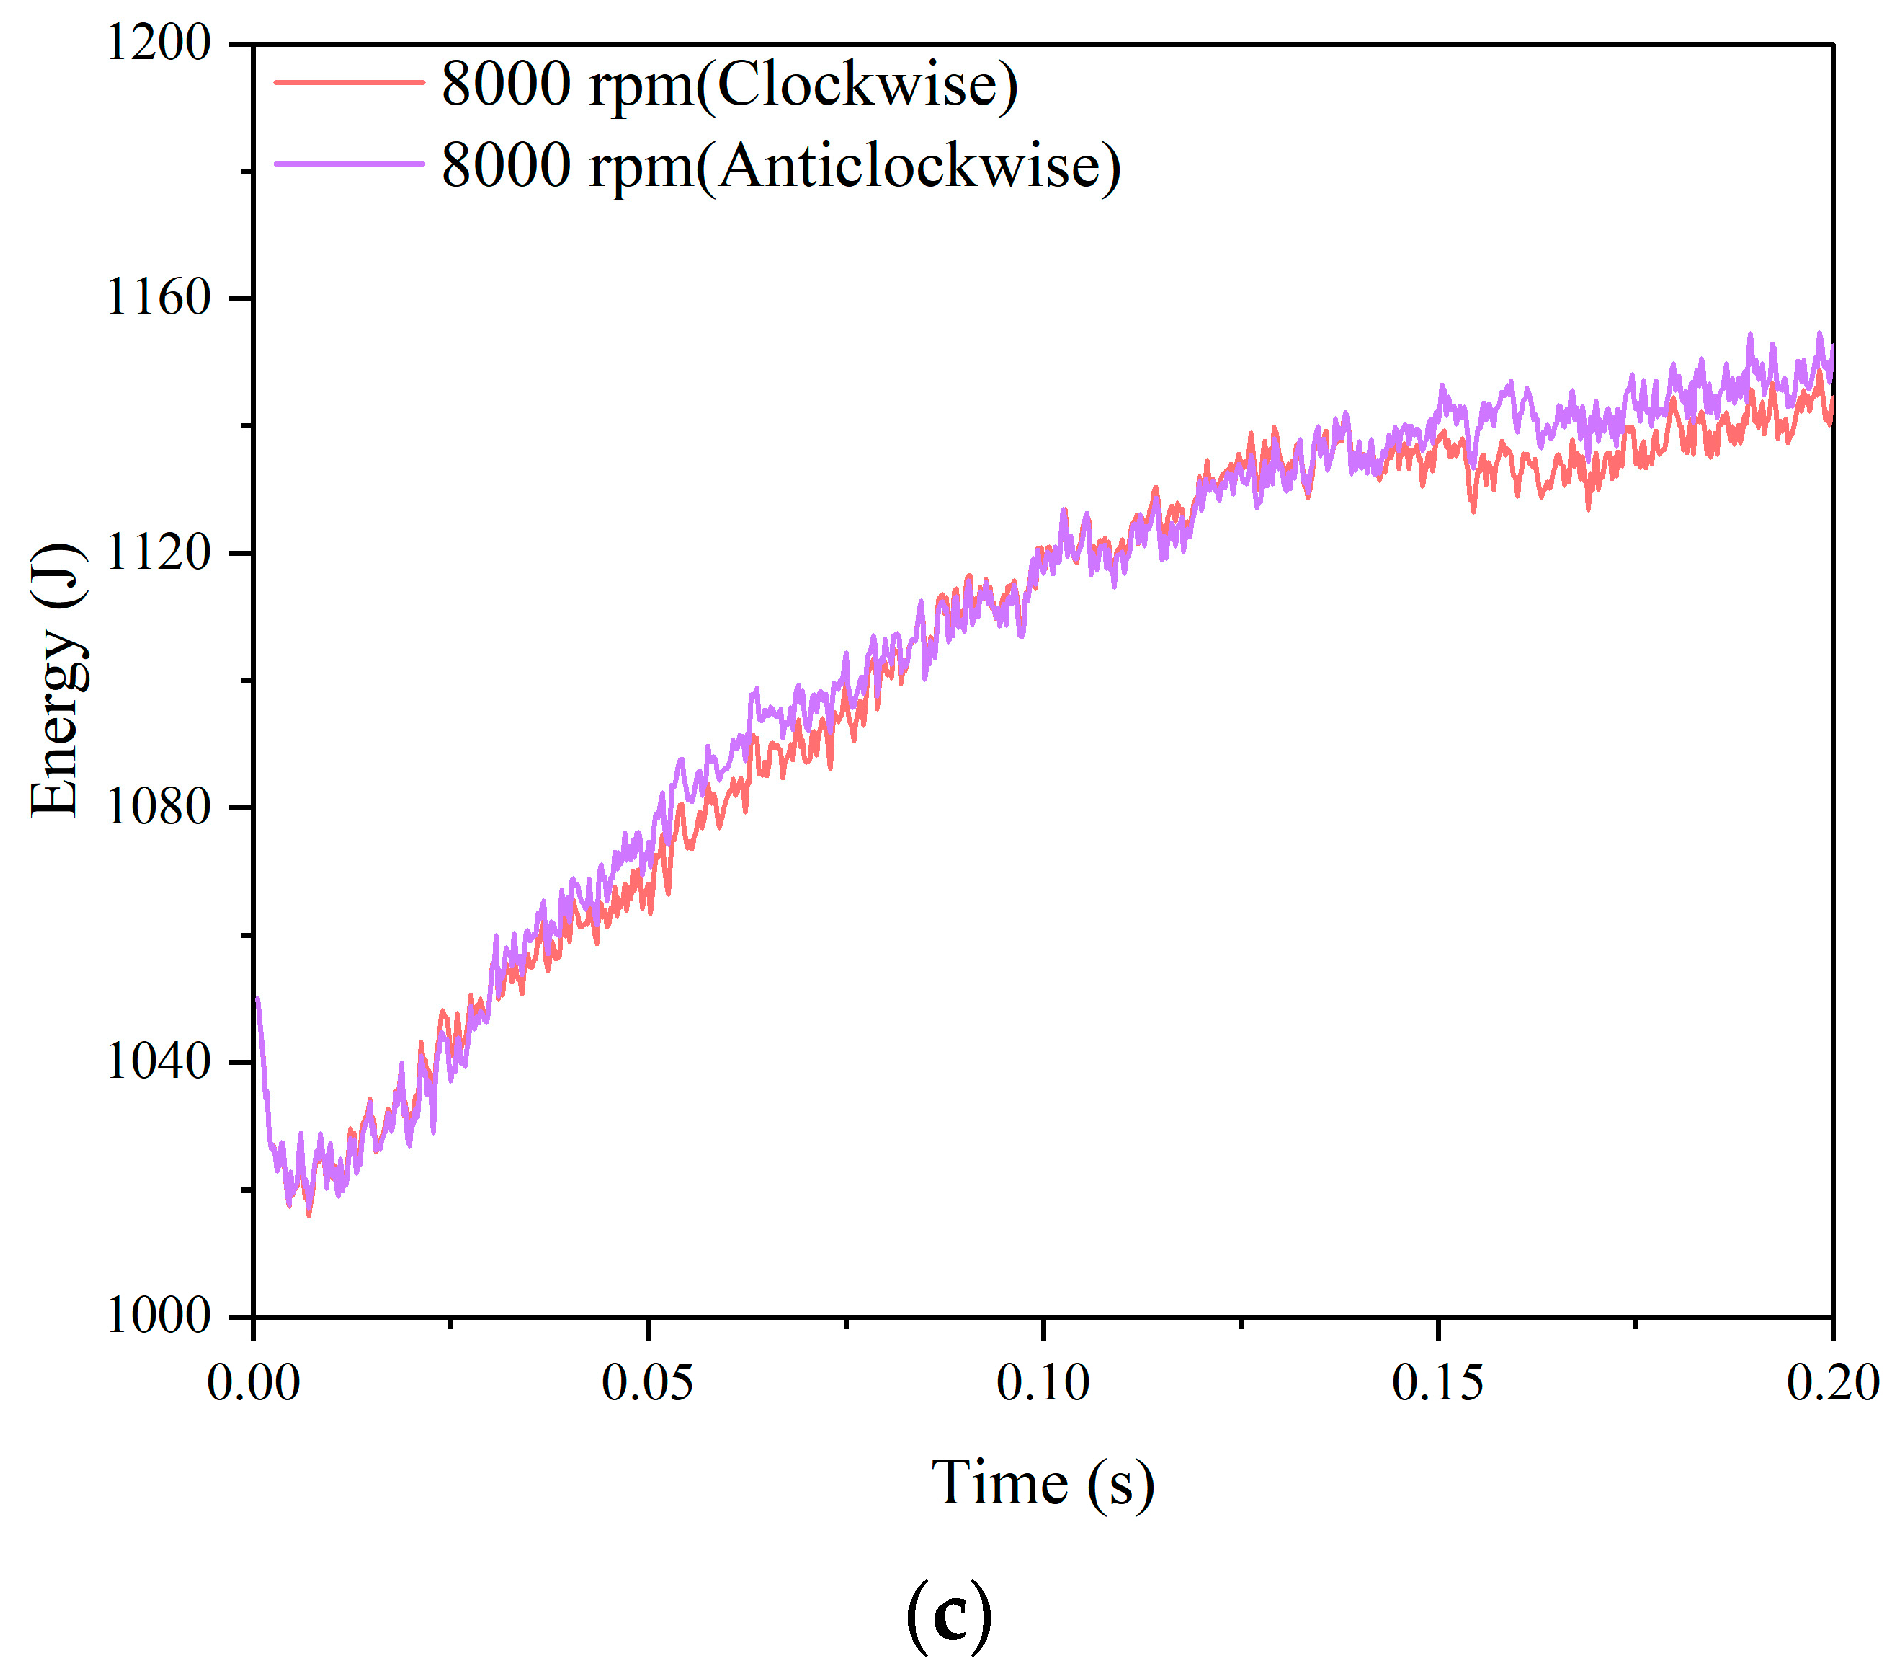
Figure 9.
Setting of sensors.
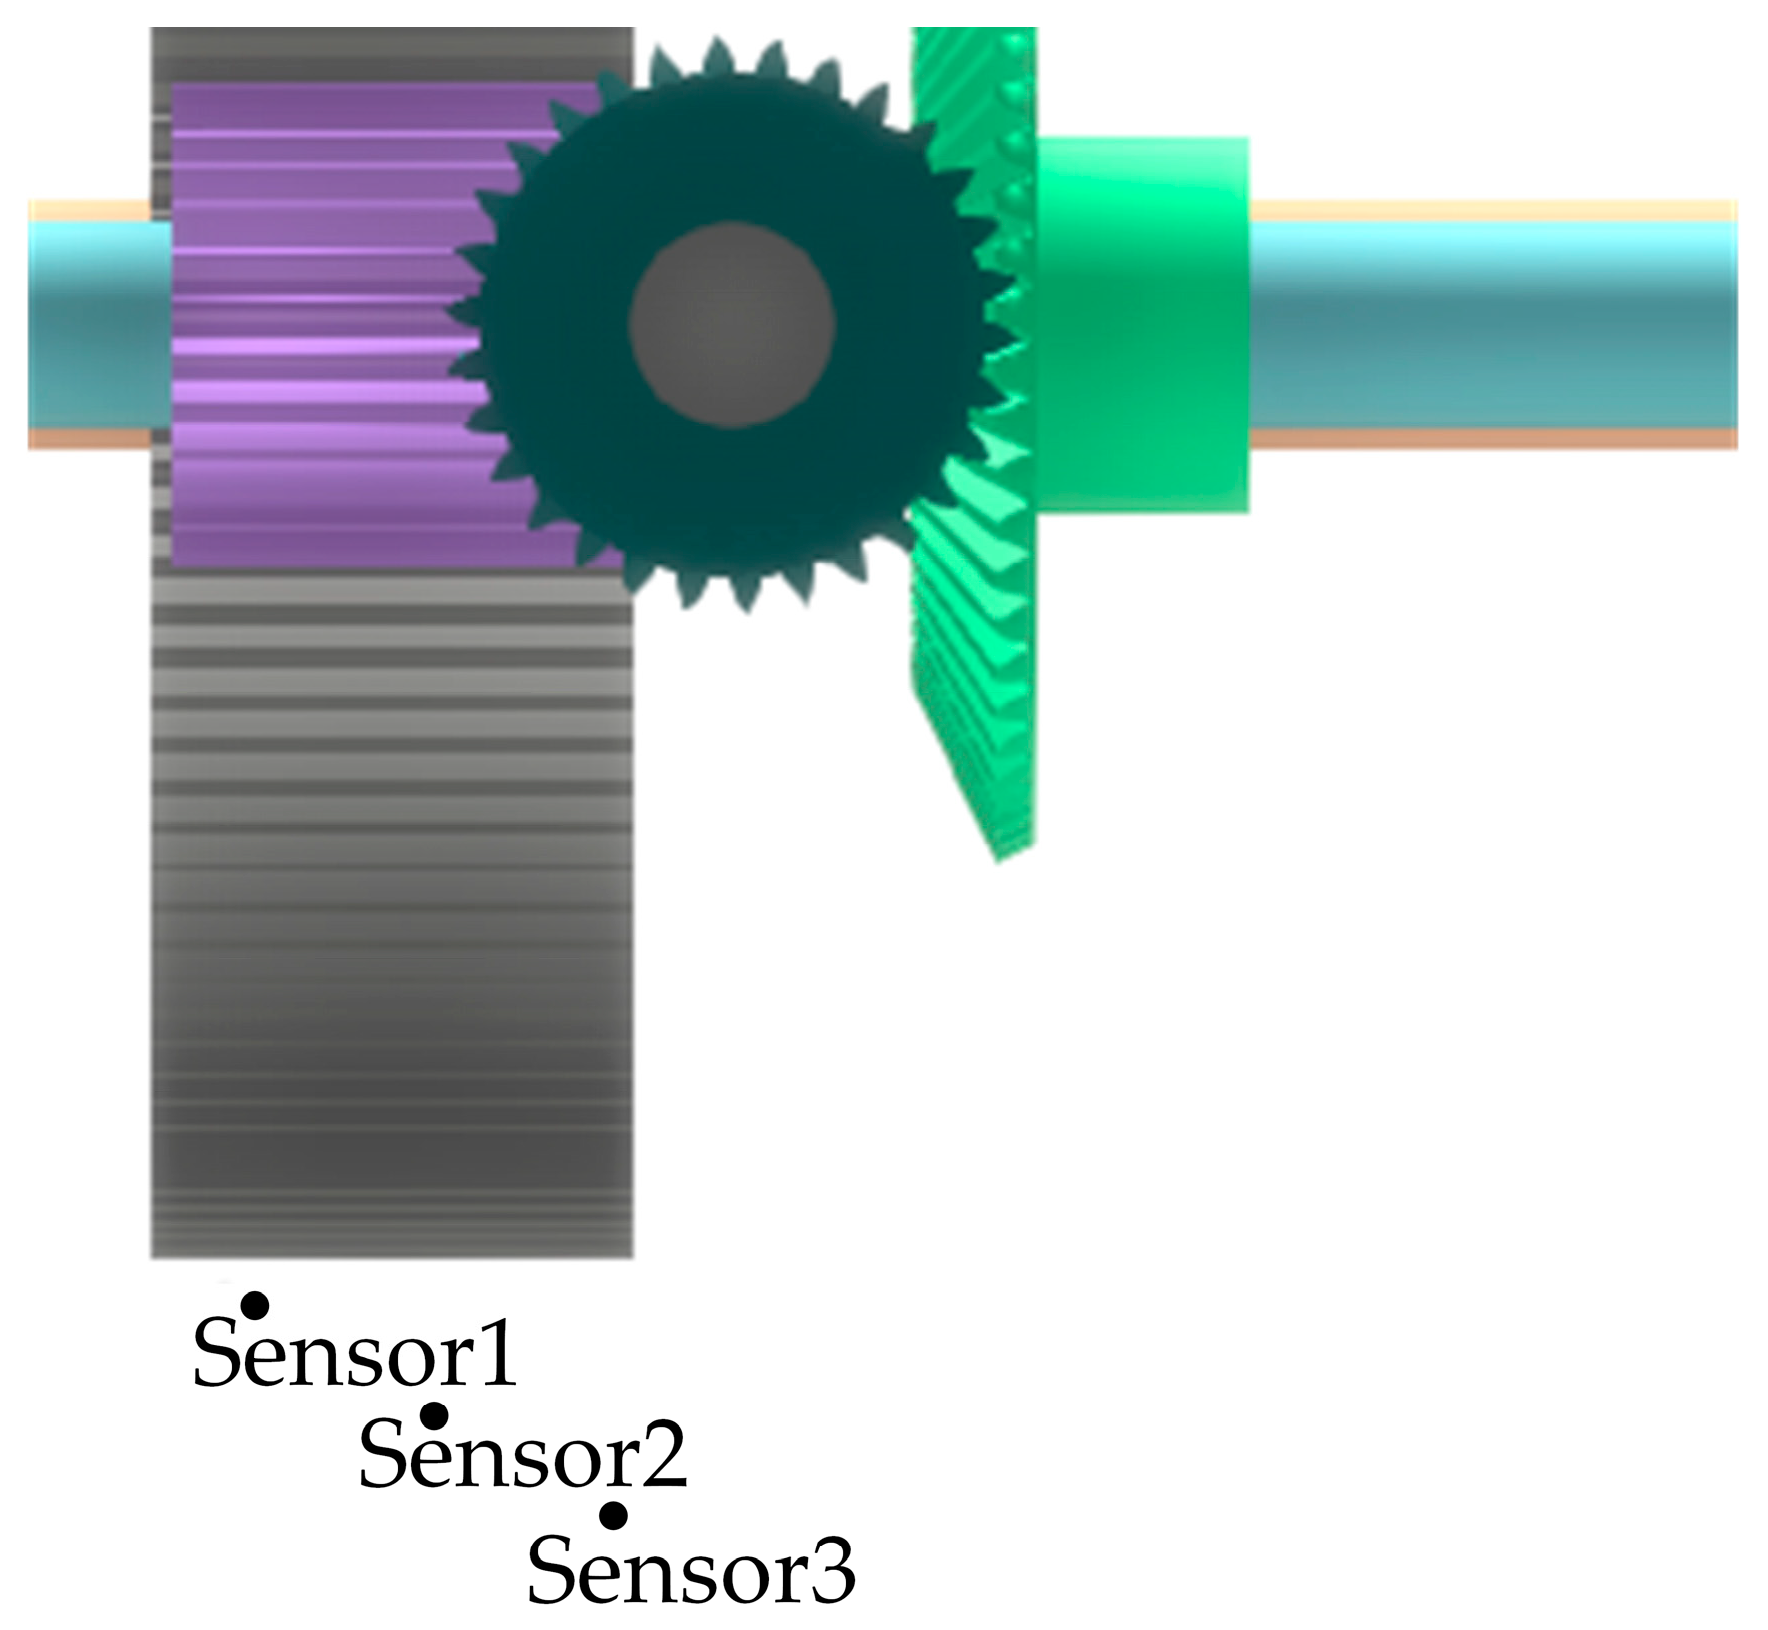
Figure 10.
Fluid temperature variation with rotational speed steering. (a) Speed 2000 rpm; (b) speed 4000 rpm; (c) speed 8000 rpm.
Figure 10.
Fluid temperature variation with rotational speed steering. (a) Speed 2000 rpm; (b) speed 4000 rpm; (c) speed 8000 rpm.
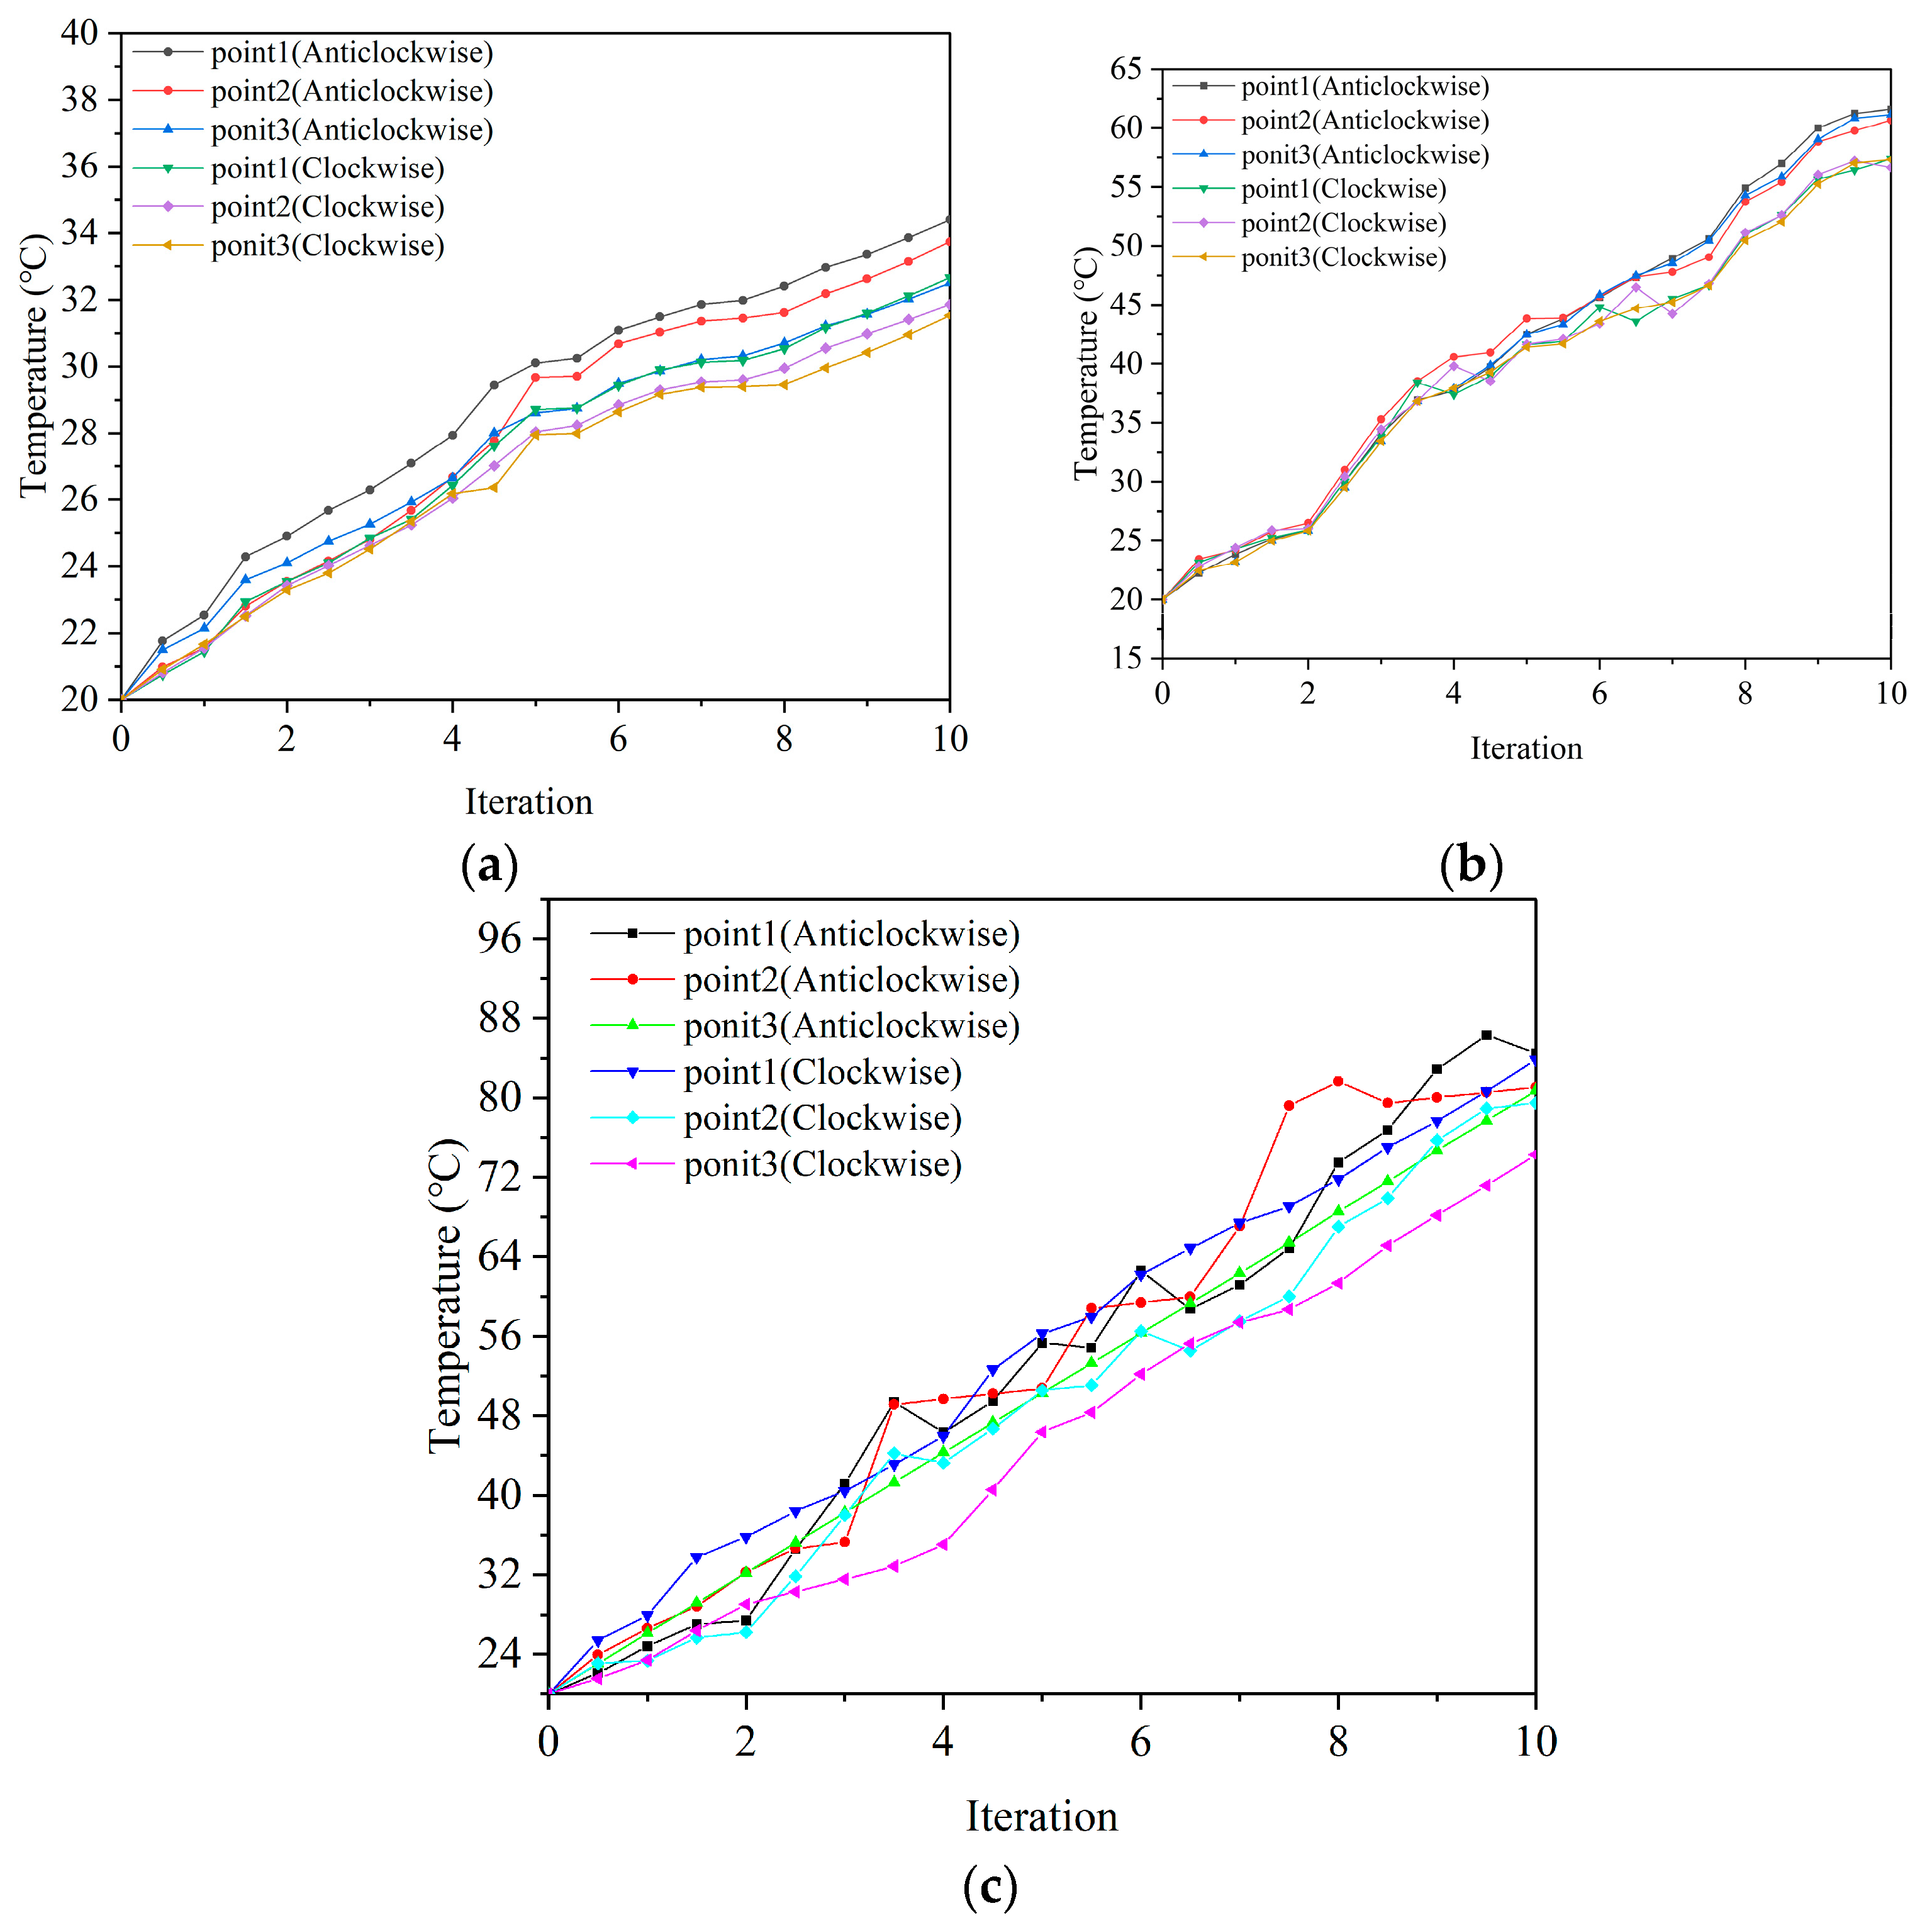
Figure 11.
Fluid temperature variation and lubricant characteristics: (a) thermal transfer coefficient; (b) dynamic viscosity.
Figure 11.
Fluid temperature variation and lubricant characteristics: (a) thermal transfer coefficient; (b) dynamic viscosity.

Figure 12.
Fluid kinetic energy change versus lubricant properties: (a) Thermal conductivity; (b) dynamic viscosity.
Figure 12.
Fluid kinetic energy change versus lubricant properties: (a) Thermal conductivity; (b) dynamic viscosity.

Table 1.
Basic geometrical parameters of gears.
| G1 | G2 | G3 | G4 | |
|---|---|---|---|---|
| Number of teeth | 30 | 60 | 30 | 120 |
| Tooth width (mm) | 40 | 40 | 90 | 95 |
| Module (mm) | 3.5 | 3.5 | 3 | 3 |
| Pressure angle | 20 | 20 | 20 | 20 |
| Diameter of tooth top circle (mm) | 108 | 213 | 96 | 366 |
| Center distance (mm) | 157.5 | 225 | ||
Table 2.
Boundary conditions of the fluid dynamic model.
| Item | Parameter |
|---|---|
| Input shaft speed (rpm) | 4000 |
| Gravity force (N) | 9.81 |
| Direction of gravity | z-axis negative direction |
| Initial oil level (m) | 0.21 |
| Initial speed (m/s) | 0 |
Table 3.
Basic parameters of material.
| Medium | Density (kg·m−3) | Specific Heat (J·kg−1·K−1) | Thermal Conductivity (W·m−1·K−1) | Kinetic Viscosity (Pa·s) |
|---|---|---|---|---|
| Oil | 870 | 1960 | 0.134 | 1.2 × 10⁻¹ |
| Air | 1.225 | 1000 | 0.023 | 1.79 × 10⁻⁵ |
| 45# | 7850 | 488 | 50.2 | / |
| 40 Cr | 7850 | 460 | 32.6 | / |
Table 4.
Comparison of gear steering temperature increase.
| 2000 rpm | 4000 rpm | 8000 rpm | ||||
|---|---|---|---|---|---|---|
| Clockwise | Anticlockwise | Clockwise | Anticlockwise | Clockwise | Anticlockwise | |
| Point1/(°C) | 34.2 | 32.5 | 61.4 | 57.2 | 84.5 | 83.8 |
| Point2/(°C) | 33.6 | 31.7 | 61.0 | 57.1 | 81.1 | 79.5 |
| Point3/(°C) | 32.4 | 31.41 | 60.5 | 56.5 | 80.7 | 74.3 |
Table 5.
Fluid temperature under lubricant conditions with different thermal conductivities.
| Thermal Conductivity (W·m−1·K−1) | 0.13 | 0.15 | 0.17 |
|---|---|---|---|
| Point4 (°C) | 62.7 | 73.5 | 80.2 |
| Point5 (°C) | 59.5 | 69.5 | 75.6 |
Table 6.
Fluid temperature under lubricant conditions for different dynamic viscosities of lubricants.
Table 6.
Fluid temperature under lubricant conditions for different dynamic viscosities of lubricants.
| Dynamic Viscosity (Pa∙s) | 0.12 | 1.12 | 2.12 |
|---|---|---|---|
| Point4 (°C) | 59.5 | 59.2 | 59.0 |
| Point5 (°C) | 61.4 | 61.0 | 60.9 |
Disclaimer/Publisher’s Note: The statements, opinions and data contained in all publications are solely those of the individual author(s) and contributor(s) and not of MDPI and/or the editor(s). MDPI and/or the editor(s) disclaim responsibility for any injury to people or property resulting from any ideas, methods, instructions or products referred to in the content. |
© 2024 by the authors. Licensee MDPI, Basel, Switzerland. This article is an open access article distributed under the terms and conditions of the Creative Commons Attribution (CC BY) license (https://creativecommons.org/licenses/by/4.0/).
Share and Cite
MDPI and ACS Style
Li, Q.; Xu, P.; Li, L.; Xu, W.; Tan, D. Investigation on the Lubrication Heat Transfer Mechanism of the Multilevel Gearbox by the Lattice Boltzmann Method. Processes 2024, 12, 381. https://doi.org/10.3390/pr12020381
AMA Style
Li Q, Xu P, Li L, Xu W, Tan D. Investigation on the Lubrication Heat Transfer Mechanism of the Multilevel Gearbox by the Lattice Boltzmann Method. Processes. 2024; 12(2):381. https://doi.org/10.3390/pr12020381
Chicago/Turabian StyleLi, Qihan, Pu Xu, Lin Li, Weixin Xu, and Dapeng Tan. 2024. "Investigation on the Lubrication Heat Transfer Mechanism of the Multilevel Gearbox by the Lattice Boltzmann Method" Processes 12, no. 2: 381. https://doi.org/10.3390/pr12020381
Note that from the first issue of 2016, this journal uses article numbers instead of page numbers. See further details here.