Article

Monitoring Yeast Cultures Grown on Corn Stover Hydrolysate for Lipid Production

1
Laboratório Nacional de Energia e Geologia, Unidade de Bioenergia e Biorrefinarias, Estrada do Paço do Lumiar 22, 1649-038 Lisbon, Portugal
2
Department of Bioengineering, iBB—Institute for Bioengineering and Biosciences, Instituto Superior Técnico, Universidade de Lisboa, Av. Rovisco Pais, 1049-001 Lisbon, Portugal
3
Associate Laboratory, i4HB—Institute for Health and Bioeconomy, Instituto Superior Técnico, Universidade de Lisboa, 1049-001 Lisbon, Portugal
4
Łukasiewicz Research Network, Łukasiewicz Centre, Poleczki 19, 02-822 Warsaw, Poland
*
Author to whom correspondence should be addressed.
These authors contributed equally to this work.
Processes 2024, 12(3), 558; https://doi.org/10.3390/pr12030558
Submission received: 14 February 2024 / Revised: 29 February 2024 / Accepted: 4 March 2024 / Published: 12 March 2024

Abstract

:
Microbial oils can be used as an alternative sustainable and renewable feedstock to fossil reserves for producing lubricants and polyurethane materials. Two oleaginous yeasts were grown on non-detoxified corn stover hydrolysate supplemented with corn steep liquor and mineral medium in shake flasks. Trichosporon oleaginosus DSM 11815 displayed the highest lipid production. This strain was further cultivated in a bench bioreactor, using the same culture medium, under a batch regime. Flow cytometry was used to monitor the T. oleaginosus culture using the dual staining technique (SYBR Green and PI) for cell membrane integrity detection. Values of 42.28% (w/w) and 0.06 g/Lh lipid content and lipid productivity, respectively, were recorded for T. oleaginosus cultivated in the bench bioreactor operated under a batch regime. During the cultivation, most of the yeast cells maintained their integrity. T. oleaginosus has the potential to be used as an oil microbial source for a wide range of industrial applications. In addition, it is robust in adverse conditions such as lignocellulosic hydrolysate exposure and oxygen-limiting conditions. Flow cytometry is a powerful and useful tool for monitoring yeast cultivations on lignocellulosic hydrolysates for cell count, size, granularity, and membrane integrity detection.

1. Introduction

Nowadays, lubricants and polyurethane (PU) materials are widely present in everyday life, the former being indispensable for most machinery, and the latter having several industrial applications such as for foams, coatings, insulations, adhesives, paints, or upholstery. However, most of the market for these products is still dominated by petrol-based products. According to recent concerns about the circular economy, as well as the rising price of petrol and the reserve depletion prediction, several studies have been conducted to find suitable renewable raw materials to produce bio-based/green alternatives [1,2]. In addition to having higher biodegradability and reduced toxicity, these novel alternatives also hold several distinct properties. For example, compared to conventional fossil lubricants, biolubricants demonstrate a higher viscosity index, good lubricity, improved anti-corrosion properties, or a higher flash point [2], whereas bio-based PUs show more toughness, more mechanical, corrosion, and chemical resistance, or low-temperature flexibility [1].
For these reasons, vegetable oils (VOs) have emerged as an alternative feedstock to petroleum for producing lubricants and polyols as precursors to PU production. VOs consist of triacylglycerides (TAGs) whose predominant fatty acids are oleic (18:1ω-9), linoleic (18:2ω-6), and α-linolenic (18:3ω-6) acid chains [2].
Nevertheless, according to the Food and Agriculture Organization of the United Nations (FAO), due to the environmental, food competition, and land use change (LUC) concerns inherent to the intensive planting of oil crops such as oil palm, soybean, sunflower, or rape [3], the fears arising from climate change or the war in Ukraine [4] (FAO, 2022), and the more than 10 times higher price of VOs compared with crude oil [3], the interest in analogous low-cost oils such as waste cooking oils [5] or microbial oils produced from residual substrates [6] has strongly grown, supported by market competitiveness and their minimal environmental impacts compared to vegetable oils.
Oleaginous microorganisms usually store their lipids as triacylglycerols, and as droplets in the cytosol. These compounds are considered as a potential source for biofuels and bioproducts since their fatty acid composition is similar to that of VOs.
Microbial oils have several advantages over VOs, such as higher productivity, simpler upstream and downstream processing, flexibility of genetic modification for a target product, ease of cultivation in a controlled environment, and non-dependence on climatic conditions. Although some microalgae and yeast strains can accumulate lipids, the microalgal oil is generally composed of a higher proportion of polyunsaturated acids. Thus, the autooxidation of these compounds compromises the quality of the biodiesel produced from microalgal lipids. Furthermore, the cultivation of microalgae requires large areas, light, and a long period of aging, which raises technical and economic issues.
Oleaginous yeasts accumulate more than 20% of lipids of their dry weight which, as microalgal oil, can be further extracted and converted into a range of bioproducts, namely biofuels, bioplastics, biopolymers, biosurfactants, and other products with industrial applications [7]. However, this process is still not competitive when compared to low-price fossil fuels, or even to first-generation biofuels.
A possible approach to reduce the process costs consists of using low-cost and abundant substrates, such as lignocellulosic residues. Corn stover (CS) is a lignocellulosic material consisting essentially of stalks, leaves, and husks left over from maize harvests. It is estimated that between 2022 and 2023, around 1151.36 Mt of maize was produced worldwide, ranking it first among the most important grains in the world, followed by wheat and rice [8]. Considering that about 50% w/w of the maize plant corresponds to the stover fraction, roughly 1.15 Gt of CS was produced during the same period all over the globe. CS is considered a promising substrate for producing a wide range of bioproducts including industrial enzymes (e.g., cellulases and xylanases), and CS hydrolysate (CSH) has been used as a carbon source in media formulations for microbial cultivations [9].
However, lignocellulosic materials have a recalcitrant structure, composed of three main polymers: cellulose, hemicellulose, and lignin. Hemicellulose is a heteropolymer composed of mainly five-carbon sugars (mainly xylose), and cellulose is a homopolymer composed of six-carbon sugars (glucose). The remaining part is composed of non-structural components such as protein, pectin, and ash. More than half of the total dry weight of the lignocellulosic biomass is composed of carbohydrates, which can be used as a carbon source for heterotrophic microbial lipid production. The conversion of cellulose and hemicellulose into fermentable monosaccharides (glucose and mainly xylose, respectively) might be accomplished by hydrolysis, but this should be preceded by a pretreatment step [10]. Pretreatment aims to decrease biomass recalcitrancy by reducing the cellulose crystallinity and increasing the porosity of the material to allow the entry of enzymes [11]. After pretreatment, the biomass is submitted to a hydrolysis step, which can be promoted by chemical, thermal, or biological methods, after which the cellulose and hemicelluloses are converted into simple sugars, and these are converted by yeasts into the final desirable product. Depending on the technology applied for pretreatment and hydrolysis, inhibitory compounds might be formed to different extents. These are directly derived from biomass composition (i.e., acetic acid and phenolic compounds) or from sugar degradation reactions (e.g., organic acids—formic and levulinic acids—and furan derivates—5-hydroxymethylfurfural (HMF) and furfural). As a result, the culture media prepared from lignocellulosic hydrolysates may also contain these potential inhibitory compounds that affect microbial growth and lipid production [12]. Therefore, it is important to monitor the yeast cells’ physiological status during such fermentations to evaluate the impact of these inhibitory compounds on the cells to establish a cultivation strategy that leads to the highest lipid yields. Flow cytometry (FC) has been used to monitor yeast cultures developed on lignocellulosic hydrolysates [12].
In this study, two oleaginous strains (Trichosporium oleaginosus and Rhodosporidium babjevae) were grown on corn stover hydrolysate for lipid production. The strain exhibiting the highest lipid content was further grown in a 7-L reactor on CSH, under a batch regime. FC was used to monitor the yeast cultivation on CSH in the bioreactor. The yeast biomass was further processed for subsequent lipid extraction and quantification.

2. Materials and Methods

2.1. Feedstock

CS, kindly supplied by Florecha—Forest Solutions, S.A. (Chamusca, Portugal), was used as feedstock.
CSL was used as a nitrogen source and was kindly provided by Copam–Companhia Portuguesa De Amidos, S.A. (Loures, Portugal), being a by-product of this starch industry during the corn wet-milling step. The liquor was analyzed by high-performance liquid chromatography (HPLC) (Section 2.6.2) and using the Kjeldahl method, presenting a lactic acid concentration of 0.11 ± 0.00 g/g and a total Kjeldahl nitrogen value of 28.2 ± 0.4 mg/g.

CSH Preparation

In order to release fermentable monosaccharides from corn stover, the corn stover was subject to a pretreatment stage prior to enzymatic hydrolysis. Pretreatment was performed at pilot scale based on proprietary non-catalyzed steam explosion technology initially developed by the company STEX® (São Paulo, Brazil) and since 2019 in partnership with LNEG. After pretreatment, the solid fraction was washed with water at room temperature and directly submitted to the enzymatic hydrolysis stage. The solid fraction suspended at an initial solids’ concentration of 180 g/L (dried basis) was enzymatically hydrolyzed at 50 °C in a 600 L stirred-tank reactor for 48 h by applying Cellic® CTec3 cocktail (Novozymes, Copenhagen, Denmark) at a dosage of 4% (w/w dried solids). The resulting hydrolysate (CSH) was centrifuged at 12,000× g for 15 min, at 4 °C (SIGMA, 6-16KS, Osterode am Harz, Germany), to remove the unreacted solids, and then appropriately stored (frozen) until use. The hydrolysate was analyzed by HPLC (Section 2.6.2), exhibiting the following composition: 45.0 ± 0.6 g/L of glucose, 21.8 ± 0.4 g/L of xylose, 0.9 ± 0.0 g/L of formic acid, 3.0 ± 0.0 g/L of acetic acid, 136 ± 3 mg/L of furfural, and 64 ± 1 mg/L of HMF (vestigial). This sugar composition corresponds to high hydrolysis yields of 83% and 98% for the conversion of cellulose and xylan fractions, respectively, into glucose and xylose. CSH was further analyzed by the Kjeldahl method, resulting in a total nitrogen value of 0.246 ± 0.002 mg N/g.

2.2. Strains

Two yeast strains were tested: R. babjevae DBVPG 8058 (Industrial Yeasts Collection of Perugia, DBVPG) and T. oleaginosus DSM 11815 (German Collection of Microorganisms and Cell Cultures, DSMZ). The microorganisms were stored at 4 °C on malt extract agar (MEA) slants.

2.3. Inocula

For each microorganism, inocula were prepared in duplicate by transferring cells from two MEA slants to 150 mL of a sterile liquid medium containing 20 g/L of dextrose, 20 g/L of peptone, and 10 g/L of yeast extract (YPD) at pH 5.5 in baffled 1 L-Erlenmeyer flasks. Incubation was carried out at the optimal temperatures for each microorganism—25 °C and 30 °C for R. babjevae and T. oleaginosus, respectively—under orbital shaking at 120 rpm for 24 h (INFORS HT Unitron, Houston, TX, USA). At that time, the cells entered the exponential phase. The inocula cultures were observed under an optical microscope to detect possible contaminations (Section 2.4).

2.4. Strain Screening Test

The two yeast strains were cultivated in baffled 1 L Erlenmeyer flasks containing 150 mL of a sterile complex medium (CSH + CSL + MM) composed of 90% CSH, 2% CSL solution at 500 g/L, 2% mineral medium (MM) (stock solution 250 g/L (NH4)2SO4, 15 g/L KH2PO4, and 15 g/L MgSO4), and 6% deionized water (v/v), previously adjusted to pH 5.5.
In order to determine the biomass concentration, substrate consumption (glucose and xylose), and inhibitory compound concentration (organic acids, HMF, and furfural), small volumes of culture broth were collected throughout the cultivations’ time course at regular time intervals. At the end of the cultivations, the yeast culture broths were centrifuged at 8000 rpm for 8 min at 4 °C (SIGMA, 6-16KS, DE) to collect the wet cellular pellet, which was stored in the freezer (−18 °C) for subsequent freeze-drying at −55 °C for 24 h (Heto PowerDry LL3000 Freeze Dryer system from Thermo Fisher Scientific, Waltham, MA, USA, coupled to a Vacuubrand RZ 2.5 vacuum pump, Vacuubrand, Wertheim, Germany.). The final freeze-dried biomass was then stored in the freezer for further lipid characterization and quantification by gas–liquid chromatography with a flame ionization detector (FID-GC) (Section 2.5), and total lipid quantification by the Soxhlet method (Section 2.6).
Since the culture medium, without cells, contained many particles, it was necessary to discount them from the culture medium with cells to eliminate particulate interference with the yeast biomass quantification, by subtracting the dry cell weight of the medium without cells from the dry cell weight of the medium containing the yeast cells.

2.5. Lab-Scale Bioreactor Cultivation

Once the best-performing strain was selected, a benchtop stirred-tank reactor (STR) system with 7 L total volume (Electrolab Biotech, Fermac 310, Tewkesbury, UK) was operated under a batch regime, containing 2 L of CSH + CSL + MM (Section 2.4) inoculated with the selected strain (10% v/v).
Temperature was kept constant at 30 °C, and pH was kept constant at 5.5, by the addition of HCl 2.5 M and NaOH 2.5 M solutions. The stirring rate was set manually due to the foam formation. The aeration flow rate was maintained at 1 vvm throughout the cultivation time course. Polypropylene glycol anti-foaming agent was added whenever the foam formation was excessive. The system and all the solutions were pre-sterilized, and all air inlets of the system were fitted with sterilizing PTFE filters with a 0.2 µm porosity (Sartorius, Midisart ® 2000, Göttingen, Germany). Once a day, samples were analyzed by FC (Section 2.3) for cell size, inner complexity, and membrane integrity detection, as well as viable and total cell counts.

2.6. Analytical Procedures

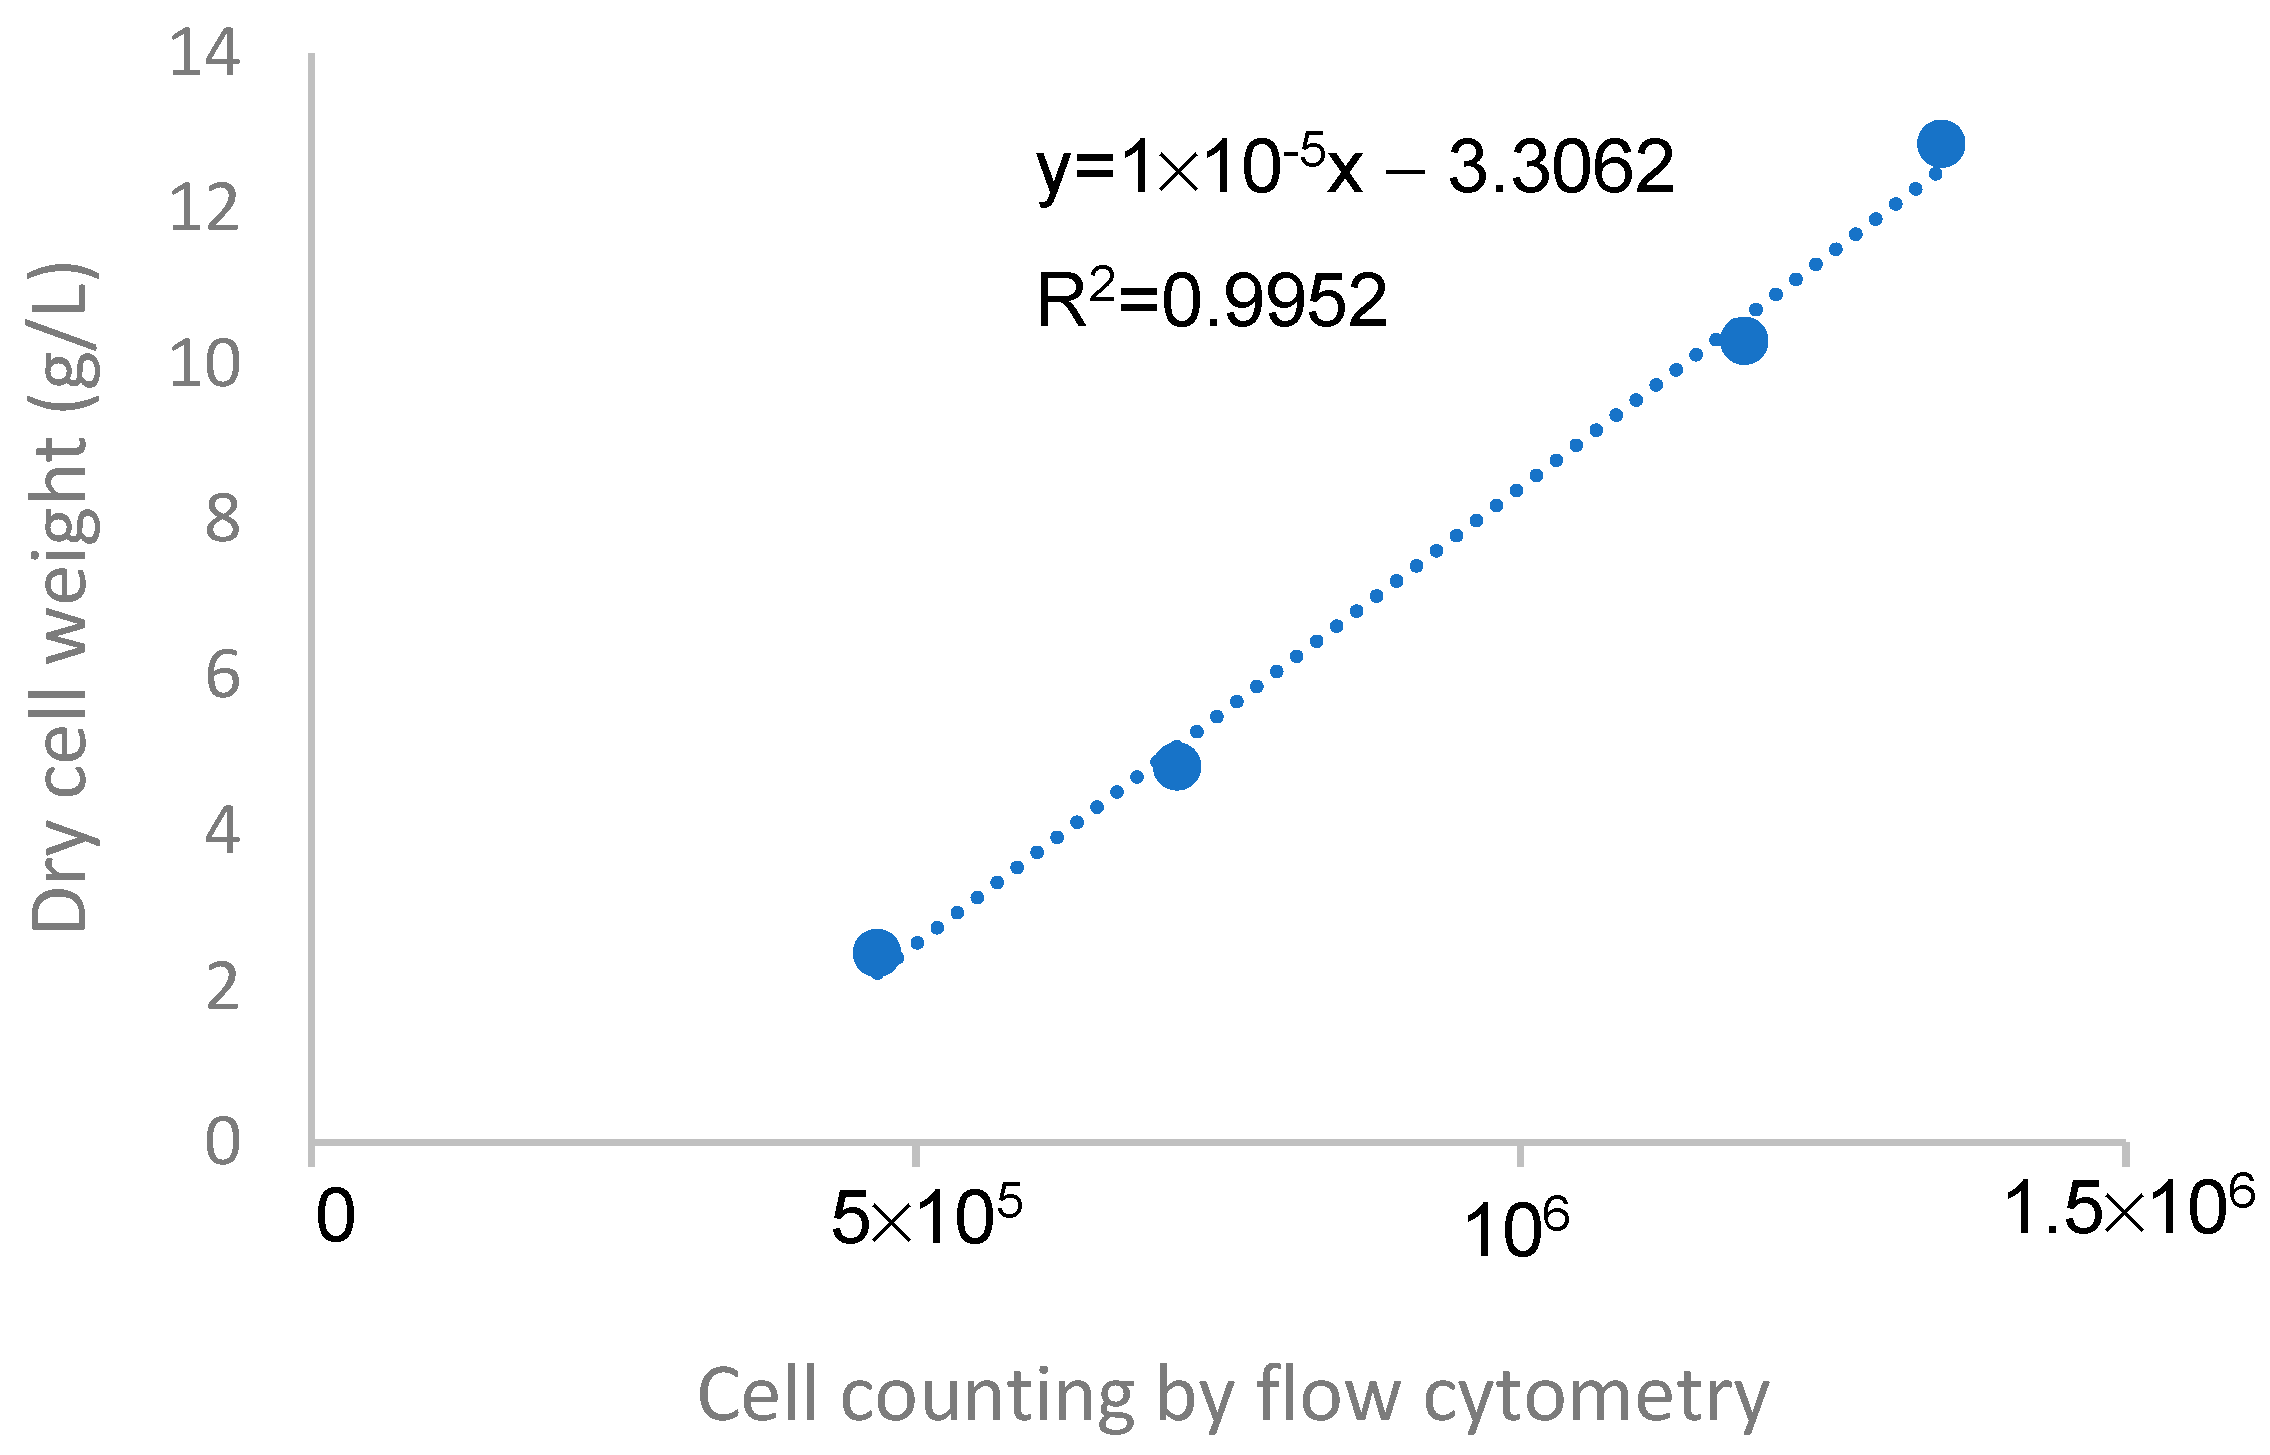
2.6.1. Biomass Quantification

The turbidimetric quantification of yeast biomass for each sample was performed by measuring the absorbance at a wavelength of 600 nm (OD600 nm) in a spectrometer (Thermo Scientific™ GENESYS™ 20, Waltham, MA, USA). For samples taken from cultures in complex hydrolysate, the OD600nm value regarding the respective non-inoculated medium was subtracted.
Additionally, the biomass concentration’s gravimetric quantification was performed by weighting the cell pellet containing 1 mL of culture broth, which was centrifuged at 9000 rpm for 5 min (Heraeus Sepatech Biofuge 15, DE, Hanau, Germany), with the remaining pellet then washed and resuspended in 1 mL of deionized water. After a second centrifugation under the same conditions, the final pellet was oven-dried at 100 °C overnight.
To discount the fraction of solids inherent to the culture medium containing CSH and CSL, the respective non-inoculated medium was subjected to the same protocol.

2.6.2. Sugar, Short-Chain Organic Acid, and Sugar-Derived Aldehyde Quantification

The quantification of sugars (glucose and xylose), short-chain organic acids (acetic and formic), and sugar-derived aldehydes (HMF and furfural) in the supernatants was carried out by HPLC.
Samples were automatically injected (5.0 µL) into an HPLC system (1260 Infinity II, Agilent, Santa Clara, CA, USA) equipped with a cation exchange column (Aminex HPX-87H, Bio-Rad, Hercules, CA, USA), a pre-column of equivalent charge (Bio-Rad, USA), a diode-array detector (DAD) for HMF and furfural quantification at 280 nm, and a refractive index detector (RID) for the quantification of the remaining analytes, the latter operating at 45 °C. Isocratic elution (H2SO4, 5 mM) was performed at a flow rate of 0.6 mL/min at a column temperature of 50 °C. The analysis period was 60 min for all samples containing furans. All chromatograms were processed and integrated using the software OpenLab CDS 2.6 (Agilent, USA).

2.6.3. FC Analysis

Samples taken throughout the yeast cultivation in the 7 L bioreactor were analyzed by FC for cell count, size, granularity, and membrane integrity using a flow cytometer (Beckman Coulter, CytoFLEX Flow Cytometer, New Paris, IN, USA) equipped with two solid-state lasers, emitting at 488 and 638 nm; two sensors for detection of light scatter, forward, FSC, and side, SSC; and six fluorescence channels. FSC is proportional to cell size, while SSC is proportional to cell granularity. The fluorescent detectors detect intracellular fluorescent compounds such as pigments or cells stained with specific fluorochromes.
In this work, the double-staining method coupled with FC was also used to evaluate the yeast cells’ membrane integrity during the cultivations, using two fluorescent stains: SYBR Green I (SYBR, Nucleic Acid Gel Stain, Thermo Fisher Scientific, USA), which was used to differentiate the yeast cells from the background, and propidium iodide (PI, Thermo Fisher Scientific, Propidium Iodide, USA), which was used to detect the yeast cell membrane integrity.
The FITC detector (525 ± 40 nm) and PC5.5 detector (690 ± 50 nm) were utilized to detect the fluorescence emitted by the double-stained yeast cells.
All the light scatter and fluorescence signals were plotted in logarithmic scale cytograms using CytExpert 2.4 software (Beckman Coulter, USA). The equipment was calibrated daily using a suspension of around 3 µm fluorospheres with an emission range from 410 to 800 nm (Beckman Coulter, CytoFLEX Daily QC Fluorospheres, USA).
All samples, before FC analysis, were subjected to cellular ultrasonic disaggregation (TranssonicT660/H, Elma, Wetzlar, Germany) for 10 s, at 35 kHz, followed by vigorous homogenization to destroy possible cell aggregates. For the control, unstained samples were previously run in the FC to adjust the cell autofluorescence to the first log decade in the fluorescence density plots (FITC versus PC5.5 channels). This procedure allowed distinguishing unstained from stained cells in the plots. The event flux was also adjusted to 800 to 1200 events/s. Whenever necessary, the samples were diluted with PBS solution (Oxoid, Hampshire, UK) in a total volume of 500 µL. Then, the samples were stained with 3 µL of SYBR and 1 of µL PI, and incubated in the darkness for 30 min. Afterwards, the samples were again homogenized in the vortex and analyzed in the FC.

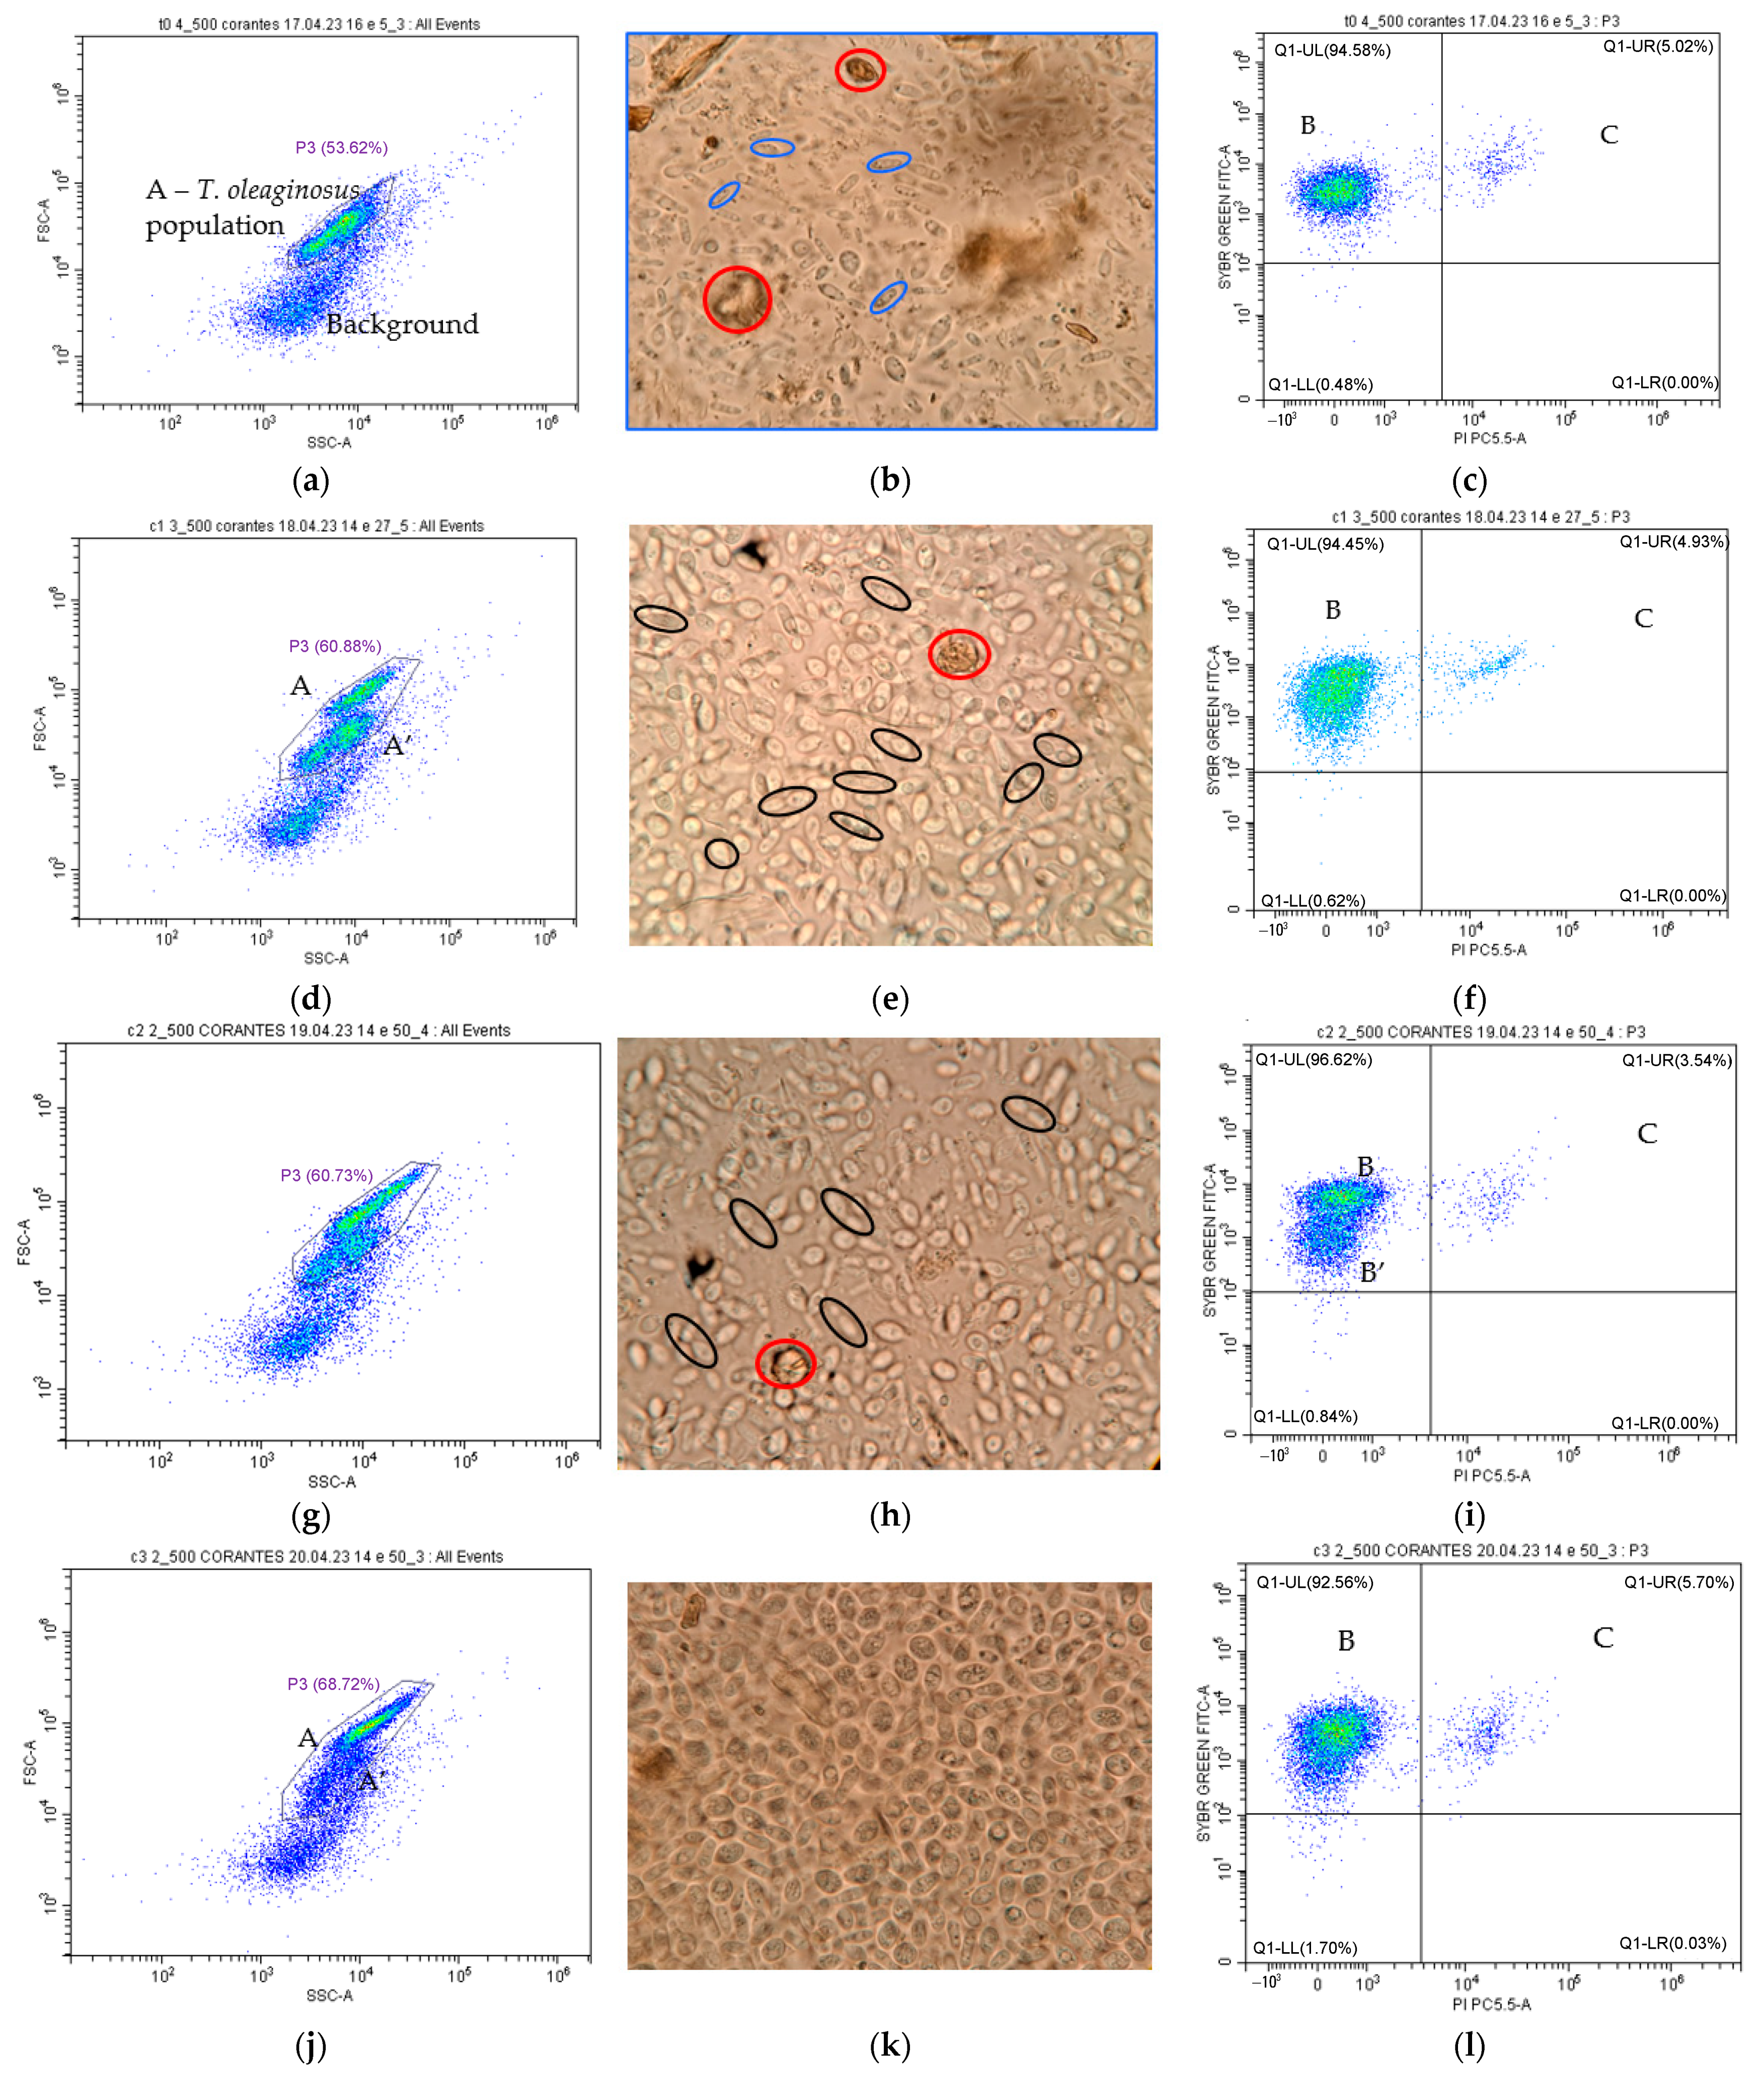
2.6.4. Optical Microscope Observations

Once a day, samples collected from the cultures were analyzed under an optical microscope for earlier contamination detection, using a microscope (Olympus, BX60, Tokyo, Japan) under 100×, 400×, and 1000× magnifications. Whenever a suspected contamination was detected, the sample was plated into MEA slants and incubated for 24 h to allow the contaminant to grow. The results from contaminated cultures were discarded.

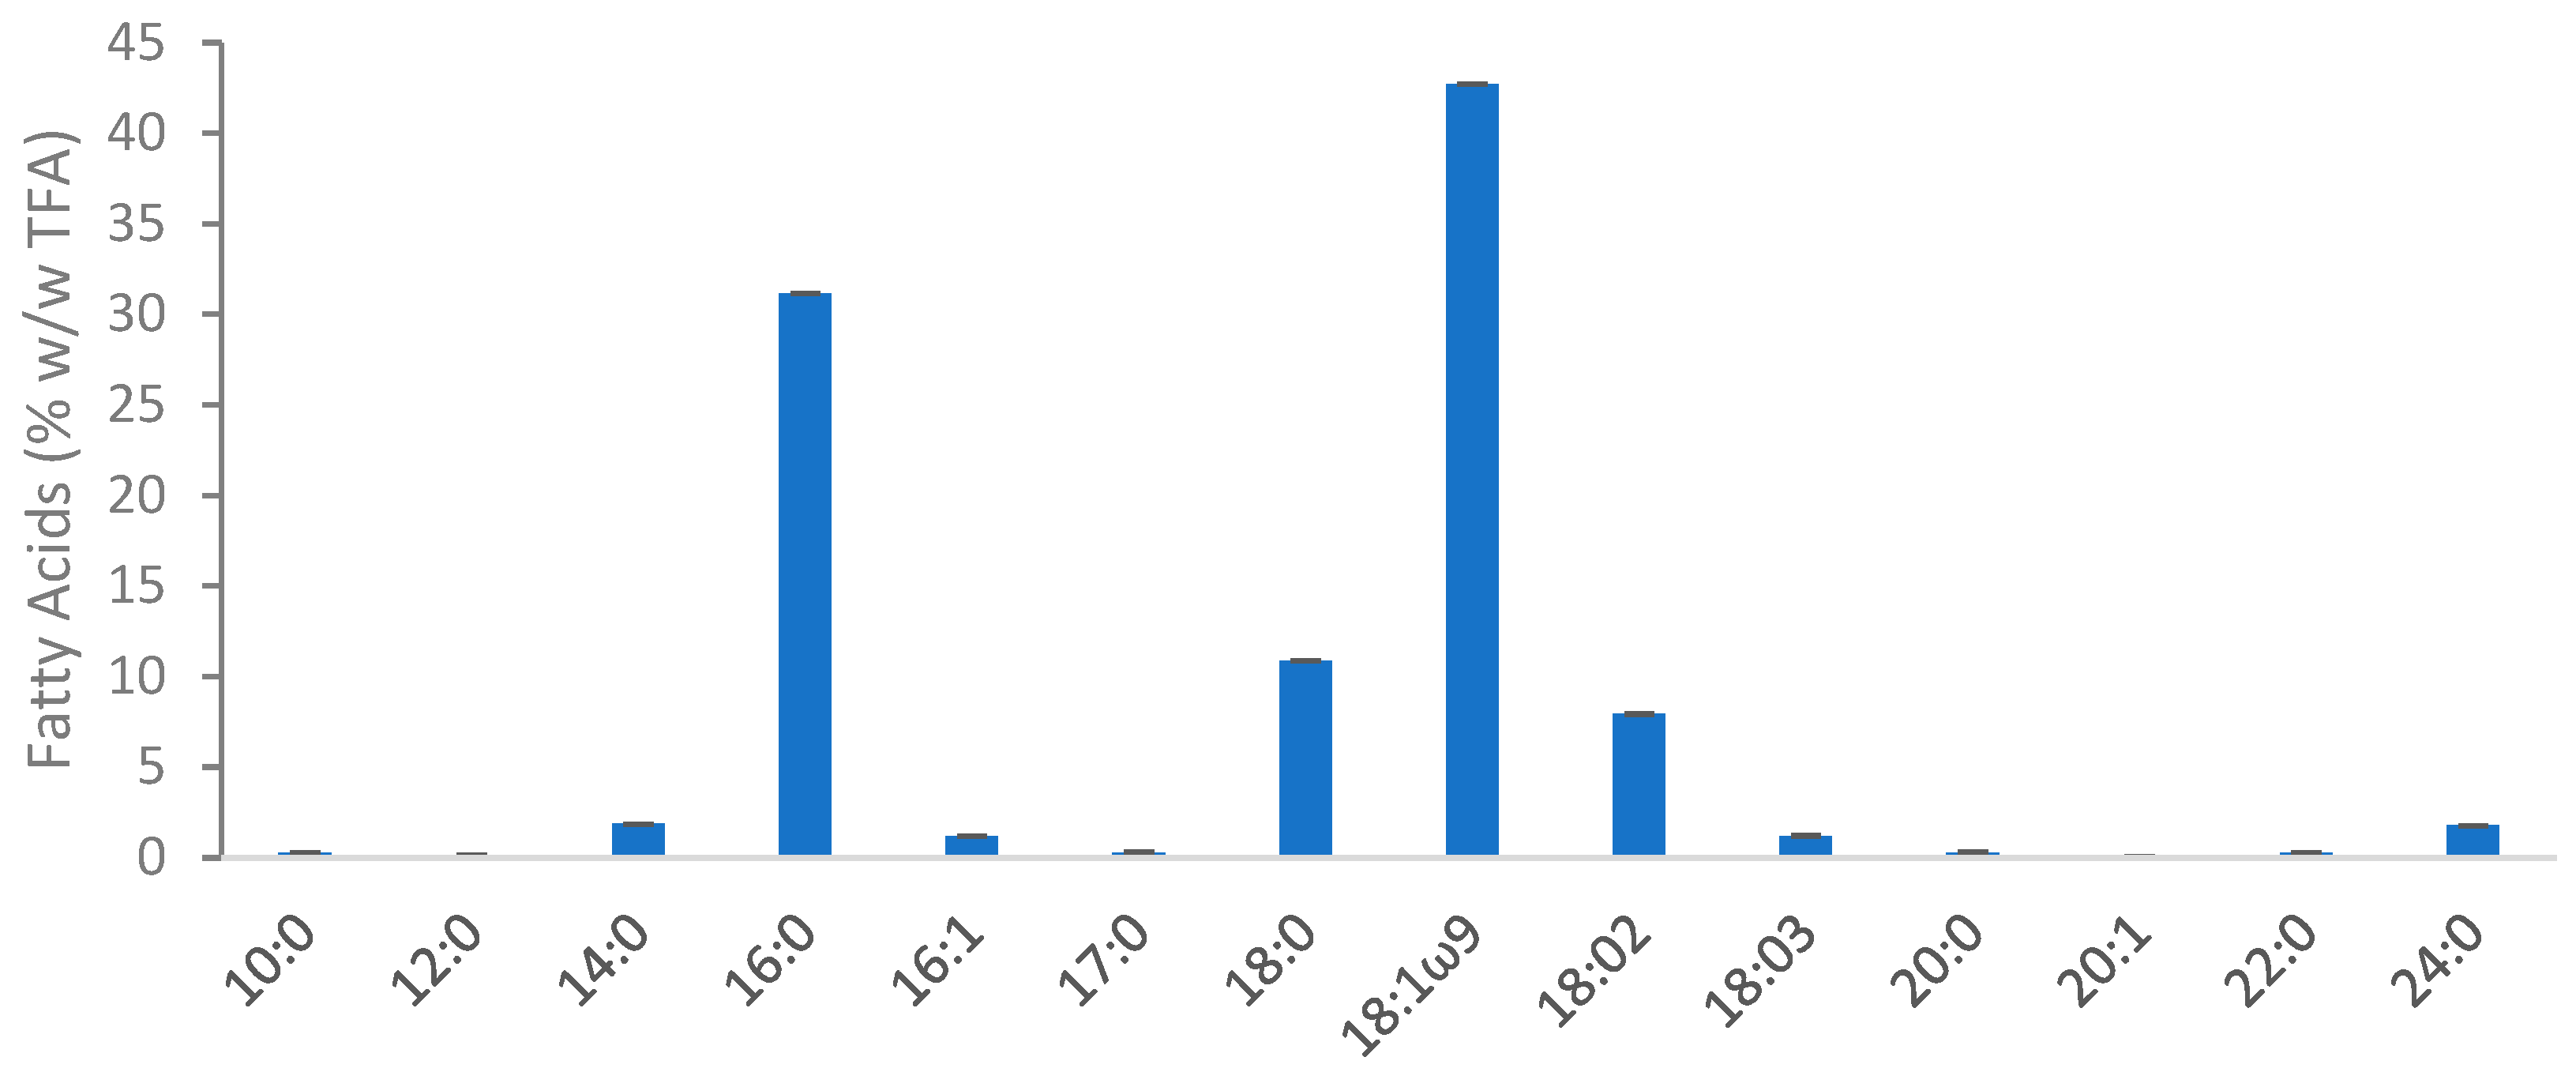
2.6.5. Fatty Acid Profile and Quantification

The characterization and quantification of fatty acids (FAs) present in the previously freeze-dried yeast biomass were performed in a gaseous chromatograph (GC) equipped with a flame ionization detector (FID-GC), based on the corresponding fatty acid methyl esters (FAMEs), via a transesterification procedure adapted from [13]. For each analysis, about 100 mg of the freeze-dried sample was transferred into Schott test tubes, under an inert nitrogen atmosphere, followed by the addition of 2 mL of a methanol/acetyl chloride solution (95:5% v/v) and 0.2 mL of a tridecanoic acid C13:0 solution (Nu-Chek-Prep, Elysian, MN, USA) (5 g/L in petroleum ether, boiling point 80–100 °C) used as an internal standard. The contents of the tubes were subjected to a heat-catalyzed acid transesterification reaction, in a water bath regulated at 80 °C, for 1 h.
At the end of the reaction, and after cooling the tubes, 2 mL of n-heptane was added, followed by the addition of 1 mL of deionized water, gently shaken, to ensure an efficient mass transfer between the two phases.
The organic phase (of lower density) was collected and filtered through columns containing anhydrous Na2SO4, with the aim of its complete dehydration, and eventually was transferred to an appropriate vial for FID-GC analysis. Each sample was processed in duplicate.
The content of each vial was analyzed in FID-GC equipment (SCION 436-GC, Bruker, Billerica, MA, USA, combined with a CP-8400 automatic injector from the same manufacturer) fitted with a fused-silica capillary column (internal diameter of 0.32 mm and total length of 30 m) internally layered with a polyethylene glycol (PEG) stationary phase (SUPELCOWAX™ 10, Sigma-Aldrich, St. Louis, MO, USA) with a thickness of 0.32 mm, using helium as a carrier gas, at a corresponding pressure of 13.5 psi.
The injector and detector operated, respectively, at 250 °C and 280 °C, and the column was subjected to a thermal program starting at 200 °C for 1 min, then increasing at a rate of 2.5 °C/min until reaching 240 °C, remaining at the latter temperature until 22 min into the analysis. The split injection system was set at a split ratio of 1:5 and a sampling volume of 0.5 µL.
For the identification of the different peaks detected in each sample, commercial reference standards (GLC-75 and GLC-85 from Nu-Chek-Prep, USA) were simultaneously analyzed, and the FAMEs identification was performed based on the retention time. All chromatograms were obtained and integrated in Compass CDS software version 4.2 (SCION Instruments, Goes, Switzerland).

2.6.6. Total Lipid Quantification

The quantification of the total lipid content in the freeze-dried yeast biomass samples was performed using the Soxhlet solid–liquid extraction method. The preparation of each sample began with cell disruption using a bead mill (MM 400, Retsch®, Haan, Germany) working with 1 cm diameter metallic beads, at a frequency of 30 s−1, for 3.40 min. The extraction system consisted, from bottom to top, of a heating plate, a distillation flask containing 160 mL of hexane as a non-polar extracting solvent, an extraction chamber in which a single porous thimble containing about 500 mg of previously disrupted yeast biomass was inserted, and a water-cooled Allihn condenser. The extraction was performed for 6 h. Afterwards, the flasks containing the extracted lipid-rich organic solvent were cooled to room temperature. The removal of the extracting solvent, for recovery of extracted lipids, was conducted in a rotary evaporator (Rotavapor® R110, Büchi, Flawil, Switzerland, coupled to a Vac® V-500 vacuum pump, Vacuubrand, Wertheim, Germany with the water bath set at 40 °C, in order to prevent lipid degradation. The remaining oil phase in the flask was then incubated at 35 °C for 2 h for total volatilization of the hexane, and then transferred to a desiccator until reaching a constant weight.

2.6.7. Moisture Content

In order to normalize the total FA and total lipid results based on a dry basis, the moisture content of each freeze-dried sample was assessed gravimetrically via the oven-drying at 100 °C, overnight, of a small portion (about 100 mg) of the sample in a pre-weighted porcelain crucible of known oven-dried tare. The analysis was performed in duplicate.

2.7. Kinetic Parameters

The biomass productivity PX was calculated as follows:
P X = X f i n a l X i n i t i a l t
wherein Xinitial is the biomass concentration at t = 0 h, Xfinal is the biomass concentration at the end of the cultivation, and t is the cultivation time.
The maximum specific growth rate µmax was determined as the maximum slope calculated from the plot of ln X versus t.
The biomass yield YX/S was calculated as follows:
  Y X / S = X f i n a l   X i n i t i a l S u g i n i t i a l S u g f i n a l
wherein Suginitial is the sum of the initial concentrations of the sugars glucose and xylose, and Sugfinal is the sum of the final glucose and xylose concentrations.
The lipid yield YL/S was calculated as follows:
Y L / S = L f i n a l S u g i n i t i a l S u g f i n a l
wherein Lfinal is the final lipid concentration, Suginitial is the sum of the initial glucose and xylose concentrations, and Sugfinal is the sum of the final glucose and xylose concentrations.
The sugars’ (glucose and xylose) volumetric uptake rates (rglu and rxyl) were calculated as follows:
r s u g = [ S u g ] i n i t i a l [ S u g ] f i n a l t
wherein [Sug]initial is the initial sugar concentration and [Sug]final is the final sugar concentration at the end of the cultivation.
The organic acids’ volumetric uptake rates, racetic, rformic, and rlactic, were calculated as follows:
r o r g . a c i d = [ O r g . A c i d ] i n i t i a l   [ O r g . A c i d ] f i n a l t
wherein [Org.Acid]initial is the initial organic acid concentration, and [Org.Acid]final is the final organic acid concentration.

3. Results and Discussion

3.1. Yeast Strain Screening Test in CSH + CSL Complex Medium

The growth profiles and substrate uptakes for the two yeasts, cultivated on a complex CSH + CSL medium in shake flasks, are displayed in Figure 1.
The T. oleaginosus growth curve did not show a lag phase, attaining 27.48 g/L of biomass concentration at the end of the cultivation (t = 47 h, Figure 1a and Table 1). This was consistent with the substrate consumption profile: both glucose and xylose started to be consumed soon after the inoculation (although the glucose consumption rate was higher than the xylose consumption rate during the first 18 h of cultivation) and were completely exhausted at the end of the assay. Acetic, formic, and lactic acids were initially present at concentrations of 2.8 g/L, 0.9 g/L, and 1.3 g/L, respectively. The first two acids were completely consumed at t = 23 h, but 0.21 g/L of lactic acid remained in the broth at the end of the cultivation. Furfural and HMF were present at low concentrations (<0.2 g/L) and disappeared at the end of the experiment.
Contrarily, R. babejevae growth showed a lag phase of 40 h, evidencing that the cells were adapting to the growth conditions (Figure 1b and Table 1). The maximum biomass concentration was 12.95 g/L, attained at t = 66 h (Table 1). The residual glucose and xylose concentrations remained stable until t = 42 h. Afterwards, the yeast cells consumed 23.8 g/L of glucose until the end of the experiment. Xylose consumption was only 2.7 g/L. The acetic, formic, and lactic acid concentrations were initially 2.6, 0.9, and 1.2 g/L, and at the end of the cultivation were 0.0, 0.0, and 0.2 g/L, respectively. Again, furfural and HMF were also present at low concentrations and disappeared at the end of the assay.
The low initial concentrations of the organic acids, HMF and furfural, demonstrated that the CSH obtained after the steam explosion pretreatment followed by enzymatic hydrolysis produced few inhibitory degradation products. Such a procedure can avoid the expensive CSH detoxification step.
According to Table 1, T. oleaginosus cultivation showed higher biomass concentration and biomass productivity (PX) than R. babjevae cultivation (0.49 g/Lh and 0.08 g/Lh, respectively). Nevertheless, the specific growth rate µ was lower for the T. oleaginosus culture (0.054/h) compared to the R. babjevae culture (0.062/h). The volumetric rate of substrate consumption was also higher for T. oleaginosus cultivation for all the substrates (glucose, xylose, and acetic, formic, and lactic acid), as well as the biomass yield YX/S (0.39 and 0.28 g/g for T. oleaginosus and R. babjevae), demonstrating the best performance of the former when grown on CSH. Despite the inhibitory compounds HMF and furfural’s concentrations being low in the complex medium CSH + CSL + MM, these results demonstrated the higher resistance of T. oleaginosus to organic acids (acetic, formic, and lactic acids) compared to R. babjevae. Indeed, according to the Hasselbalch equation, the medium pH of 5.5 used in this work resulted in 82% acetic acid in its dissociated form, and 18% in its undissociated form. According to Fidio et al. [14], such conditions are very aggressive for yeast cells. In fact, acetic acid’s undissociated form (CH3COOH) is a much more toxic form for yeast cells than the dissociated form (CH3COO) since the former diffuses through the cell membrane. Once in the cytosol, dissociation of the acid will occur, depending on the intracellular pH, releasing protons. In order to maintain cell homeostasis, protons are pumped out of the cell, being transported across the membrane by the action of the plasma membrane ATPase, generating an increased ATP demand to compensate for the intracellular acidification, which leads to increased maintenance requirements in detriment to cell growth, resulting in lower biomass yields. Wang et al. [15] reported that the yeast T. cutaneum (a synonym for T. oleaginosus) is relatively sensitive to furfural but strongly tolerant to high concentrations of formic acid, acetic acid, levulinic acid, HMF, vanillin, and syringaldehyde at a medium pH of 5, being capable of the complete degradation of organic acids. This may explain the differences between the T. oleaginosus and R. babjevae growth and consumption kinetic parameters, revealing the higher tolerance of the former strain to the organic acids present in the lignocellulosic hydrolysates.
The kinetic parameters for the intracellular lipid accumulation for the two studied yeast strains grown on complex CSH + CSL medium are shown in Table 2. The lipid content and productivity, as well as the lipid yield, were higher for T. oleaginosus (24.6%, 0.14 g/Lh, and 0.11 g/g, respectively).
Brandenburg et al. [16] reported that R. babjevae DVBPG 8058 was the best strain in terms of biomass and lipid production among five oleaginous yeast strains grown on undiluted wheat straw hydrolysate (WSH) in 500 mL lab-scale bioreactors, having reached a biomass concentration of 28 g/L, a lipid content of 64.8% (w/w), and a lipid productivity of 0.19 g/Lh. One of the reasons for the differences between the results obtained for R. babjevae DVBPG 8058 within the present study (12.95 g/L of biomass concentration, 18.3% (w/w) of lipid content, and 0.04 g/Lh of lipid productivity) and those reported by Brandenburg et al. [16] might be the higher medium pH used by those authors (pH = 6), since a higher medium pH promotes the undissociated form of the organic acids, which is less toxic to the yeast cells. In addition, different culture media were used to grow R. babjevae DVBPG 8058 in the present study and by Brandenburg et al. [16]: while the former used the complex medium CSH + CSL + MM, the latter [16] used WSH supplemented with 1.7 g/L of YNB, 0.5 g/L of magnesium sulphate, and 2 g/L of ammonium phosphate. However, despite promoting yeast cell growth, YNB is an expensive complex nutrient which significantly increases the cost of the culture medium used to grow R. babjevae DVBPG 8058.
Based on these results, it was concluded that T. oleaginous was the best strain in terms of lipid production, and it was further cultivated in a 7 L bioreactor.

3.2. Bioreactor Experiment

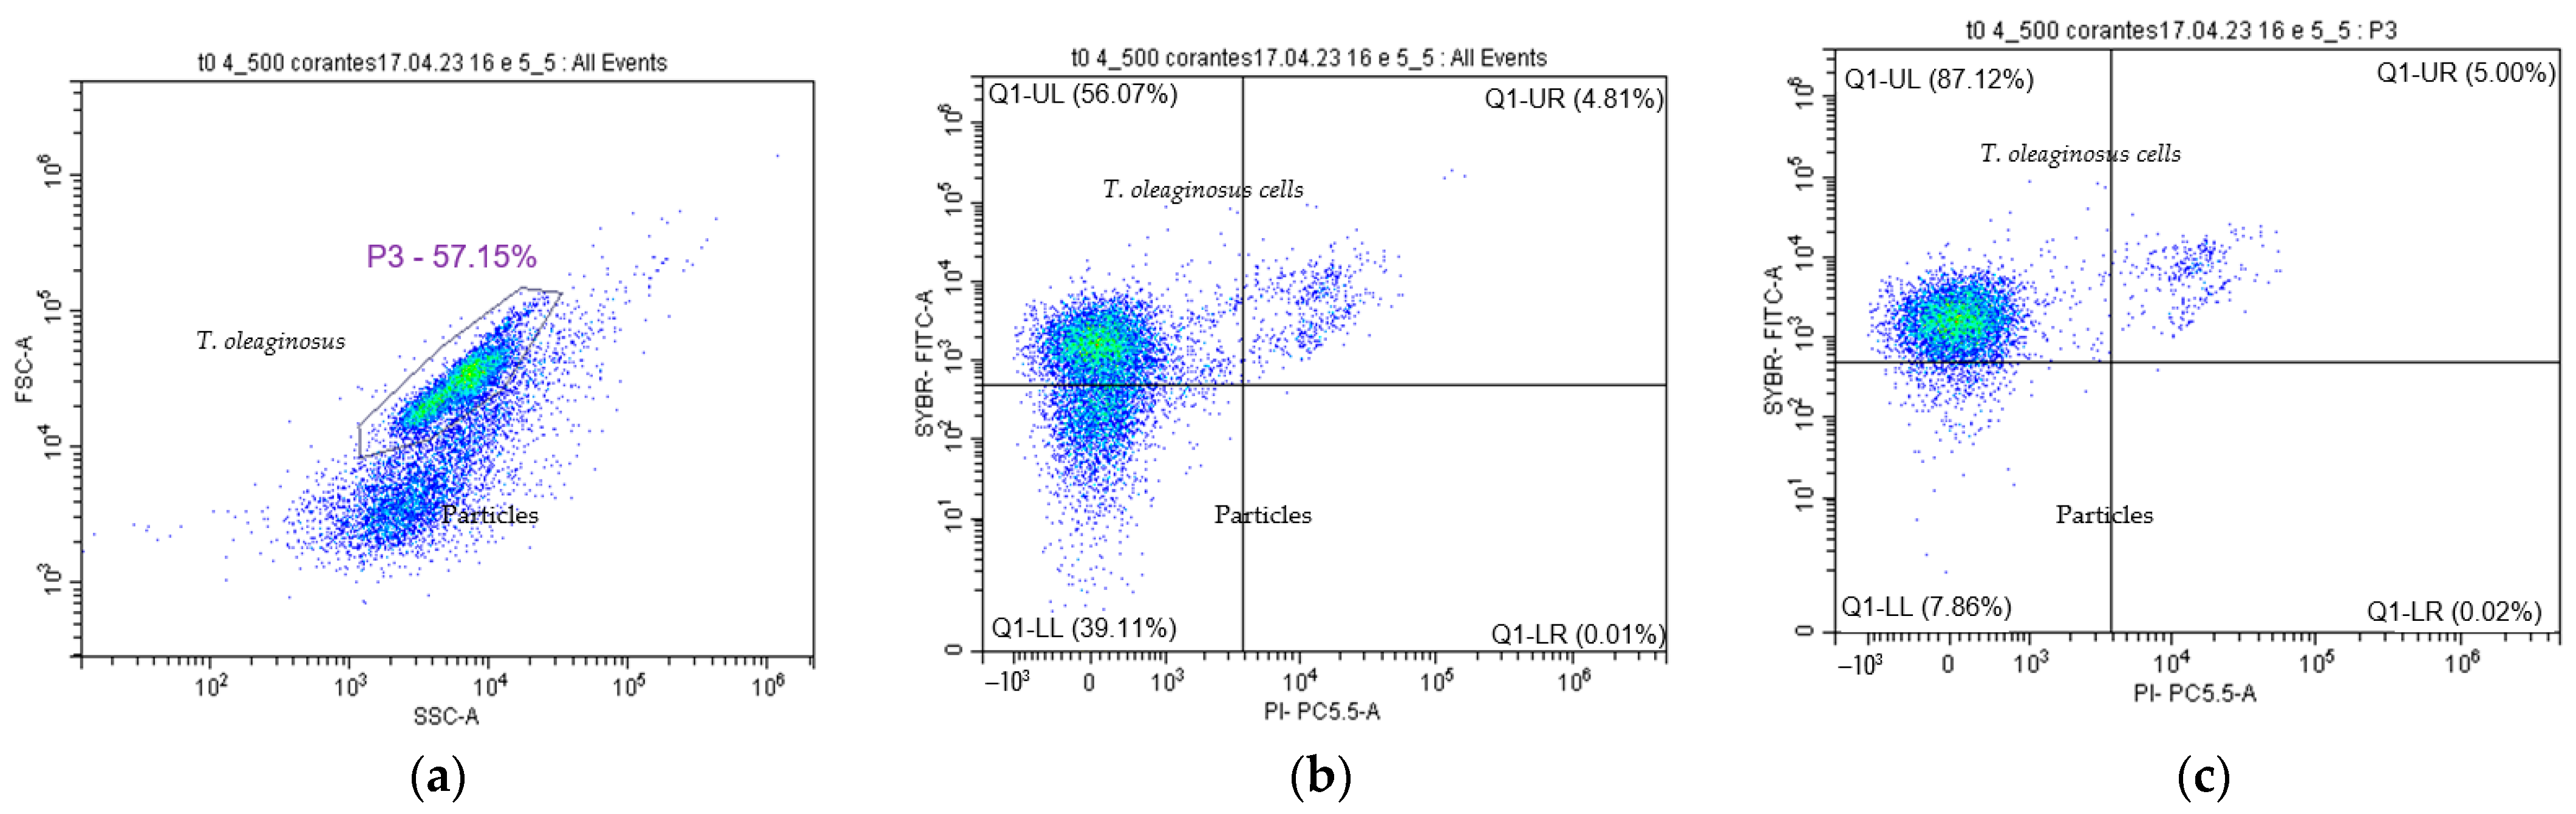
3.2.1. Flow Cytometry Preliminary Controls for T. oleaginous

The use of lignocellulosic hydrolysates to grow microbial cells results in misleading cell counts or biomass concentration assessment, since these hydrolysates usually contain high proportions of particles that interfere with those quantifications. Therefore, it is necessary to use strategies to differentiate the hydrolysate particles from the yeast cells for an accurate yeast cell count and/or biomass quantification.
An SYBR/PI staining mixture coupled with FC allows differentiating microbial cells from the medium particles, since the dye SYBR penetrates and stains all the cells. In addition, most of the yeast cells are larger than the medium particles, which allows their discrimination in the FSC/SSC plot. This is seen in Figure 2a: T. oleaginosus is shown as an elliptical distribution in the FSC/SSC plot as result of the diverse sizes and shapes of the yeast cells growing in the same culture at different growth phases. Indeed, yeast cells divide through a process of budding in which smaller daughter cells bud off the mother cell. Therefore, throughout yeast cultivation, different cells such as budding cells, small daughter cells, and old cells can be seen, which have different sizes and granularities [17].
It can be seen that the yeast elliptical distribution stood out from the background composed of particles and dust (Figure 2a). A gate (P3) was drawn around this distribution. The same sample was further stained with an SYBR/PI mixture and the stained cells were detected with the fluorescent detectors FITC-A and PC5.5-A. The respective SYBR/PI plot is shown in Figure 2b. The events which are stained with SYBR are located above the horizontal line and are yeast cells, since the SYBR dye penetrates all cells, further intercalating their DNA chains, boosting the cells’ fluorescence. The events which are located below the horizontal line are medium particles since they were not stained with SYBR. To further demonstrate that the elliptical population shown in FSC/SSC (Figure 2a) is T. oleaginosus cells, the P3 gate was selected and applied to the SYBR/PI plot (Figure 2c). Indeed, most of the events were placed above the horizontal line, as they were stained with SYBR, confirming that these events are yeast cells. Therefore, T. oleaginosus cell counting was performed after SYBR/PI staining to ensure that only cells were considered, without the particles’ interference.
Considering the presence of inhibitory compounds in CSH, such as organic acids, which are known to affect the yeast cells’ physiological state, the double-staining SYBR/PI procedure coupled with FC was also used to assess T. oleaginosus membrane integrity during the cultivations conducted in the 7 L bioreactor. First, aiming at identifying specific T. oleaginosus subpopulations for further comparison with the FC results obtained during yeast fermentations, preliminary control tests were performed, analyzing the oleaginous yeast T. oleaginosus cultivated on a YPD medium for 24 h under extreme physiological conditions: fully metabolic active cells were taken from an exponential culture (therefore, with mostly intact cell membranes) and heat-treated yeast cells were taken after a 30 min boiling water bath (therefore, mostly with injured membranes). The cytograms (density plots) concerning these analyses are shown in Figure 3.
A major subpopulation (98.84%) composed of cells stained with SYBR but not with PI (SYBR+PI−) is depicted in Figure 3a, corresponding to exponentially growing yeast cells with intact membranes, since they were not stained with PI. As expected, the heat-treated cells (98.8%) appear in the upper right quadrant, being double-stained with SYBR+/PI+.
From Figure 3, it was concluded that the double-staining procedure coupled with FC was a successful procedure for differentiating T. oleaginosus cells from the medium particles, but also for differentiating intact from permeabilized yeast cells.

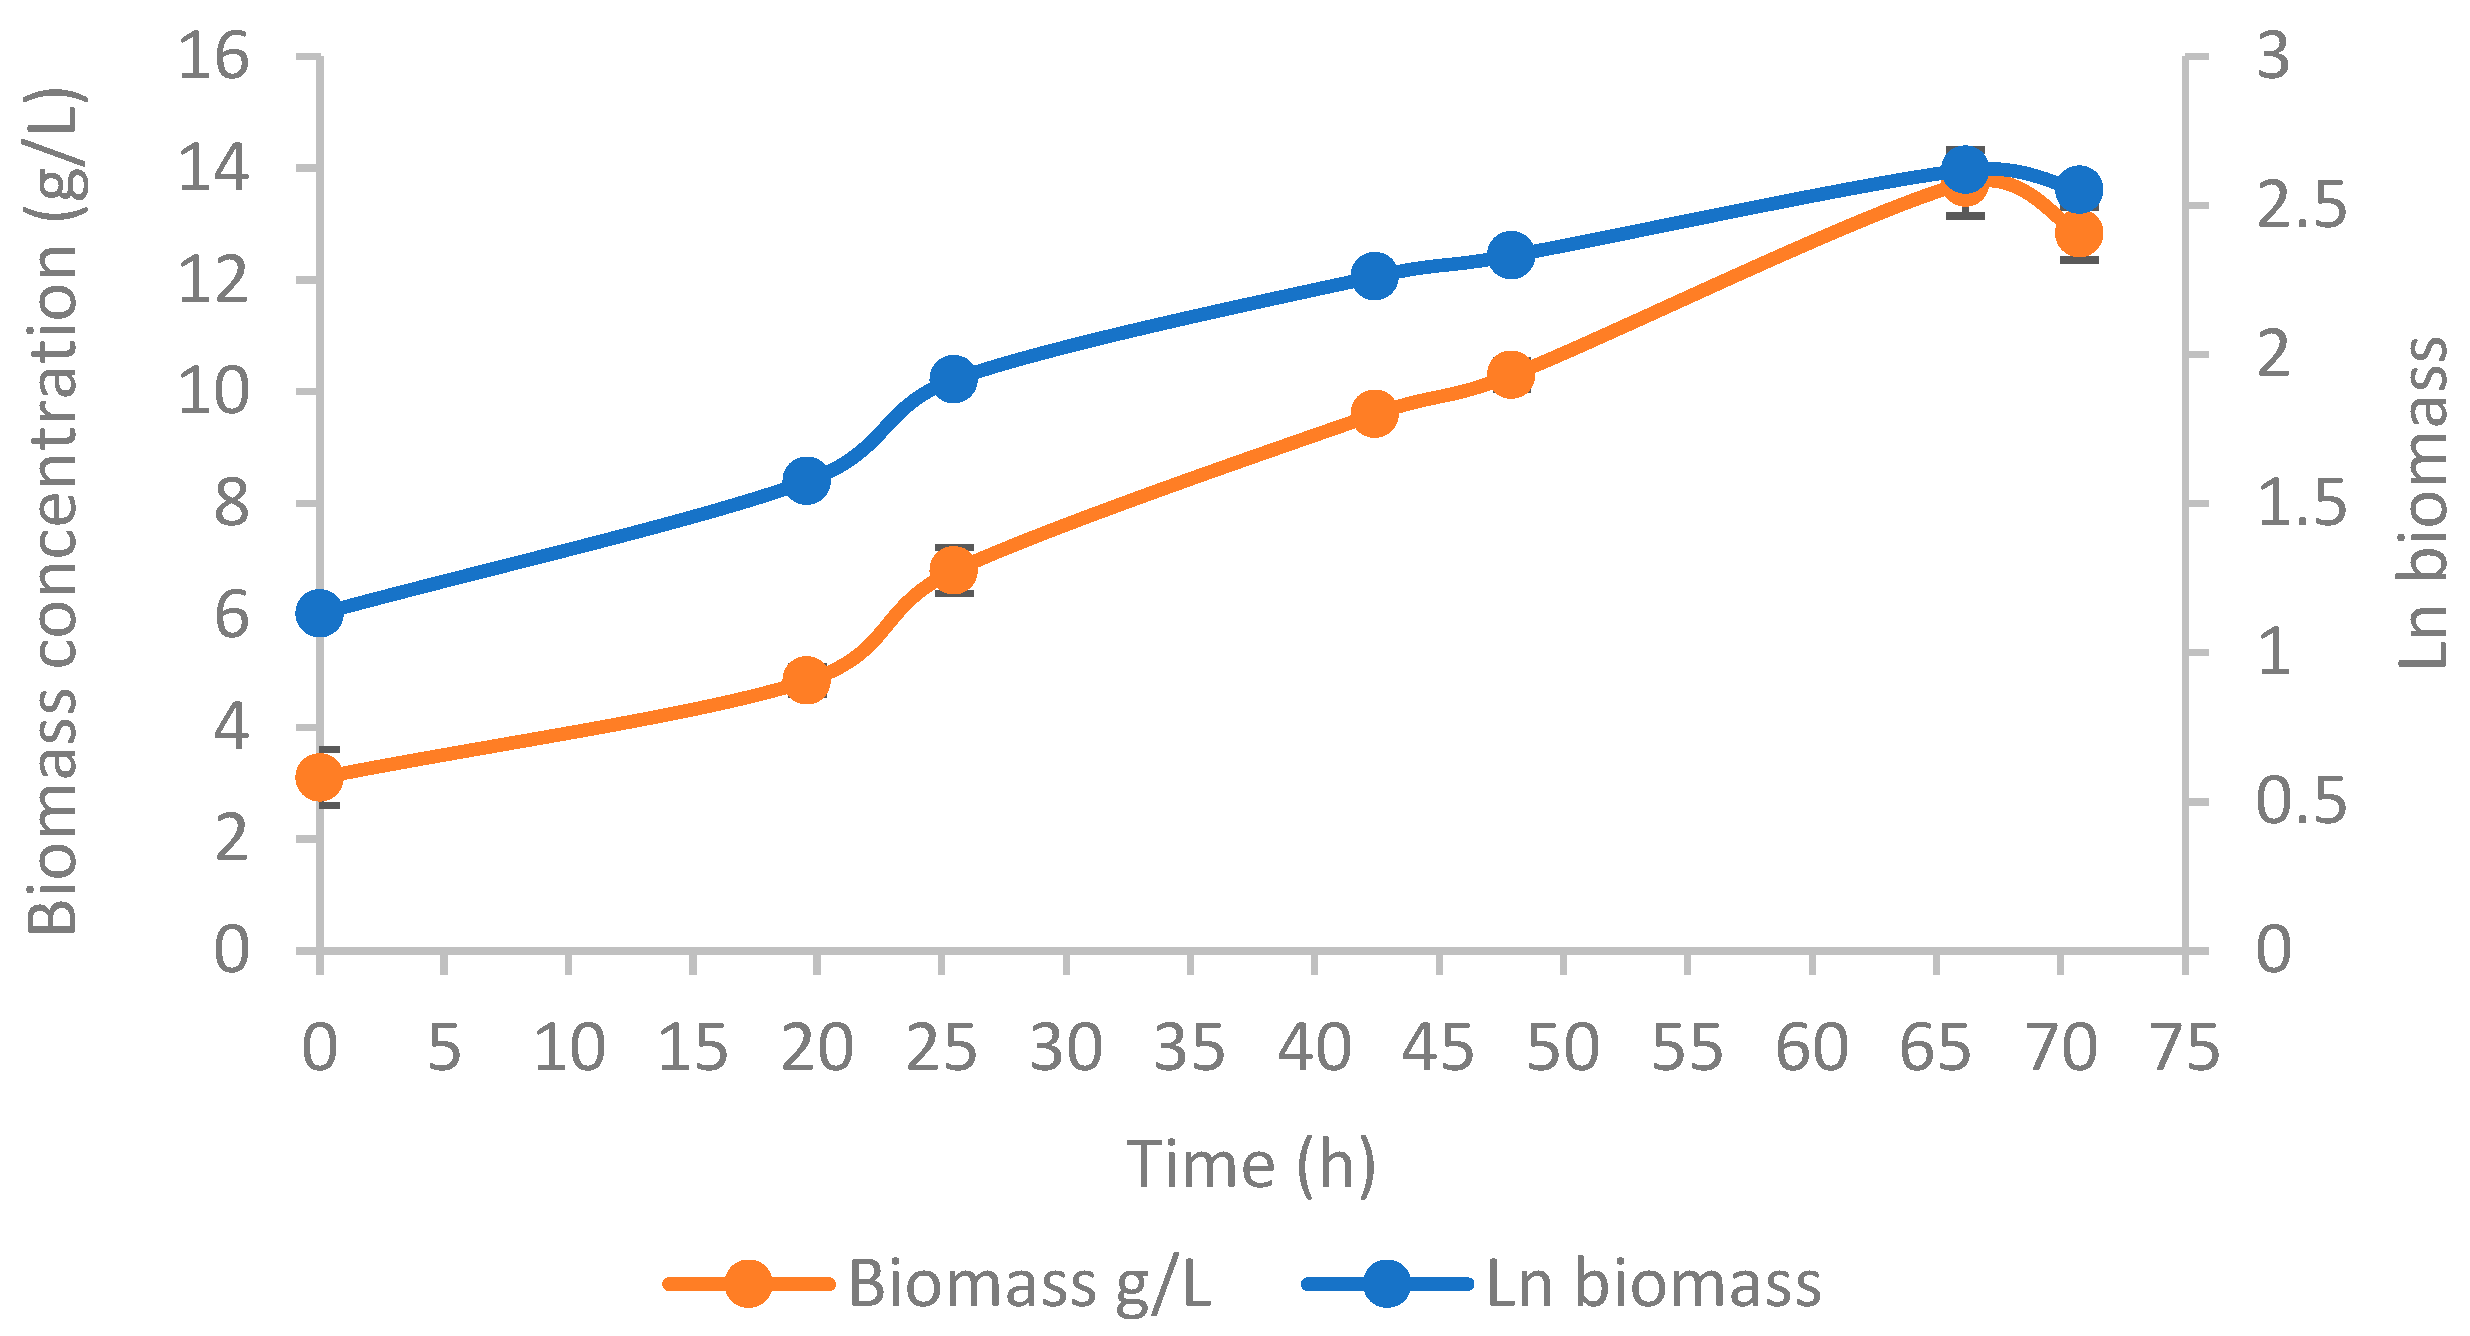
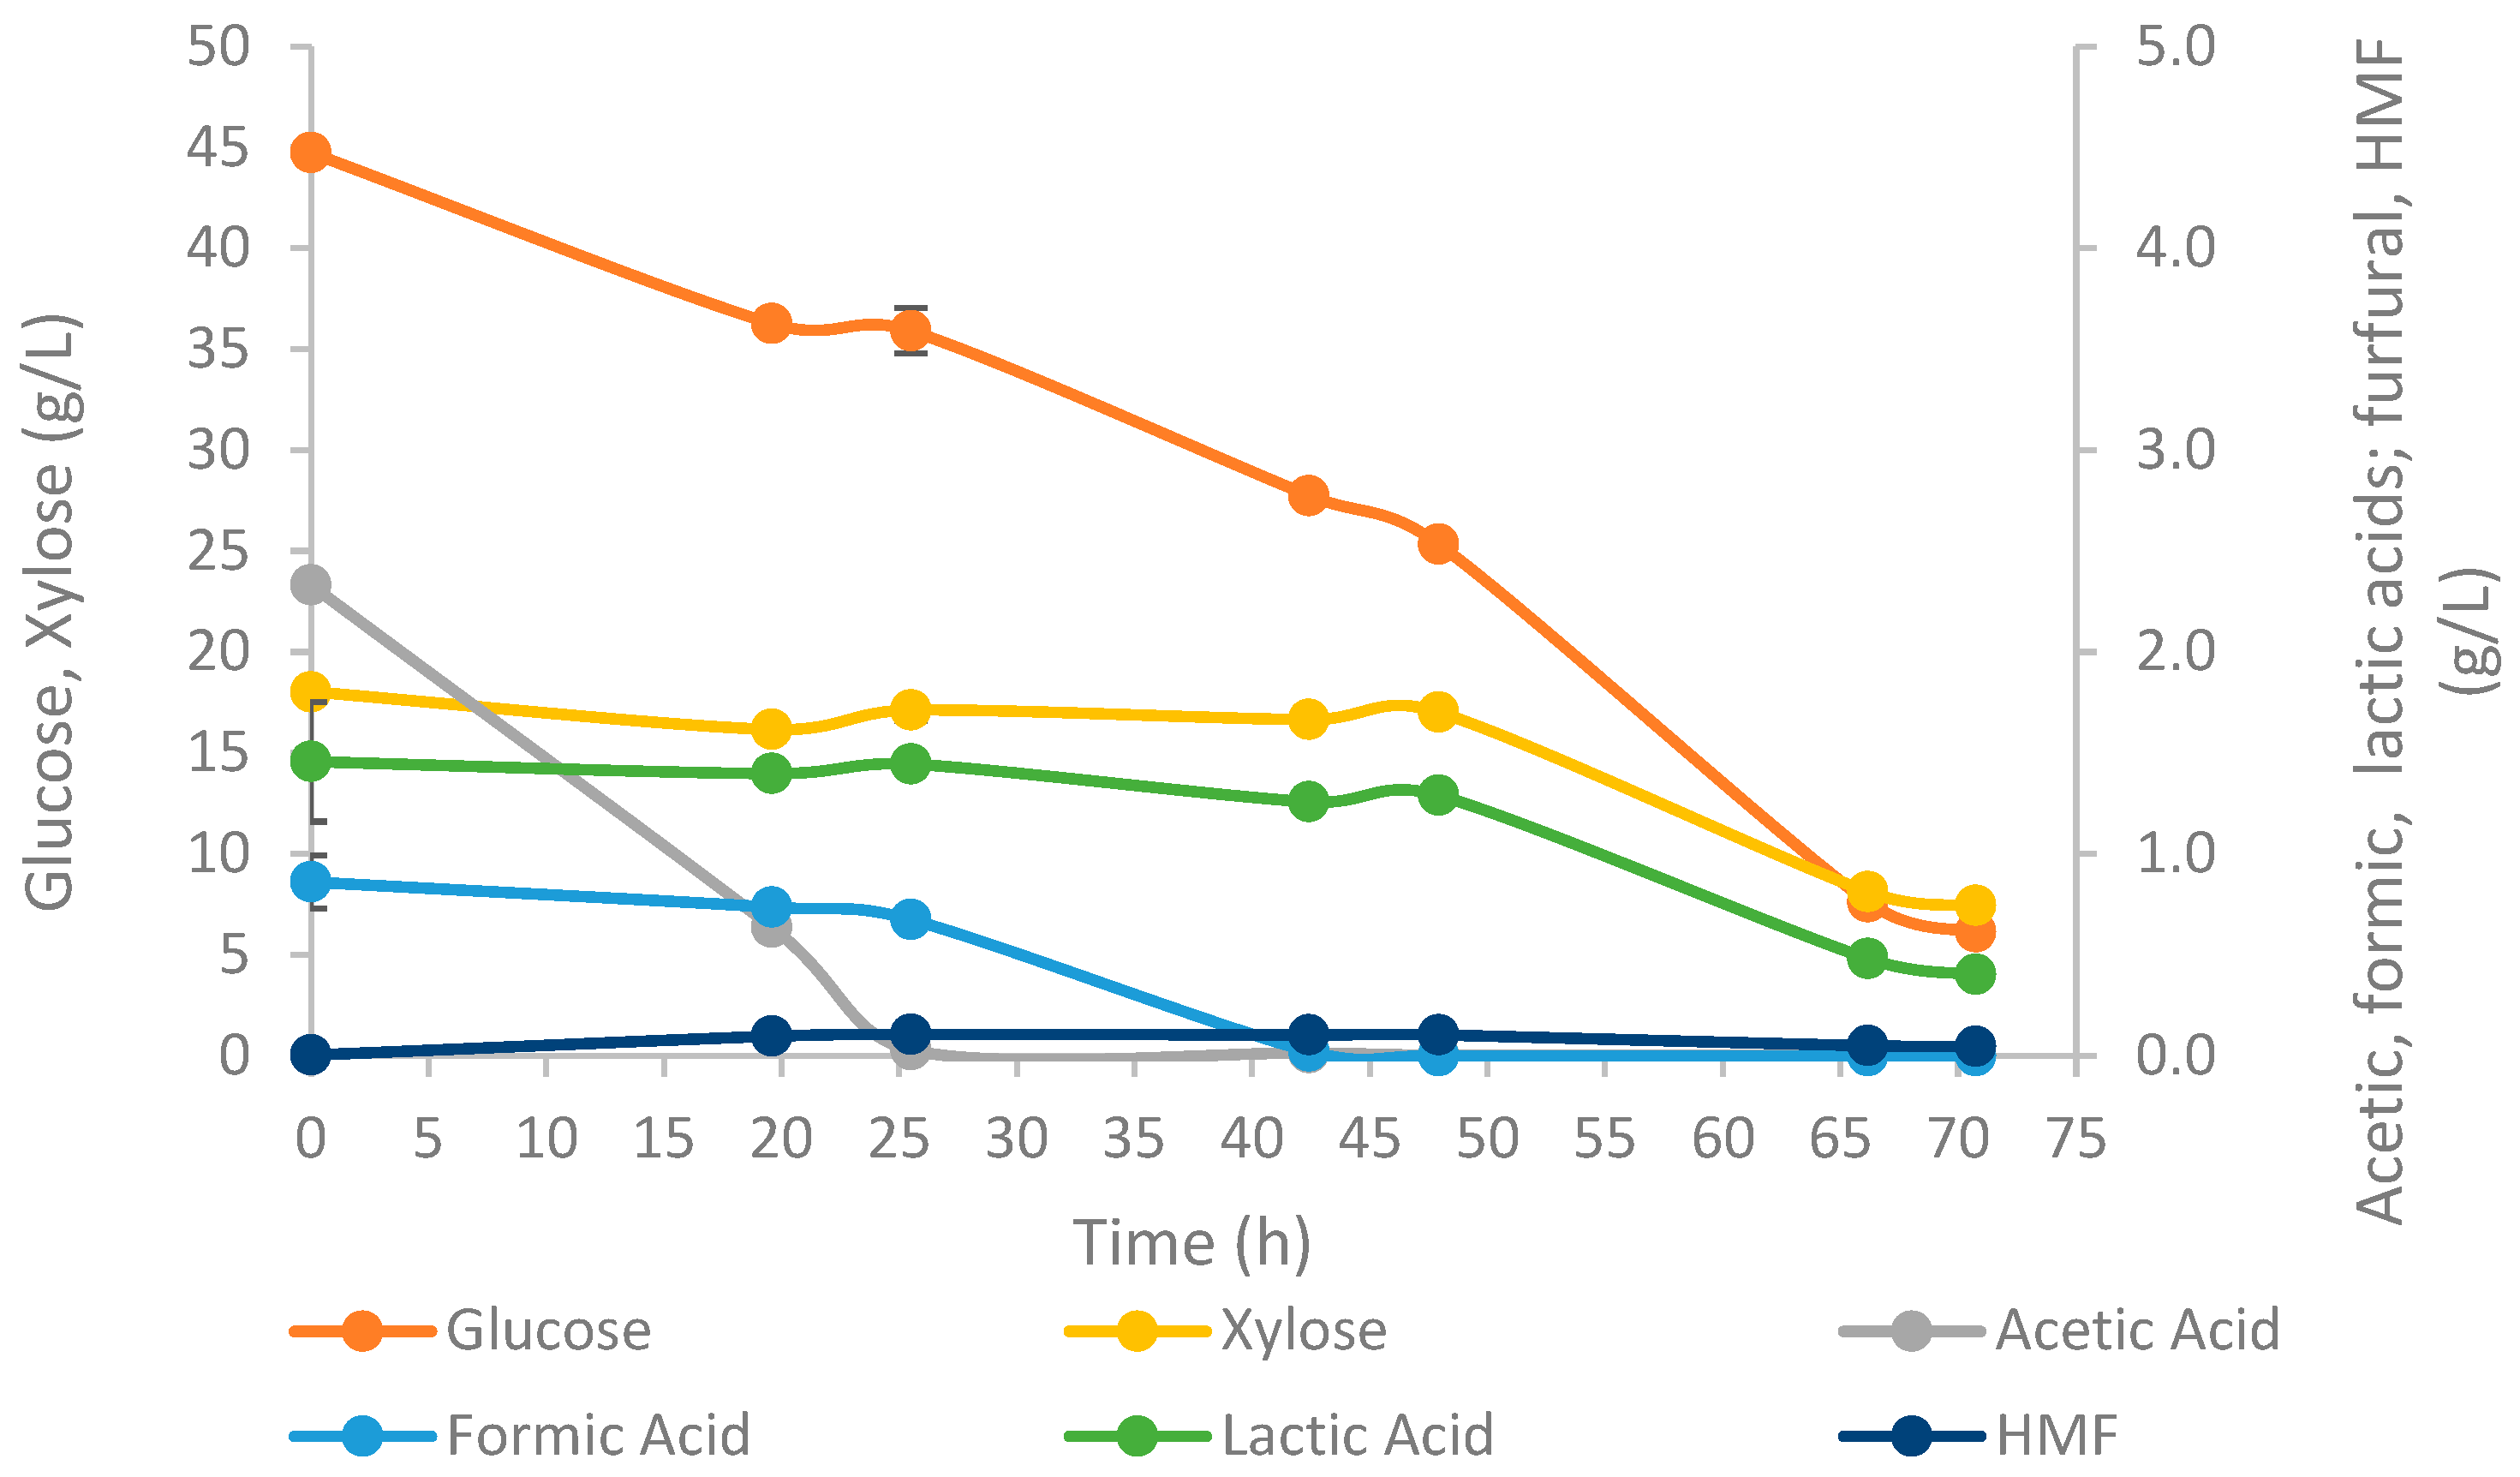
3.2.2. T. oleaginosus Growth

Figure 4 shows the biomass concentration and natural logarithm of the biomass profiles throughout the yeast cultivation in the 7 L bioreactor under a batch regime. The yeast growth was linear until t = 66.17 h, which was expected, since oxygen limited the culture. Indeed, during the yeast growth, foam formation was observed, which was attributed to the medium components (mainly CSH and CSL). Therefore, it was not possible to use speed rates higher than 200 rpm because of the foam formation, even with the addition of an anti-foaming agent. At t = 66.17 h, the biomass concentration reached 13.3 g/L at t = 66.17 h, decreasing soon after, and attaining 12.8 g/L at the end of the assay (t = 70.75 h) as a result of the limitation of nutrients other than carbon.
Flow cytometry was used to count T. oleaginosus cells during the bioreactor cultivation. A linear correlation (R2 = 0.995) was observed between T. oleaginosus cell count determined by FC and dry cell weight (DCW) throughout the fermentation time course (Figure 5).
This result demonstrates that FC is an adequate tool for monitoring T. oleaginosus growth in culture media containing particles such as CSH and CSL The procedure of cell counting by FC is faster than the dry cell weight technique, providing accurate results soon after the sample collection, while DCW results are usually available a considerable time after the sample collection.
Concerning the sugar consumption (Figure 6), the initial glucose concentration was 44.75 g/L, decreasing soon after, until the end of the cultivation. On the contrary, xylose only started to be consumed at t = 47.92 h, when the glucose concentration was 25.3 g/L. At the end of the assay, the final glucose and xylose concentrations were 6.13 g/L and 7.45 g/L, respectively. The cultivation was intentionally ended before complete sugar source exhaustion in order to prevent endogenous intracellular lipid consumption, which happens when the cells are exposed to carbon starvation conditions [18].
The initial acetic acid concentration was 2.33 g/L and was completely consumed at t = 25.5 h. The initial lactic acid concentration was 1.46 g/L, reaching 0.40 g/L at the end of the cultivation. The HMF concentration was always below 0.10 g/L.
Table 3 shows the kinetic parameters concerning T. oleaginosus cultivation on the CSH + CSL medium.
Overall, the kinetic parameters determined for this cultivation were lower than those reported for the T. oleaginosus shake flask experiment (Table 2). For instance, the final biomass concentration and productivity were 12.83 g/L and 0.14 g/Lh, respectively, for the bioreactor cultivation, while for the shake flask experiment they were 27.48 g/L and 0.49 g/Lh, respectively. Such differences were attributed to oxygen-limiting conditions due to the low-speed rates used during the bioreactor cultivation as a result of the intensive foam formation.
The final T. oleaginosus lipid content increased 42% compared to the T. oleaginosus shake flask lipid content, although the lipid productivity decreased by 57%. This might be due again to the oxygen-limiting conditions that occurred during the bioreactor (Table 2 and Table 4) assay, which promoted intracellular lipid production and decreased the biomass production [19].
The T. oleaginosus lipid composition is depicted in Figure 7. The dominant fatty acids were oleic acid (18:1ω9), comprising 42.72% (w/w of total fatty acids, TFA), and palmitic acid (16:1ω9), comprising 31.14% (w/w TFA). Stearic (18:0) and linoleic acids (18:2ω6) were present at 10.87% (w/w TFA) and 7.93% (w/w TFA), respectively. Other fatty acids were present at percentages lower than 5% (w/w). In terms of lipid classes, the saturated, monounsaturated, and polyunsaturated fatty acids comprised 46.89%, 43.97%, and 9.14% (w/w TFA), respectively. A similar FA profile was reported when T. oleaginosus DSM 70022 was grown on lignocellulosic hydrolysates [14], and it was similar to those of vegetable oils [20].

3.2.3. T. oleaginosus Morphological and Physiological Status Monitoring throughout the Bioreactor Cultivation

Figure 8 shows the FSC/SSC density plots, optical microscope observations, and SYBR/PI density plots concerning T. oleaginosus cells taken during the 7 L bench reactor cultivation on CSH + CSL.
At t = 0 h, the yeast cell population appeared as the typical elliptical shape in the FSC/SSC plot (Gate P3, Figure 8a) standing out from the background (medium particles, debris, dust, etc.) (Figure 8b). This shape reflects the heterogeneity of T. oleaginosus cell shapes and sizes, as observed in Figure 8b. The green color spot shown in Figure 8a represents the highest event density, corresponding to the yeast cells of Population A. The blue tail which appears beyond and around Population A represents a lower event density, corresponding to particles, dust, and debris. After staining the sample with the mixture SYBR + PI, 94.50% of the yeast cells were stained with SYBR but not with PI, which demonstrated that these cells had intact membranes; only 5.02% of the cells were stained with SYBR and PI (Subpopulation C), indicating that these cells had permeabilized membranes (Figure 8c).
At t = 22.37 h, the FSC/SSC plot showed two yeast subpopulations (represented in green, A and A′), with different FSC and SSC signals (Figure 8d). The yeast subpopulation displaying the highest FSC/SSC signals (A) concerns the yeast cells that were budding, as they became larger in size and internal complexity, due to their higher DNA content. The subpopulation displaying the lower FSC/SSC signals (A′) corresponded to smaller cells, such as those that were not dividing or daughter cells. Figure 8e shows the microscopical photo concerning this sample, wherein several budding yeast cells are shown. The density plot of the SYBR + PI staining sample for t = 22.37 h (Figure 8f) shows a similar profile to that of the previous sample (Figure 8c): a main subpopulation (94.45%) is composed of cells with intact membranes and a smaller subpopulation (4.93%) is composed of cells with permeabilized membranes.
As expected, the proportion of cells displaying higher FSC signals (A) increased as the culture aged, since Population A became greener; the yeast subpopulation displaying lower FSC signals (A′) became bluer, as a result of its lower density (Figure 8g,j). At t = 46.75 h, there were still yeast cells dividing (Figure 8h). The density plot concerning the SYBR/PI staining sample shows two SYBR+ subpopulations, B and B′ (Figure 8i), corresponding to the biggest and smaller cells, as shown in Figure 8g. In fact, bigger cells emitted higher SYBR fluorescence intensity due to the greater accumulated stain amount. The proportion of PI+ cells was still low (3.54%).
At t = 70.75 h, Subpopulation A became even greener, which demonstrated that it was the dominant subpopulation, composed of big T. oleaginosus cells. This observation could be due to the oxygen-limiting conditions during the yeast cultivation. Indeed, Bouchedja et al. [21] also recorded that when Yarrowia lipolytica cells were grown under oxygen-limiting conditions, their volume increased as the culture aged. The respective optical microscope image shows a dense cell culture, but no budding cells are visualized (Figure 8k). The SYBR/PI staining sample again showed a main subpopulation of SYBR+/PI− (92.56%), composed of intact cells, and a minor subpopulation of SYBR+/PI+ (5.70%), corresponding to cells with permeabilized membranes. Therefore, throughout the yeast cultivation in CSH, the proportion of damaged T. oleaginosus cells was always low (<6%), which demonstrated that T. oleaginosus cells are resistant to the growth conditions, namely lignocellulosic hydrolysates and oxygen-limiting conditions.

3.2.4. Lipid Production by T. oleaginosus Yeast Strains Grown on Synthetic Media and Lignocellulosic Hydrolysates

Table 5 shows the lipid production for several T. oleaginosus strains (synonym T. cutaneum) grown on synthetic media and corn stover hydrolysate, for comparison with the results reported in this work. As expected, the highest lipid contents and productivities were observed for synthetic media (45.33% w/w and 0.67 g/Lh, Santek et al. [22]; 54% w/w and 0.51 g/Lh, Capusoni et al. [23]; and 46.20% and 0.17 g/Lh, Wang et al., 2019 [24], respectively) and microalgae hydrolysate (53% w/w and 0.33 g/Lh, Meo et al. [25]), since no inhibitory compounds are present in these culture media. The use of genetically modified yeast strains and/or detoxified lignocellulosic hydrolysate using biological or chemical techniques also resulted in high lipid content and productivity (67.8% and 0.36 g/Lh, Liu et al. [26]; 40.87% w/w and 0.28 g/Lh, Zhang et al. [27]; and 55.97% and 0.21 g/Lh, Yu et al. [28], respectively). When non-detoxified lignocellulosic media, as well as wild strains, were used, the lipid content, concentration, and productivity decreased (39.20% w/w, 7.6 g/L, 0.08 g/L, Hu et al. [29]; 22.82% w/w, 0.07 g/Lh, Santek et al. [30]; and 42.28% w/w, 5.38 g/L, 0.06 g/Lh, this work). Although several detoxification methods have been used for removal of inhibitory compounds from lignocellulosic hydrolysates, they are often expensive, frequently resulting in sugar loss after the detoxification step (Ujor et al. [31]). Therefore, the use of non-detoxified hydrolysates as a culture medium for microbial lipid production may be a cheaper process, although sometimes low lipid productivities may be achieved due to the high inhibitory compound concentration. Therefore, the selection of the optimal pretreatment method should be based on life cycle assessment studies for each case.

4. Conclusions

The present study demonstrated that the yeast T. oleaginosus has great potential as a source of microbial lipids due to its tolerance of adverse conditions such as lignocellulosic hydrolysate exposure. CSH supplemented with CSL and MM was a suitable culture medium to produce lipids from this yeast, without the need for CSH detoxification. It was also demonstrated that FC is a powerful and useful tool for monitoring yeast cultivations developed on lignocellulosic hydrolysate for cell count because of the efficient differentiation between medium particles and yeast cells. It is also useful for at-line cell size, granularity, and membrane integrity detection.

Author Contributions

Conceptualization, T.L.d.S.; media development, F.C.F. and N.T.F.; CSH preparation, S.M.; methodology, A.F., R.F. and T.L.d.S.; data analysis, A.F., R.F. and T.L.d.S.; writing—original draft preparation, A.F., R.F. and T.L.d.S.; writing—review and editing, S.M., A.R., F.C.F., N.T.F., P.M., R.L., J.S., and T.L.d.S.; supervision, T.L.d.S., except media development (F.C.F. and N.T.F.) and CSH preparation (S.M.); project management, P.M.; funding acquisition, R.L. All authors have read and agreed to the published version of the manuscript.

Funding

This research was funded under the FRONTSH1P (A FRONTrunner approach to Systemic circular, Holistic & Inclusive solutions for a New Paradigm of territorial circular economy) project funded by the European Horizon 2020 Research and Innovation Program under grant agreement No. 101037031. iBB (UIDB/04565/2020 and UIDP/04565/2020) and i4HB (LA/P/0140/2020) received funding from FCT—Fundação para a Ciência e a Tecnologia.

Data Availability Statement

The data presented in this study are available on request from the corresponding author.

Acknowledgments

The authors would like to acknowledge Belina Ribeiro and Céu Penedo for the HPLC analysis support, and Graça Gomes and Natércia Santos for the Kjeldahl and Soxhlet analysis support. The authors gratefully acknowledge Novozymes (Denmark) for supplying Cellic® CTec3 HS. The technical assistance of the STEX company (Aveiro, Portugal) on the operation of the pilot-scale infrastructure of steam explosion and enzymatic hydrolysis is also acknowledged.

Conflicts of Interest

The authors declare no conflicts of interest.

Abbreviations

PU, polyurethane; VOs, vegetable oils; FC, flow cytometry; CSH, corn stover hydrolysate; CSL, corn steep liquor; MM, mineral medium; HPLC, high-performance liquid chromatography; HMF, 5-(hydroxymethyl)furfural; FAs, fatty acids; FAMEs, fatty acid methyl esters; WSH, wheat straw hydrolysate; SYBR I, Syber Green I; PI, propidium iodide; FSC, forward light scatter; SSC, side light scatter.

References

  1. Paraskar, P.M.; Prabhudesai, M.S.; Hatkar, V.; Kulkarni, R. Vegetable oil-based polyurethane coatings—A sustainable approach: A review. Progr. Org. Coat. 2021, 156, 106267. [Google Scholar] [CrossRef]
  2. Karmakar, G.; Ghosh, P.; Sharma, B. Chemically Modifying vegetable oils to prepare green lubricants. Lubricants 2017, 5, 44. [Google Scholar] [CrossRef]
  3. Jez, S.; Spinelli, D.; Fierro, A.; Dibenedetto, A.; Aresta, M.; Busi, E.; Basosi, R. Comparative life cycle assessment study on environmental impact oil production from microalgae and terrestrial oilseed crops. Bioresour. Technol. 2017, 239, 266–275. [Google Scholar] [CrossRef]
  4. 174th Session of the FAO Council. Item 6: The Impact of the War in Ukraine on Global Food Security and Related Matters under the Mandate of the FOOD and Agriculture Organization of the United Nations (FAO). 2022. Available online: https://www.fao.org/3/no015en/no015en.pdf (accessed on 12 January 2024).
  5. Asare, M.; Souza, F.; Gupta, R. Waste to resource: Synthesis of polyurethanes from waste cooking oil. Ind. Eng. Chem. Res. 2022, 61, 18400–18411. [Google Scholar] [CrossRef]
  6. Sajish, S.; Singh, S.; Nain, L. Yeasts for Single Cell Oil Production from Non-Conventional Bioresources. In Microbial Biotechnology for Renewable and Sustainable Energy; Saini, J.K., Sani, R.K., Eds.; Clean Energy Production Technologies; Springer Nature: Singapore, 2022; pp. 337–364. [Google Scholar]
  7. Caporusso, A.; Capece, A.; De Bari, I. Oleaginous yeasts as cell factories for the sustainable production of microbial lipids by the valorization of agri-food wastes. Fermentation 2021, 7, 50. [Google Scholar] [CrossRef]
  8. Worldwide Production of Grain in 2023/24, by Type. Available online: https://www.statista.com/statistics/263977/world-grain-production-by-type/ (accessed on 22 January 2024).
  9. Ruan, Z.; Wang, W.; Liu, Y.; Liao, W. Chapter 3: Corn. In Integrated Processing Technologies for Food and Agricultural By-Products; Pan, Z., Zhang, R., Zicar, S., Eds.; Academic Press: Cambridge, MA, USA, 2019; pp. 59–72. [Google Scholar]
  10. Amândio, M.S.T.; Rocha, J.M.S.; Xavier, A.M.R.B. Enzymatic hydrolysis strategies for cellulosic sugars production to obtain bioethanol from eucalyptus globulus bark. Fermentation 2023, 9, 241. [Google Scholar] [CrossRef]
  11. Li, X.; Shi, Y.; Kong, W.; Wei, J.; Song, W.; Wang, S. Improving enzymatic hydrolysis of lignocellulosic biomass by bio-coordinated physicochemical pretreatment—A review. Energy Rep. 2022, 8, 696–709. [Google Scholar] [CrossRef]
  12. Freitas, C.; Neves, E.; Reis, A.; Passarinho, P.; Lopes da Silva, T. Effect of acetic acid n Saccharomyces carlsbergensis ATCC 6269 batch ethanol production monitored by flow cytometry. Appl. Biochem. Biotechnol. 2012, 168, 1501–1515. [Google Scholar] [CrossRef]
  13. Lepage, G.; Roy, C. Improved recovery of fatty acid through direct transesterification without prior extraction and purification. J. Lipid Res. 1984, 25, 1391–1396. [Google Scholar] [CrossRef] [PubMed]
  14. Di Fidio, N.; Minonne, F.; Antonetti, C.; Raspolli Galletti, A.M. Cutaneotrichosporon oleaginosus: A versatile whole-cell biocatalyst for production of single-cell oil from agro-industrial wastes. Catalyst 2021, 11, 1291. [Google Scholar] [CrossRef]
  15. Wang, J.; Gao, Q.; Zhang, H.; Bao, J. Inhibitor degradation and lipid accumulation potentials of oleaginous yeast Trichosporom cutaneum using lignocellulose feedstock. Bioresour. Technol. 2016, 281, 892–901. [Google Scholar] [CrossRef] [PubMed]
  16. Brandenburg, J.; Blomqvist, J.; Shapaval, V.; Kohler, A.; Sampels, S.; Sandgren, M.; Volkmar, P. Oleaginous yeasts respond differently to carbon sources present in lignocellulose hydrolysate. Biotechnol. Biofuels 2021, 14, 124. [Google Scholar] [CrossRef] [PubMed]
  17. Thabet, S.; Weiss-Gayet, M.; Dappozze, F.; Cotton, P.; Guillard, C. Photocatalysis on yeast cells: Towards targets and mechanisms. Appl. Catal. B Environ. 2013, 140–141, 169–178. [Google Scholar] [CrossRef]
  18. Holdsworth, J.; Ratledge, C. Lipid turnover in oleaginous yeasts. J. Gen. Microbiol. 1988, 134, 339–346. [Google Scholar] [CrossRef]
  19. Yen, H.-W.; Zhang, Z. Effects of dissolved oxygen level on cell growth and total lipid accumulation on the cultivation of Rhodotorula glutinis. J. Biosci. Bioeng. 2011, 112, 71–74. [Google Scholar] [CrossRef] [PubMed]
  20. Caporusso, A.; Bari, I.; Valerio, V.; Albergo, R.; Liuzzi, F. Conversion of cardoon crop residues into single cell oils by Lipomyces tetrasporus and Cutaneaotrichosporum curvatus; process optimizations to overcome the microbial inhibition of lignocellulosic hydrolysates. Ind. Crops Prod. 2021, 159, 113030. [Google Scholar] [CrossRef]
  21. Bouchedja, D.N.; Danthine, A.; Kar, T.; Fickers, P.; Boudjellal, A.; Delvigne, F. Online flow cytometry, and interesting investigation process for monitoring lipid accumulation, dimorphism and cell’s growth on the oleaginous yeast Yarrowia lipolytica JMY 775. Bioresour. Bioprocess. 2017, 4, 3. [Google Scholar] [CrossRef]
  22. Santek, M.; Miskulin, A.; Petrovic, A.; Beluhan, S.; Santek, B. Effect of carbon and nitrogen source concentrations on the growth and lipid accumulation of yeast Trichosporon oleaginosus in continuous and batch culture. J. Chem. Technol. Biotechnol. 2017, 92, 1620–1629. [Google Scholar] [CrossRef]
  23. Capusoni, C.; Rodighiero, V.; Cucchetti, D.; Galafassi, S.; Bianchi, D.; Franzosi, G.; Compagno, C. Characterization of lipid accumulation and lipidome analysis in the oleaginous yeasts Rhodosporidium azoricum and Trichosporon oleaginosus. Bioresour. Technol. 2017, 238, 281–289. [Google Scholar] [CrossRef]
  24. Wang, Y.; Yan, R.; Tang, L.; Zhu, L.; Zhu, D.; Bai, F. Dimorphim of Trichosporon cutaneum and impact on its lipid production. Biotechnol. Biofuels 2019, 12, 203. [Google Scholar] [CrossRef]
  25. Meo, A.; Priebe, X.; Weuster-Botz, D. Lipid production with Trichosporon oleaginosus in a membrane bioreactor using microalgae hydrolysate. J. Biotechnol. 2017, 241, 1–10. [Google Scholar] [CrossRef]
  26. Liu, Q.; Lu, M.; Jin, C.; Hou, W.; Zhao, L.; Bao, J. Ultra-centrifugation force in adaptive changes the cells structure of oleaginous yeast Trichosporon cutaneum into favorable space for lipid accumulation. Biotechnol. Bioeng. 2022, 119, 1509–1521. [Google Scholar] [CrossRef] [PubMed]
  27. Zhang, Y.; Bao, J. Tolerance of Trichosporon cutaneum to lignin derived phenolic aldehydes facilitate the cell growth and cellulosic lipid accumulation. J. Biotechnol. 2022, 343, 32–37. [Google Scholar] [CrossRef] [PubMed]
  28. Yu, Y.; Xu, Z.; Chen, S.; Jin, M. Microbial lipid production from dilute acid alkali pretreated corn stover via Trichosporon dermatis. Bioresour. Technol. 2020, 295, 122523. [Google Scholar] [CrossRef]
  29. Hu, C.; Wu, S.; Wang, Q.; Jin, Q.; Shen, H.; Zhao, Z. Simultaneous utilization of glucose and xylose for lipid production by Trichosporon cutaneum. Biotechnol. Biofuels 2011, 4, 25. [Google Scholar] [CrossRef]
  30. Santek, M.; Lisicar, J.; Musak, L.; Spoljaric, I.; Beluhan, S.; Santek, B. Lipid production by yeast Trichosporon oleaginosus on the enzymatic hydrolysate of alkaline pretreated corn cobs for biodiesel production. Energy Fuels 2018, 32, 12501–12513. [Google Scholar] [CrossRef]
  31. Ujor, V.C.; Okonkwo, C. Microbial detoxification of lignocellulosic biomass hydrolysates: Biochemical and molecular aspects, challenges, exploits and future perspectives. Front. Bioeng. Biotechnol. 2022, 10, 1061667. [Google Scholar] [CrossRef]
Figure 1. Biomass, residual sugar, and inhibitor concentrations for the studied yeast strains T. oleaginosus DSM 11815 (a) and R. babjevae DBVPG 8058 (b) grown on complex CSH + CSL medium in shake flasks.
Processes 12 00558 g001
Figure 2. T. oleaginosus cells taken immediately after inoculation in the 7 L bioreactor and analyzed by FC. (a) FSC/SSC plot concerning T. oleaginosus unstained cells; (b) SYBR/PI fluorescence plot concerning T. oleaginosus cells stained with SYBR/PI mixture. No gate was selected; therefore, cells and particles are displayed. (c) SYBR/PI fluorescence plot concerning T. oleaginosus cells stained with SYBR/PI mixture. The P3 gate was selected; therefore, the events above the horizontal line are all yeast cells.
Processes 12 00558 g002
Figure 3. Preliminary FC control trials for T. oleaginosus DSM 11815 subpopulation identification, shown in density plots of SYBR/PI fluorescence. (a) Double-stained exponentially growing cells and (b) double-stained heat-treated cells. Two subpopulations were distinguished: A, corresponding to exponentially growing cells with intact membranes, and B, corresponding to heat-treated cells with injured membranes.
Processes 12 00558 g003
Figure 4. T. oleaginosus biomass and Ln biomass throughout the yeast cultivation on CSH + CSL + MM in a bench bioreactor.
Processes 12 00558 g004
Figure 5. T. oleaginosus cell counting and biomass concentration plot for data collected during the yeast cultivation in the 7 L bioreactor.
Processes 12 00558 g005
Figure 6. Sugars’, organic acids’, and inhibitors’ residual concentrations throughout T. oleaginosus batch cultivation on CSH + CSL, in a bench-scale bioreactor.
Processes 12 00558 g006
Figure 7. T. oleaginosus FA profile of the biomass collected at the end of the bioreactor cultivation.
Processes 12 00558 g007
Figure 8. (a,d,g,j): FSC/SSC density plots concerning T. oleaginosus cells grown on CSH in the 7 L bench bioreactor, collected at t = 0 h, 22.37 h, 46.75 h, and 70.75 h; Population A displays higher FSC signals, and Subpopulation A′ displays lower FSC signals. (b,e,h,k) T. oleaginosus optical microscope photos taken at t = 0 h, 22.37 h, 46.75 h, and 70.75 h; magnification 1000×; red circles: medium particles; blue circles: T. oleaginosus single cells; black circles: T. oleaginosus budding cells. (c,f,i,l) SYBR/PY density plots concerning T. oleaginosus cells grown on CSH, in the bench bioreactor, collected at t = 0 h, 22.37 h, 46.75 h, and 70.75 h. Subpopulation B (SIBR+; PI−) was composed of T. oleaginosus cells with intact membranes; Subpopulation C (SIBR+; PI+) was composed of T. oleaginosus cells with damaged membranes; Subpopulation B′ (SIBR+; PI−) was composed of T. oleaginosus cells with intact membranes, but which were smaller than cells from Subpopulation B.
Processes 12 00558 g008
Table 1. Comparison of growth and substrate uptake kinetic parameters between the two studied yeast strains, T. oleaginosus (DSM 11815) and R. babjevae (DBVPG 8058), grown on complex CSH + CSL medium, at a scale of 150 mL.
ParameterT. oleaginosusR. babjevae
Cultivation Time (h)47.188.9
Growth Kinetic Parameters:
Xmax (g/L)27.48 ± 0.58
(47.1 h)
12.95 ± 0.86
(66.1 h)
Xfinal (g/L)27.48 ± 0.5811.54 ± 1.46
PX (g/Lh)0.51 ± 0.010.14 ± 0.00
µmax (/h)0.05 ± 0.000.06 ± 0.00
YX/S (gbiomass/gsubstrate)0.39 ± 0.000.27 ± 0.06
rglucose (g/Lh)0.85 ± 0.030.27 ± 0.01
rxylose (g/Lh)0.41 ± 0.020.03 ± 0.01
racetic acid (g/Lh)0.06 ± 0.000.03 ± 0.00
rformic acid (g/Lh)0.02 ± 0.00-
rlactic acid (g/Lh)0.02 ± 0.000.01 ± 0.00
Table 2. Comparison of lipid production kinetic parameters between the two studied yeast strains, T. oleaginosus DSM 11815 and R. babjevae DBVPG 8058, grown on complex CSH + CSL medium, at a scale of 150 mL.
ParameterT. oleaginosusR. babjevae
Lipid content (w/w%)24.6 ± 0.118.5 ± 0.3
PL (g/Lh)0.14 ± 0.000.04 ± 0.00
YLipids/S (g/g)0.11± 0.000.08 ± 0.00
Table 3. Kinetic parameters calculated for T. oleaginosus DSM 11815 cultivated on CSH + CSL medium, in a lab-scale bioreactor. These parameters were calculated according to the equations displayed in Table 1 legend.
ParameterT. oleaginosus
Xmax (g/L)13.73 ± 0.50
(t = 66.2 h)
Xfinal (g/L)12.83 ± 0.50
(t = 70.8 h)
ProdX (g/Lh)0.14 ± 0.01
µ (/h)0.02 ± 0.06
YX/S (gbiomass/gglucos+xylose)0.20 ± 0.02
rglucose (g/Lh)0.54 ± 0.01
rxylose (g/Lh)0.15 ± 0.01
racetic acid (g/Lh)0.11 ± 0.00
rformic acid (g/Lh)0.02 ± 0.00
rlactic acid (g/Lh)0.01 ± 0.00
Table 4. T. oleaginosus lipid production at the end of the batch cultivation in the 7 L bioreactor.
Lipid content (% w/w)42.28 ± 0.01
PL (g/Lh)0.06 ± 0.01
YLipids/S0.11± 0.00
Table 5. Lipid production for several T. oleaginosus strains (synonym T. cutaneum) grown on syn-thetic media and corn stover hydrolysate, for comparison with the results reported in this work. n.a.—not applied.
YeastGenetically
Modified
FeedstockPretreatment
Hydrolysis
Cultivation
System/Regime
% Lipids
(w/w)
CL
g/L
Lipid Productivity (g/L/h)Reference
T. cutaneum
AS 2.571
NoCorn stoverDilute sulfuric acid
pretreatment; enzymatic hydrolysis; hydrolysate detoxified with an excess of lime
250 mL unbaffled conical
flasks/batch
39.207.60.08Hu et al., 2011 [29]
T. oleaginosus
ATCC 20509
NoSynthetic median.a.20 L bioreactor with 6 L medium/fed-batch54.0071.28 0.51Capusoni et al., 2017 [23]
T. oleaginosus
DSM 11815
NoMicroalgae hydrolysateHigh-impact
homogenizer/enzymatic hydrolysis
Membrane bioreactor with total cell retention under phosphate limitation/batch53.0030.60.33 Meo et al., 2017 [25]
T. oleaginosus
DSM 11815
NoSynthetic culture mediumn.a. 0.5 L shake flasks/batch45.336.70.67 Šantek et al., 2017 [22]
T. oleaginosus
DSM 11815
NoCorn cobsAlkaline pretreatment/enzymatic hydrolysisBioreactor with 25 L working volume/fed-batch22.82 0.07 Šantek et al., 2018 [30]
T. cutaneum
B3
YesSynthetic mediumn.a. 5 L bioreactor with 2 L working volume46.2012.520.17Wang et al., 2019
[24]
T. dermatis 32903NoCorn stoverDiluted alkali pretreatment/enzymatic hydrolysis250 mL baffled shake flasks55.9720.360.21 Yu et al., 2020
[28]
T. cutaneum MP11YesWheat strawDry acid pretreatment, followed by detoxification with Ca(OH)2; enzymatic hydrolysis3 L
bioreactor containing
1 L wheat straw hydrolysate;
simultaneous saccharification and co-fermentation (SSCF)
67.8034.40.36Liu et al., 2022
[26]
T. cutaneum MP11YesWheat strawAcid pretreatment followed by biodetoxification using Paecylomyces variotii FN89; enzymatic hydrolysis3 L bioreactor (SSCF)/batch40.87 0.28Zhang et al., 2022 [27]
T. oleaginosus
DSM 11815
NoCorn stoverSteam explosion;
enzymatic hydrolysis
7 L bioreactor with 2 L medium/batch42.285.380.06This study
Disclaimer/Publisher’s Note: The statements, opinions and data contained in all publications are solely those of the individual author(s) and contributor(s) and not of MDPI and/or the editor(s). MDPI and/or the editor(s) disclaim responsibility for any injury to people or property resulting from any ideas, methods, instructions or products referred to in the content.

