
Life Cycle Assessment of Aviation Fuel Production from Steel-Industry Off-Gas
1
Key Laboratory for Green Chemical Technology of Ministry of Education, School of Chemical Engineering and Technology, Tianjin University, Tianjin 300350, China
2
Zhejiang Institute of Tianjin University, Ningbo 315201, China
*
Author to whom correspondence should be addressed.
Processes 2024, 12(3), 579; https://doi.org/10.3390/pr12030579
Submission received: 19 February 2024
/
Revised: 6 March 2024
/
Accepted: 12 March 2024
/
Published: 14 March 2024
(This article belongs to the Section Environmental and Green Processes)
Abstract
:The steel industry in China, the world’s largest, contributes to about 15% of the nation’s total carbon emissions. Instead of direct combustion, the technology of converting off-gas from the steel industry into liquid fuels not only enhances the added value of this byproduct but also helps alleviate carbon emissions. This study, for the first time, integrates the specific circumstances of China to evaluate the carbon emissions of Ethanol to Jet (ETJ) and Fischer–Tropsch to Jet (FTJ) fuel technologies utilizing Basic Oxygen Furnace Gas (BOFG) and Coke Oven Gas (COG) as feedstocks. Six cases were examined using Aspen Plus (V11) for mass and energy balance: Case 1: BOFG/ETJ, Case 2: BOFG/FTJ, Case 3: COG/ETJ, Case 4: COG/FTJ, Case 5: (COG + BOFG)/ETJ, and Case 6: (COG + BOFG)/FTJ. The analysis underscores that the FTJ pathway exhibits superior carbon reduction efficiency relative to ETJ. Compared to traditional petroleum-based aviation fuels (86.65 g CO2eq/MJ), the FTJ pathways utilizing COG or COG + BOFG as feedstocks exhibit significant advantages in greenhouse gas (GHG) emission reductions, with carbon emissions of 23.60 g CO2eq/MJ and 41.48 g CO2eq/MJ, respectively, representing reductions of 72.76% and 52.13%. Furthermore, employing uncertainty analysis based on the Monte Carlo method establishes the credibility of the findings. Finally, sensitivity analysis for parameter optimization and process improvements demonstrates the significant impact of the life cycle assessment (LCA) allocation method on computational results for exhaust gas feedstocks. Given the limited coverage of lifecycle assessments for Ethanol to Jet and Fischer–Tropsch to Jet pathways in China, this study could assist policymakers in determining the development trajectory of sustainable aviation fuel (SAF) in China.
1. Introduction
China holds the distinction of being the world’s largest steel producer, with a staggering output of 1.065 billion tons of crude steel in 2020, constituting 56.8% of the global production [1]. Statistical data indicate that the production of each ton of steel is associated with the emission of 1.83 tons of CO2. The majority of these emissions arise from three primary sources of waste gases: COG, Blast Furnace Gas, and BOFG [2]. As a result, the efficient utilization of steel-industry off-gas presents an opportunity to mitigate carbon emissions. This can be achieved through strategies such as Carbon Capture and Storage, hydrogen generation, and the production of liquid fuels from steel-industry off-gas, among other methods. Traditional jet fuels are typically derived from crude oil through fractional distillation, with aviation fuels primarily comprising a mixture of alkanes whose carbon chain lengths range from C8 to C16 [3,4]. The International Air Transport Association and the International Civil Aviation Organization have championed the advancement of Sustainable Aviation Fuels (SAFs) as a means to reduce the consumption of fossil fuels and mitigate greenhouse gas (GHG) emissions [5].
The production technology of bioethanol is well-established, and ethanol can be converted into mixed alkanes through the Alcohol-to-Jet (ATJ) process, which comprises three stages: intramolecular dehydration of ethanol, oligomerization of ethylene, and hydrogenation of mixed olefins [6]. To enhance the yield of jet fuel, ethylene can undergo dual polymerization. Initially, ethylene is converted into a mixture of olefins with carbon chain lengths of C4 or greater. Subsequently, this olefin mixture, with carbon chain lengths ranging from C4 to C8, undergoes a second oligomerization [7,8]. At present, the primary feedstock alcohols employed in the ATJ process are obtained through the direct fermentation of biomass sources, including corn, sugarcane, and cellulosic biomass [9].
In 2009, the American Society for Testing Materials issued its inaugural approval for aviation kerosene produced using the FTJ method for use in commercial flights [10]. The Fischer–Tropsch (FT) process converts syngas, consisting of CO and H2, into alkane fuels [11]. Catalysts are pivotal in FT synthesis, commonly employing Fe, Co, Ni, and Ru [12]. Moreover, before initiating the FT reaction, it is necessary to adjust the H2/CO ratio to 2:1 through either water-gas shift (WGS) or methane dry reforming (MDR) reactions [13]. Furthermore, FT synthesis is frequently integrated with other production technologies. For instance, a previous study combined biomass liquefaction, gasification, and FT synthesis, achieving an atomic utilization rate of 32%, marking a 45% improvement compared to that of First-generation/Second-generation bioethanol [14].
Steel-industry off-gas, containing CO, H2, CH4, and CO2 components, can be chemically converted into syngas predominantly consisting of CO and H2 through methods such as MDR or the WGS reaction [15]. Syngas, once proportionally adjusted, can serve as the feedstock for the ETJ and FTJ processes [16]. LanzaTech has commercialized the fermentation process of converting gas to ethanol and established a commercially operational plant in Caofeidian, China [17]. LanzaTech, in collaboration with the Pacific National Laboratory, converted ethanol produced at the Caofeidian plant into jet fuel, successfully fueling a Virgin Atlantic 747 flight in 2018 [18]. Beyond the use of BOFG as the exclusive feedstock, additional technologies can be explored for jet fuel production through ETJ and FTJ methods, utilizing coke oven gas or blended tail gases as feedstocks. This approach offers a mutually beneficial scenario for both the steel and aviation sectors [19].
Table 1 presents recent research on the synthesis of SAF via ETJ and FTJ pathways. Researchers have shown greater interest in producing SAF from biomass feedstocks, although there are also examples utilizing waste gases and waste tires as feedstocks. This study innovatively conducts a comparative analysis of six ETJ and FTJ pathways within the same simulation system, employing the same LCA methodology. Additionally, the use of a method similar to ethanol fermentation for the ETJ pathway, followed by the synthesis of jet fuel from ethanol, demonstrates the originality of this research.
The Carbon Offsetting and Reduction Scheme for International Aviation (CORSIA), endorsed by the International Civil Aviation Organization, mandates the utilization of LCA methodologies to assess carbon emission reductions achieved through the deployment of SAFs [20]. Sierk de Jong et al. employed the GREET (GREET.net v1.3.0.12844, database version 12384) software to conduct an LCA of various SAFs in the United States. Their analysis revealed GHG emission reductions for the FT method ranging from 86% to 104%, sugarcane-based ATJ fuels achieving reductions of 71% to 75%, and corn stover-based ATJ fuels showing reductions of 60% to 75%, compared to conventional petroleum-based aviation fuels [21]. Capaz et al. conducted an LCA of aviation fuels produced through the ATJ and FTJ methods in Brazil. Their findings indicated that the cellulose-based FT method exhibited the highest potential for reducing GHG emissions, with a reduction range of 95% to 130%. Furthermore, the steel-industry off-gas-based ATJ method demonstrated a GHG emission reduction potential ranging from 50% to 74% [22]. These data serve as a valuable point of reference for comparing with other research efforts and are instrumental for government entities in quantifying the GHG emission reductions achieved through the novel ETJ and FTJ production technologies proposed in this study, utilizing the LCA methodology.
In this study, BOFG, COG, and a BOFG + COG blend were used as feedstocks to produce jet fuel through the ETJ and FTJ methods, respectively. Importantly, the feedstock gas compositions for both ETJ and FTJ methods were standardized to facilitate benchmark comparisons. Technologies such as WGS and MDR were employed to adjust the gas composition ratio. LCA analysis of these SAF production technologies was conducted under Chinese conditions to determine the potential for each pathway. This study can provide new off-gas treatment methods for steel plants and also explore various possibilities for the production of aviation fuels from non-biological feedstocks.

Table 1.
Research on SAF production via ETJ and FTJ pathways in recent years. ETJ: Ethanol to jet fuel; FTJ: Fischer–Tropsch to jet fuel; SAF: Sustainable aviation fuel.
Table 1.
Research on SAF production via ETJ and FTJ pathways in recent years. ETJ: Ethanol to jet fuel; FTJ: Fischer–Tropsch to jet fuel; SAF: Sustainable aviation fuel.
| Years | Raw Material | Preparation Method of SAFs | Reference Sources |
|---|---|---|---|
| 2020 | Sugarcane | FTJ | Bressanin et al. [23] |
| 2021 | Lignocellulosic | ETJ | Romero-Izquierdo et al. [7] |
| 2021 | Lignocellulosic | ETJ and FTJ | Capaz et al. [22] |
| 2022 | Sugarcane | ETJ | Escalante et al. [24] |
| 2022 | Lignocellulosic | FTJ | Stigsson et al. [14] |
| 2022 | Steel-industry off-gas | FTJ | Collis et al. [19] |
| 2023 | Corn cob | ETJ | Wang et al. [25] |
| 2023 | Lignocellulosic | ETJ | Voß et al. [26] |
| 2023 | Corn stover | ETJ | Sun et al. [27] |
| 2023 | Sugarcane | FTJ | Guimarães et al. [28] |
| 2024 | Waste tires | FTJ | Rogachuk et al. [29] |
2. Methods and Simulations
The LCA in this study adhered to the ISO 14040/44 standard [30]. Life cycle assessment data were sourced from literature and simulations conducted using Aspen Plus (V11). This study proposed six routes with different feed gas compositions and reaction modes. The three ETJ processes included BOFG/ETJ, COG/ETJ, and (COG + BOFG)/ETJ. The three FTJ processes comprised BOFG/FTJ, COG/FTJ, and (COG + BOFG)/FTJ.
2.1. Goal and System Boundary
In this study, the immediate objective of the LCA was to evaluate the energy consumption and GHG emissions associated with aviation fuel preparation routes in ETJ and FTJ processes. The assessment focused on two impact categories: primary energy consumption and global warming potential. Primary energy refers to energy obtained directly from natural resources, such as raw coal, crude oil, natural gas, etc. [31,32]. The global warming potential values of CO2, CH4, and N2O considered in this study were 1, 25, and 298 g CO2eq, respectively [21]. The ultimate goal of LCA is to evaluate the environmental impact of each stage in the production process, including the comparison of raw materials and reaction modes. This process assists companies in quantifying the impact and devising improvement methods. Consequently, it fosters public awareness and enables consumers to make informed choices by selecting products with minimal environmental impact [25].
The functional unit for this study was 1 MJ of jet fuel. The system boundary is depicted in Figure 1. In the ETJ process, the system boundary encompasses the following unit processes: conversion of steel-industry off-gas to ethanol through MDR and fermentation, conversion of ethanol to jet fuel, transportation of jet fuel, and the combustion and power generation from waste gases. For the FTJ process, the system boundary includes the following processes: conversion of waste gases to jet fuel through WGS, MDR, and FT reactions; transportation of jet fuel; combustion and power generation from waste gases; and pressure swing adsorption (PSA) for the separation of H2 and CO.
2.2. Process Description and Simulation
In this study, Aspen Plus (V11) was employed to simulate the jet fuel production processes utilizing BOFG, COG, and the integrated BOFG and COG as feedstock, respectively. Table 2 presents the components of BOFG and COG [33]. In this study, only H2, CO, CO2, CH4, and N2 components were considered in the steel-industry off-gas; other impurity gases were not taken into account.
2.2.1. Ethanol Conversion Processes
For the BOFG/ETJ, COG/ETJ, and (COG + BOFG)/ETJ pathways, steel-industry off-gas was converted to ethanol through bacterial action [34]. Subsequently, distillation and molecular sieve dehydration were conducted to recover ethanol (99.5 wt%), and the treated water was recycled to the conventional ethanol production process. The composition data for BOFG and COG in this study were obtained from a steel plant in China. The ethanol conversion was modeled based on the approach used by LanzaTech, a company specializing in the conversion of gases from various plants and biomass syngas into liquid fuels [17].
According to Equations (1) and (2), under mild conditions (37 °C, 1 bar), CO, H2, and CO2 in the syngas were converted into ethanol through bacterial metabolism in the fermenter [35]. The conversion rates of CO and H2 were 90% and 60%, respectively [36].
The concentration of ethanol in the fermenter was monitored by adjusting the ratio of CO to H2O to prevent it from exceeding a concentration of 5% (50 g/L) in the bioreactor. Otherwise, bacterial inactivation could occur [34]. The residual Clostridium ethanolum protein isolated from wastewater could be upgraded to fish feed with a maximum yield of 85% [25].
Figure 2 depicts the process flow of BOFG fermentation to produce ethanol. In the BOFG/ETJ route, BOFG was the feed gas used to produce ethanol. BOFG is an off-gas rich in CO, CO2, and N2.
Figure 3 depicts the process of COG fermentation to produce ethanol. In the COG/ETJ route, COG and CO2 were used as feed gas to produce ethanol. COG is an exhaust gas rich in H2 and CH4, with excess H2 and insufficient CO.
In this study, an MDR reaction was conducted to enhance the CO proportion in COG. As depicted in Equation (3), CH4 and CO2 were converted into H2 and CO at 900 °C and 1 bar [15]. This reaction was simulated using the RGibbs module of Aspen Plus (V11). The gas resulting from the MDR reaction was enriched in H2 and CO2, and the synthesis gas was subsequently fed into the fermentation reactor for the ethanol production process.
Figure 4 describes the process of COG + BOFG fermentation to produce ethanol. In the (COG + BOFG)/ETJ route, COG and BOFG were directly fed into the fermentation reactor with a certain ratio to produce ethanol. In the (COG + BOFG)/FTJ pathway, the FT synthesis requires a molar ratio of H2 to CO in the feed gas to be 2.0. When the mass ratio of BOFG to COG feed is 1.431, the molar ratio of H2 to CO in the synthesis gas becomes exactly 2.0. In the (COG + BOFG)/ETJ pathway, to ensure consistency with the (COG + BOFG)/FTJ pathway in terms of feedstock composition, the mass ratio of BOFG to COG in the feed is also set to 1.431.
After the direct fermentation of tail gas to produce ethanol, a process involving flash distillation and rectification is carried out. In this study, high-purity ethanol was obtained through a PSA tower (MS-1) for dehydration. The adsorption tower comprises two beds, denoted by A and B, with 3A molecular sieves used as the packing material. The PSA dehydration process consists of four steps: adsorption, depressurization, regeneration, and pressurization [37]. The working pressure during molecular sieve adsorption is 379.2 kPa, with a working temperature of 440 K. The pressure of the molecular sieve is supplied by ethanol vapor. When molecular sieve A becomes saturated with water, ethanol vapor automatically enters molecular sieve B. The working molecular sieve B undergoes regeneration, flushing, and repressurization [38,39].
2.2.2. Jet Fuel Production from Ethanol
Figure 5 shows the Aspen Plus (V11) simulation flow for the ethanol-jet fuel unit process. Aviation fuel is a mixture of alkanes ranging from C8 to C16. The production of aviation fuel from ethanol involves four steps: intramolecular dehydration of ethanol to produce ethylene, low polymerization of ethylene to form a mixture of olefins, hydrogenation of the olefin mixture to produce a mixture of alkanes, and distillation separation of the alkane mixture into aviation kerosene, gasoline, diesel, and other products [25]. The RStoic model was employed for all reactors. Material recycling was included in all three reaction steps: primary oligomerization, secondary oligomerization, and olefin hydrogenation.
Referring to the study conducted by Romero-Izquierdo et al., under the conditions of 450 °C and 11.4 atm, the conversion rate of ethanol to ethylene is 98.8%. The catalyst used was SYNDOL, and a small amount of ether and acetaldehyde were produced as by-products [7]. The off-gas from the ethanol dehydration reactor (R-1) is directed to an absorption column (AB-1) for moisture removal, with triethylene glycol used as the absorbent [40]. In this study, the absorption column is represented by the SEP module. To enhance the yield of aviation fuel, the oligomerization reaction was conducted in two distinct reactors (R-2 and R-3). The ethylene oligomerization reaction was carried out in two reactors. In the first oligomerization reactor (R-2), ethylene was oligomerized to primarily produce a mixture of butenes under the following process conditions: 300 °C, 15 atm, using Ni-LASA as the catalyst, with a conversion rate of 53.7% [41]. In the second oligomerization reactor (R-3), the primarily butene-rich mixture of olefins was further oligomerized to produce high-carbon chain olefins under the following process conditions: 200 °C, 40 atm, using HZSM-5 as the catalyst [42]. To simplify the simulation process, it was assumed that the olefin products were all mono-olefins. The hydrogenation reaction of mixed olefins takes place in reactor (R-4) under the following conditions: 200 °C, 36 atm, using ATHZ5-Cs as the catalyst, achieving a conversion rate close to 100%. Subsequently, jet fuel, along with diesel as by-products, was separated based on their boiling points [42].
2.2.3. Jet Fuel Production from Fischer–Tropsch Synthesis
For the BOFG/FTJ, COG/FTJ, and (COG + BOFG)/FTJ pathways, the steel-industry off-gas undergoes an FT reaction to produce jet fuel and gasoline and diesel as by-products [19].
The FT reaction is a chemical process that converts a syngas mixture, consisting of CO and H2, into high-molecular-weight liquid fuels and various other chemicals [43]. Synthesis gas can be extracted from non-petroleum sources such as coal, natural gas, or biomass [44]. It is a well-established process primarily employed in regions with ample coal or natural gas reserves but limited oil resources, such as South Africa, which currently hosts the largest FT plant. In the FTJ process, the syngas enters the FT reactor, where linear alkanes are produced [19]. FTJ processes can vary in several ways, with the primary distinction being between low-temperature FT and high-temperature FT. The low-temperature FT operates in the range of 200–240 °C, promoting the formation of longer chain hydrocarbons, whereas the high-temperature FT operates within the range of 300–350 °C [45,46]. FT reactors also have different catalyst possibilities. Cobalt catalysts are effective at lower temperatures and pressures but their cost is up to 250 times that of iron catalysts [47]. While iron catalysts are more resistant to catalyst poisoning, they have a shorter lifespan than cobalt catalysts [48].
The ratio of H2 to CO in the raw syngas also influences the reaction; as the proportion of H2 increases, more short-chain hydrocarbons are produced [49]. Davis and Occelli reported that cobalt catalysts are a suitable choice for the production of long-chain paraffins, whereas iron-based catalysts tend to favor olefin production [50]. However, the nature of the feedstock is a crucial parameter in the FTs reaction. It has been observed that cobalt catalysts perform better when the H2/CO ratio is greater than 2.0, especially when natural gas is the feedstock source [51]. The FT synthesis system is highly intricate, yielding products that encompass alkanes, alkenes, and oxides. However, these alkenes and oxides are typically disregarded in most FT kinetic investigations due to their inferior quality [19].
Due to the complexity of side reactions in FT synthesis, the by-products may be influenced by factors such as reaction temperature, pressure, catalyst type, and state. To simplify the simulation calculation, only the methanation reaction and the formation of chain alkanes are considered in the simulation. The overall reaction equation is presented in Equation (4) [52,53]:
According to the number of hydrocarbon carbons, FT synthesis products are divided into CH4, low-carbon hydrocarbons (C2-C4), gasoline (C5-C10), aviation kerosene (C8-C16), diesel oil (C11-C22+) [54,55].
The hydrocarbons generated in the FT reaction span from C1 to greater than C100, and the distribution of products adheres to the Anderson–Schulz–Flory (ASF) distribution equation, Equation (5), in which the chain growth probability factor α (0 ≤ α ≤ 1) governs the molecular distribution of hydrocarbon chain lengths [56].
In the formula in Equation (5), Wn = the mass fraction of hydrocarbons with n being carbon number in the total hydrocarbons generated, α = carbon chain growth probability factor, and n = the number of carbon atoms in the product.
Markowitsch et al. conducted experimental research on the carbon chain growth probability factor under different operating conditions. In this study, a cobalt-based catalyst was used, and under the conditions of 220 °C and 25 bar, with an H2/CO feed ratio of 2.0 and α value of 0.92, the CO unidirectional conversion rate was approximately 40% [53,57,58,59,60].
Building upon the aforementioned discussion, the utilization of Python (v 3.12.2) for analyzing the ASF equation and executing quadratic fitting with Aspen Plus (V11) enables the determination of the FT synthesis conversion rate. Due to constraints in the Aspen Plus (V11) physical property database, this study categorized the wax phase C23+ as C23H48, focusing solely on the methanation reaction and reactions involving chain alkanes (C1-C22). The light FT products (C1-C6) are recycled to augment the conversion rate of the FT reaction [61].
In FT synthesis, high-carbon aliphatic hydrocarbon waxes were one of the main products [62]. C23H48 undergoes hydrogen cracking to yield additional short-chain alkanes (C1-C22). Hydrogen cracking stands as a pivotal technology for the profound processing of FT wax products. Facilitated by elevated temperature, high pressure, and hydrogen-rich conditions, FT wax engages in hydrogenation, cracking, and isomerization reactions catalyzed to transition into high-quality oils, including light diesel, kerosene, gasoline, or gaseous hydrocarbons [63]. For a bifunctional platinum-based catalyst (Pt/CaY), the hydrogenation cracking temperature must be above 280 °C to maximize the selectivity of C10-C20 components [63,64,65].
The hydrocracking operating conditions were 360 °C and 35 bar, with a hydrogen-to-wax ratio of 0.06 kg H2/kg wax [63,66]. The reactor stoichiometry was calculated using the ideal hydrocracking model as described by Bouchy et al. [19,63]. The typical product selectivity is defined as the cut between C3-C4 (liquefied petroleum gas), C5-C9 (naphtha), and C10-C20 (intermediate distillate), compared to the ideal cuts achievable with long-chain waxes such as C23H48 during hydrogenation. Predictions can be made based on the discussed reaction mechanism under the following assumptions [63]:
- Only pure primary cracking is allowed,
- Formation of C1 and C2 is not considered,
- An equal number of fragments form between C4 and C19,
- The molar amount of C3 and C20 is half the molar amount of fragments between C4 and C19.
After hydrocracking, a distillation column was employed to separate the C23+ components from those within the jet fuel boiling range. Following this, the C23+ components were recycled through the hydrocracking unit to enhance the conversion rate. Finally, the alkane mixture is separated based on the boiling points of gasoline, jet fuel, and diesel.
Figure 6 illustrates the Aspen Plus (V11) simulation process for the production of jet fuel from BOFG through FT synthesis. In the BOFG/FTJ pathway, BOFG serves as the raw material gas for jet fuel production. Since CO2 and N2 in BOFG do not participate in the FT reaction, CO is initially separated from it using vacuum pressure swing adsorption (VPSA) for subsequent reactions. VPSA can generate CO with a purity of 99.9%, and the maximum CO recovery rate is 95.7% [67]. The FT reaction requires an adjustment of the H2 to CO ratio to 2:1. Therefore, in this study, the introduction of the WGS reaction was considered to adjust the feedstock ratio for FT. The WGS generally comprises two types: high-temperature shift (643–673 K, 10–60 bar) and low-temperature shift (about 473 K, 10–40 bar) [68]. The number of moles between reactants and products was the same, therefore, a rise in pressure had no effect on the equilibrium [69]. Considering reaction kinetics, conducting the WGS reaction at higher temperatures is more advanced. Therefore, this study employed a cerium (CeO2)-based WGS catalyst, with selected reaction conditions of 400 °C and 10 bar, achieving a one-way CO conversion rate of up to 67% [70]. The WGS reaction takes place in reactor (R-1). The feed ratio of CO to H2O in the WGS reactor was 1:3 [71]. The water-gas shift reaction is represented by Equation (6):
The outlet stream from reactor (R-1) contains CO, CO2, N2, and H2O. Water is removed through gas-liquid separation (F-1), and then CO2 is absorbed using K2CO3 in an absorption tower. In this study, the SEP module (AB-1) is used to denote the absorption tower. Purified H2 and CO enter reactor (R-2) for the FT reaction, with product distribution following the ASF equation. The single-pass conversion rate is 40%, as detailed earlier in this study [53]. Light FT products are recycled to the inlet of the FT reactor after passing through a flash drum (F-3) to enhance the yield. The wax phase after FT synthesis undergoes a hydrocracking reaction (R-3) to increase the yield of jet fuel. Subsequently, after distillation, gasoline, jet fuel, and diesel can be obtained.
Figure 7 illustrates the Aspen Plus (V11) simulation process for jet fuel production from COG through FT synthesis. In the COG/FTJ pathway, COG and CO2 serve as feedstock gases for jet fuel production. However, the CO proportion in COG is insufficient to sustain a continuous FT reaction. To address this, an MDR reaction was introduced to enhance the CO proportion. The dry reforming reactor (R-1) was simulated using the RGibbs module. The off-gas from the MDR reactor was directed to reactor (R-2) for the FT reaction, and the FT products from (R-2) were subsequently sent to reactor (R-3) for hydrocracking to increase the yield of jet fuel.
Figure 8 illustrates the Aspen Plus (V11) simulation process for COG + BOFG to produce jet fuel through FT synthesis. In the (COG + BOFG)/FTJ pathway, (COG + BOFG) is used as the feed gas to produce jet fuel. COG contains a high concentration of H2, while BOFG is rich in CO. BOFG is obtained with 99.9% CO purity through VPSA [67], while COG is obtained with 99.995% H2 purity through PSA, with a recovery rate of 92.29% [72]. The purified H2 and CO enter the reactor (R-1) to undergo the FT reaction, and then proceed to reactor (R-2) for hydrocracking. Finally, based on the boiling points of liquid fuels, gasoline, jet fuel, and diesel are separated.
2.3. Assumptions
This study adopted the following assumptions.
- This study does not consider factors such as land-use change, labor, and infrastructure. (a) Land-use change refers to changes in carbon flux between terrestrial ecosystems and the atmosphere due to land-use conversion (e.g., forests, grasslands, croplands) [73]. (b) When impact indicators are associated with social, economic, and labor factors, information related to labor is required. The objective of this study is to assess the GHG emissions and energy consumption of ETJs and FTJs, so labor considerations have not been included [74]. (c) In this study, infrastructure refers to fixed assets such as equipment, facilities, and buildings. The carbon footprint of infrastructure construction is inversely related to its lifespan, meaning that a longer lifespan results in a lower average annual carbon footprint [75]. This study focuses on a short production cycle, so infrastructure considerations have not been taken into account.
- Heat loss and pressure loss were not considered during the simulation.
- The exhaust gas was combusted to generate electricity, the combustion heat release was simulated by Aspen Plus (V11), and the power generation efficiency was 35% [76].
- The LCA distribution of raw materials adopted the 50/50 method, that is, the LCA of raw materials is divided equally between producers and consumers [77].
- In this study, we assumed that 50% of the heat was derived from coal, while the remaining 50% was sourced from natural gas, each with thermal efficiencies of 80% and 90%, respectively [25].
2.4. Inventory Data
Life cycle inventory data serve as fundamental information in the calculation process, covering background data, raw material production and collection data, transportation data, and distribution data.
2.4.1. Background Data
Fuels for the process: In this study, six secondary energy sources were chosen as the typical process fuels, and the associated parameters were computed using matrix functions, as outlined in the research conducted by Ren et al. [78].
When simulating in Aspen Plus (V11), heating below 250 °C was achieved using steam heating, with a thermal storage efficiency of approximately 81% [25]. Heating in the range of 250 to 450 °C utilized molten salts, with a thermal storage efficiency of 76.2% [79]. For temperatures above 450 °C, natural gas flame heating was employed.
For the cooling utility system, cooling above 130 °C is employed for producing low-pressure steam at 120 °C. Cooling in the range of 45 to 130 °C utilizes circulating water (30 to 40 °C). Cooling in the range of 17 to 40 °C uses chilled water (7 to 12 °C) with a compressor coefficient of performance of 7 [80]. Cooling below 17 °C involves the use of cooling brine and ethylene glycol, with compressor coefficients of performance of 3.8 and 2.5, respectively [81,82].
2.4.2. Feedstock Data
The feed gases, BOFG and COG are acquired from the exhaust gas data of a steel plant in China. The CO2 used in the COG/ETJ and COG/FTJ pathways is derived from the gas purification and recovery process of the lime kiln emissions at the steel plant [83].
2.4.3. Transportation Data
In this study, we have taken into account the combined transportation involving medium-duty and heavy-duty trucks, and the specifics of their fuel compositions and efficiencies are outlined in Table 3. The construction of the jet fuel plant is assumed to be in proximity to the steel plant, with the distance between the refinery and the airport set at 100 km.
3. Results and Discussion
This section presents the process simulation and LCA results, along with a detailed analysis, encompassing sensitivity analysis, comparison with other studies, and prospects.
3.1. Simulation Results
The production process of jet fuel for ETJ and FTJ processes was simulated using Aspen Plus (V11).
3.1.1. Material Balance
Table 4 illustrates the input and output of chemicals, energy, and hydrocarbon fuel yield. Remarkably, the pathway utilizing COG as a raw material exhibited the lowest off-gas consumption in producing 1 MJ of jet fuel. This efficiency is attributed to the fact that COG primarily consists of H2 and CH4, both of which can directly or indirectly contribute to the conversion of jet fuel. In contrast, BOFG contains 25% N2, an inert gas in the reaction, resulting in an increased mass of the feed BOFG. Additionally, in the process of utilizing COG as the feedstock, the introduction of CO2 serves as a direct carbon source, leading to a significant reduction in the consumption of exhaust gases from the steel plant.
In the ETJ route, water is introduced to ensure that the ethanol concentration remains below 5% (50 g/L) to sustain bacterial activity; however, the water can be purified and recycled. Due to the high-pressure requirements of FTJ, their electricity consumption is generally higher than that of ETJ. Excess gas is burned to generate electricity as a byproduct, and it was observed that the pathway using COG + BOFG as feedstock produces the highest amount of electricity, primarily because CH4 is not consumed in the reaction but is instead directly burned for power generation. When comparing the by-product fuels from the ETJ and FTJ pathways, it is evident that the FTJ pathway yields higher quantities of gasoline and diesel, which directly affects the allocation ratio in LCA. Additionally, all six pathways produce different levels of low-pressure steam, which also has some impact on LCA allocation.
3.1.2. Physical Properties of Jet Fuel
The physical properties of aviation fuel produced by different routes were compared with standard jet fuel [8], as shown in Table 5. The parameter values of the fuel synthesized using the ETJ and FTJ methods in Table 5 are derived from the physical property data of the simulated streams in Aspen Plus (V11) software.
3.2. Life Cycle Assessment Results
Combining the data in Section 3.1 and background data, LCA calculations were performed to obtain the fossil fuel consumption and GHG emissions of each route.
3.2.1. Fossil Fuel Consumptions
Figure 9 illustrates the well-to-wheel fossil fuel consumption as the sum of coal, oil, and natural gas based on 1 MJ of jet fuel for the six pathways.
Within the ETJs pathway, considering the analogous aviation fuel production processes for COG/ETJ and (COG + BOFG)/ETJ, there is a corresponding relationship in the consumption proportions of coal, petroleum, and natural gas. This arises from the inclusion of the MDR reaction in these routes, which occurs at a temperature of 900 °C and requires flame heating, thereby increasing the utilization ratio of natural gas. The (COG + BOFG)/ETJ pathway is analogous to the COG/ETJ process; however, the former consumes less electricity for refrigeration and yields a greater volume of exhaust gas for electricity co-generation. Consequently, the (COG + BOFG)/ETJ pathway has the least amount of fossil fuel allocated per 1 MJ of jet fuel produced.
Among the three FTJ pathways, the BOFG/FTJ route exhibits the highest consumption of fossil fuels, surpassing COG/FTJ by 182.73% and (COG + BOFG)/FTJ by 539.23%. The substantial energy requirement of the BOFG/FTJ process is attributed to the water-gas shift reaction, which necessitates heating significant volumes of water to temperatures exceeding 400 °C, inevitably resulting in a marked increase in thermal energy consumption. Additionally, the COG/FTJ pathway requires more fossil fuel than the (COG + BOFG)/FTJ route due to the high-temperature requirements of the methane dry reforming reaction and the fact that the (COG + BOFG)/FTJ generates a greater amount of co-produced electricity.
3.2.2. GHG Emissions
Figure 10 shows the GHG emissions and carbon credits for each unit of the six pathways.
The carbon intensity of each pathway was calculated from carbon emissions from thermal utilities, electricity credits, aviation fuel transportation, post-combustion tailpipe emissions, and LCA allocation for feedstocks. Within the ETJ routes, the (COG + BOFG)–ETJ pathway has the lowest carbon dioxide emissions, amounting to 70.75 g CO2eq. This is partially due to a higher GHG allocation for the feedstock and lower direct CO2 emissions from exhaust gases. Additionally, the (COG + BOFG)-ETJ route has the least CO2 emissions from thermal utilities and indirect electricity. In the FTJ pathways, the COG-FTJ route emits the least CO2, at 23.6 g CO2eq. This can be attributed to minimal direct GHG emissions from exhaust gases, registered at 28.72 g CO2eq, and to the consumption of a certain amount of CO2 during the MDR process within the COG-FTJ route.
Upon comparing the ETJ and FTJ routes, it is evident that for the production of aviation fuel using COG or COG + BOFG as feedstocks, the FTJ pathways consistently result in lower carbon dioxide emissions than the ETJ pathways. This underscores that the FTJ method remains one of the most prevalent approaches for the synthesis of aviation fuel.
3.3. Sensitivity Analysis
A sensitivity analysis was conducted to assess the responsiveness of the outcome to variations in the parameters. A single-parameter sensitivity analysis was executed by adjusting the parameter value by ±10%, thereby evaluating the spectrum of outcomes. The analysis was targeted at pivotal parameters, with the findings depicted in Figure 11. The blue bars represent the effects of a 10% reduction, while the orange bars correspond to the impacts of a 10% augmentation in the parameter’s value.
The life cycle carbon emissions of all processes producing jet fuel from steel-industry off-gas exhibit the most pronounced response to feedstock Life Cycle Assessment allocation. Increasing the feedstock LCA allocation of 1 MJ of jet fuel from 50% to 55% results in a carbon emission reduction ranging from 5% to 14%. This is attributed to the elevated initial carbon equivalent in the feedstock when utilizing steel-industry off-gas, and augmenting the feedstock LCA allocation directly alters the initial carbon emissions, thereby influencing the disparity between process carbon emissions and initial carbon emissions.
3.4. Uncertainty Analysis
Uncertainty arises from various sources. The LCA model serves as a simplified representation of the actual system, and this simplification leads to disparities between the assessment results and the “real” scenario. Uncertainty in the data primarily stems from measurement or transcription errors, as well as the application of data measured at specific locations and time scales. This is employed to characterize the system state at different scales represented by the assessment model, necessitating the use of inconsistent or heterogeneous datasets due to temporal, spatial, or financial constraints. Most directly, the uncertainty in input data propagates through model calculations, resulting in uncertainty in the assessment outcomes [86].
The probability distributions of input parameters represent a rational operational definition of uncertain parameters. Most probability distributions commonly employed in general studies are constructed based on statistical analyses of data collected through surveys conducted by government agencies in the location of the plant. However, in cases where sample data for uncertain parameters are severely limited, a triangular distribution is utilized. Given the limited data available in our study, a triangular distribution is employed for input values [86,87].
In this study, three key factors contributing to the uncertainty in lifecycle assessment results are Raw Material LCA, GHG emissions per unit of MJ electrical energy, and Combined Heat and Power (CHP) efficiency.
The selected three factors are all based on triangular distributions constructed around ideal values, as illustrated in Table 6. Here, “mode” represents the numerical value under ideal conditions, while “min” and “max” represent values obtained by distributing 10% above and below the ideal value [87,88]. This study assumes that input parameters of uncertainty will not deviate significantly from their ideal values.
Examining the impact of individual factors on GHG emissions based on Table 6, triangular distributions were derived. The triangular distributions corresponding to the three influencing factors in Table 6 are used as input parameters for multi-factor uncertainty analysis. To achieve a convergent distribution, the LCA calculation process was iterated 1,000,000 times using Python. In each iteration, values were randomly sampled from the distribution functions of the mentioned variables and multiplied by the respective influence coefficients to generate the distribution of LCA results. Given that the selected influencing factors include Raw Material LCA, GHG emissions per unit of MJ electrical energy, and CHP electric efficiency, appropriate influence coefficients were set based on sensitivity analysis to represent the magnitude of their impact on the results.
The resulting curves can be approximated as Gaussian curves, indicating greater stability and reduced susceptibility to the impact of data uncertainty [88]. The quantification of result uncertainty was achieved using the relative standard deviation, i.e., the ratio of the standard deviation to the mean. The mean values of the Gaussian distributions for the six pathways (BOFG-ETJ, COG-ETJ, (COG + BOFG)-ETJ, BOFG-FTJ, COG-FTJ, (COG + BOFG)-FTJ) are 175.6, 82.57, 70.75, 88.96, 23.37, and 41.48 g CO2eq/MJ, respectively. The standard deviations are 4.80, 1.33, 1.53, 3.13, 0.77, and 1.57, respectively. The relative standard deviations are 2.73%, 1.61%, 2.16%, 3.51%, 3.28%, and 3.78%, respectively.
3.5. Comparisons and Prospect
This section compares this study with other studies and predicts the future development of ETJ and FTJ in China.
3.5.1. Comparisons
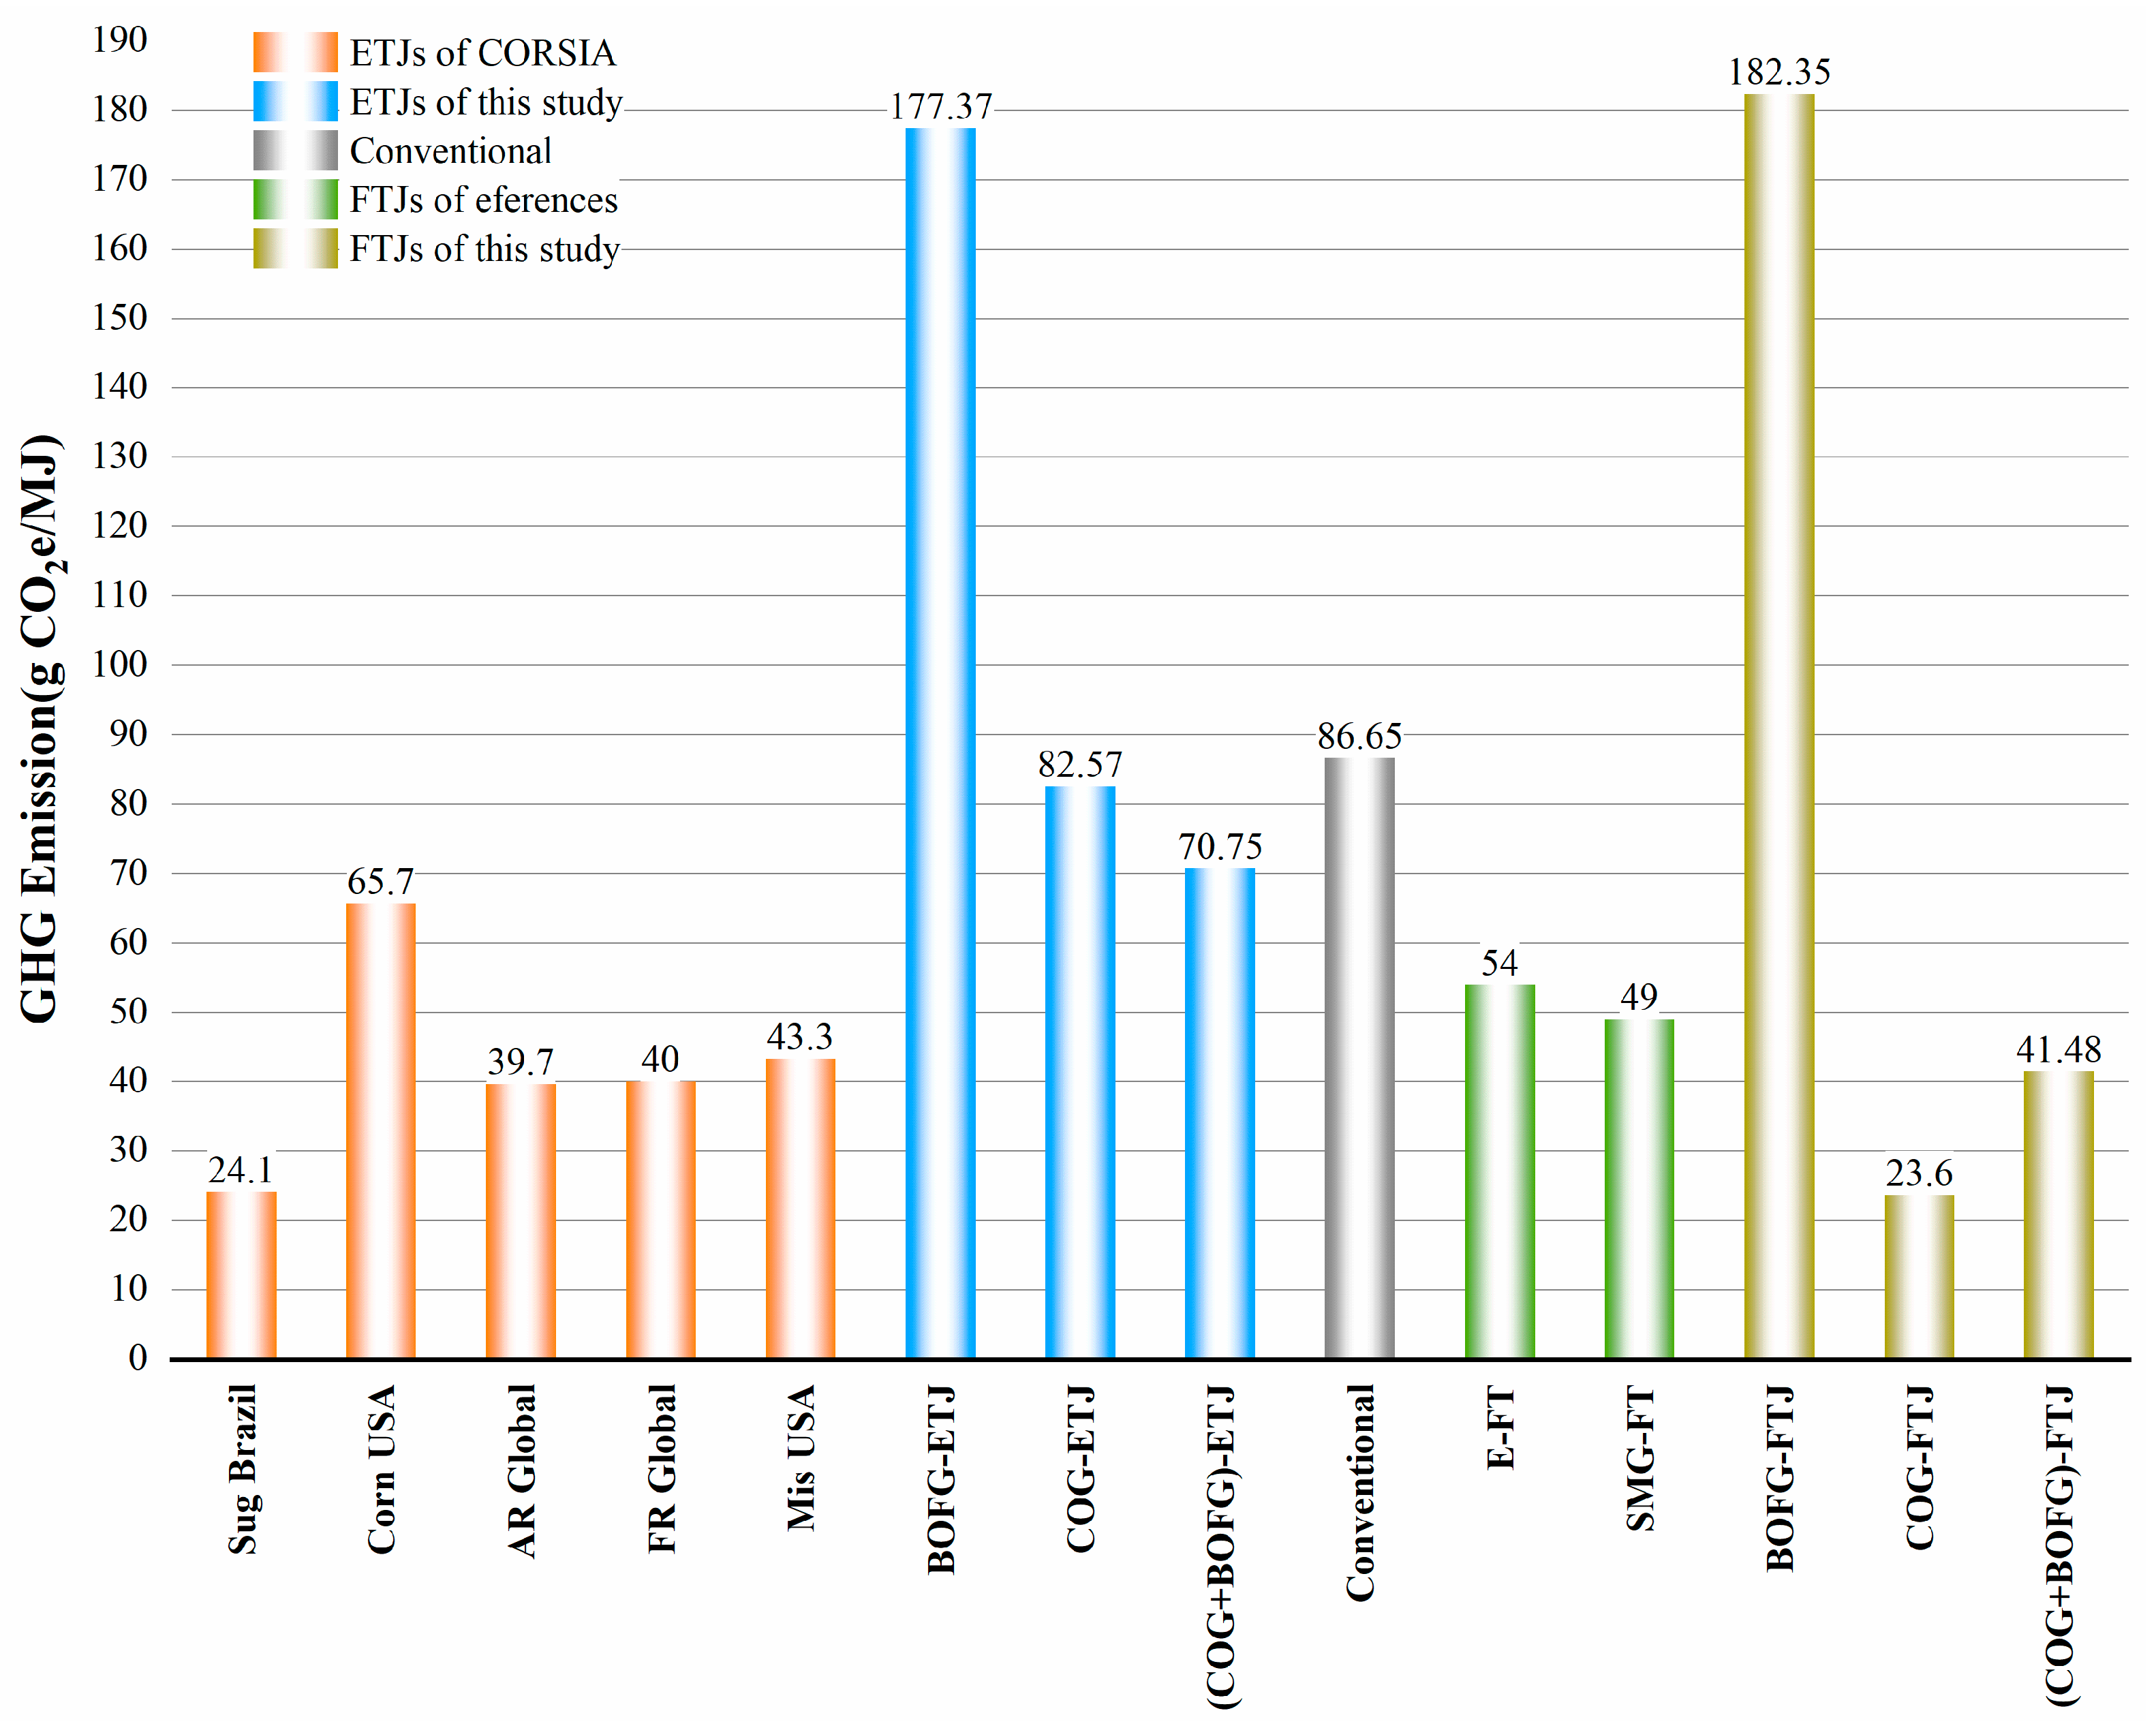
CORSIA stands as a globally recognized authoritative document in aviation carbon emissions reduction, having cataloged lifecycle carbon emissions from Sustainable Aviation Fuels (SAFs) calculated by researchers worldwide. Figure 12 delineates the ETJ pathways from CORSIA, assuming the same conditions as this study (i.e., distributed plants without considering land-use change), along with their full lifecycle GHG emission results. Additionally, it provides a comparison with the outcomes of this study and mentions other FT-based jet fuel production pathways from relevant literature.
According to Figure 12, the GHG emissions from the three ETJ pathways based on steel-industry off-gas in this study are higher than the results recommended by CORSIA. This suggests that, compared to ETJ pathways based on biomass, ETJ pathways based on waste gases do not exhibit a clear advantage.
One major reason why the carbon emissions of the ETJ pathway based on waste gases are not as favorable as those based on biomass lies in the assumption of carbon neutrality. This assumption posits that a portion of the carbon dioxide emitted during production forms a carbon cycle, offsetting the emissions with the carbon dioxide absorbed through biomass photosynthesis [22,89,92]. This includes carbon dioxide from biomass (including lignin and biogas) combustion, aviation fuel combustion, and carbon dioxide generated during the fermentation process [88,92]. The carbon neutrality assumption overlooks the LCA of raw materials and directly emits carbon dioxide in the process, leading to low calculated carbon emissions. The significant difference in carbon emissions between the ETJ pathways based on waste gases and those based on biomass is primarily due to the selection of different LCA calculation benchmarks. However, the carbon intensities of the COG/ETJ and (COG + BOFG)/ETJ pathways are 82.57 g CO2eq/MJ and 70.75 g CO2eq/MJ, respectively, representing reductions of 4.71% and 18.35% compared to the carbon emissions of traditional petroleum-based jet fuels (86.65 g CO2eq/MJ). This difference may be attributed to variations in raw materials, reaction processes, and differences in the energy supply structure in different geographical regions. More importantly, the ETJ pathways based on steel-industry off-gas may yield different GHG statistical results due to the fact that the raw material LCA allocation method differs from that of biomass.
Comparing our previous study with three FTJ pathways, it is evident that the COG/FTJ pathway outperforms the E-FT and SMG-FT pathways. Similarly, FTJ pathways using COG or COG + BOFG as feedstocks are significantly superior in GHG emissions reduction compared to traditional petroleum-based jet fuels, achieving emission reductions of 72.76% and 52.13%, respectively.
From a carbon emission reduction perspective, utilizing BOFG as a feedstock for jet fuel production may not be cost-effective, whereas COG or COG + BOFG appears more advantageous for jet fuel production. In the comparison between the ETJ and FTJ pathways, FTJ, being a more mature process, is more favorable for carbon emission reduction. Nevertheless, the ETJ pathway also demonstrates significant energy-saving potential.
3.5.2. Prospects
The production of jet fuel from steel-industry off-gas represents a viable strategy to generate cost-effective and low-emission aviation fuels, capable of supplanting conventional fuels without necessitating significant alterations to existing aircraft designs.
According to the LCA outcomes, the COG-FTJ pathway emerges as the most promising, with (COG + BOFG)-FTJ as the secondary option. Pathways based on COG-ETJ and (COG + BOFG)-ETJ exhibit higher carbon emissions due to the thermal energy consumed in the separation of ethanol and water. However, in the long term, once technological barriers to energy recovery are surmounted, both COG-based and COG + BOFG-based routes have the potential to effectively advance the goal of carbon neutrality.
Driven by the dual carbon targets and the pursuit of profits from high-value-added products, China has emerged as a global leader in the utilization of steel-industry off-gas. Currently, in the chemical utilization of COG in steel-industry off-gas, the majority is allocated to methanol production (2022 production volume: 7.26 million tons, approximately 9.1% of the total). On the other hand, BOFG sees limited utilization in chemical processes, with some being employed for the production of organic acids (e.g., 200,000 t/year formic acid and 50,000 t/year oxalic acid at Shiheng Special Steel (Taian, China)), and ethanol production (e.g., 100,000 t/year ethanol at Shougang LanzaTech (Beijing, China)). Additionally, there are instances of combined COG + BOFG utilization for the production of ethylene glycol, as seen at Jinnan Steel’s Woneng Chemical plant (Linfen, China).
With the increasing pressure on emission reduction in the Chinese aviation industry and the development of alternative aviation fuels, several enterprises have recently announced their entry into this field. In addition to Sinopec, there are collaborations such as the one between Honeywell and Donghua Energy, utilizing their Ecofining™ process to produce jet fuel through the Hydroprocessed Esters and Fatty Acids pathway. Another collaboration is with Dongming Petrochemical for the production of jet fuel through the ETJ pathway.
The integration of steel-industry off-gas with alternative aviation fuels will be a crucial component of China’s future development in alternative aviation fuels. The findings of this study can provide guidance to the Chinese government in formulating policies on alternative aviation fuels and assist enterprises in choosing technological pathways. This, in turn, can contribute to the early realization of carbon peak and carbon neutrality in the Chinese aviation industry.
4. Conclusions and Prospects
Currently, there is limited research on the production of aviation fuel from steel-industry off-gas. However, the urgent need for carbon reduction in both the steel industry and aviation sector has prompted researchers to seek collaborative solutions. This study innovatively utilizes steel-industry off-gas as a feedstock to produce SAF via ETJ and FTJ pathways. Employing the LCA methodology, it comprehensively analyzes the fossil fuel consumption and potential environmental impacts of different feedstock compositions and synthesis processes. Furthermore, it compares the carbon emissions with traditional fossil aviation fuels, providing compelling recommendations for the formulation of SAF production policies. Additionally, single-point sensitivity analyses of key parameters were conducted to explore carbon footprint mitigation strategies. Future researchers can utilize the sensitivity and uncertainty analyses conducted in this study to explore possibilities for process emissions reduction.
Amidst intricate market economic considerations, the establishment of a fully operational industrial-scale ETJ or FTJ facility remains unrealized. Nonetheless, in alignment with initiatives toward carbon peak and neutrality, the conversion of steel-industry off-gases into jet fuel presents a feasible, less carbon-intensive alternative to orthodox aviation fuel production methodologies. Processes predicated on steel-industry off-gas, particularly the COG/FTJ and (COG + BOFG)/FTJ pathways, may represent promising options. Indeed, the ETJ routes, serving as a secondary choice to bio-fermentation, also hold substantial prospects for energy conservation.
Finally, this study also has certain limitations. The authors employed Aspen Plus (V11) for chemical process modeling, which may not entirely reflect real-world production processes. From an industrial scaling-up and implementation perspective, this study can serve as a theoretical basis for pilot-scale trials to obtain more accurate fundamental data and enhance the accuracy of LCA analysis. Moreover, the LCA methodology used in this study has its limitations, as it only compared pathways based on fossil fuel consumption and carbon emissions.
Future research could explore the use of other advanced sustainability assessment tools, including exergy and its extensions (such as exergoeconomic and exergoenvironmental analyses). By conducting detailed modeling of processing units in terms of thermodynamics, kinetics, etc., these tools can enhance the accuracy and reliability of technical analyses while evaluating the economic and environmental impacts of process flows from the perspectives of sustainability, efficiency, and productivity [93].
Author Contributions
Conceptualization, L.G.; Methodology, L.G. and W.Y.; Software, W.Y.; Validation, L.G. and W.Y.; Formal analysis, X.W.; Resources, L.G. and X.W.; Data curation, L.G.; Writing—original draft, L.G. and X.W.; Writing—review and editing, L.G. and J.L.; Supervision, J.L.; Project administration, J.L.; Funding acquisition, J.L. All authors have read and agreed to the published version of the manuscript.
Funding
This work was supported by the Ministry of Industry and Information Technology of P.R.C. [MJ-2020-D-09].
Data Availability Statement
Data are contained within the article.
Conflicts of Interest
The authors declare no conflict of interest.
Abbreviations
| ETJ | Ethanol to jet fuel |
| FTJ | Fischer–Tropsch to jet fuel |
| FT | Fischer–Tropsch |
| BOFG | Basic oxygen furnace gas |
| COG | Coke oven gas |
| LCA | Life cycle assessment |
| SAF | Sustainable aviation fuel |
| WGS | Water-gas shift |
| MDR | Methane dry reforming |
| CORSIA | Carbon Offsetting and Reduction Scheme for International Aviation |
| ATJ | Alcohol-to-Jet |
| GHG | Greenhouse gas |
| VPSA | Vacuum pressure swing adsorption |
| PSA | Pressure swing adsorption |
| ASF | Anderson–Schulz–Flory |
| CHP | Combined Heat and Power |
| E-FT | Electrolysis Fischer–Tropsch |
| SMG-FT | Jet fuel produced from steel-industry off-gas |
References
- Zhang, J.; Shen, J.; Xu, L.; Zhang, Q. The CO2 emission reduction path towards carbon neutrality in the Chinese steel industry: A review. Environ. Impact Assess. Rev. 2023, 99, 107017. [Google Scholar] [CrossRef]
- Deng, L.; Adams, T.A., II. Comparison of steel manufacturing off-gas utilization methods via life cycle analysis. J. Clean. Prod. 2020, 277, 123568. [Google Scholar] [CrossRef]
- De Klerk, A.; Chauhan, G.; Halmenschlager, C.; Link, F.; Sanchez, N.M.; Gartley, B.; El-Sayed, H.E.M.; Sehdev, R.; Lehoux, R. Sustainable aviation fuel: Pathways to fully formulated synthetic jet fuel via Fischer-Tropsch synthesis. Energy Sci. Eng. 2023, 12, 394–409. [Google Scholar] [CrossRef]
- Zhang, X.; Lei, H.; Zhu, L.; Wu, J.; Chen, S. From lignocellulosic biomass to renewable cycloalkanes for jet fuels. Green Chem. 2015, 17, 4736–4747. [Google Scholar] [CrossRef]
- Doliente, S.S.; Narayan, A.; Tapia, J.F.D.; Samsatli, N.J.; Zhao, Y.; Samsatli, S. Bio-aviation Fuel: A Comprehensive Review and Analysis of the Supply Chain Components. Front. Energy Res. 2020, 8, 110. [Google Scholar] [CrossRef]
- Geleynse, S.; Brandt, K.; Garcia-Perez, M.; Wolcott, M.; Zhang, X. The Alcohol-to-Jet Conversion Pathway for Drop-In Biofuels: Techno-Economic Evaluation. ChemSusChem 2018, 11, 3728–3741. [Google Scholar] [CrossRef] [PubMed]
- Romero-Izquierdo, A.G.; Gomez-Castro, F.I.; Gutierrez-Antonio, C.; Hernandez, S.; Errico, M. Intensification of the alcohol-to-jet process to produce renewable aviation fuel. Chem. Eng. Process. Process Intensif. 2021, 160, 108270. [Google Scholar] [CrossRef]
- Tao, L.; Markham, J.N.; Haq, Z.; Biddy, M.J. Techno-economic analysis for upgrading the biomass-derived ethanol-to-jet blendstocks. Green Chem. 2017, 19, 1082–1101. [Google Scholar] [CrossRef]
- Muktham, R.; Bhargava, S.; Bankupalli, S.; Ball, A. A review on 1st and 2nd generation bioethanol production-recent progress. J. Sustain. Bioenergy Syst. 2016, 2016, 72–92. [Google Scholar] [CrossRef]
- IATA. 2015 Report on Alternative Fuels. Available online: https://www.iata.org/contentassets/462587e388e749eeb040df4dfdf02cb1/2015-report-alternative-fuels.pdf (accessed on 5 June 2023).
- Gholami, Z.; Tišler, Z.; Velvarská, R.; Kocík, J. Comn catalysts derived from hydrotalcite-like precursors for direct conversion of syngas to fuel range hydrocarbons. Catalysts 2020, 10, 813. [Google Scholar] [CrossRef]
- Wei, H.; Liu, W.; Chen, X.; Yang, Q.; Li, J.; Chen, H. Renewable bio-jet fuel production for aviation: A review. Fuel 2019, 254, 115599. [Google Scholar] [CrossRef]
- You, F.; Wang, B. Life cycle optimization of biomass-to-liquid supply chains with distributed–centralized processing networks. Ind. Eng. Chem. Res. 2011, 50, 10102–10127. [Google Scholar] [CrossRef]
- Stigsson, C.; Furusjö, E.; Börjesson, P. A model of an integrated hydrothermal liquefaction, gasification and Fischer-Tropsch synthesis process for converting lignocellulosic forest residues into hydrocarbons. Bioresour. Technol. 2022, 353, 126070. [Google Scholar] [CrossRef] [PubMed]
- Bermúdez, J.M.; Ferrera-Lorenzo, N.; Luque, S.; Arenillas, A.; Menéndez, J. New process for producing methanol from coke oven gas by means of CO2 reforming. Comparison with conventional process. Fuel Process. Technol. 2013, 115, 215–221. [Google Scholar] [CrossRef]
- Graciano, J.E.; Chachuat, B.; Alves, R.M. Conversion of CO2-rich natural gas to liquid transportation fuels via trireforming and Fischer–Tropsch synthesis: Model-based assessment. Ind. Eng. Chem. Res. 2018, 57, 9964–9976. [Google Scholar] [CrossRef]
- Handler, R.M.; Shonnard, D.R.; Griffing, E.M.; Lai, A.; Palou-Rivera, I. Life cycle assessments of ethanol production via gas fermentation: Anticipated greenhouse gas emissions for cellulosic and waste gas feedstocks. Ind. Eng. Chem. Res. 2016, 55, 3253–3261. [Google Scholar] [CrossRef]
- Harmon, L.; Holladay, J. Jet Fuel Derived from Steel Mill Waste Gasses. Res. Technol. Manag. 2020, 63, 46–51. [Google Scholar] [CrossRef]
- Collis, J.; Duch, K.; Schomäcker, R. Techno-economic assessment of jet fuel production using the Fischer-Tropsch process from steel mill gas. Front. Energy Res. 2022, 10, 1049229. [Google Scholar] [CrossRef]
- Prussi, M.; Lee, U.; Wang, M.; Malina, R.; Valin, H.; Taheripour, F.; Velarde, C.; Staples, M.D.; Lonza, L.; Hileman, J.I. CORSIA: The first internationally adopted approach to calculate life-cycle GHG emissions for aviation fuels. Renew. Sustain. Energy Rev. 2021, 150, 111398. [Google Scholar] [CrossRef]
- De Jong, S.; Antonissen, K.; Hoefnagels, R.; Lonza, L.; Wang, M.; Faaij, A.; Junginger, M. Life-cycle analysis of greenhouse gas emissions from renewable jet fuel production. Biotechnol. Biofuels 2017, 10, 64. [Google Scholar] [CrossRef]
- Capaz, R.S.; Posada, J.A.; Osseweijer, P.; Seabra, J.E. The carbon footprint of alternative jet fuels produced in Brazil: Exploring different approaches. Resour. Conserv. Recycl. 2021, 166, 105260. [Google Scholar] [CrossRef]
- Bressanin, J.M.; Klein, B.C.; Chagas, M.F.; Watanabe, M.D.B.; Sampaio, I.L.d.M.; Bonomi, A.; Morais, E.R.d.; Cavalett, O. Techno-economic and environmental assessment of biomass gasification and Fischer–Tropsch synthesis integrated to sugarcane biorefineries. Energies 2020, 13, 4576. [Google Scholar] [CrossRef]
- Escalante, E.S.R.; Ramos, L.S.; Coronado, C.J.R.; de Carvalho Júnior, J.A. Evaluation of the potential feedstock for biojet fuel production: Focus in the Brazilian context. Renew. Sustain. Energy Rev. 2022, 153, 111716. [Google Scholar] [CrossRef]
- Wang, X.; Guo, L.; Lv, J.; Li, M.; Huang, S.; Wang, Y.; Ma, X. Process design, modeling and life cycle analysis of energy consumption and GHG emission for jet fuel production from bioethanol in China. J. Clean. Prod. 2023, 389, 136027. [Google Scholar] [CrossRef]
- Voß, S.; Bube, S.; Kaltschmitt, M. Aviation fuel production pathways from lignocellulosic biomass via alcohol intermediates–A technical analysis. Fuel Commun. 2023, 17, 100093. [Google Scholar] [CrossRef]
- Sun, H.; Luo, Z.; Li, S.; Xue, S.; Zhou, Q.; Wei, T.; Du, L. Comparative life cycle assessment (LCA) of biofuel production via corn stover: Fermentation to ethanol, pyrolysis to bio-oil, and gasification to jet fuel. In Biomass Conversion and Biorefinery; Springer: Berlin, Germany, 2021; Volume 13, pp. 12809–12821. [Google Scholar] [CrossRef]
- Guimarães, H.R.; Bressanin, J.M.; Motta, I.L.; Chagas, M.F.; Klein, B.C.; Bonomi, A.; Maciel Filho, R.; Watanabe, M.D.B. Decentralization of sustainable aviation fuel production in Brazil through Biomass-to-Liquids routes: A techno-economic and environmental evaluation. Energy Convers. Manag. 2023, 276, 116547. [Google Scholar] [CrossRef]
- Rogachuk, B.E.; Okolie, J.A. Comparative assessment of pyrolysis and Gasification-Fischer Tropsch for sustainable aviation fuel production from waste tires. Energy Convers. Manag. 2024, 302, 118110. [Google Scholar] [CrossRef]
- ISO 14040/44; Environmental Management—Life Cycle Assessment—Requirements and Guidelines. ISO: Geneva, Switzerland, 2006. Available online: https://pqm-online.com/assets/files/lib/std/iso_14040-2006.pdf (accessed on 10 February 2023).
- De Oliveira Matias, J.C.; Devezas, T.C. Consumption dynamics of primary-energy sources: The century of alternative energies. Appl. Energy 2007, 84, 763–770. [Google Scholar] [CrossRef]
- Øvergaard, S. Issue Paper: Definition of Primary and Secondary Energy; Statistics Norway: Oslo, Norway, 2008; Available online: https://mdgs.un.org/unsd/envAccounting/londongroup/meeting13/LG13_12a.pdf (accessed on 1 March 2023).
- Wang, Y.M.; Duan, W.J.; Wang, Y.F.; Chen, Y.; Zhang, E.H.; Jia, Y.; Li, Q.G. A System for Comprehensive Utilization of Steel Industry Off-Gas to Produce Ethanol. CN211921378U. 13 November 2020. Available online: https://kns.cnki.net/kcms2/article/abstract?v=S5uBaE2M3Od0D8a7PD_8kSlI7juP0YCmOg8tyvwtjx33PMUX3VuDi8ujaFe4kizyUSK0q_W2GegEH9CrsFZ_rFz4h-7XyNQwJu_fioPJB4GxA6DSeaW6x8NtaR6LjHEtUXiW4AIIwUM=&uniplatform=NZKPT&language=CHS (accessed on 15 March 2023).
- Moreno Fernández-Villamil, J. Process and Plant Design of Ethanol Synthesis from Steel Industry Flue Gas; Universidad Polictecnica de Madrid: Madrid, Spain, 2017; Available online: https://oa.upm.es/49069/ (accessed on 25 December 2022).
- Gaddy, J.L.; Arora, D.K.; Ko, C.-W.; Phillips, J.R.; Basu, R.; Wikstrom, C.V.; Clausen, E.C. Methods for Increasing the Production of Ethanol from Microbial Fermentation; Bioengineering Resources, Inc.: Fayetteville, NC, USA, 2007. Available online: https://www.osti.gov/biblio/941118 (accessed on 2 January 2023).
- De Medeiros, E.M.; Posada, J.A.; Noorman, H.; Osseweijer, P.; Maciel Filho, R. Hydrous bioethanol production from sugarcane bagasse via energy self-sufficient gasification-fermentation hybrid route: Simulation and financial analysis. J. Clean. Prod. 2017, 168, 1625–1635. [Google Scholar] [CrossRef]
- Morales, J.Y.R.; Mendoza, J.A.B.; Torres, G.O.; Vázquez, F.d.J.S.; Rojas, A.C.; Vidal, A.F.P. Fault-tolerant control implemented to Hammerstein–Wiener model: Application to bio-ethanol dehydration. Fuel 2022, 308, 121836. [Google Scholar] [CrossRef]
- Hanchate, N.; Kulshreshtha, P.; Mathpati, C. Optimization, scale-up and cost estimation of dehydration of ethanol using temperature swing adsorption. J. Environ. Chem. Eng. 2019, 7, 102938. [Google Scholar] [CrossRef]
- Morales, J.Y.R.; López, G.L.; Martínez, V.M.A.; Vázquez, F.d.J.S.; Mendoza, J.A.B.; García, M.M. Parametric study and control of a pressure swing adsorption process to separate the water-ethanol mixture under disturbances. Sep. Purif. Technol. 2020, 236, 116214. [Google Scholar] [CrossRef]
- Petropoulou, E.G.; Carollo, C.; Pappa, G.D.; Caputo, G.; Voutsas, E.C. Sensitivity analysis and process optimization of a natural gas dehydration unit using triethylene glycol. J. Nat. Gas Sci. Eng. 2019, 71, 102982. [Google Scholar] [CrossRef]
- Britovsek, G.J.; Malinowski, R.; McGuinness, D.S.; Nobbs, J.D.; Tomov, A.K.; Wadsley, A.W.; Young, C.T. Ethylene oligomerization beyond Schulz–Flory distributions. ACS Catal. 2015, 5, 6922–6925. [Google Scholar] [CrossRef]
- Restrepo-Flórez, J.M.; Maravelias, C.T. Advanced fuels from ethanol–a superstructure optimization approach. Energy Environ. Sci. 2021, 14, 493–506. [Google Scholar] [CrossRef]
- Speight, J. Coal gasification processes for synthetic liquid fuel production. In Gasification for Synthetic Fuel Production; Elsevier: Amsterdam, The Netherlands, 2015; pp. 201–220. [Google Scholar] [CrossRef]
- Gholami, Z.; Asmawati Mohd Zabidi, N.; Gholami, F.; Ayodele, O.B.; Vakili, M. The influence of catalyst factors for sustainable production of hydrocarbons via Fischer-Tropsch synthesis. Rev. Chem. Eng. 2017, 33, 337–358. [Google Scholar] [CrossRef]
- Jia, L.; Jia, L.; Li, D.; Hou, B.; Wang, J.; Sun, Y. Silylated Co/SBA-15 catalysts for Fischer–Tropsch synthesis. J. Solid State Chem. 2011, 184, 488–493. [Google Scholar] [CrossRef]
- Kang, S.-H.; Bae, J.W.; Cheon, J.-Y.; Lee, Y.-J.; Ha, K.-S.; Jun, K.-W.; Lee, D.-H.; Kim, B.-W. Catalytic performance on iron-based Fischer–Tropsch catalyst in fixed-bed and bubbling fluidized-bed reactor. Appl. Catal. B Environ. 2011, 103, 169–180. [Google Scholar] [CrossRef]
- Van de Loosdrecht, J.; Botes, F.G.; Ciobica, I.M.; Ferreira, A.C.; Gibson, P.; Moodley, D.J.; Saib, A.M.; Visagie, J.L.; Weststrate, C.J.; Niemantsverdriet, J.W. Fischer-Tropsch Synthesis: Catalysts and Chemistry. Comprehensive Inorganic Chemistry. In Comprehensive Inorganic Chemistry II: From Elements to Applications; Elsevier: Amsterdam, The Netherlands, 2013; pp. 525–557. [Google Scholar] [CrossRef]
- Ma, W.; Jacobs, G.; Sparks, D.E.; Todic, B.; Bukur, D.B.; Davis, B.H. Quantitative comparison of iron and cobalt based catalysts for the Fischer-Tropsch synthesis under clean and poisoning conditions. Catal. Today 2020, 343, 125–136. [Google Scholar] [CrossRef]
- Marchese, M.; Giglio, E.; Santarelli, M.; Lanzini, A. Energy performance of Power-to-Liquid applications integrating biogas upgrading, reverse water gas shift, solid oxide electrolysis and Fischer-Tropsch technologies. Energy Convers. Manag. X 2020, 6, 100041. [Google Scholar] [CrossRef]
- Davis, B.H.; Occelli, M.L. Fischer-Tropsch Synthesis, Catalysts and Catalysis; Elsevier: Amsterdam, The Netherlands, 2006; Available online: https://shop.elsevier.com/books/fischer-tropsch-synthesis-catalysts-and-catalysis/davis/978-0-444-52221-4 (accessed on 13 January 2023).
- Jahangiri, H.; Bennett, J.; Mahjoubi, P.; Wilson, K.; Gu, S. A review of advanced catalyst development for Fischer–Tropsch synthesis of hydrocarbons from biomass derived syn-gas. Catal. Sci. Technol. 2014, 4, 2210–2229. [Google Scholar] [CrossRef]
- Perego, C. Development of a Fischer-Tropsch catalyst: From laboratory to commercial scale demonstration. Rend. Lincei 2007, 18, 305–317. [Google Scholar] [CrossRef]
- Markowitsch, C.; Lehner, M.; Maly, M. Evaluation of process structures and reactor technologies of an integrated power-to-liquid plant at a cement factory. J. CO2 Util. 2023, 70, 102449. [Google Scholar] [CrossRef]
- Li, J.; Yang, G.; Yoneyama, Y.; Vitidsant, T.; Tsubaki, N. Jet fuel synthesis via Fischer–Tropsch synthesis with varied 1-olefins as additives using Co/ZrO2–SiO2 bimodal catalyst. Fuel 2016, 171, 159–166. [Google Scholar] [CrossRef]
- Zhou, W.; Cheng, K.; Kang, J.; Zhou, C.; Subramanian, V.; Zhang, Q.; Wang, Y. New horizon in C1 chemistry: Breaking the selectivity limitation in transformation of syngas and hydrogenation of CO2 into hydrocarbon chemicals and fuels. Chem. Soc. Rev. 2019, 48, 3193–3228. [Google Scholar] [CrossRef] [PubMed]
- Spath, P.L.; Dayton, D.C. Preliminary Screening—Technical and Economic Assessment of Synthesis Gas to Fuels and Chemicals with Emphasis on the Potential for Biomass-Derived Syngas; National Renewable Energy Lab: Golden, CO, USA, 2003. [Google Scholar] [CrossRef]
- König, D.H.; Baucks, N.; Dietrich, R.-U.; Wörner, A. Simulation and evaluation of a process concept for the generation of synthetic fuel from CO2 and H2. Energy 2015, 91, 833–841. [Google Scholar] [CrossRef]
- Adelung, S.; Maier, S.; Dietrich, R.-U. Impact of the reverse water-gas shift operating conditions on the Power-to-Liquid process efficiency. Sustain. Energy Technol. Assess. 2021, 43, 100897. [Google Scholar] [CrossRef]
- Markowitsch, C.; Lehner, M.; Kitzweger, J.; Haider, W.; Ivanovici, S.; Unfried, M.; Maly, M. C2PAT-Carbon to Product Austria. In Proceedings of the ENINNOV 2022: 17. Symposium Energieinnovation-Future of Energy-Innovationen für Eine Klimaneutrale Zukunft, Online, 16–18 February 2022; pp. 284–285. Available online: https://www.nefi.at/de/news-detail/eninnov2022-17-symposium-energieinnovation (accessed on 26 July 2023).
- Ostadi, M.; Rytter, E.; Hillestad, M. Evaluation of kinetic models for Fischer–Tropsch cobalt catalysts in a plug flow reactor. Chem. Eng. Res. Des. 2016, 114, 236–246. [Google Scholar] [CrossRef]
- Wang, D.; Gu, Y.; Chen, Q.; Tang, Z. Direct conversion of syngas to alpha olefins via Fischer–Tropsch synthesis: Process development and comparative techno-economic-environmental analysis. Energy 2023, 263, 125991. [Google Scholar] [CrossRef]
- Li, M.; Zhao, W.; Xu, Y.; Zhao, Y.; Yang, K.; Tao, W.; Xiao, J. Comprehensive Life Cycle Evaluation of Jet Fuel from Biomass Gasification and Fischer–Tropsch Synthesis Based on Environmental and Economic Performances. Ind. Eng. Chem. Res. 2019, 58, 19179–19188. [Google Scholar] [CrossRef]
- Bouchy, C.; Hastoy, G.; Guillon, E.; Martens, J. Fischer-Tropsch waxes upgrading via hydrocracking and selective hydroisomerization. Oil Gas Sci. Technol. Rev. De L’ifp 2009, 64, 91–112. [Google Scholar] [CrossRef]
- Regali, F. Hydroconversion of Model Fischer-Tropsch Wax over Noble Metal/Silica-Alumina Catalysts; KTH Royal Institute of Technology: Stockholm, Sweden, 2013; Available online: https://www.diva-portal.org/smash/record.jsf?pid=diva2%3A653933&dswid=2784 (accessed on 28 July 2022).
- Sun, C.; Zhan, T.; Pfeifer, P.; Dittmeyer, R. Influence of Fischer-Tropsch synthesis (FTS) and hydrocracking (HC) conditions on the product distribution of an integrated FTS-HC process. Chem. Eng. J. 2017, 310, 272–281. [Google Scholar] [CrossRef]
- Pellegrini, L.; Locatelli, S.; Rasella, S.; Bonomi, S.; Calemma, V. Modeling of Fischer–Tropsch products hydrocracking. Chem. Eng. Sci. 2004, 59, 4781–4787. [Google Scholar] [CrossRef]
- Hense, J.; Bachmann, M.; Polte, L.; von der Aßen, N.; Jupke, A. Integrated Process Design and Life Cycle Assessment of Carbon Monoxide Provision from Basic Oxygen Furnace Gas. Chem. Ing. Tech. 2022, 94, 1524–1535. [Google Scholar] [CrossRef]
- Belloni, A. Industrial Gases Processing; John Wiley & Sons: Hoboken, NJ, USA, 2008. [Google Scholar] [CrossRef]
- Iulianelli, A.; Pirola, C.; Comazzi, A.; Galli, F.; Manenti, F.; Basile, A. Water gas shift membrane reactors. In Membrane Reactors for Energy Applications and Basic Chemical Production; Elsevier: Amsterdam, The Netherlands, 2015; pp. 3–29. [Google Scholar] [CrossRef]
- Pal, D.B.; Chand, R.; Upadhyay, S.; Mishra, P. Performance of water gas shift reaction catalysts: A review. Renew. Sustain. Energy Rev. 2018, 93, 549–565. [Google Scholar] [CrossRef]
- Kušar, H.; Hočevar, S.; Levec, J. Kinetics of the water–gas shift reaction over nanostructured copper–ceria catalysts. Appl. Catal. B Environ. 2006, 63, 194–200. [Google Scholar] [CrossRef]
- Wang, J.; Chen, X.; Du, T.; Liu, L.; Webley, P.A.; Li, G.K. Hydrogen production from low pressure coke oven gas by vacuum pressure swing adsorption. Chem. Eng. J. 2023, 472, 144920. [Google Scholar] [CrossRef]
- Brandão, M.; Heijungs, R.; Cowie, A.R. On quantifying sources of uncertainty in the carbon footprint of biofuels: Crop/feedstock, LCA modelling approach, land-use change, and GHG metrics. Biofuel Res. J. 2022, 9, 1608–1616. [Google Scholar] [CrossRef]
- Weidema, B.P. The integration of economic and social aspects in life cycle impact assessment. Int. J. Life Cycle Assess. 2006, 11, 89–96. [Google Scholar] [CrossRef]
- Cabeza, L.F.; Rincón, L.; Vilariño, V.; Pérez, G.; Castell, A. Life cycle assessment (LCA) and life cycle energy analysis (LCEA) of buildings and the building sector: A review. Renew. Sustain. Energy Rev. 2014, 29, 394–416. [Google Scholar] [CrossRef]
- Cudjoe, D.; Han, M.S.; Nandiwardhana, A.P. Electricity generation using biogas from organic fraction of municipal solid waste generated in provinces of China: Techno-economic and environmental impact analysis. Fuel Process. Technol. 2020, 203, 106381. [Google Scholar] [CrossRef]
- Schrijvers, D.L.; Loubet, P.; Sonnemann, G. Critical review of guidelines against a systematic framework with regard to consistency on allocation procedures for recycling in LCA. Int. J. Life Cycle Assess. 2016, 21, 994–1008. [Google Scholar] [CrossRef]
- Ren, L.; Zhou, S.; Ou, X. Life-cycle energy consumption and greenhouse-gas emissions of hydrogen supply chains for fuel-cell vehicles in China. Energy 2020, 209, 118482. [Google Scholar] [CrossRef]
- Jun, L.; Peiwang, Z.; Hui, W.; Xiaolong, Q. Flexible Modification Technology and Application Prospect of Thermal Power Unit Based on High Temperature Molten Salt Heat Storage. South Energy Constr. 2021, 8, 63–70. [Google Scholar] [CrossRef]
- Luo, Y.; Zhang, L.; Hang, B.; Gong, C. Simulation of the Performance of a Centrifugal Chiller. J. Refrig. 2023, 44, 74–80. [Google Scholar] [CrossRef]
- Zhang, C.; Wang, H.; Liang, J.; Zhang, Z. Performance research on R410a two-stage refrigeration cycle. Cryog. Supercond. 2022, 50, 52–57. [Google Scholar] [CrossRef]
- Shen, B.J.; Zhang, Y.B.; Guan, P. Analysis of Operating Condition and Control Plan about Ethylene Glycol Refrigeration System. J. Refrig. Technol. 2016, 1, 50–53. Available online: https://kns.cnki.net/kcms2/article/abstract?v=S5uBaE2M3OfnV2lxhiWVr8YH7JEH5n9_54tzE6oZ3KiEda6zrbpTYSVewnOM0JPRIig3X6WJgNm7fLCtXVliRE-VzzdA4dTXVkYFALwU3GyBl2oFvGdYXdNhHZciH9GDsKqo9EPuDQ0=&uniplatform=NZKPT&language=CHS (accessed on 10 February 2023).
- Bounaceur, R.; Lape, N.; Roizard, D.; Vallieres, C.; Favre, E. Membrane processes for post-combustion carbon dioxide capture: A parametric study. Energy 2006, 31, 2556–2570. [Google Scholar] [CrossRef]
- Zhao, L.; Ou, X.; Chang, S. Life-cycle greenhouse gas emission and energy use of bioethanol produced from corn stover in China: Current perspectives and future prospectives. Energy 2016, 115, 303–313. [Google Scholar] [CrossRef]
- Jiao, J.; Li, J.; Bai, Y. Uncertainty analysis in the life cycle assessment of cassava ethanol in China. J. Clean. Prod. 2019, 206, 438–451. [Google Scholar] [CrossRef]
- Yu, S.; Tao, J. Economic, energy and environmental evaluations of biomass-based fuel ethanol projects based on life cycle assessment and simulation. Appl. Energy 2009, 86, S178–S188. [Google Scholar] [CrossRef]
- Tu, Q.; McDonnell, B.E. Monte Carlo analysis of life cycle energy consumption and greenhouse gas (GHG) emission for biodiesel production from trap grease. J. Clean. Prod. 2016, 112, 2674–2683. [Google Scholar] [CrossRef]
- Lyu, H.; Zhang, J.; Zhai, Z.; Feng, Y.; Geng, Z. Life cycle assessment for bioethanol production from whole plant cassava by integrated process. J. Clean. Prod. 2020, 269, 121902. [Google Scholar] [CrossRef]
- Liu, H.; Zhang, C.; Tian, H.; Li, L.; Wang, X.; Qiu, T. Environmental and techno-economic analyses of bio-jet fuel produced from jatropha and castor oilseeds in China. Int. J. Life Cycle Assess. 2021, 26, 1071–1084. [Google Scholar] [CrossRef]
- Fagerström, A.; Grahn, D.; Lundberg, S.; Poulikidou, S.; Rydberg, T.; Lewrén, A.; Martin, M.; Anderson, S.; Hansson, J.; Hjort, A. Large Scale Bio Electro Jet Fuel Production Integration at CHP-Plant in Östersund, Sweden; DIVA: Brixe, Italy, 2021; Available online: https://www.diva-portal.org/smash/record.jsf?pid=diva2%3A1552218&dswid=-1895 (accessed on 10 February 2024).
- Lai, Y.Y.; Karakaya, E.; Björklund, A. Employing a socio-technical system Approach in prospective life cycle assessment: A case of large-scale Swedish sustainable aviation fuels. Front. Sustain. 2022, 3, 912676. [Google Scholar] [CrossRef]
- Zhang, J.; Yoo, E.; Davison, B.H.; Liu, D.; Schaidle, J.A.; Tao, L.; Li, Z. Towards cost-competitive middle distillate fuels from ethanol within a market-flexible biorefinery concept. Green Chem. 2021, 23, 9534–9548. [Google Scholar] [CrossRef]
- Aghbashlo, M.; Hosseinzadeh-Bandbafha, H.; Shahbeik, H.; Tabatabaei, M. The role of sustainability assessment tools in realizing bioenergy and bioproduct systems. Biofuel Res. J. 2022, 9, 1697–1706. [Google Scholar] [CrossRef]
Figure 1.
Life cycle system boundaries for ETJ and FTJ processes. ETJ: Ethanol to jet fuel; FTJ: Fischer–Tropsch to jet fuel; BOFG: Basic oxygen furnace gas; COG: Coke oven gas; PSA: Pressure swing adsorption.
Figure 1.
Life cycle system boundaries for ETJ and FTJ processes. ETJ: Ethanol to jet fuel; FTJ: Fischer–Tropsch to jet fuel; BOFG: Basic oxygen furnace gas; COG: Coke oven gas; PSA: Pressure swing adsorption.

Figure 2.
The flowsheet of ethanol production from BOFG simulation. BOFG: Basic oxygen furnace gas.
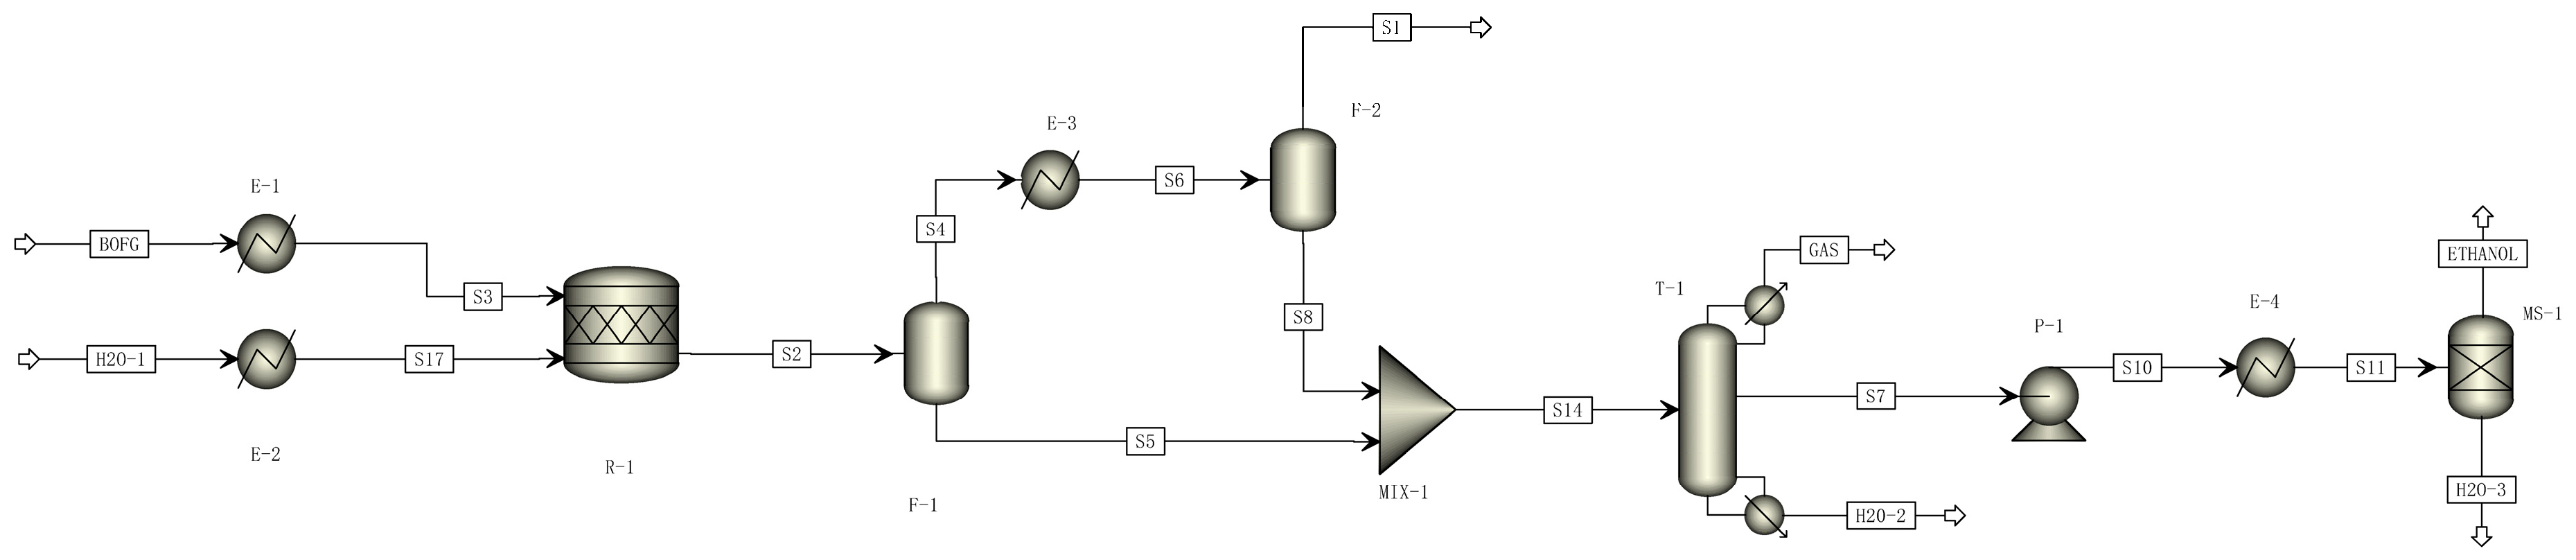
Figure 3.
The flowsheet of ethanol production from COG fermentation. COG: Coke oven gas.
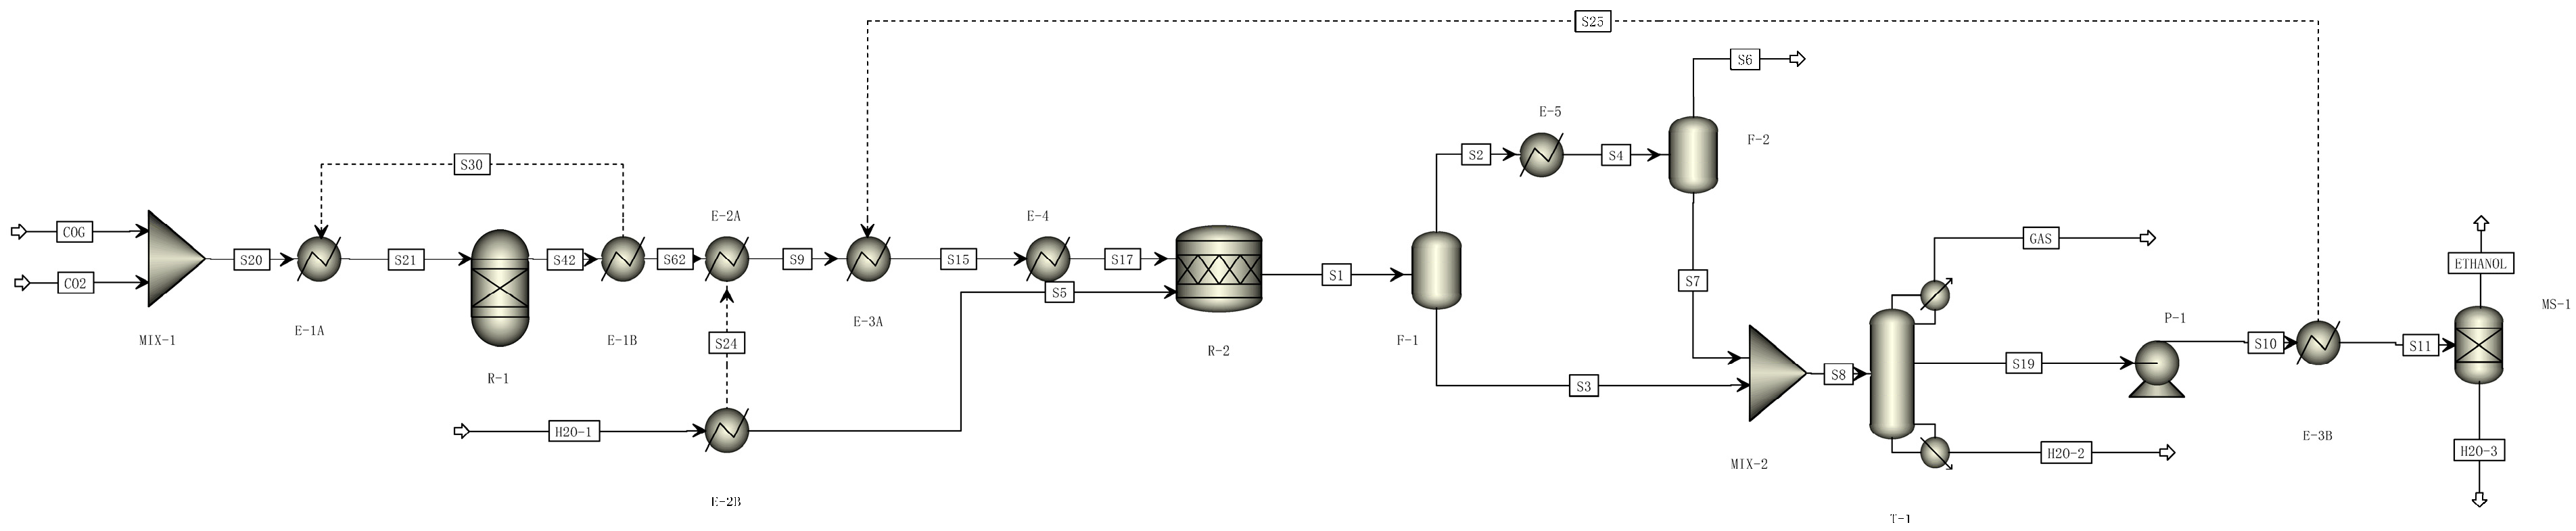
Figure 4.
The flowsheet of ethanol production from COG + BOFG fermentation. ETJ: Ethanol to jet fuel; FTJ: Fischer–Tropsch to jet fuel.
Figure 4.
The flowsheet of ethanol production from COG + BOFG fermentation. ETJ: Ethanol to jet fuel; FTJ: Fischer–Tropsch to jet fuel.
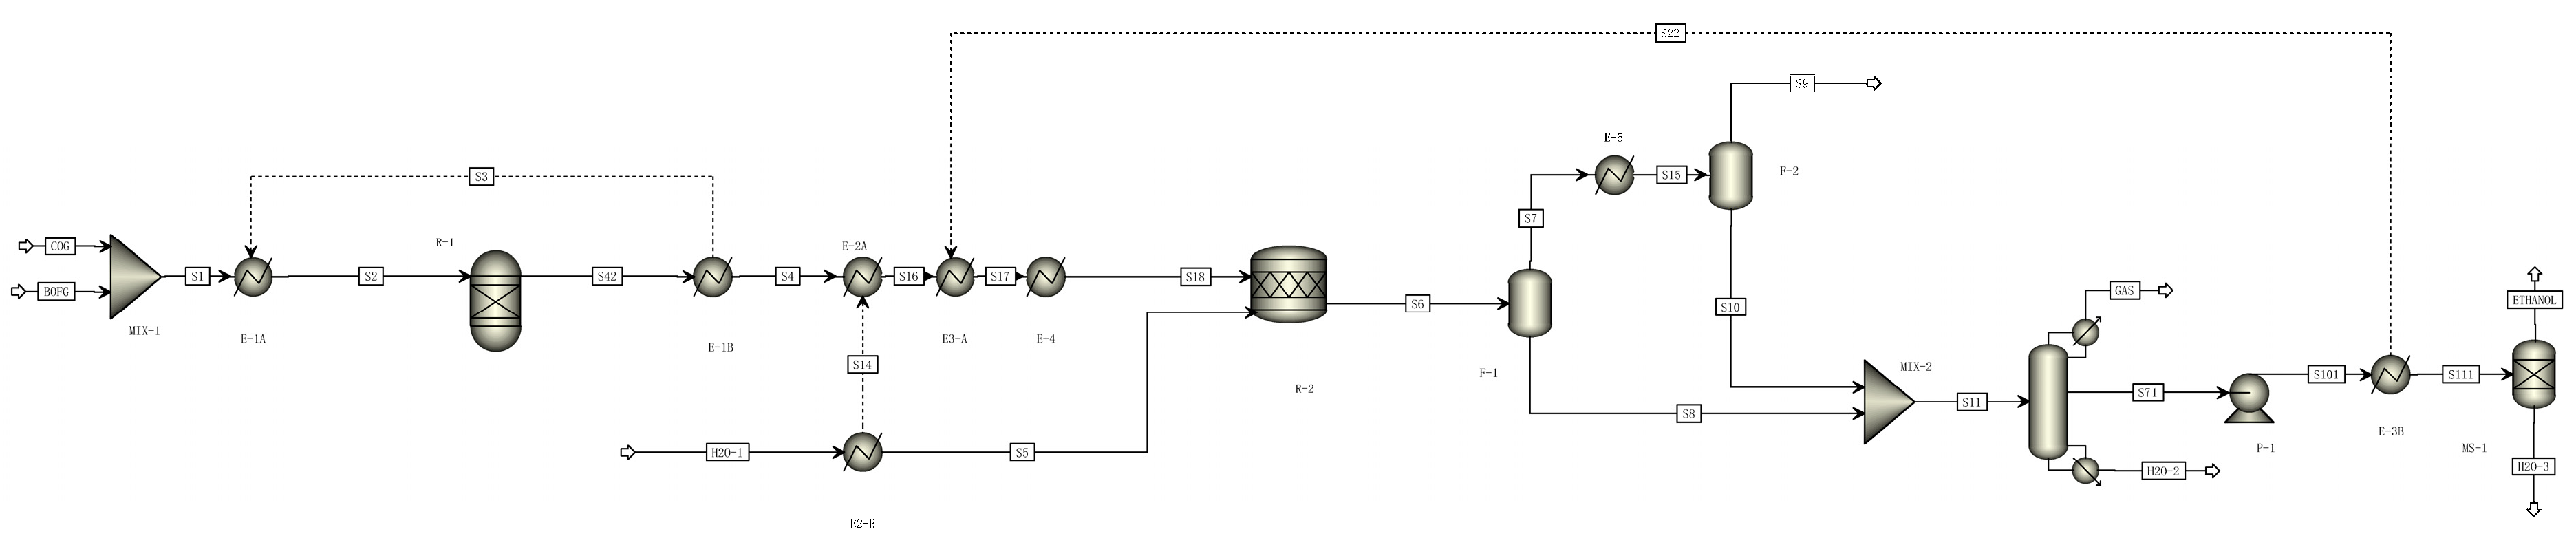
Figure 5.
The flowsheet of jet fuel production process from ethanol.
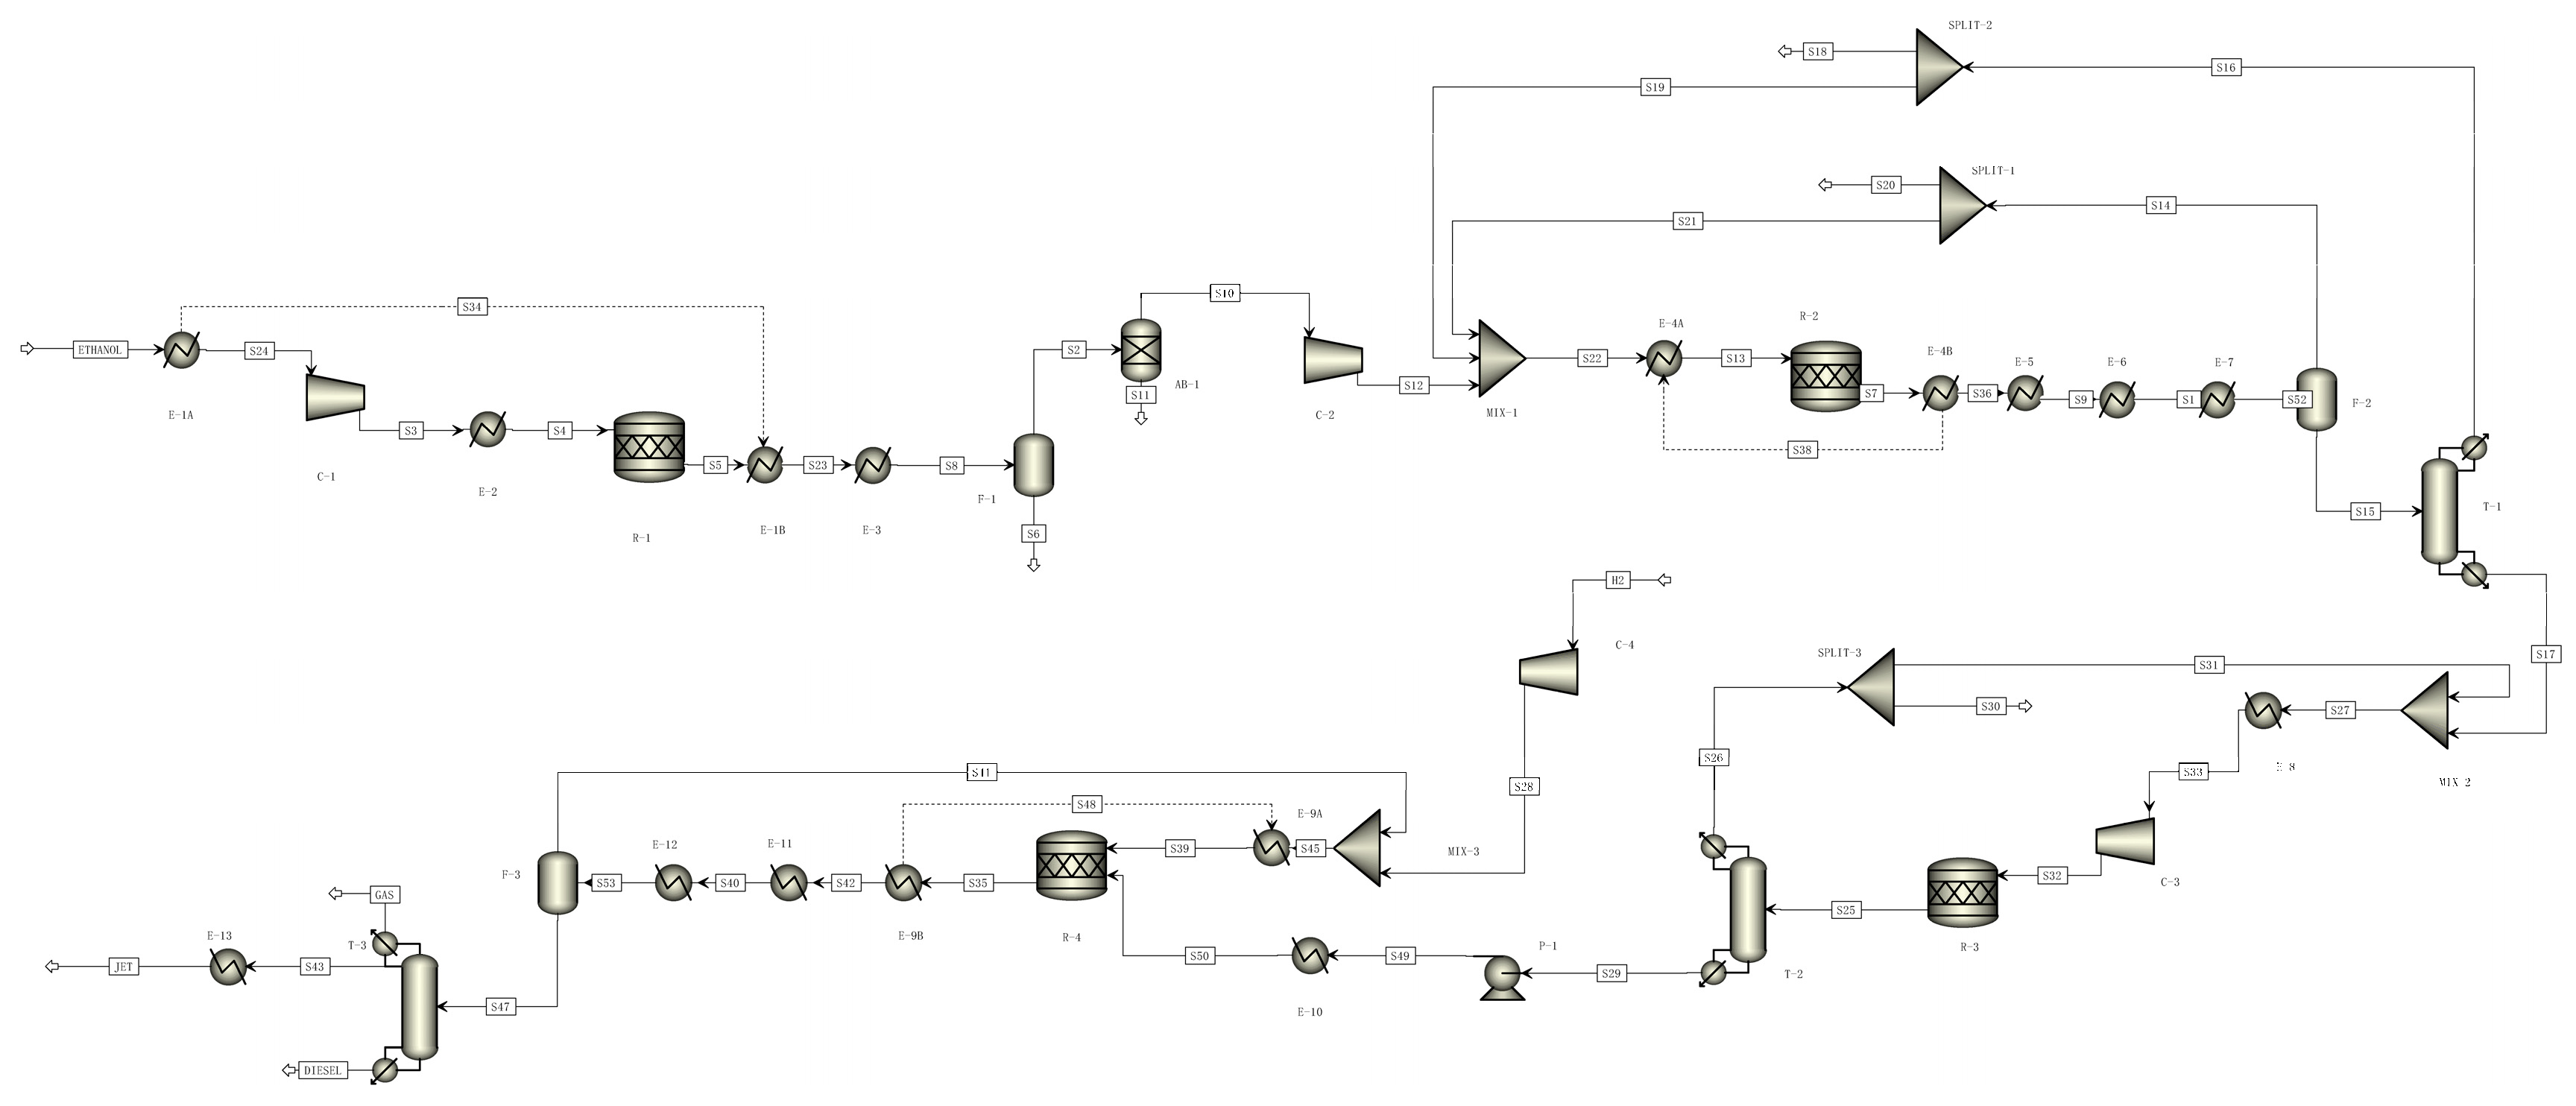
Figure 6.
The flowsheet of jet fuel production from BOFG via FT synthesis. BOFG: Basic oxygen furnace gas; FT: Fischer–Tropsch.
Figure 6.
The flowsheet of jet fuel production from BOFG via FT synthesis. BOFG: Basic oxygen furnace gas; FT: Fischer–Tropsch.

Figure 7.
The flowsheet of jet fuel production from COG via FT synthesis. COG: Coke oven gas; FT: Fischer–Tropsch.
Figure 7.
The flowsheet of jet fuel production from COG via FT synthesis. COG: Coke oven gas; FT: Fischer–Tropsch.

Figure 8.
The flowsheet of jet fuel production from COG + BOFG via FT synthesis. BOFG: Basic oxygen furnace gas; COG: Coke oven gas; FT: Fischer–Tropsch.
Figure 8.
The flowsheet of jet fuel production from COG + BOFG via FT synthesis. BOFG: Basic oxygen furnace gas; COG: Coke oven gas; FT: Fischer–Tropsch.
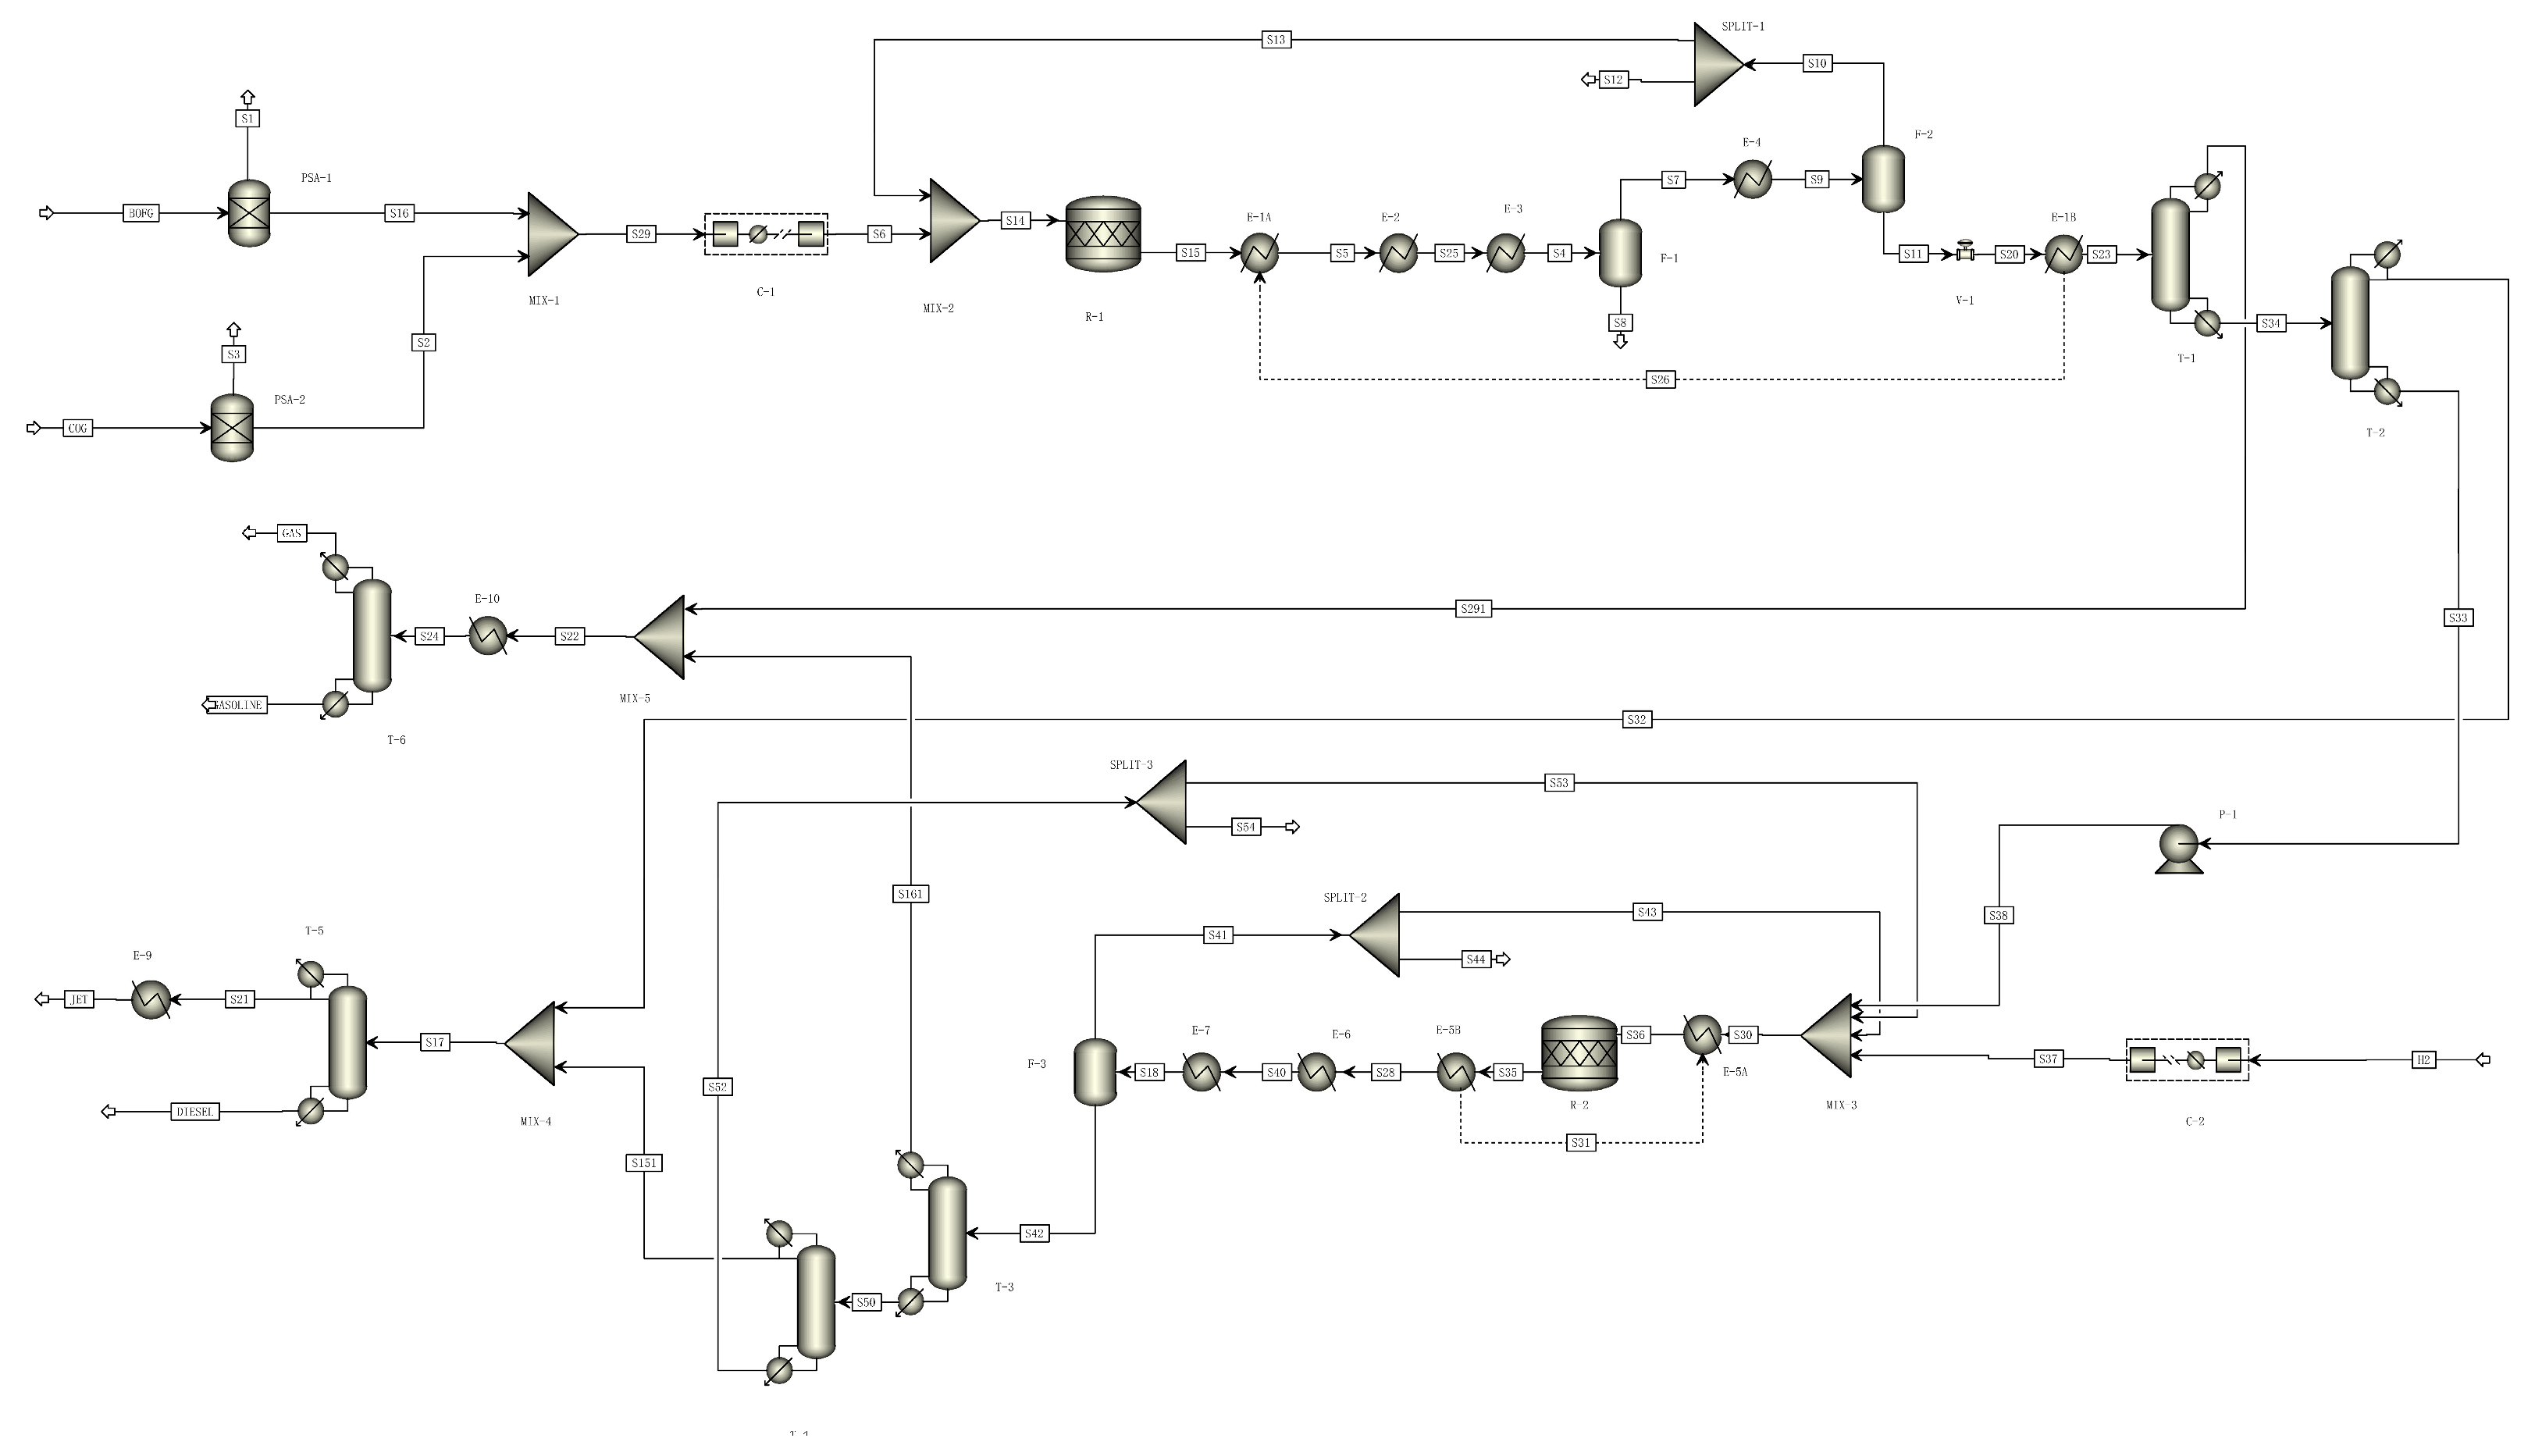
Figure 9.
Life cycle fossil fuel consumption of ETJ and FTJ processes.

Figure 10.
Life cycle GHG emissions of ETJ and FTJ processes. ETJ: Ethanol to jet fuel; FTJ: Fischer–Tropsch to jet fuel; BOFG: Basic oxygen furnace gas; COG: Coke oven gas; GHG: Greenhouse gas.
Figure 10.
Life cycle GHG emissions of ETJ and FTJ processes. ETJ: Ethanol to jet fuel; FTJ: Fischer–Tropsch to jet fuel; BOFG: Basic oxygen furnace gas; COG: Coke oven gas; GHG: Greenhouse gas.

Figure 11.
Sensitivity analysis on the key parameters of the ETJ and FTJ pathways. (a) BOFG/ETJ; (b) BOFG/FTJ; (c) COG/ETJ; (d) COG/FTJ; (e) (BOFG + COG)/ETJ; (f) (BOFG + COG)/FTJ. ETJ: Ethanol to jet fuel; FTJ: Fischer–Tropsch to jet fuel; BOFG: Basic oxygen furnace gas; COG: Coke oven gas. The blue bars represent the effects of a 10% reduction, while the orange bars correspond to the impacts of a 10% augmentation in the parameter’s value.

Figure 12.
Comparing the greenhouse gas emissions throughout the entire life cycle of ETJ and FTJ pathways in this study with CORSIA and other research [19,25,89,90,91]. Sug: Sugarcane; AR: Agricultural Residue; FR: Forestry Residue; Mis: Miscanthus; E-FT: Electrolysis Fischer–Tropsch; SMG-FT: Jet fuel produced from steel-industry off-gas; ETJ: Ethanol to jet fuel; FTJ: Fischer–Tropsch to jet fuel; BOFG: Basic oxygen furnace gas; COG: Coke oven gas; GHG: Greenhouse gas.

Table 2.
Component of BOFG and COG [33]. BOFG: Basic oxygen furnace gas; COG: Coke oven gas.
Table 2.
Component of BOFG and COG [33]. BOFG: Basic oxygen furnace gas; COG: Coke oven gas.
| Component (mol%) | BOFG | COG |
|---|---|---|
| H2 | 1 | 56.7 |
| CO | 55 | 7 |
| CO2 | 18 | 3 |
| CH4 | - | 26 |
| N2 | 26 | 7.3 |
Table 3.
Fuel mix and key parameters of transportation modes [84].
Table 3.
Fuel mix and key parameters of transportation modes [84].
| Transportation Modes | Fuel Mix | Fuel Economy (km/L) |
|---|---|---|
| Heavy Heavy-Duty Truck | Diesel (72%), Gasoline (28%) | 1.2 |
| Medium Heavy-Duty Truck | Diesel (72%), Gasoline (28%) | 3.27 |
Table 4.
The input and output of the jet fuel production process. ETJ: Ethanol to jet fuel; FTJ: Fischer–Tropsch to jet fuel; BOFG: Basic oxygen furnace gas; COG: Coke oven gas.
Table 4.
The input and output of the jet fuel production process. ETJ: Ethanol to jet fuel; FTJ: Fischer–Tropsch to jet fuel; BOFG: Basic oxygen furnace gas; COG: Coke oven gas.
| Description of Data | Unit | BOFG/ETJ | COG/ETJ | (COG + BOFG)/ETJ | BOFG/FTJ | COG/FTJ | (COG + BOFG)/FTJ |
|---|---|---|---|---|---|---|---|
| Input | |||||||
| BOFG | g | 464.5 | 0 | 112.2 | 611.9 | 0 | 201.9 |
| COG | g | 0 | 65.2 | 78.43 | 0 | 74.94 | 141.1 |
| H2O | g | 72.75 | 0 | 7.6 | 129 | 0 | 0 |
| CO2 | g | 0 | 84.5 | 0 | 0 | 56.83 | 0 |
| Electricity | KJ | 164.3 | 128.4 | 94.33 | 352.6 | 313.4 | 303 |
| Coal | KJ | 746.6 | 560.4 | 504.5 | 2078 | 106.8 | 106.8 |
| Natural gas | KJ | 663.6 | 1130 | 904.4 | 1848 | 687.5 | 94.94 |
| Output | |||||||
| Jet fuel | MJ | 1 | 1 | 1 | 1 | 1 | 1 |
| Gasoline yield | KJ | 0 | 0 | 0 | 161 | 158.8 | 160 |
| Diesel yield | KJ | 398.3 | 398.3 | 398.3 | 593.5 | 593.1 | 593 |
| Electricity yield | KJ | 125 | 273.5 | 556.3 | 122.8 | 153 | 1145 |
| Low-pressure steam | KJ | 156.8 | 156.8 | 156.8 | 1354 | 946.1 | 745.1 |
| CO2, direct 1 | g | 387.4 | 81.07 | 134.1 | 502.6 | 29.34 | 282.6 |
1 The residual waste gases generated during the reaction process are directly emitted as carbon dioxide after combustion.
Table 5.
Physical Properties of jet fuel. ETJ: Ethanol to jet fuel; FTJ: Fischer–Tropsch to jet fuel.
Table 5.
Physical Properties of jet fuel. ETJ: Ethanol to jet fuel; FTJ: Fischer–Tropsch to jet fuel.
| Property | Unit | Properties for Blendstock [8] | ETJ | FTJ |
|---|---|---|---|---|
| Net heating value | MJ/kg | 42.8 | 44.03 | 44.12 |
| Viscosity | cP | 8 max | 2.27 | 1.46 |
| Flash point | °C | 38 min | 82.15 | 46.16 |
| boiling point | °C | 150–300 | 250 | 216 |
| Mass Density (15 °C) | kg/m3 | 730–770 | 756.9 | 741.1 |
Table 6.
Distributions selected for Monte Carlo simulation in current study.
| Variable Name | Distribution | Unit | Parameters |
|---|---|---|---|
| Raw Material LCA | Triangular | % | Min: 45 Max: 55 Mode: 50 |
| GHG emissions per unit of MJ electrical energy | Triangular | g CO2e/MJ Electricity | Min: 183.85 Max: 224.71 Mode: 204.28 |
| CHP electric efficiency | Triangular | % | Min: 31.5 Max: 38.5 Mode: 35 |
Disclaimer/Publisher’s Note: The statements, opinions and data contained in all publications are solely those of the individual author(s) and contributor(s) and not of MDPI and/or the editor(s). MDPI and/or the editor(s) disclaim responsibility for any injury to people or property resulting from any ideas, methods, instructions or products referred to in the content. |
© 2024 by the authors. Licensee MDPI, Basel, Switzerland. This article is an open access article distributed under the terms and conditions of the Creative Commons Attribution (CC BY) license (https://creativecommons.org/licenses/by/4.0/).
Share and Cite
MDPI and ACS Style
Guo, L.; Wang, X.; Yang, W.; Lv, J. Life Cycle Assessment of Aviation Fuel Production from Steel-Industry Off-Gas. Processes 2024, 12, 579. https://doi.org/10.3390/pr12030579
AMA Style
Guo L, Wang X, Yang W, Lv J. Life Cycle Assessment of Aviation Fuel Production from Steel-Industry Off-Gas. Processes. 2024; 12(3):579. https://doi.org/10.3390/pr12030579
Chicago/Turabian StyleGuo, Lin, Xiao Wang, Weili Yang, and Jing Lv. 2024. "Life Cycle Assessment of Aviation Fuel Production from Steel-Industry Off-Gas" Processes 12, no. 3: 579. https://doi.org/10.3390/pr12030579
Note that from the first issue of 2016, this journal uses article numbers instead of page numbers. See further details here.