Article

Seeking Optimal Extraction Method for Augmenting Hibiscus sabdariffa Bioactive Compounds and Antioxidant Activity

by
Athanasia Kourelatou
1,
Theodoros Chatzimitakos
2,
Vassilis Athanasiadis
2,
Konstantina Kotsou
2,
Ioannis Makrygiannis
2,
Eleni Bozinou
2 and
Stavros I. Lalas
2,*
1
Department of Chemical Engineering, University of Western Macedonia, 50100 Kozani, Greece
2
Department of Food Science & Nutrition, University of Thessaly, Terma N. Temponera Str., 43100 Karditsa, Greece
*
Author to whom correspondence should be addressed.
Processes 2024, 12(3), 581; https://doi.org/10.3390/pr12030581
Submission received: 21 February 2024 / Revised: 12 March 2024 / Accepted: 12 March 2024 / Published: 14 March 2024

Abstract

:
The dried flowers of Hibiscus sabdariffa (HS), available worldwide, have various applications in both non-medicinal and medicinal fields. The growing global interest in the health benefits of HS is linked to its potential prevention or management of non-communicable diseases. The aim of this research was to find the optimal extraction method that ensures the maximum yield of multiple beneficial bioactive components, such as polyphenols, anthocyanins, vitamin C, β-carotene, antioxidant activity, free radical scavenging activity DPPH and ferric reducing antioxidant power (FRAP). To this end, stirring, pulsed electric field, and ultrasound-assisted extraction were evaluated, either alone or in combination. Under optimized extraction conditions, the obtained extract exhibited an elevated total polyphenol content (37.82 mg of gallic acid equivalents/g dry weight (dw)), total anthocyanin content (610.42 μg of cyanidin equivalents/g dw), total carotenoids content (921.84 μg of β-carotene equivalents/g dw), and ascorbic acid content (507.44 mg/100 g dw). Remarkably, the extracts exhibited strong antioxidant properties (487.51 μmol of ascorbic acid equivalents (AAE)/g dw and 243.42 μmol AAE/g dw as evidenced by FRAP and DPPH assays, respectively). This research advances the parameters that should be employed to produce the optimal and nutritionally enhanced HS flower extracts, that can be used in the commercial sector.

1. Introduction

The Hibiscus sabdariffa (HS), a member of the Malvaceae family, is commonly found in tropical and subtropical regions, including China, Thailand, Indonesia, Egypt, Sudan, Saudi Arabia, Taiwan, Vietnam, Nigeria, and Mexico [1]. This annual plant is well-known for its production of red flowers and is recognized by various names such as roselle, Jamaica, Red Sorrel, Indian Sorrel, wonjo, and karkade [2]. In addition to its ornamental appeal, the HS is valued for its diverse bioactive components, including phenolic acids, flavonoids, anthocyanins, and organic acids [3]. These compounds contribute to its various therapeutic applications, as evidenced by its use in traditional medicine, suggesting management of type 2 diabetes [4,5], as well as beneficial effects over nephropathy [6,7], iron-deficiency anemia [8], hypertension [9], and cardiovascular diseases [10]. Furthermore, the intense red color of HS and its extracts makes it a sought-after natural dye in the cosmetic and food industries [11]. Moreover, dehydrated HS flowers are extensively utilized in the formulation of an array of consumables, encompassing beverages, tea, jellies, jams, sauces, wines, syrups, ice cream, and chutneys [12]. This versatility underscores the relevance of HS in both botanical and commercial domains.
The extracts from the HS flowers have garnered significant attention from researchers due to their potent antioxidant activity [13]. To maximize the isolation of bioactive compounds and antioxidant potential of these extracts, various studies have been undertaken, exploring various extraction parameters. For instance, water-based extractions have been conducted employing substance-to-solvent ratios ranging from 1:10 to 1:100, temperatures spanning 25 to 100 °C, and extraction durations ranging from 5 to 600 min [14,15,16]. Additionally, extractions utilizing methanol at concentrations of 100% and 80% have been performed at both elevated (64 °C) and ambient (25 °C) temperatures, respectively [17,18]. Notably, alongside conventional extraction with stirring, environmentally sustainable extraction approaches have been investigated, including microwave-assisted extraction, employing 70% ethanol as solvent, with a substance-to-solvent ratio of 1:10, and an extraction duration of 2 min [19]. However, a comprehensive extraction method encompassing all critical factors (temperature, solvent, and extraction time) for the preparation of HS extracts with maximal content in bioactive compounds and antioxidant capacity, remains elusive.
A modern research area is the development of green extraction methods, which aim at improving the performance and environmental sustainability of extracting natural products. Green extraction methods are characterized by low energy consumption, high selectivity and efficiency, minimal use of harmful solvents, and safe and high-quality outcomes [20]. Advantages include minimized solvent consumption, absence of hazardous substances, shortened extraction durations, and low energy consumption [21,22,23]. Some of the most widely used green extraction techniques include pulsed electric field (PEF) extraction [24], ultrasound-assisted extraction (UAE) [25], pressurized liquid extraction (PLE) [26], microwave-assisted extraction (MAE) [27], supercritical fluid extraction (SFE) [28], and enzyme-assisted extraction (EAE) [29]. These techniques have been successfully applied to various aromatic and medicinal plants for various purposes. Examples include the use of MAE for extracting mint (Mentha piperita L.) [30], PLE for extracting two species of eucalyptus (Eucalyptus marginata and Eucalyptus pauciflora) [31], and the extraction of Clitoria ternatea through the use of UAE [32].
The aim of this study was to develop an optimized procedure for the preparation of extracts from HS flowers, rich in total polyphenol content (TPC). As such, pivotal extraction parameters, such as the composition of the solvent, as well as the extraction time and temperature were studied. Moreover, alongside the conventional extraction process with stirring (ST), the use of PEF or ultrasound (US) as pretreatment steps was examined, either alone or in combination. To aid the above study, a response surface methodology (RSM) was employed. The extract obtained under the optimum conditions is expected to contain a high amount of TPC and as such, high antioxidant activity.

2. Materials and Methods

2.1. Chemicals and Reagents

The details about all the chemicals and reagents that were used to accomplish this experimental survey are presented in the Supplementary Material.

2.2. Flower Collection and Preparation

The flowers of HS were gathered in late September of 2023, from a field in the Larissa region of Thessaly, central Greece (39°32′43.0″ N 22°25′46.0″ E, as per Google Earth coordinates). The flowers were manually harvested at their mature stage. Subsequently, the flowers were washed with tap water, rinsed with deionized water, and dried using a paper towel before being subjected to lyophilization in a Biobase BK-FD10P lyophilizer (Jinan, China) for 24 h at 7 Pa and temperature around −54 °C. The lyophilized flowers were finely ground to a fine powder and sieved using an Analysette 3 PRO (Fritsch GmbH, Oberstein, Germany). Particles with an average diameter of 106 μm were obtained and used for further experiments.

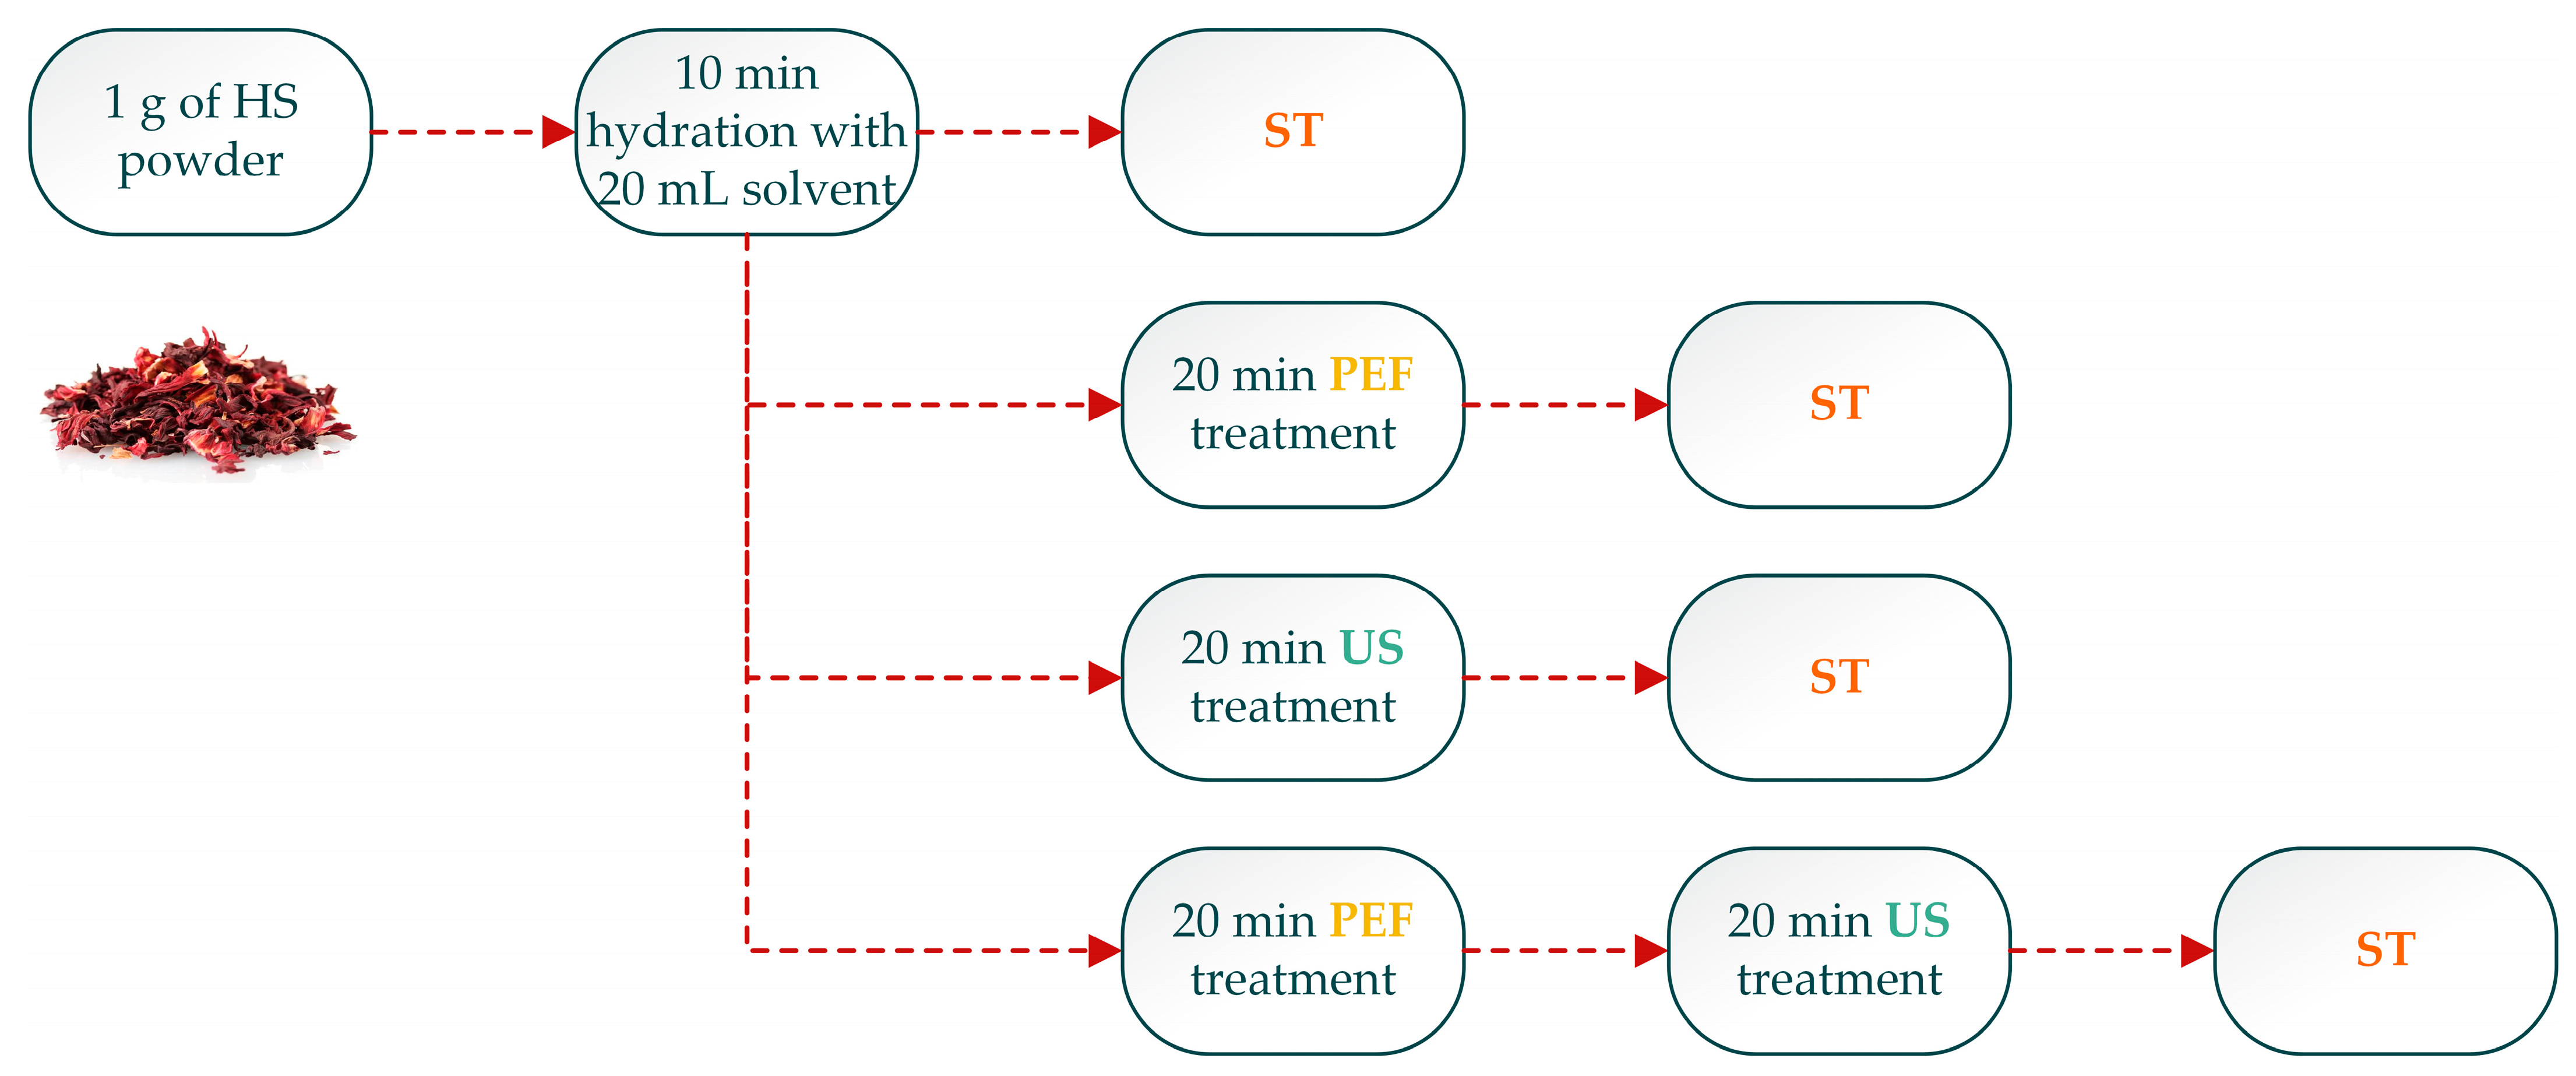
2.3. Extraction Procedure

One gram of powdered HS flowers was introduced into a 25 mL glass bottle, and 20 mL of an extraction solvent was added. Table 1 presents the composition of the extraction solvent, which includes varying concentrations of ethanol—CEtOH (%, v/v)—ranging from 0 to 100% v/v. The convention extraction process was stirring (ST) at 500 rpm using a magnetic stirrer (Heidolph Instruments GmbH & Co. KG, Schwabach, Germany) at different temperatures (T) and durations (t), as outlined in Table 1. Some samples underwent PEF and US treatments, noting four different extraction techniques, as indicated in Table 1. The coded variable level 5 is concerned only CEtOH, t and T. In all cases, the sample underwent hydration by immersing the dry powder in the different CEtOH solvent for a t of 10 min. The extraction steps, for means of simplicity, are depicted in Figure 1.
To process the samples using PEF, two custom stainless-steel chambers (Val-Electronic, Athens, Greece), a mode/arbitrary waveform generator (UPG100, ELV Elektronik AG, Leer, Germany), a digital oscilloscope (Rigol DS1052E, Beaverton, OR, USA), and a high-voltage power generator (Leybold, LDDidactic GmbH, Huerth, Germany) were employed [33]. The electric field density was set at 1.0 kV/cm, with a pulse period of 1 ms (frequency: 1 kHz) and a pulse length of 10 μs. The US treatment was carried out by placing the Duran bottle in an Elmasonic P unit (Elma Schmidbauer GmbH, Singen, Germany), the temperature was maintained at 30 °C, and the frequency was set to 37 kHz and 180 W.
In all cases, after the extraction step was completed, the sample underwent centrifugation (Remi Elektrotechnik Ltd., Palghar, India) for 10 min at 3600× g. Subsequently, the supernatant was collected and preserved at −40 °C until further analysis.

2.4. Response Surface Methodology (RSM) Optimization of Extraction and Experiment Design

The Supplementary Material contains comprehensive details on how Response Surface Methodology (RSM) was utilized to enhance the sample’s effectiveness in bioactive compounds.

2.5. HPLC-Based Analysis of the Pelargonin Chloride Content and the Other Polyphenolic Compounds

The detailed procedure is given in the Supplementary Material.

2.6. Analyses of Extracts

Detailed information on the analyses of the extracts, including TPC, TAC, antioxidant activity through the DPPH and the FRAP assays, TCC, and AAC, can be found in the Supplementary Material [34,35,36,37,38]. All results are expressed to the dry weight (dw) of the flower.

2.7. Statistical Analysis

The detailed presentation of the statistical analysis program used for this study is included in the Supplementary Material.

3. Results and Discussion

All the collected and studied flowers exhibited red calyces with five large petals interconnected by the corolla. The flowers had a length ranging from 5.10 to 5.15 cm, empirically and scientifically suitable for full bloom [39]. To prepare extracts from the HS flowers with a high concentration of bioactive compounds an RSM approach was applied. This method facilitated the systematic examination of various factors influencing the extraction process, including conventional extraction method (ST), green extraction methods (US and PEF), and their combinations. In addition, more extraction parameters such as extraction t, T, and CEtOH (%, v/v) solvent mixtures were taken into consideration. In accordance with earlier investigations and preliminary experiments, the most suitable ratio of solid-to-CEtOH (%, v/v) solvent ratio was determined to be 1:20 [34].

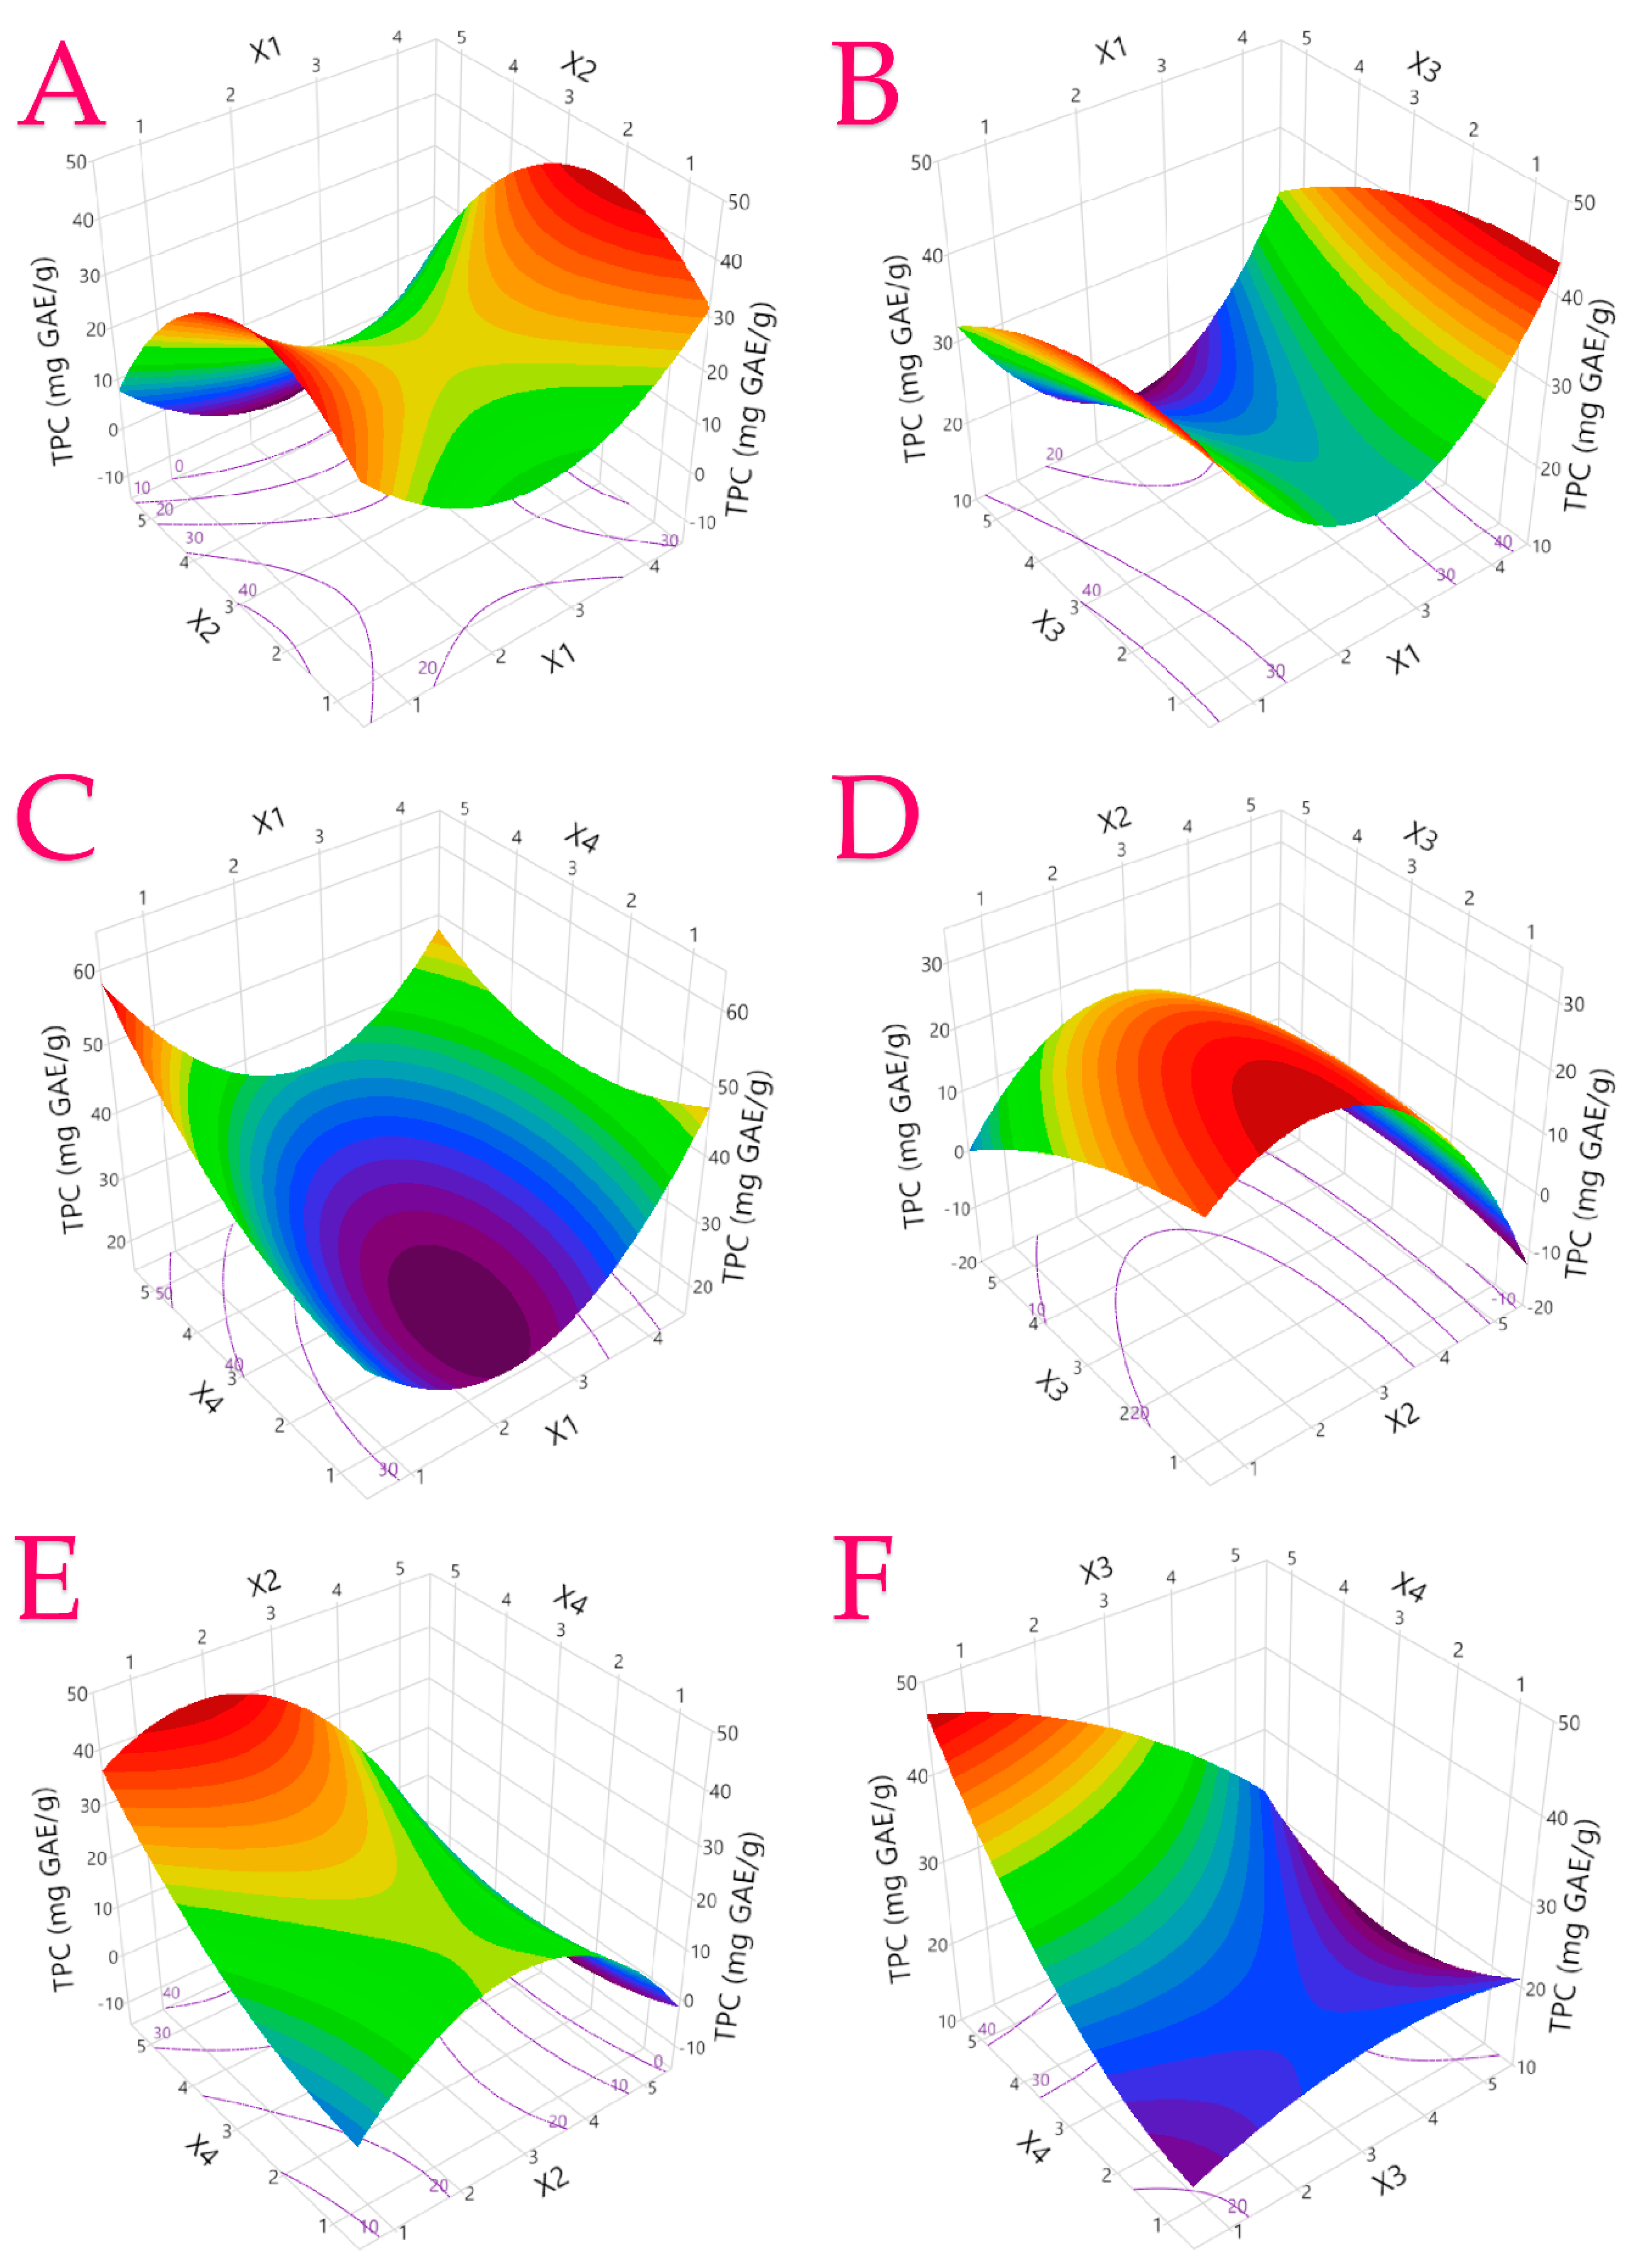
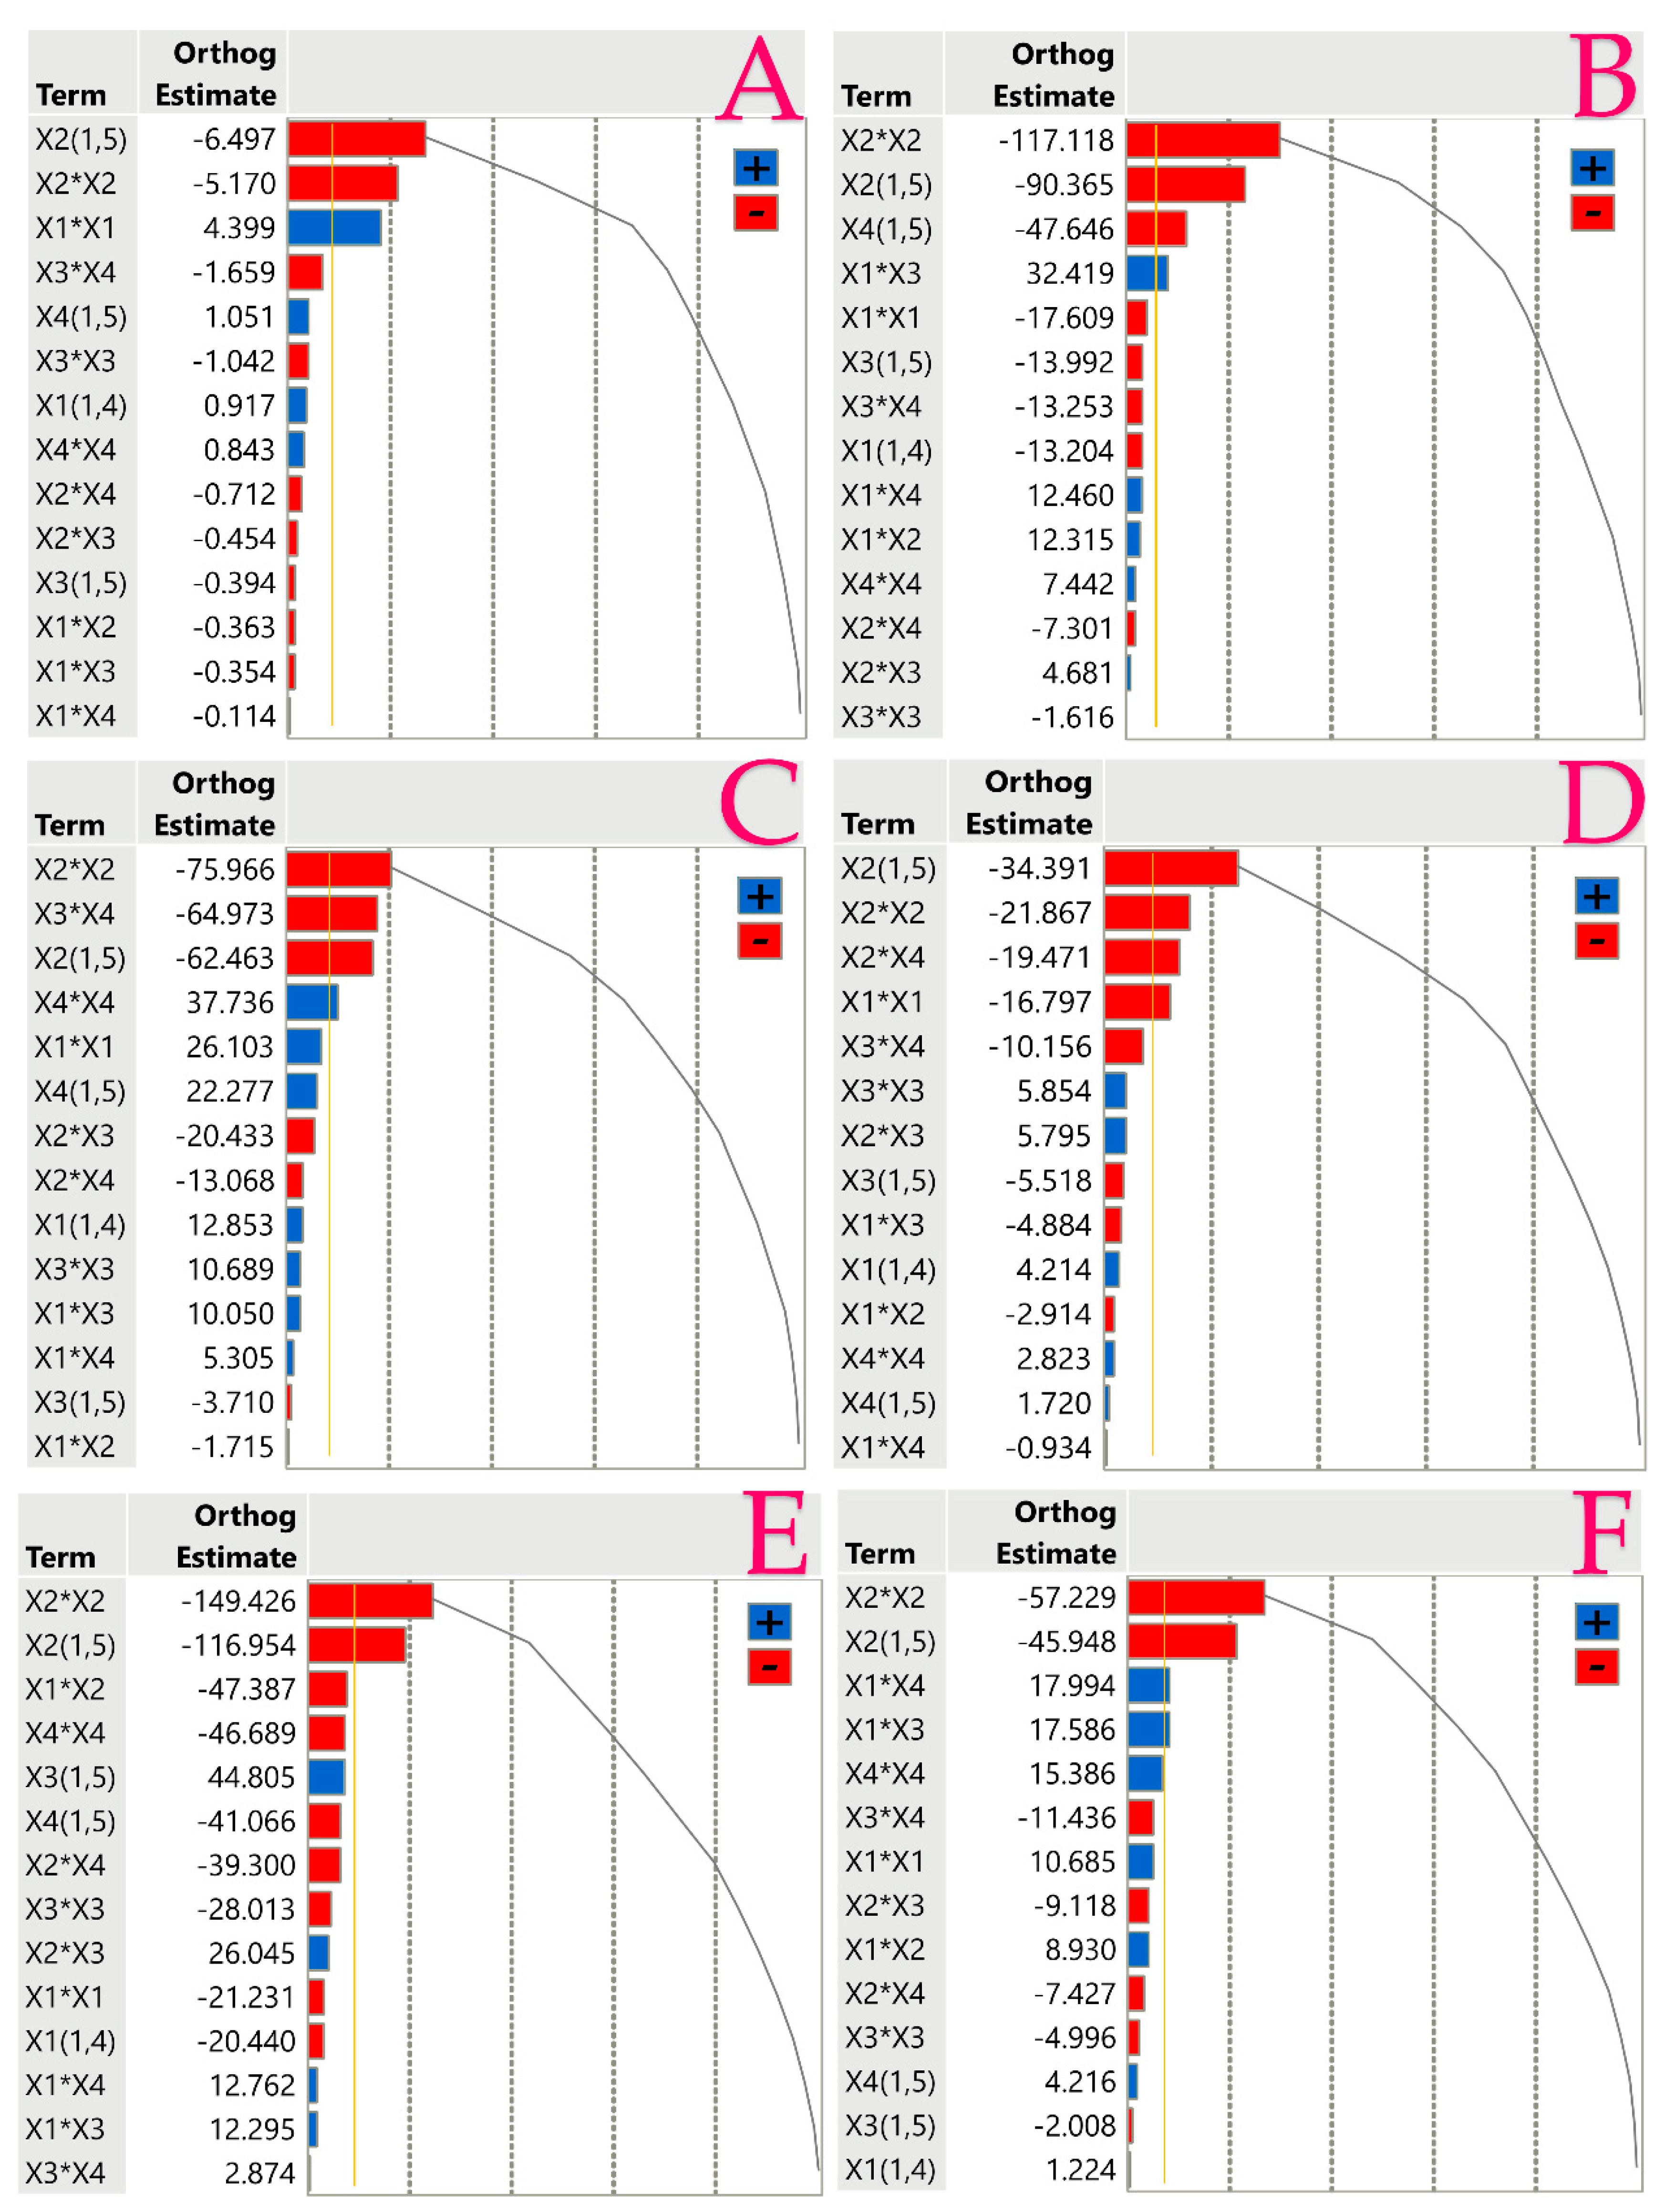
3.1. Extraction Optimization

Employing the RSM approach, the influence of each factor was evaluated and adjusted to attain optimal extraction efficiency. The recorded outcomes for each extract are outlined in Table 2. It can be seen that the design points 5, 15, and 20 are not particularly promising. On the contrary, design point 13 exhibited the most promising results. This signifies that the treatment with PEF and US constitutes the most optimal combination. Also, avoidance of excessively high T (<65 °C) coupled with a one-hour extraction t creates the ideal extraction conditions, yielding a highly enriched extract, as exemplified by design point 13.
Figure 2 depicts an HPLC-DAD chromatogram at 280 nm and 320 nm for an HS extract. As can be seen, various polyphenolic compounds such as 3-hydroxytyrosol, pelargonin chloride, rutin, and hesperidin were identified at 280 nm [40,41,42,43] as well as chlorogenic acid and luteolin at 320 nm [44].
Optimizing extraction parameters was important, as it resulted in achieving the highest extraction efficiency while minimizing the utilization of energy, t, and solvents. Enhancing these parameters is crucial for minimizing the environmental footprint of the entire extraction process [45]. CEtOH selection significantly affects compound extraction [46]. For example, bioactive compounds characterized by medium polarity, such as the polyphenols abundantly present in the present samples, are not efficiently extracted with water owing to their lower polarity [47]. As a result, ethanol has been extensively utilized to enhance extraction efficiency [48]. This outcome was further corroborated in the present study, as regarding the solvent parameter, the presence of ethanol was deemed indispensable.
Table 3 presents the statistical parameters, second-order polynomial equations (models), and coefficients (with values exceeding 0.96) for each model. These findings indicate a strong alignment between the developed models and the data. Accompanying this, Figures S1–S6 illustrate plots comparing the actual response against the predicted response for each examined parameter, along with desirability functions. For a comprehensive understanding of the TPC, three-dimensional response plots are presented in Figure 3, while corresponding three-dimensional response plots for the remaining parameters can be found in Figures S7–S11.
According to the Pareto plots, the positive or negative influence of each extraction factor on the isolation efficiency of the respective bioactive element is presented in Figure 4. The prominently negative correlation observed in the CEtOH (%, v/v) across all bioactivities (TPC, TAC, TCC, and AAC), as well as antioxidant capacity, regardless of the determination method, is intriguing. This implies that neither 100% water nor 100% ethanol as solvents assist in achieving maximal values of the aforementioned bioactivities, confirming results presented in Table 2, where the highest bioactivity values were achieved with ethanolwater mixtures. In contrast, the extraction method appears to positively influence both the isolation of TPC and TAC, suggesting a potential association between these methods. However, this result conflicts with the DPPH antioxidant method, which is negatively affected by the extraction method factor. Notably, a positive correlation is observed with the extraction T for the FRAP antioxidant method, whereas T, in combination with CEtOH (%, v/v) and extraction t, exhibits a negative correlation for the values of DPPH and FRAP, respectively.

3.2. Analysis of the Extracts

3.2.1. TPC and TAC of the Extracts

The adopted extraction techniques and parameters notably affected the TPC and TAC in the extracts, as outlined in Table 2. The TPC ranged from 3.90 mg gallic acid equivalents (GAE)/g dw to 37.82 mg GAE/g dw, thus the quantity could increase by up to 869.83%. The highest extraction yields of phenolics were attained through the utilization of a 25% CEtOH coupled with a short extraction t, as outlined in Table 4. Notably, the increase in T, along with the integration of both the green extraction processings prior to stirring, results in a further enhancement of the TPC content. Comparing the results with recent studies that employed conventional extraction methods, either with boiling water or ethanol solutions at 23 °C, notable differences were observed. Specifically, in the former case, a value of 14.24 mg GAE/g dw of the flower was recorded [49], while in the latter, using a 50% ethanolic solution, the value was 35.71 mg GAE/g dw. However, when employing a 75% ethanolic solution, the value decreased to 35.30 mg GAE/g dw [50]. By comparing all the results, it is once again evident that ethanol is indeed a suitable solvent for extracting bioactive compounds of HS, and complementary techniques preceding conventional extraction can increase the TPC to very significant levels.
Concerning TAC, the quantities exhibited a range of values from 80.51 to 610.42 μg cyanidin equivalents (CyE)/g dw, contingent upon the employed extraction method. It was demonstrated that the optimum CEtOH (%, v/v) was a 50% solution, with a minimal extraction t. The inclusion of US prior to the conventional stirring was also deemed imperative. In a previous investigation examining the enhancement of TAC levels in HS flowers through green extraction techniques such as maceration and ultrasonic turbolization, acidified water emerged as the preferred solvent. Maximum quantities for each method were documented as 96.30 and 87.30 μg CyE/g dw, respectively [51]. These recorded values were notably 533.87% and 599.22% lower compared to the levels achievable by following the recommended extraction parameters for obtaining an anthocyanin-rich extract from HS. Moreover, in a previous study where an ethanolic extract of HS flowers was studied, the amount of TAC was recorded at 359.3 mg CyE/100 g dw (i.e., 3593 μg CyE/g dw) [52]. Despite the impressive recorded amount, the content could be enhanced by 41.14% if the appropriate extraction conditions were applied.
As indicated in Table 4, the predicted values obtained by Partial Least Squares (PLS) for the optimal extraction stand at 41.17 mg GAE/g dw for TPC and 655.67 μg CyE/g dw for TAC. Nevertheless, considering the maximum values outlined in Table 5, the predicted responses, following the same extraction method and parameters for the preparation of a single optimal extract, contained 36.56 mg GAE/g dw for TPC and 681.96 μg CyE/g dw for TAC. These findings underscore the significance of meticulously choosing extraction techniques and CEtOH (%, v/v), as they can substantially augment the efficiency and yield of bioactive compounds. This approach not only proves to be more energy-efficient but also enhances overall effectiveness in the extraction process.

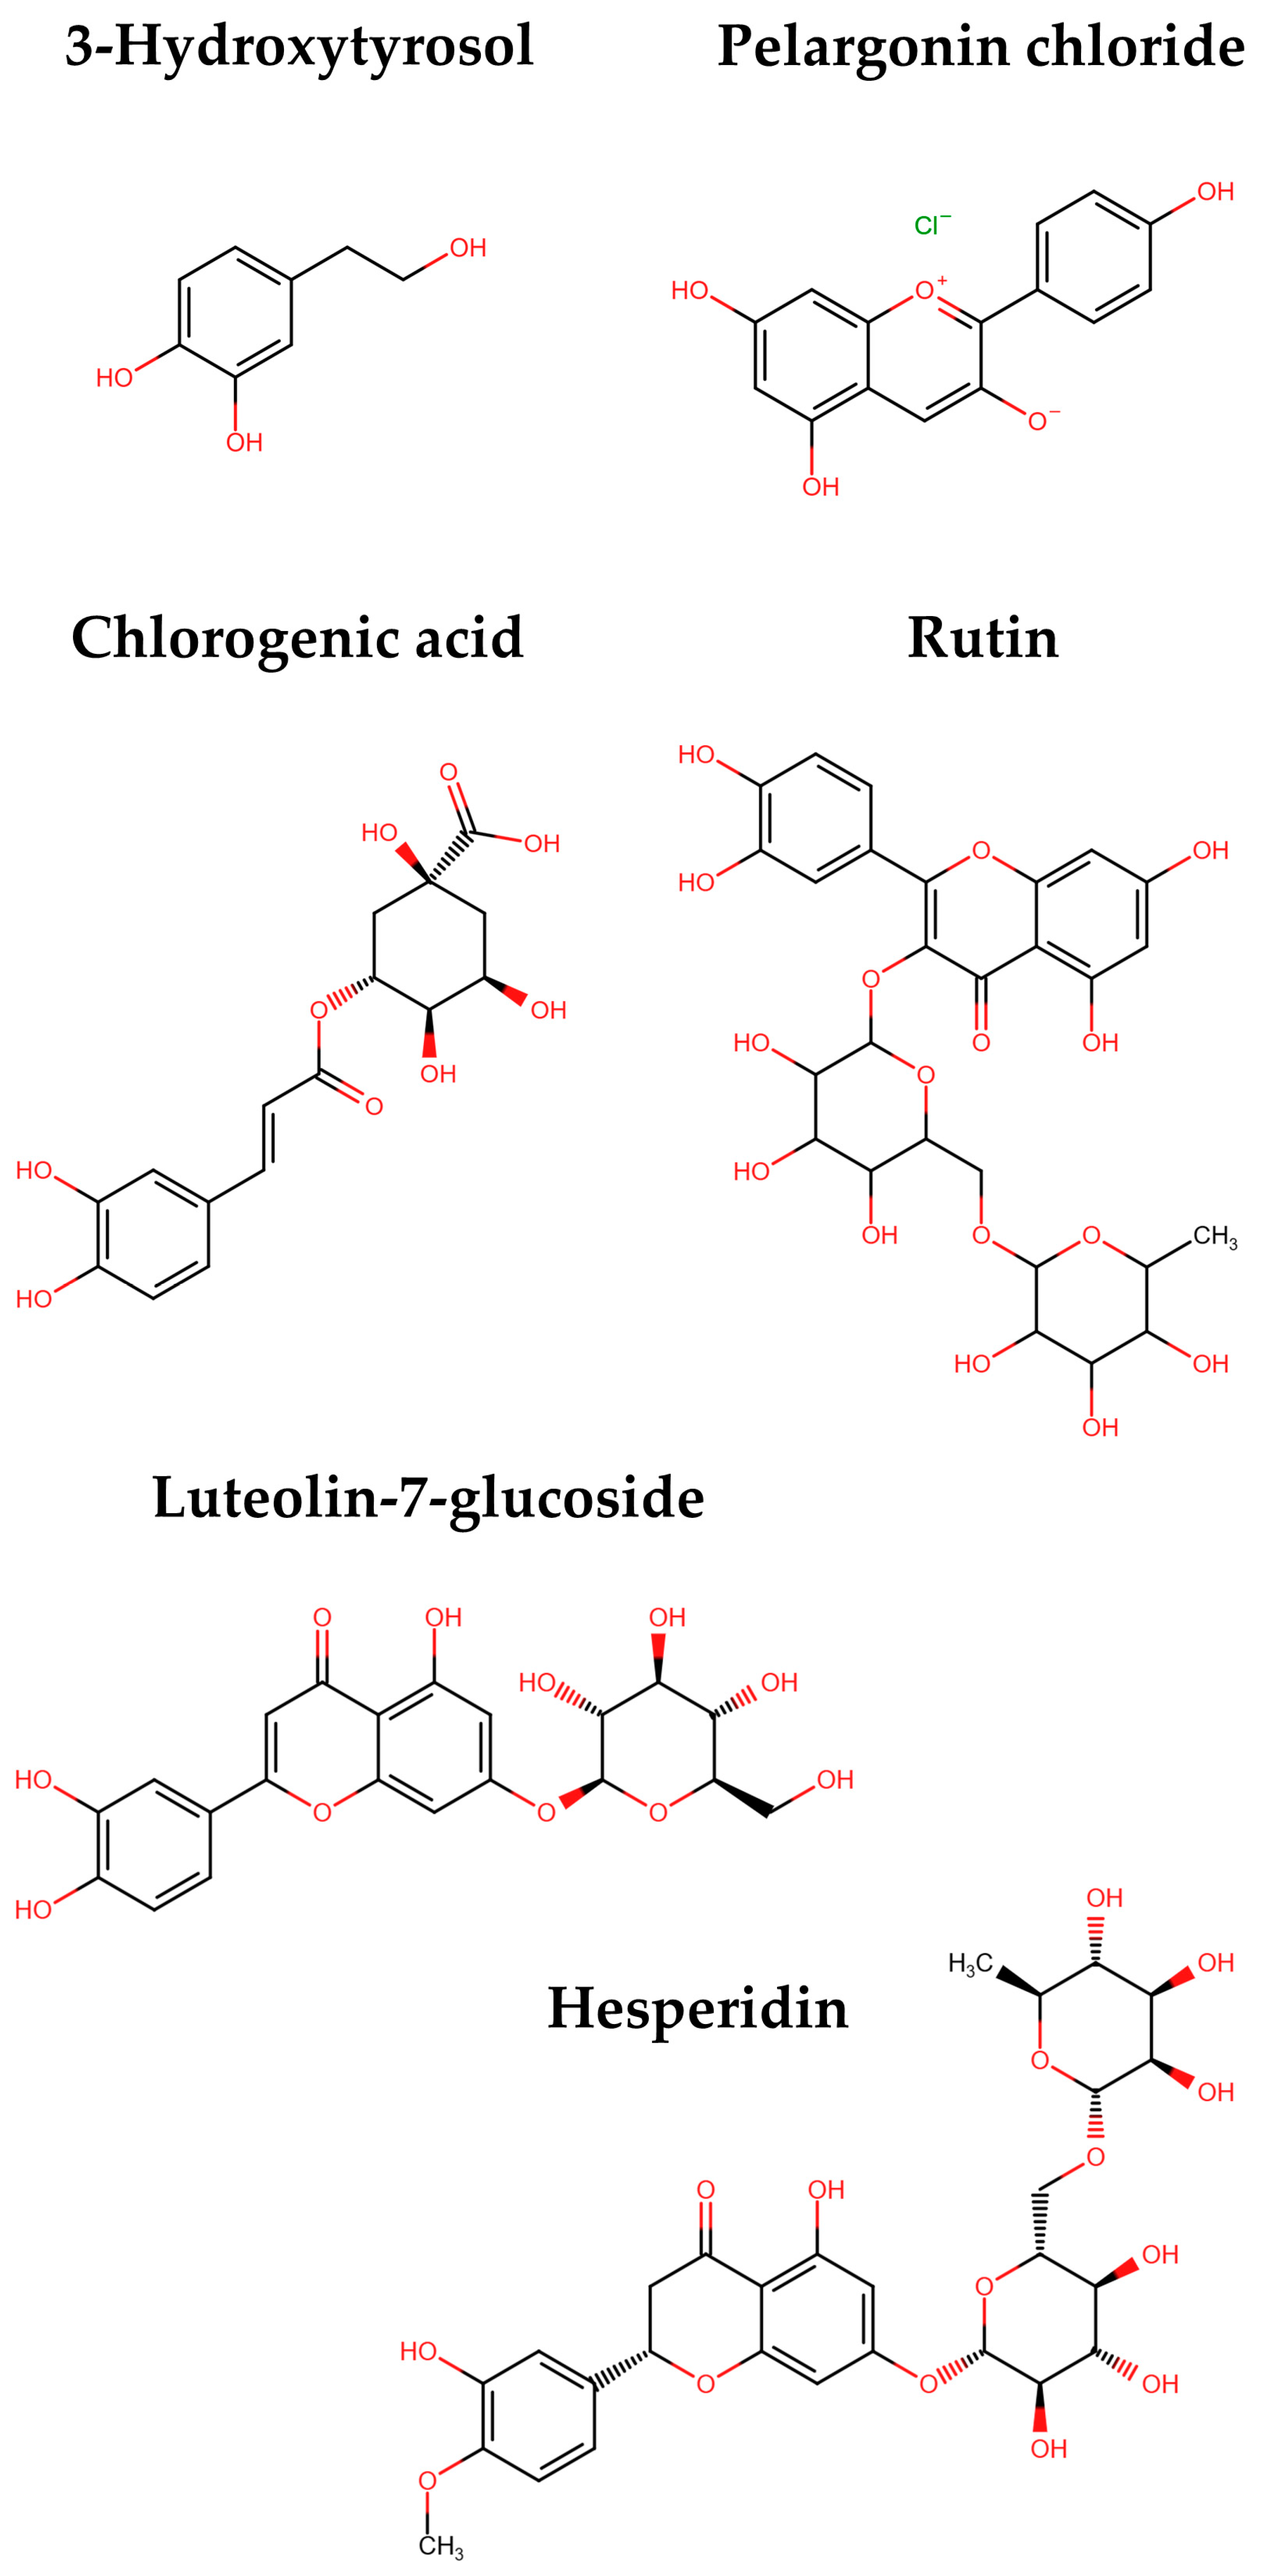
3.2.2. Polyphenolic Compounds of the Optimum Extract

Pelargonin emerged as the principal polyphenolic compound within the optimal extract, as presented in Table 6, comprising approximately 87.80% of the total polyphenolic compounds. Pelargonin is classified as an anthocyanin, commonly present in red fruits and vegetables, functioning as a natural colorant [53]. Identified mainly in dates, pelargonin has been investigated for its anti-allergic properties [54]. Moreover, it is reported to exhibit oxygen radical absorbance capacity [55]. Pelargonin chloride has been previously identified in HS flowers from a variety in Mexico in minimal quantities. More specifically, it was found in amounts of 0.00217 mg/g dw [56], which is much lower than what can be obtained by applying ideal extraction procedures. According to previous studies, the leaves of HS are rich in chlorogenic acid [57], known for their pharmacological activities, encompassing anticancer, antidiabetic, antiviral, and antipyretic properties [58,59]. Besides the leaves of the HS, it is evident (Table 6) that the flowers also contain a considerable amount of chlorogenic acid. Additionally, it is apparent that hesperidin is present in the flowers, which has neuroprotective effects observed across various models of central nervous system disorders [60]. In a preceding investigation, the calyces of HS exhibited a hesperidin content of 0.14 mg/g dw, resulting in a 600% reduced content compared to the optimal extract of HS presented herein. This means that the enriched extract, besides excelling in polyphenolic compounds, may also possess all the beneficial properties of these compounds. Figure 5 shows the chemical structures of the polyphenolic compounds that were identified in the extracts of HS.

3.2.3. Antioxidant Properties of the Extracts

The antioxidant properties of the HS extracts acquired in this study were assessed through two distinct methodologies, namely, FRAP and DPPH. Optimal extraction methods for both approaches necessitate ultrasonic treatment prior to agitation, a relatively elevated T ranging from 50 to 65 °C, a CEtOH of up to 50%, and a short t, as depicted in Table 2.
Regarding the antioxidant capacity via both methods, it can be seen that the samples exhibit significant variability in their capacity depending on the method employed. Specifically, the values range from 82.72 to 487.51 μmol ascorbic acid equivalents (AAE)/g dw according to Table 2, indicating that the antioxidant capacity can increase by up to 489.32%, in the FRAP method. Simultaneously, in the DPPH method the free radical scavenging capability increased by up to 16,800%. The experimental value of 216.14 ± 14.91 μmol AAE/g dw for the DPPH assay corresponds to an ascorbic acid concentration (AAC) of 10,826 ± 670 μmol/L. The IC50 value of the antioxidant ascorbic acid is 854.24 μmol/L, while the HS optimal extract has an IC50 value of 8545.32 μmol/L. The lower the IC50 value, the higher the antioxidant capacity. In a previous method, an attempt to optimize the antioxidant capacity of HS leaves using various solvents (methanol, 80% alcohol, hot and cold water) and drying methods (room, sun, oven, microwave, cross flow, infra-red, and freeze-dryer) was made. It was found that with 80% alcoholic solvent on freeze-dried leaves, the antioxidant capacity reached 202.93 μmol AAE/g dw for the FRAP method. Conversely, the highest total antioxidant activity was exhibited from the sun-dried leaf cold water extract at 394.39 μmol AAE/g dw with the room-dried leaf 80% alcohol extract following closely at 369.12 μmol AAE/g dw [61].
As per Table 4, the highest predicted values for each antioxidant capacity measurement method were 603.11 ± 121.21 μmol AAE/g dw for FRAP, whereas for DPPH, the corresponding value was 243.42 ± 46.76 μmol AAE/g dw, with desirability of 0.86 and 0.87, respectively, compared to the maximum value of 1. Comparing the results, it is evident that the HS extract can achieve and surpass the antioxidant capacity of the leaves using suitable methods, creating an extract with pronounced multifaceted antioxidant capability.

3.2.4. TCC and AAC of the Extracts

Carotenoids offer a plethora of health benefits and aesthetic therapeutic implications, including immune system strengthening, resilience against serious maladies such as cancer, and noteworthy anti-aging attributes [62,63]. Additionally, ascorbic acid, a natural antioxidant [64], not only serves as an antioxidant but also improves the absorption of non-heme iron [65]. A noteworthy outcome is that the extract of HS flowers is quite rich in TCC and AAC, with values ranging from 176.06 to 921.84 μg β-carotene equivalents (CtE)/g dw (a 423.59% increase) and 239.33 to 507.44 mg/100 g dw (indicating a 112.03% increase) after various processing conditions. This finding aligns with prior investigations where the abundant presence of both TCC and AAC in HS flowers has been emphasized [66,67]. In another study examining the nutrient content of HS flowers, the quantities recorded in TCC and AAC were 0.53 ± 0.27 mg/100 g dw (530 μg/100 g dw) and 141.09 mg/100 g dw, respectively. Therefore, once again, the importance of finding suitable extraction conditions for all plant extracts becomes evident [68]. Of equal significance is that, according to Table 4, achieving the maximum TCC quantity (944.36 μg CtE/g dw) requires simple stirring and a 50% ethanol concentration, while obtaining the maximum AA quantity (561.11 mg/100 g dw) necessitates pre-processing with US, the same CEtOH (%, v/v), and minimal extraction t. The implementation of these extraction methodologies grants the formulation of an exceptionally enriched HS extract, characterized by heightened levels of AA and TC suitable for immediate and beneficial applications in the fields of medical science, cosmetic therapeutics, and nutritional sciences. The chemical structure of β-carotene and vitamin C are shown in Figure 6.

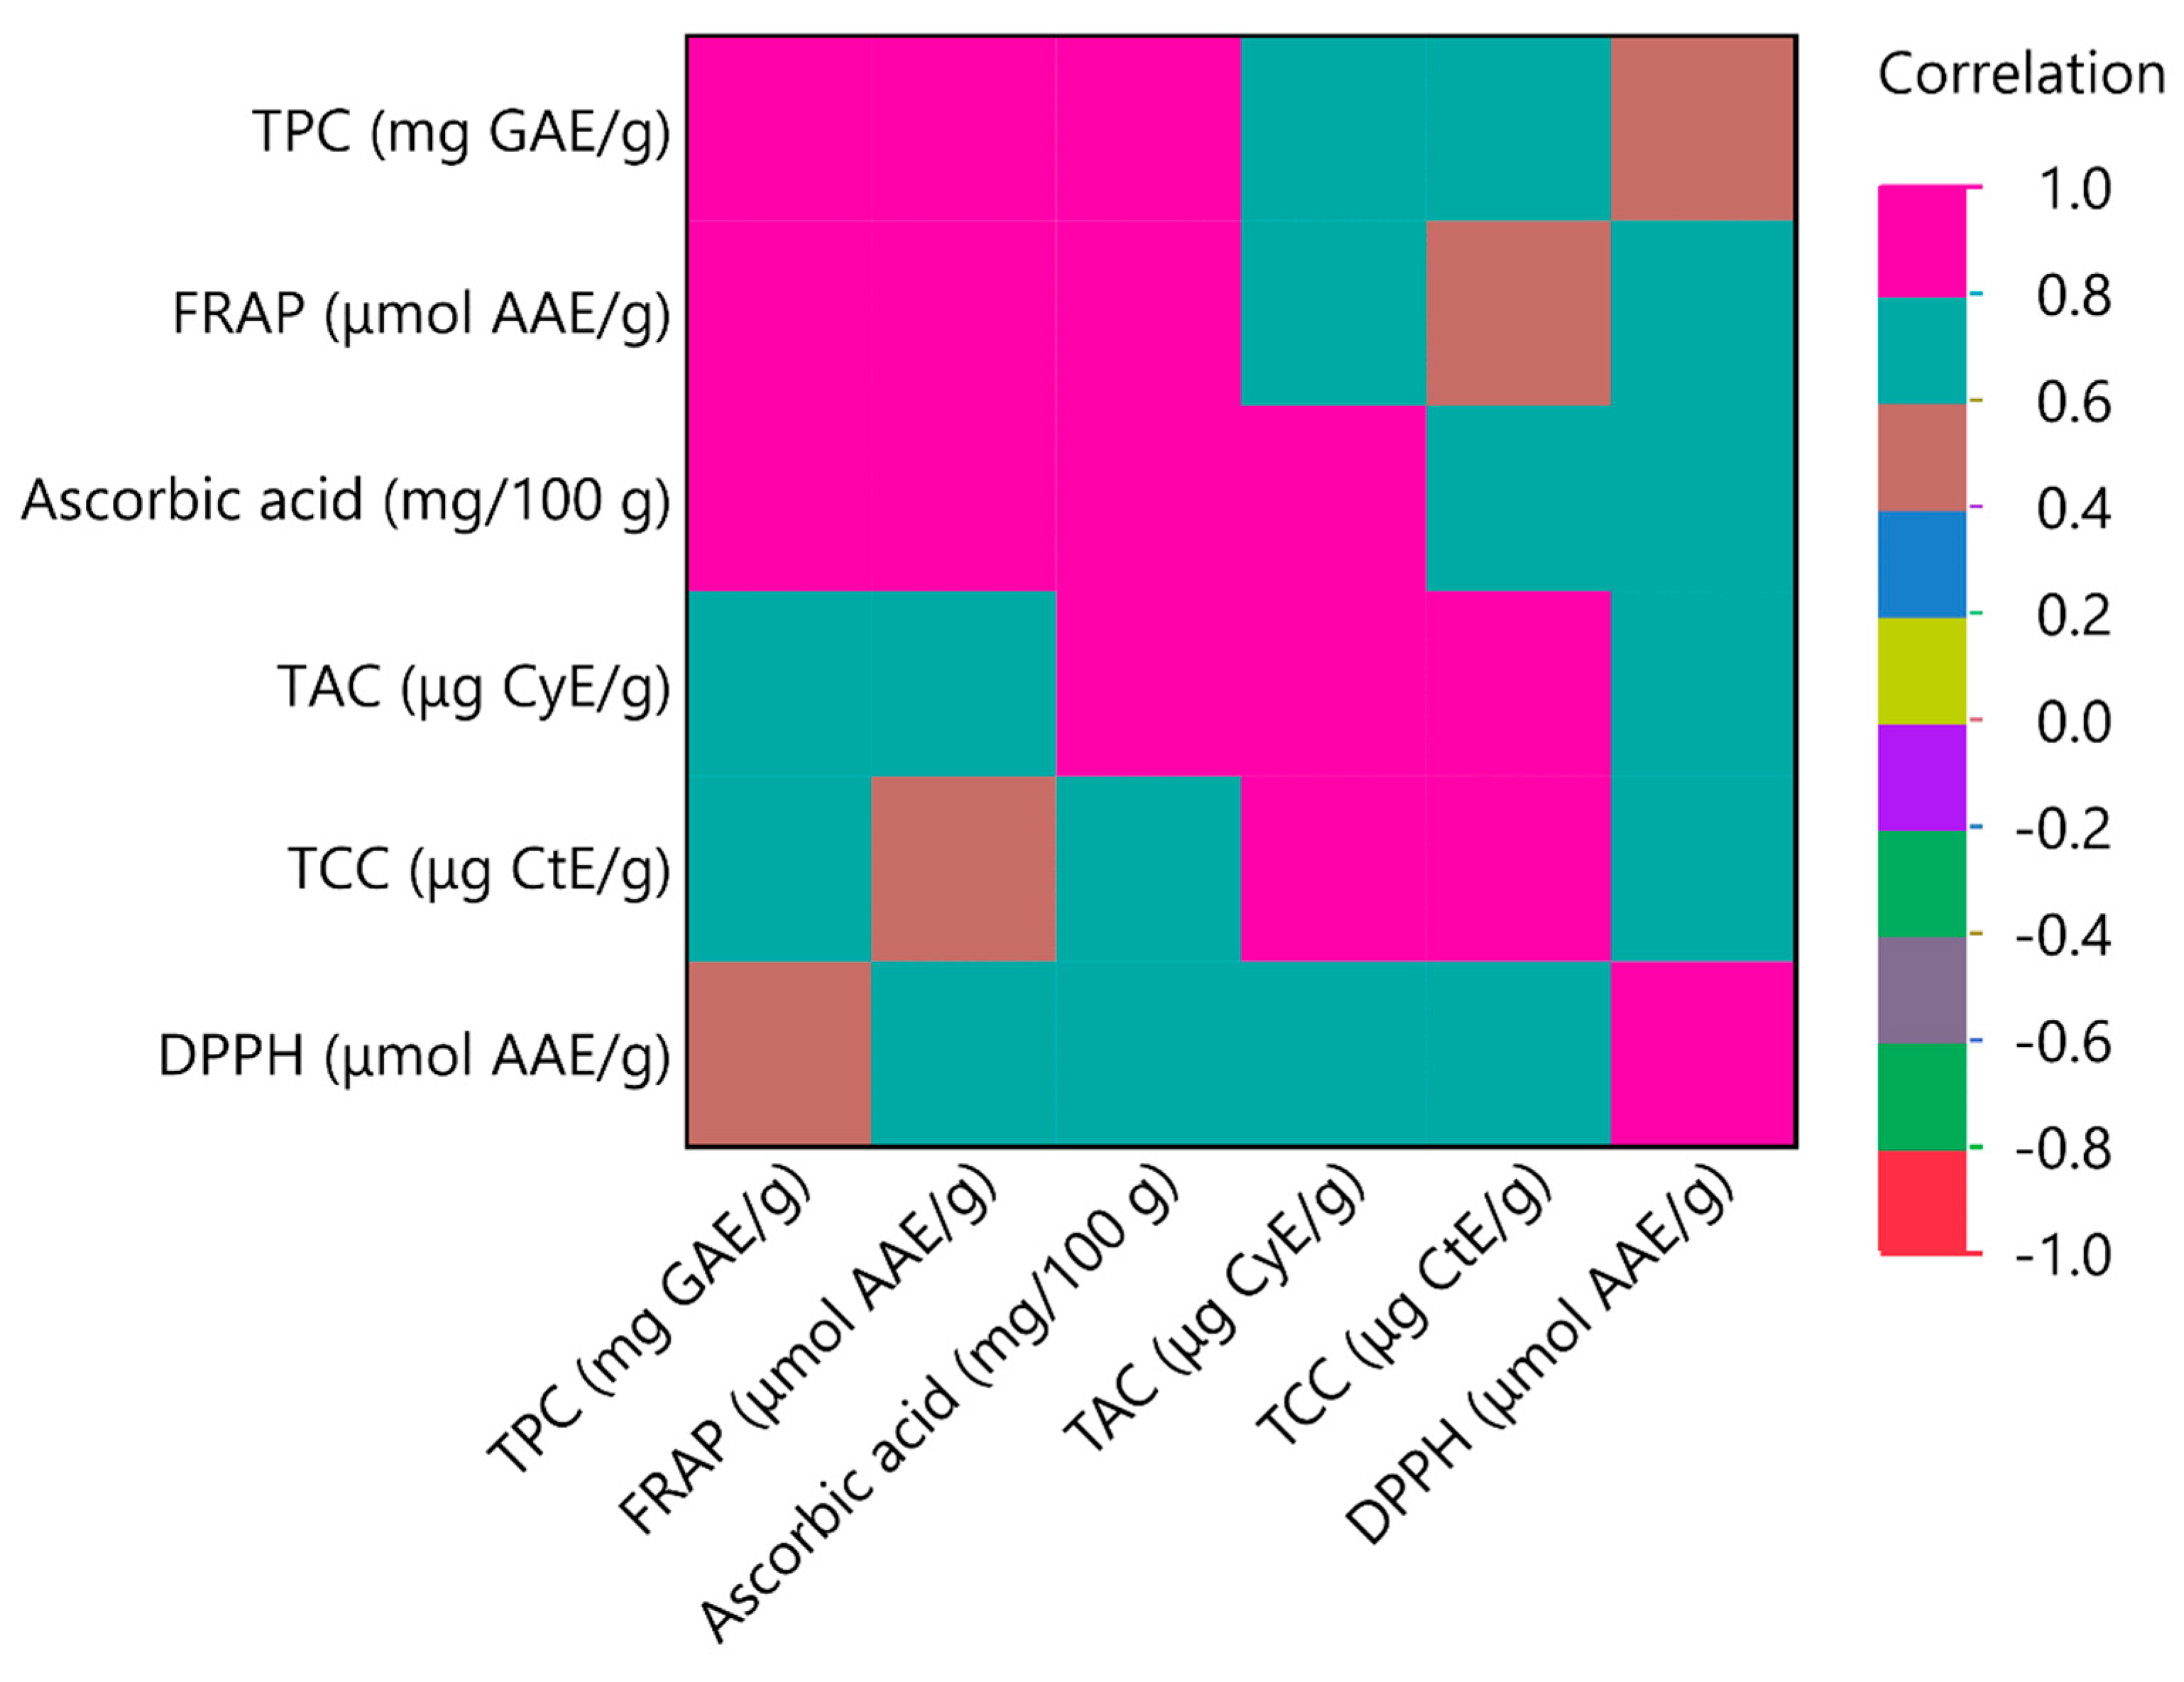
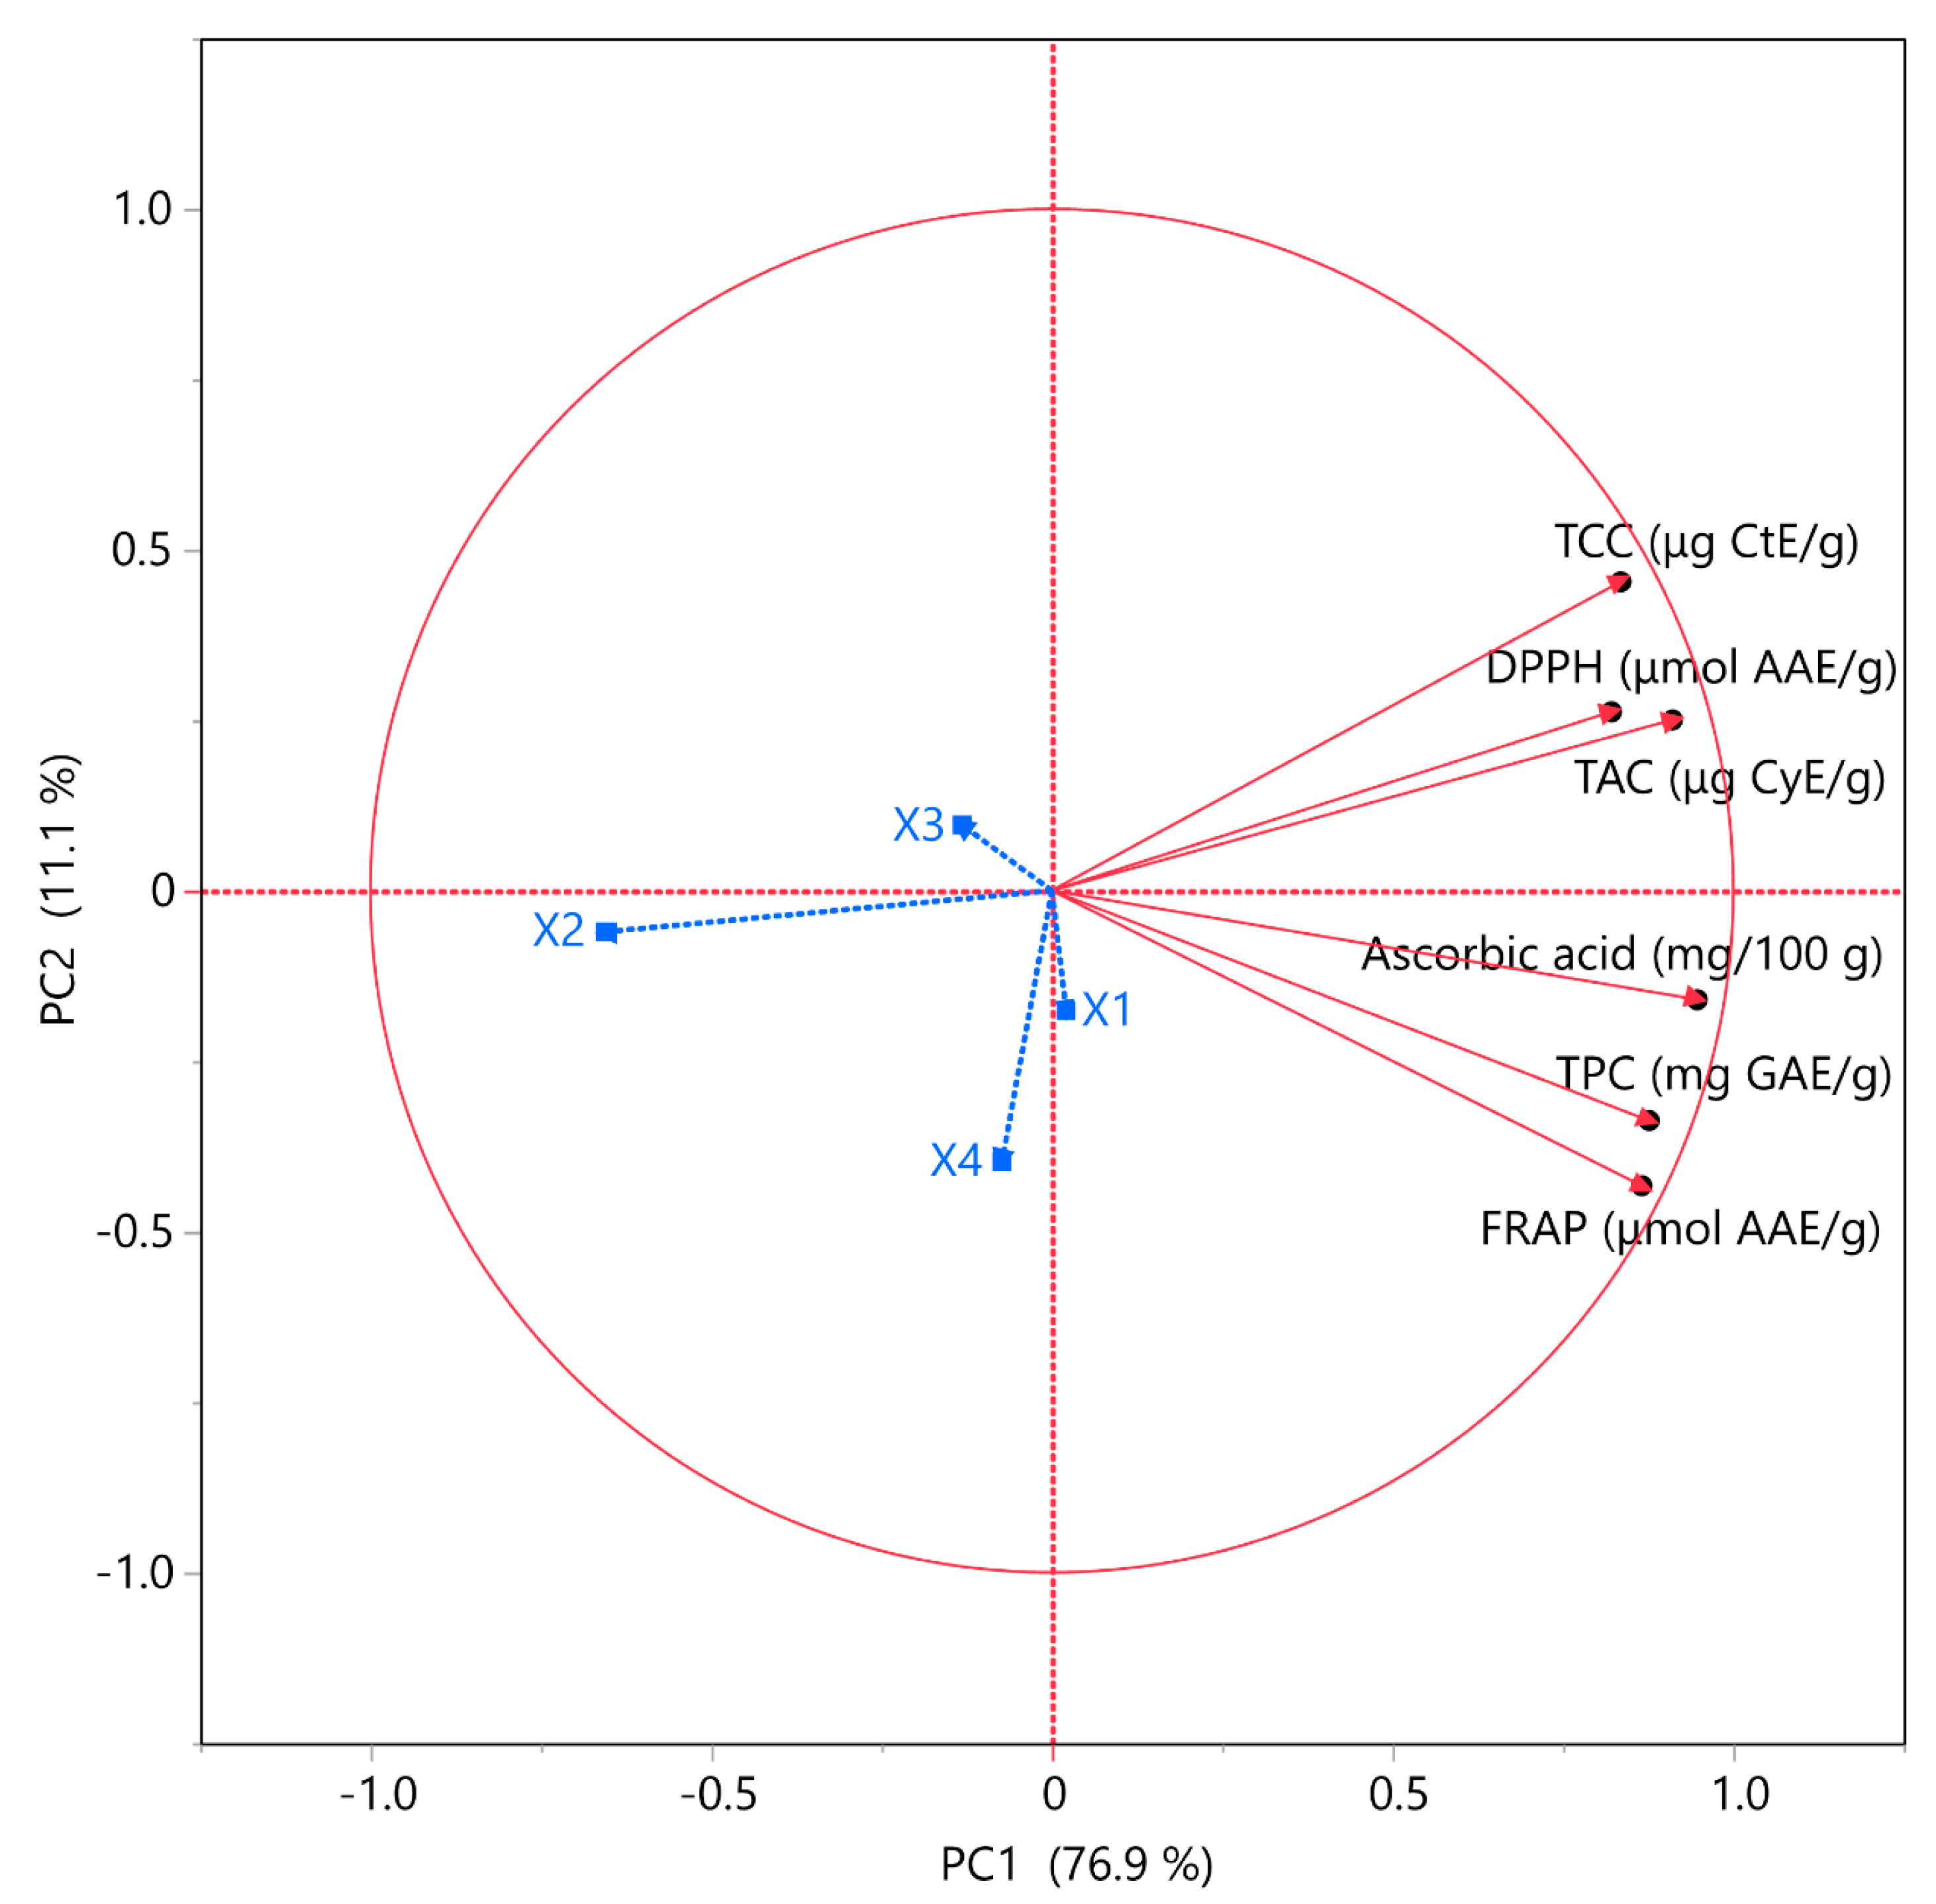
3.3. Principal Component Analysis (PCA) and Multivariate Correlation Analysis (MCA)

In Figure 7 and Figure 8, the correlation of values among various bioactive compounds is depicted, revealing noteworthy outcomes. In Figure 7 it can be seen that component 1 explained 76.9% of the variability, presenting a positive correlation with all of the examined variables TPC, TAC, FRAP, DPPH, TCC, and AAC. Furthermore, it is discernible that among the extraction factors, the one that predominantly influences the increase in various bioactive compounds is X2. It is extensively noted that ethanol plays a significant role in enhancing the isolation of bioactive compounds. Regarding Figure 8, it is worth noting that in numerous studies, the correlation among variables is often low or even negative. However, in the current research, not only a negative correlation is not observed, but the lowest correlation is 0.6, with a maximum value of 1, and this is observed in only one variable, that of antioxidant capacity through the scavenging of free radicals. Most bioactive substances exhibit a maximum correlation coefficient of 1. Specifically, the variables TPC, FRAP, and AAC recorded the highest correlation, demonstrating that both TP and AA exhibit strong antioxidant activity. Additionally, a robust correlation was observed between the TAC variable and both AAC and TCC. These results are highly encouraging, as it is rare to observe such a high degree of correlation in multivariate systems with multiple sensitive variables.

3.4. Partial Least Squares (PLS) Analysis

A PLS analysis, as depicted in Figure 9, was carried out to identify the key factors among the investigated extraction variables (X1, X2, X3, and X4). It is crucial to emphasize that PLS offers valuable insights for optimizing extraction conditions and contributes to comprehending how different factors interact to influence the yields of bioactive compounds. Figure 9 illustrates the quantities of all potentially extractable bioactive compounds by following the suggested extraction conditions based on the PLS analysis. The desirability of the results is notably high, registering a value of approximately 0.8930. The result, as indicated in Table 4, is logical and it is demonstrated that for almost all bioactive elements and antioxidant capacity, the maximum values are ensured through the application of the same parameters.
Upon comparing the values provided by the PLS model with those obtained through experimental analysis, a correlation of 0.9888 was observed, indicating no deviations, with a p-value of <0.0001.

4. Conclusions

The dried flowers of HS are highlighted as a versatile source with extensive applications in both the non-pharmaceutical and pharmaceutical sectors. The global interest in HS revolves around perceived health benefits, particularly in preventing or managing non-communicable diseases. This study, acknowledging the diverse bioactive compounds responsible for the myriad properties of HS, delves into three distinct extraction methods, including conventional ST and two environmentally friendly approaches, US and PEF, both individually and in combination. Through stochastic optimization, this research aims to produce the most nutrient-rich HS extract using more advanced and eco-friendly methods. Indeed, according to our results, the use of US before ST (at least for t 30 min) along with 25% CEtOH, at 80 °C T was deemed the most suitable for the abundance of bioactive substances (36.56 mg GAE/g dw for TPC, 681.96 μg CyE/g dw for TAC, 781.14 μg CtE/g dw for TCC, 595.96 mg/100 g dw for AAC) and antioxidant capacity (690.18 μmol AAE/g dw and 227.12 μmol AAE/g dw for FRAP and DPPH method, respectively). Simultaneously, the application of the aforementioned extraction parameters offered a remarkable increase in TPC, TAC, TCC, and AAC reaching 837.46, 747.02, 343.67, and 149.02%, respectively. This study not only provides optimized extraction processes to maximize the overall nutritional content or individual nutrients of HS flower extracts but also underscores the diverse applications of this extract.

Supplementary Materials

The following supporting information can be downloaded at: https://www.mdpi.com/article/10.3390/pr12030581/s1, Supplementary Material File—Materials and Methods. Figures S1–S6 comprise plots that illustrate the comparison between the actual response and the predicted response for each parameter under examination, accompanied by the desirability functions. Figures S7–S11 present three-dimensional response plots for the remaining responses.

Author Contributions

Conceptualization, T.C., V.A. and S.I.L.; methodology, V.A. and T.C.; software, V.A.; validation, T.C., V.A. and K.K.; formal analysis, T.C. and V.A.; investigation, A.K., T.C., V.A., K.K., I.M. and E.B.; resources, S.I.L.; data curation, V.A.; writing—original draft preparation, A.K. and K.K.; writing—review and editing, A.K., T.C., V.A., K.K., I.M., E.B. and S.I.L.; visualization, V.A.; supervision, S.I.L.; and funding acquisition, S.I.L. All authors have read and agreed to the published version of the manuscript.

Funding

This research received no external funding.

Data Availability Statement

All related data and methods are presented in this paper. Additional inquiries should be addressed to the corresponding author.

Conflicts of Interest

The authors declare no conflicts of interest.

References

  1. Bedi, P.S.; Bekele, M.; Gure, G. Phyto-Chemistry and Pharmacological Activities of Hibiscus sabdariffa Linn.—A Review. Int. Res. J. Pure Appl. Chem. 2020, 21, 41–54. [Google Scholar] [CrossRef]
  2. Solangi, A.H.; Junejo, S.; Siddiqui, A.A.; Arain, M.Y.; Ansari, M.A.; Talpur, U.A.; AhadKolach, A. Roselle (Hibiscus sabdariffa L.) a Multipurpose Medicinal Plant and Its Uses: A Review. Int. J. Biol. Res. 2017, 5, 21–24. [Google Scholar]
  3. Izquierdo-Vega, J.A.; Arteaga-Badillo, D.A.; Sánchez-Gutiérrez, M.; Morales-González, J.A.; Vargas-Mendoza, N.; Gómez-Aldapa, C.A.; Castro-Rosas, J.; Delgado-Olivares, L.; Madrigal-Bujaidar, E.; Madrigal-Santillán, E. Organic Acids from Roselle (Hibiscus sabdariffa L.)—A Brief Review of Its Pharmacological Effects. Biomedicines 2020, 8, 100. [Google Scholar] [CrossRef] [PubMed]
  4. Sarbini, D.W.I.; Huriyati, E.M.Y.; Sadewa, H.; Wahyuningsih, M.S.H. The Effect of Rosella (Hibiscus sabdariffa Linn) on Insulin Resistance in Patients with Type 2 Diabetes Mellitus: A Randomized Clinical Trial. Int. J. Pharm. Res. 2019, 11, 547–557. [Google Scholar]
  5. Abubakar, S.M.; Ukeyima, M.T.; Spencer, J.P.E.; Lovegrove, J.A. Acute Effects of Hibiscus sabdariffa Calyces on Postprandial Blood Pressure, Vascular Function, Blood Lipids, Biomarkers of Insulin Resistance and Inflammation in Humans. Nutrients 2019, 11, 341. [Google Scholar] [CrossRef]
  6. Nwachukwu, D.C.; Aneke, E.I.; Nwachukwu, N.Z.; Azubike, N.; Obika, L.F. Does Consumption of an Aqueous Extract of Hibiscus sabdariffa Affect Renal Function in Subjects with Mild to Moderate Hypertension? J. Physiol. Sci. 2017, 67, 227–234. [Google Scholar] [CrossRef]
  7. Sakhaei, R.; Nadjarzadeh, A.; Esmaeili, A.; Mohammadi, M.; Hemayati, R.; Reza, J.Z.; Mozaffari-Khosravi, H.; Ramezani-Jolfaie, N. Cardiovascular and Renal Effects of Hibiscus sabdariffa Linnaeus. in Patients with Diabetic Nephropathy: A Randomized, Double-Blind, Controlled Trial. J. Nutr. Food Secur. 2021, 6, 116–126. [Google Scholar] [CrossRef]
  8. Peter, E.L.; Rumisha, S.F.; Mashoto, K.O.; Minzi, O.M.; Mfinanga, S. Efficacy of Standardized Extract of Hibiscus sabdariffa L. (Malvaceae) in Improving Iron Status of Adults in Malaria Endemic Area: A Randomized Controlled Trial. J. Ethnopharmacol. 2017, 209, 288–293. [Google Scholar] [CrossRef] [PubMed]
  9. Nwachukwu, D.C.; Aneke, E.I.; Nwachukwu, N.Z.; Azubike, N.; Obika, L.F.O. Thirst Perception in Mild to Moderate Hypertensive Nigerians Treated with Aqueous Extract of Hibiscus sabdariffa L. Afr. J. Pharm. Pharmacol. 2016, 10, 403–410. [Google Scholar] [CrossRef]
  10. Talal Al-Malki, A.; Abbas Ahmed Sindi, H.; Hussain Al-Qahtani, M. Regulation of CD36 Gene Expression by Hibiscus sabdariffa Tea Extracts to Affect the Atherosclerosis Biomarkers in Saudi Women. J. Food Nutr. Res. 2021, 9, 45–49. [Google Scholar] [CrossRef]
  11. Islam, M. Food and Medicinal Values of Roselle (Hibiscus sabdariffa L. Linne Malvaceae) Plant Parts: A Review. Open J. Nutr. Food Sci. 2019, 1, 14–20. [Google Scholar]
  12. Montalvo-González, E.; Villagrán, Z.; González-Torres, S.; Iñiguez-Muñoz, L.E.; Isiordia-Espinoza, M.A.; Ruvalcaba-Gómez, J.M.; Arteaga-Garibay, R.I.; Acosta, J.L.; González-Silva, N.; Anaya-Esparza, L.M. Physiological Effects and Human Health Benefits of Hibiscus sabdariffa: A Review of Clinical Trials. Pharmaceuticals 2022, 15, 464. [Google Scholar] [CrossRef]
  13. Sindi, H.A.; Marshall, L.J.; Morgan, M.R.A. Comparative Chemical and Biochemical Analysis of Extracts of Hibiscus sabdariffa. Food Chem. 2014, 164, 23–29. [Google Scholar] [CrossRef]
  14. Cisse, M.; Vaillant, F.; Acosta, O.; Claudie, D.M.; Dornier, M. Thermal Degradation Kinetics of Anthocyanins from Blood Orange, Blackberry, and Roselle Using the Arrhenius, Eyring, and Ball Models. J. Agric. Food Chem. 2009, 57, 6285–6291. [Google Scholar] [CrossRef]
  15. Wong, S.P.; Leong, L.P.; William Koh, J.H. Antioxidant Activities of Aqueous Extracts of Selected Plants. Food Chem. 2006, 99, 775–783. [Google Scholar] [CrossRef]
  16. Oboh, G.; Rocha, J.B.T. Antioxidant and Neuroprotective Properties of Sour Tea (Hibiscus sabdariffa, Calyx) and Green Tea (Camellia sinensis) on Some pro-Oxidant-Induced Lipid Peroxidation in Brain In Vitro. Food Biophys. 2008, 3, 382–389. [Google Scholar] [CrossRef]
  17. Farombi, E.O.; Fakoya, A. Free Radical Scavenging and Antigenotoxic Activities of Natural Phenolic Compounds in Dried Flowers of Hibiscus sabdariffa L. Mol. Nutr. Food Res. 2005, 49, 1120–1128. [Google Scholar] [CrossRef] [PubMed]
  18. Mohd-Esa, N.; Hern, F.S.; Ismail, A.; Yee, C.L. Antioxidant Activity in Different Parts of Roselle (Hibiscus sabdariffa L.) Extracts and Potential Exploitation of the Seeds. Food Chem. 2010, 122, 1055–1060. [Google Scholar] [CrossRef]
  19. Amin, A.; Hamza, A.A.; Kambal, A.; Daoud, S. Herbal Extracts Counteract Cisplatin-Mediated Cell Death in Rat Testis. Asian J. Androl. 2008, 10, 291–297. [Google Scholar] [CrossRef] [PubMed]
  20. Raj, B.; John, S.; Chandrakala, V.; Kumari, G.H. Green Extraction Techniques for Phytoconstituents from Natural Products. In Medicinal Plants; Kumar, S., Ed.; IntechOpen: Rijeka, Croatia, 2022. [Google Scholar]
  21. Picot-Allain, C.; Mahomoodally, M.F.; Ak, G.; Zengin, G. Conventional versus Green Extraction Techniques—A Comparative Perspective. Curr. Opin. Food Sci. 2021, 40, 144–156. [Google Scholar] [CrossRef]
  22. Romano, R.; De Luca, L.; Aiello, A.; Rossi, D.; Pizzolongo, F.; Masi, P. Bioactive Compounds Extracted by Liquid and Supercritical Carbon Dioxide from Citrus Peels. Int. J. Food Sci. Technol. 2022, 57, 3826–3837. [Google Scholar] [CrossRef]
  23. Putra, N.R.; Yustisia, Y.; Heryanto, R.B.; Asmaliyah, A.; Miswarti, M.; Rizkiyah, D.N.; Yunus, M.A.C.; Irianto, I.; Qomariyah, L.; Rohman, G.A.N. Advancements and Challenges in Green Extraction Techniques for Indonesian Natural Products: A Review. S. Afr. J. Chem. Eng. 2023, 46, 88–98. [Google Scholar] [CrossRef]
  24. Redondo, D.; Venturini, M.E.; Luengo, E.; Raso, J.; Arias, E. Pulsed Electric Fields as a Green Technology for the Extraction of Bioactive Compounds from Thinned Peach By-Products. Innov. Food Sci. Emerg. Technol. 2018, 45, 335–343. [Google Scholar] [CrossRef]
  25. Somwongin, S.; Sirilun, S.; Chantawannakul, P.; Anuchapreeda, S.; Yawootti, A.; Chaiyana, W. Ultrasound-Assisted Green Extraction Methods: An Approach for Cosmeceutical Compounds Isolation from Macadamia integrifolia Pericarp. Ultrason. Sonochem. 2023, 92, 106266. [Google Scholar] [CrossRef]
  26. Otero, P.; Quintana, S.E.; Reglero, G.; Fornari, T.; García-Risco, M.R. Pressurized Liquid Extraction (PLE) as an Innovative Green Technology for the Effective Enrichment of Galician Algae Extracts with High Quality Fatty Acids and Antimicrobial and Antioxidant Properties. Mar. Drugs 2018, 16, 156. [Google Scholar] [CrossRef]
  27. Llompart, M.; Garcia-Jares, C.; Celeiro, M.; Dagnac, T. Microwave-Assisted Extraction. In Reference Module in Chemistry, Molecular Sciences and Chemical Engineering; Worsfold, P., Poole, C., Townshend, A., Miró, M., Eds.; Elsevier: Oxford, UK, 2018; pp. 67–77. ISBN 978-0-08-101984-9. [Google Scholar]
  28. Singh, S.; Verma, D.K.; Thakur, M.; Tripathy, S.; Patel, A.R.; Shah, N.; Utama, G.L.; Srivastav, P.P.; Benavente-Valdés, J.R.; Chávez-González, M.L.; et al. Supercritical Fluid Extraction (SCFE) as Green Extraction Technology for High-Value Metabolites of Algae, Its Potential Trends in Food and Human Health. Food Res. Int. 2021, 150, 110746. [Google Scholar] [CrossRef]
  29. Koina, I.M.; Sarigiannis, Y.; Hapeshi, E. Green Extraction Techniques for the Determination of Active Ingredients in Tea: Current State, Challenges, and Future Perspectives. Separations 2023, 10, 121. [Google Scholar] [CrossRef]
  30. Kunhermanti, D.; Mahfud, M. Optimization of Peppermint (Mentha Piperita L.) Extraction Using Solvent-Free Microwave Green Technology. Adv. Food Sci. Sustain. Agric. Agroindustrial Eng. 2023, 33–40. [Google Scholar]
  31. Hasni, S.; Riguene, H.; Rigane, G.; Ghazghazi, H.; Salem, R.B.; Cifuentes, A.; Mendiola, J.A.; Ibáñez, E. Extraction of Neuroprotective Compounds from Eucalyptus Leaves Using Green Technologies. Ternary Mixture Design. In Proceedings of the 19th European Meeting on Supercritical Fluids, Budapest, Hungary, 21–24 May 2023. [Google Scholar]
  32. Santos, L.G.; Martins, V.G. Optimization of the Green Extraction of Polyphenols from the Edible Flower Clitoria Ternatea by High-Power Ultrasound: A Comparative Study with Conventional Extraction Techniques. J. Appl. Res. Med. Aromat. Plants 2023, 34, 100458. [Google Scholar] [CrossRef]
  33. Haida, Z.; Ab Ghani, S.; Juju Nakasha, J.; Hakiman, M. Determination of Experimental Domain Factors of Polyphenols, Phenolic Acids and Flavonoids of Lemon (Citrus Limon) Peel Using Two-Level Factorial Design. Saudi J. Biol. Sci. 2022, 29, 574–582. [Google Scholar] [CrossRef]
  34. Chatzimitakos, T.; Athanasiadis, V.; Kotsou, K.; Bozinou, E.; Lalas, S.I. Response Surface Optimization for the Enhancement of the Extraction of Bioactive Compounds from Citrus limon Peel. Antioxidants 2023, 12, 1605. [Google Scholar] [CrossRef]
  35. Bozinou, E.; Lakka, A.; Poulianiti, K.; Lalas, S.; Makris, D.P. Cyclodextrins as High-Performance Green Co-Solvents in the Aqueous Extraction of Polyphenols and Anthocyanin Pigments from Solid Onion Waste. Eur. Food Res. Technol. 2021, 247, 2831–2845. [Google Scholar] [CrossRef]
  36. Shehata, E.; Grigorakis, S.; Loupassaki, S.; Makris, D.P. Extraction Optimisation Using Water/Glycerol for the Efficient Recovery of Polyphenolic Antioxidants from Two Artemisia Species. Sep. Purif. Technol. 2015, 149, 462–469. [Google Scholar] [CrossRef]
  37. Ayour, J.; Alahyane, A.; Harrak, H.; Neffa, M.; Taourirte, M.; Benichou, M. Assessment of Nutritional, Technological, and Commercial Apricot Quality Criteria of the Moroccan Cultivar “Maoui” Compared to Introduced Spanish Cultivars “Canino” and “Delpatriarca” towards Suitable Valorization. J. Food Qual. 2021, 2021, 6679128. [Google Scholar] [CrossRef]
  38. Dani, H.M.; Jagota, S.K. A New Calorimetric Technique for the Estimation of Vitamin C Using Folin Phenol Reagent. Anal. Biochem. 1982, 127, 178–182. [Google Scholar]
  39. Ghosh, P.; Priyadarshini, S.; Munshi, M.; Beula, P.; Atthoti, L.; Kruthi, G.S.; Sravan, B.S.; Irshaan, S.; Rana, S.S.; Abdullah, S. Physicochemical Characterization and Mass Modelling of Roselle (Hibiscus sabdariffa L.) Calyx and Seeds. Food Chem. Adv. 2023, 3, 100400. [Google Scholar] [CrossRef]
  40. Uddin, R.; Saha, M.R.; Subhan, N.; Hossain, H.; Jahan, I.A.; Akter, R.; Alam, A. HPLC-Analysis of Polyphenolic Compounds in Gardenia Jasminoides and Determination of Antioxidant Activity by Using Free Radical Scavenging Assays. Adv. Pharm. Bull. 2014, 4, 273–281. [Google Scholar] [CrossRef]
  41. Kuntić, V.; Pejić, N.; Mićić, S. Direct Spectrophotometric Determination of Hesperidin in Pharmaceutical Preparations. Acta Chim. Slov. 2012, 59, 436–441. [Google Scholar]
  42. Miralles, P.; Chisvert, A.; Salvador, A. Determination of Hydroxytyrosol and Tyrosol by Liquid Chromatography for the Quality Control of Cosmetic Products Based on Olive Extracts. J. Pharm. Biomed. Anal. 2015, 102, 157–161. [Google Scholar] [CrossRef]
  43. Lee, J.; Rennaker, C.; Wrolstad, R.E. Correlation of Two Anthocyanin Quantification Methods: HPLC and Spectrophotometric Methods. Food Chem. 2008, 110, 782–786. [Google Scholar] [CrossRef]
  44. Pauliuc, D.; Dranca, F.; Oroian, M. Antioxidant Activity, Total Phenolic Content, Individual Phenolics and Physicochemical Parameters Suitability for Romanian Honey Authentication. Foods 2020, 9, 306. [Google Scholar] [CrossRef]
  45. Kotsou, K.; Stoikou, M.; Athanasiadis, V.; Chatzimitakos, T.; Mantiniotou, M.; Sfougaris, A.I.; Lalas, S.I. Enhancing Antioxidant Properties of Prunus Spinosa Fruit Extracts via Extraction Optimization. Horticulturae 2023, 9, 942. [Google Scholar] [CrossRef]
  46. Pappas, V.M.; Lakka, A.; Palaiogiannis, D.; Athanasiadis, V.; Bozinou, E.; Ntourtoglou, G.; Makris, D.P.; Dourtoglou, V.G.; Lalas, S.I. Optimization of Pulsed Electric Field as Standalone “Green” Extraction Procedure for the Recovery of High Value-Added Compounds from Fresh Olive Leaves. Antioxidants 2021, 10, 1554. [Google Scholar] [CrossRef] [PubMed]
  47. Athanasiadis, V.; Chatzimitakos, T.; Bozinou, E.; Kotsou, K.; Palaiogiannis, D.; Lalas, S.I. Maximizing the Extraction of Bioactive Compounds from Diospyros kaki Peel through the Use of a Pulsed Electric Field and Ultrasound Extraction. Biomass 2023, 3, 422–440. [Google Scholar] [CrossRef]
  48. Wardy, W.; Saalia, F.K.; Steiner-Asiedu, M.; Budu, A.S.; Sefa-Dedeh, S. A Comparison of Some Physical, Chemical and Sensory Attributes of Three Pineapple (Ananas comosus) Varieties Grown in Ghana. Afr. J. Food Sci. 2009, 3, 22–25. [Google Scholar]
  49. Amaya-Cruz, D.; Peréz-Ramírez, I.F.; Pérez-Jiménez, J.; Nava, G.M.; Reynoso-Camacho, R. Comparison of the Bioactive Potential of Roselle (Hibiscus sabdariffa L.) Calyx and Its by-Product: Phenolic Characterization by UPLC-QTOF MSE and Their Anti-Obesity Effect in Vivo. Food Res. Int. 2019, 126, 108589. [Google Scholar] [CrossRef]
  50. Singh, M.; Thrimawithana, T.; Shukla, R.; Adhikari, B. Extraction and Characterization of Polyphenolic Compounds and Potassium Hydroxycitrate from Hibiscus sabdariffa. Future Foods 2021, 4, 100087. [Google Scholar] [CrossRef]
  51. dos Santos Martins, D.R.; Lescano, C.H.; Justo, A.F.O.; Vicente, J.M.; Santos, S.H.S.; Aguilar, C.M.; Borges, A.; Pires de Oliveira, I.; Sanjinez-Argandoña, E.J. Effect of Different Extraction Methods on Anthocyanin Content in Hibiscus sabdariffa L. and Their Antiplatelet and Vasorelaxant Properties. Plant Foods Hum. Nutr. 2023, 78, 342–350. [Google Scholar] [CrossRef]
  52. Amer, S.A.; Al-Khalaifah, H.S.; Gouda, A.; Osman, A.; Goda, N.I.A.; Mohammed, H.A.; Darwish, M.I.M.; Hassan, A.M.; Mohamed, S.K.A. Potential Effects of Anthocyanin-Rich Roselle (Hibiscus sabdariffa L.) Extract on the Growth, Intestinal Histomorphology, Blood Biochemical Parameters, and the Immune Status of Broiler Chickens. Antioxidants 2022, 11, 544. [Google Scholar] [CrossRef]
  53. Li, S.; Li, W.; Wang, C.; Wu, R.; Yin, R.; Kuo, H.-C.; Wang, L.; Kong, A.-N. Pelargonidin Reduces the TPA Induced Transformation of Mouse Epidermal Cells -Potential Involvement of Nrf2 Promoter Demethylation. Chem. Biol. Interact. 2019, 309, 108701. [Google Scholar] [CrossRef]
  54. Karasawa, K.; Otani, H. Anti-Allergic Properties of a Matured Fruit Extract of the Date Palm Tree (Phoenix dactylifera L.) in Mite-Sensitized Mice. J. Nutr. Sci. Vitaminol. 2012, 58, 272–277. [Google Scholar] [CrossRef] [PubMed]
  55. Wang, H.; Cao, G.; Prior, R.L. Oxygen Radical Absorbing Capacity of Anthocyanins. J. Agric. Food Chem. 1997, 45, 304–309. [Google Scholar] [CrossRef]
  56. Hapsari, B.W.; Manikharda; Setyaningsih, W. Methodologies in the Analysis of Phenolic Compounds in Roselle (Hibiscus sabdariffa L.): Composition, Biological Activity, and Beneficial Effects on Human Health. Horticulturae 2021, 7, 35. [Google Scholar] [CrossRef]
  57. Wang, J.; Cao, X.; Jiang, H.; Qi, Y.; Chin, K.L.; Yue, Y. Antioxidant Activity of Leaf Extracts from Different Hibiscus sabdariffa Accessions and Simultaneous Determination Five Major Antioxidant Compounds by LC-Q-TOF-MS. Molecules 2014, 19, 21226–21238. [Google Scholar] [CrossRef] [PubMed]
  58. Santana-Gálvez, J.; Cisneros-Zevallos, L.; Jacobo-Velázquez, D.A. Chlorogenic Acid: Recent Advances on Its Dual Role as a Food Additive and a Nutraceutical against Metabolic Syndrome. Molecules 2017, 22, 358. [Google Scholar] [CrossRef]
  59. Haider, K.; Haider, M.R.; Neha, K.; Yar, M.S. Free Radical Scavengers: An Overview on Heterocyclic Advances and Medicinal Prospects. Eur. J. Med. Chem. 2020, 204, 112607. [Google Scholar] [CrossRef]
  60. Li, X.; Huang, W.; Tan, R.; Xu, C.; Chen, X.; Li, S.; Liu, Y.; Qiu, H.; Cao, H.; Cheng, Q. The Benefits of Hesperidin in Central Nervous System Disorders, Based on the Neuroprotective Effect. Biomed. Pharmacother. 2023, 159, 114222. [Google Scholar] [CrossRef]
  61. Kumar, S.S.; Manoj, P.; Shetty, N.P.; Giridhar, P. Effect of Different Drying Methods on Chlorophyll, Ascorbic Acid and Antioxidant Compounds Retention of Leaves of Hibiscus sabdariffa L. J. Sci. Food Agric. 2015, 95, 1812–1820. [Google Scholar] [CrossRef]
  62. Cooperstone, J.L.; Schwartz, S.J. Recent Insights Into Health Benefits of Carotenoids. In Handbook on Natural Pigments in Food and Beverages; Carle, R., Schweiggert, R.M., Eds.; Woodhead Publishing Series in Food Science, Technology and Nutrition; Woodhead Publishing: Cambridge, UK, 2016; pp. 473–497. ISBN 978-0-08-100371-8. [Google Scholar]
  63. Black, H.S.; Boehm, F.; Edge, R.; Truscott, T.G. The Benefits and Risks of Certain Dietary Carotenoids That Exhibit Both Anti- and Pro-Oxidative Mechanisms-A Comprehensive Review. Antioxidants 2020, 9, 264. [Google Scholar] [CrossRef]
  64. Doseděl, M.; Jirkovský, E.; Macáková, K.; Krčmová, L.K.; Javorská, L.; Pourová, J.; Mercolini, L.; Remião, F.; Nováková, L.; Mladěnka, P. Vitamin c—Sources, Physiological Role, Kinetics, Deficiency, Use, Toxicity, and Determination. Nutrients 2021, 13, 615. [Google Scholar] [CrossRef]
  65. Yin, X.; Chen, K.; Cheng, H.; Chen, X.; Feng, S.; Song, Y.; Liang, L. Chemical Stability of Ascorbic Acid Integrated into Commercial Products: A Review on Bioactivity and Delivery Technology. Antioxidants 2022, 11, 153. [Google Scholar] [CrossRef]
  66. Maganha, E.G.; da Costa Halmenschlager, R.; Rosa, R.M.; Henriques, J.A.P.; de Paula Ramos, A.L.L.; Saffi, J. Pharmacological Evidences for the Extracts and Secondary Metabolites from Plants of the Genus Hibiscus. Food Chem. 2010, 118, 1–10. [Google Scholar] [CrossRef]
  67. Enedina, R.; Luisa, M.; Iván, E.; Antonio, J.; Teresa, M. Free Radical Scavenging Properties and Their Relationship with Bioactive Compounds Content of Dehydrated Calyces of Roselle (Hibiscus sabdariffa L.). Afr. J. Agric. Res. 2015, 10, 1203–1210. [Google Scholar] [CrossRef]
  68. Wong, P.-K.; Yusof, S.; Ghazali, H.M.; Che Man, Y.B. Physico-chemical Characteristics of Roselle (Hibiscus sabdariffa L.). Nutr. Food Sci. 2002, 32, 68–73. [Google Scholar] [CrossRef]
Figure 1. The extraction process of HS (Hibiscus sabdariffa) dry flowers using different techniques (ST: stirring, PEF: pulsed electric field, US: ultrasound).
Processes 12 00581 g001
Figure 2. Representative HPLC chromatogram at 280 nm and 320 nm of an HS extract showcasing the identified polyphenolic compounds. 1: 3-Hydroxytyrosol; 2: Pelargonin chloride; 3: Chlorogenic acid; 4: Rutin; 5: Luteolin-7-glucoside; 6: Hesperidin.
Processes 12 00581 g002
Figure 3. The optimized extraction of HS extracts is depicted in 3D graphs illustrating the influence of the process variables on the response (Total polyphenol content—TPC, mg GAE/g). Plot (A) shows the interaction between X1 and X2; plot (B) demonstrates the interaction between X1 and X3; plot (C) illustrates the interaction between X1 and X4; plot (D) showcases the interaction between X2 and X3; plot (E) displays the interaction between X2 and X4; plot (F) represents the interaction between X3 and X4.
Processes 12 00581 g003
Figure 4. Pareto plots of transformed estimates for TPC (A), TAC (B), FRAP (C), DPPH (D), TCC (E), and AAC (F) assays. A reference gold line is drawn on the plot to indicate the level of significance (p < 0.05).
Processes 12 00581 g004
Figure 5. Chemical structures of all the polyphenolic compounds identified in HS extracts.
Processes 12 00581 g005
Figure 6. Chemical structure of β-carotene and ascorbic acid.
Processes 12 00581 g006
Figure 7. Principal component analysis (PCA) for the measured variables. Each X variable is presented with a blue color.
Processes 12 00581 g007
Figure 8. Multivariate correlation analysis of measured variables.
Processes 12 00581 g008
Figure 9. Partial least squares (PLS) prediction profiler of each variable and desirability function with extrapolation control for the optimization of HS extracts.
Processes 12 00581 g009
Table 1. The actual and coded levels of the independent variables were used to optimize the process.
Independent
Variables
Code UnitsCoded Variable Level
12345
TechniqueX1STPEF + STUS + STPEF + US + ST
CEtOH (%, v/v)X20255075100
t (min)X3306090120150
T (°C)X42035506580
Table 2. Experimental results for the four explored independent variables and the corresponding responses of the dependent variable.
Design PointIndependent
Variables
Responses
X1X2X3X4TPC 1TAC 2FRAP 3DPPH 4TCC 5AAC 6
1313425.30341.08295.60164.82710.02381.32
2321329.62604.39477.68243.42763.65480.75
3234321.29543.96226.20119.58921.84441.42
4245412.27347.47149.64106.69708.51327.26
535423.90135.5382.7266.59256.92267.87
6414532.33285.56354.95105.94578.57448.03
7423134.43465.42358.60108.00690.92401.23
8133229.42578.07274.4181.21847.53484.04
9144123.38398.22301.9182.18689.48386.66
10151412.75162.97216.5232.14231.75303.81
11112332.26468.95386.91119.12545.52461.45
12125535.97430.21487.51123.12594.45487.20
13432437.82539.70467.69135.80768.40507.19
14342524.51479.91472.39109.09450.20507.44
1525356.6080.51100.2425.01215.26239.33
16211114.78444.93155.15102.84428.31351.04
17222223.50610.42269.15137.85769.89480.28
18335122.39599.57474.49125.81750.33481.11
19441225.11361.03265.0876.82427.64393.68
2045538.66145.46111.721.44176.06298.24
1 Total polyphenol content (TPC) in mg gallic acid equivalents (GAE)/g dw; 2 Total anthocyanin content (TAC) in μg cyanidin equivalents (CyE)/g dw; 3 Ferric reducing antioxidant power (FRAP) in μmol ascorbic acid equivalents (AAE)/g dw; 4 2,2-Diphenyl-1-picrylhydrazyl (DPPH) in μmol AAE/g dw; 5 Total carotenoid content (TCC) in μg β-carotene equivalents (CtE)/g dw; 6 Ascorbic acid content (AAC) in mg/100 g dw.
Table 3. Mathematical models developed through RSM were employed to optimize the extraction of HS. These models included only significant terms.
ResponsesSecond-Order Polynomial Equations (Models)R2
Predicted
R2
Adjusted
p-ValueEquation
TPC 1Y = 17.33 − 18.64X1 + 15.67X2 + 1.46X3 + 6.2X4 + 4.43X12 − 3.31X22 − 0.53X32 + 1.0X42 + 0.09X1X2 − 0.06X1X3 − 1.12X1X4 + 1.01X2X3 − 1.22X2X4 − 1.1X3X40.97380.90040.0050(2)
TAC 2Y = 294.78 − 66.1X1 + 466.69X2 − 128.22X3 + 14.9X4 − 16.9X12 − 93.75X22 + 2.13X32 + 8.85X42 + 15.6X1X2 + 28.93X1X3 − 0.13X1X4 + 11.21X2X3 − 12.1X2X4 − 8.57X3X40.97950.92210.0027(3)
FRAP 3Y = 71.14 − 120.69X1 + 316.19X2 − 151.96X3 + 120.44X4 + 26.76X12 − 60.63X22 + 13.76X32 + 44.87X42 + 8.92X1X2 + 15.58X1X3 − 31.57X1X4 + 32.22X2X3 − 40.81X2X4 − 41.59X3X40.96520.86760.0097(4)
DPPH 4Y = −192.21 + 141.65X1 + 107.58X2 − 79.76X3 + 107.46X4 − 14.19X12 − 18.06X22 + 3.26X32 + 3.36X42 − 10.9X1X2 − 0.22X1X3 − 13.91X1X4 + 20.1X2X3 − 17.83X2X4 − 7.57X3X40.96260.85800.0114(5)
TCC 5Y = −458.87 + 164.06X1 + 344.69X2 + 251.8X3 + 215.7X4 − 10.31X12 − 67.16X22 − 6.52X32 − 55.52X42 − 35.63X1X2 − 31.84X1X3 + 26.19X1X4 − 10.7X2X3 + 24.33X2X4 − 13.78X3X40.96360.86180.0107(6)
AAC 6Y = 376.88 − 137.83X1 + 313.01X2 − 95.12X3 + 4.76X4 + 0.03X12 − 54.98X22 − 1.87X32 + 18.3X42 + 17.99X1X2 + 28.4X1X3 − 2.75X1X4 + 5.54X2X3 − 22.93X2X4 − 4.29X3X40.97170.89250.0059(7)
1 TPC: Total polyphenol content; 2 TAC: Total anthocyanin content; 3 FRAP: Ferric reducing antioxidant power; 4 DPPH: 2,2-Diphenyl-1-picrylhydrazyl; 5 TCC: Total carotenoid content; 6 AAC: Ascorbic acid content.
Table 4. Maximum predicted responses and optimum extraction conditions for the dependent variables.
ResponsesOptimal Conditions
Maximum Predicted ResponseTechnique
(X1)
C (%, v/v)
(X2)
t (min)
(X3)
T (°C)
(X4)
TPC (mg GAE/g dw)41.17 ± 7.73PEF + US + ST (4)25 (2)60 (2)65 (4)
TAC (μg CyE/g dw)655.67 ± 113.56US + ST (3)50 (3)30 (1)65 (4)
FRAP (μmol AAE/g dw)603.11 ± 121.21US + ST (3)50 (3)30 (1)65 (4)
DPPH (μmol AAE/g dw)243.42 ± 46.76US + ST (3)25 (2)30 (1)50 (3)
TCC (μg CtE/g dw)944.36 ± 194.3ST (1)50 (3)120 (4)50 (3)
AAC (mg/100 g dw)561.11 ± 67.68US + ST (3)50 (3)30 (1)65 (4)
Table 5. Highest desirability for all variables using the partial least squares (PLS) prediction profiler under the optimal extraction conditions (X1:3, X2:2, X3:1, X4:5).
VariablesPLS Model ValuesExperimental Values
TPC (mg GAE/g dw)36.5640.49 ± 2.67
TAC (μg CyE/g dw)681.96642.18 ± 34.68
FRAP (μmol AAE/g dw)690.18697.1 ± 23.7
DPPH (μmol AAE/g dw)227.12216.14 ± 14.91
TCC (μg CtE/g dw)781.14676.86 ± 41.29
AAC (mg/100 g dw)595.96536.05 ± 15.55
Table 6. Polyphenolic compounds extracted under optimal conditions (X1:3, X2:2, X3:1, X4:5).
Polyphenolic CompoundOptimal Extract (mg/g dw)
3-Hydroxytyrosol1.33 ± 0.05
Pelargonin chloride34.63 ± 1.94
Chlorogenic acid1.27 ± 0.09
Rutin0.68 ± 0.03
Luteolin-7-glucoside0.54 ± 0.03
Hesperidin0.98 ± 0.06
Total identified39.44 ± 2.20
Disclaimer/Publisher’s Note: The statements, opinions and data contained in all publications are solely those of the individual author(s) and contributor(s) and not of MDPI and/or the editor(s). MDPI and/or the editor(s) disclaim responsibility for any injury to people or property resulting from any ideas, methods, instructions or products referred to in the content.

