
Point Source Capture of Methane Using Ionic Liquids in Packed Bed Absorbers/Strippers: Experimental and Modelling


Centre for Innovative Energy Technologies, The University of Newcastle, University Drive, Callaghan, NSW 2308, Australia
*
Author to whom correspondence should be addressed.
Processes 2024, 12(3), 596; https://doi.org/10.3390/pr12030596
Submission received: 13 February 2024
/
Revised: 12 March 2024
/
Accepted: 13 March 2024
/
Published: 16 March 2024
(This article belongs to the Special Issue Applications of Ionic Liquids and Deep Eutectic Solvents in Separation Processes for the Circular Economy)
Abstract
:Fugitive methane emissions from the mining industry, particularly so-called ventilation air methane (VAM) emissions, are considered among the largest sources of greenhouse gas (GHG) emissions. VAM emissions not only contribute to the global warming but also pose a significant hazard to mining safety due to the risk of accidental fires and explosions. This research presents a novel approach that investigates the capture of CH4 in a controlled environment using 1-butyl-3-methylimidazolium bis (trifluoromethylsulfonyl) imide [BMIM][TF2N] ionic liquid (IL), which is an environmentally friendly solvent. The experimental and modelling results confirm that CH4 absorption in [BMIM][TF2N], in a packed column, can be a promising technique for capturing CH4 from point sources, particularly the outlet streams of ventilation shafts in underground coal mines, which typically accounts for <1% v/v of the flow. This study assessed the effectiveness of CH4 removal in a packed bed column by testing various factors such as absorption temperature, liquid and gas flow rates, flow pattern, packing size, desorption temperature, and desorption pressure. According to the optimisation results, the following parameters can be used to achieve a CH4 removal efficiency of 23.8%: a gas flow rate of 0.1 L/min, a liquid flow rate of 0.5 L/min, a packing diameter of 6 mm, and absorption and desorption temperatures of 303 K and 403.15 K, respectively. Additionally, the experimental results indicated that ILs could concentrate CH4 in the simulated VAM stream by approximately 4 fold. It is important to note that the efficiency of CH4 removal was determined to be 3.5-fold higher compared to that of N2. Consequently, even though the VAM stream primarily contains N2, the IL used in the same stream shows a notably superior capacity for removing CH4 compared to N2. Furthermore, CH4 absorption with [BMIM][TF2N] is based on physical interactions, leading to reduced energy requirements for regeneration. These findings validate the method’s effectiveness in mitigating CH4 emissions within the mining sector and enabling the concentration of VAM through a secure and energy-efficient procedure.
1. Introduction
Methane (CH4), as the primary component of natural gas, is considered as a potential driver of global climate change that can damage the ozone layer. CH4 is capable of trapping heat up to 25-fold more than carbon dioxide (CO2), which contributes to global warming [1]. By 2020, global anthropogenic CH4 emissions are estimated at 9.39 billion metric tons of CO2 equivalent. Approximately 54% of these emissions come from the five sources targeted by the Global Methane Initiative (GMI): coal mines, oil and natural CH4 systems, agriculture (manure management), municipal solid waste (MSW), and wastewater [2]. Dilute emissions of CH4 (concentration 0.1% to 1% v/v) from coal mining are known as ventilation air methane (VAM). VAM emissions not only add to the issue of global warming but also pose a significant hazard to mining safety due to the high risk of accidental fires and explosions. Approximately 7% of global CH4 emissions stem from VAM sources, equivalent to 14 billion cubic meters annually. Therefore, it is unsurprising that VAM removal is a priority for 2050 zero emissions goals [3,4].
Over the past two decades, many efforts have been made to develop technologies for CH4 removal from VAM [5,6,7]. Most of these technologies—for instance, those based on thermal oxidation—operate at temperatures between 650 °C and 1100 °C, which are well above the auto-ignition temperature of CH4 [7,8,9,10,11]. High operating temperatures in mines pose safety risks and increase system complexity and costs in capital and operation. The adsorption technique using solid adsorbents is another method of removing gas species from flue gas. However, high-efficiency CH4 separation from a N2-rich stream using solid adsorbents is a challenging issue because of the small difference in kinetic diameter and polarizability between CH4 and N2 [12]. Thus, exploring new types of adsorbents that can efficiently separate CH4 from N2 is of great importance. Korman et al. [13] investigated the CH4 storage capacities of different porous materials including structurally diverse metal–organic frameworks (MOFs), porous coordination cages (PCCs), porous organic cages (POCs), and a zeolite for gas storage application under different conditions. Their research evaluates the gravimetric capacity of various porous materials for gas storage applications. Chen et al. [14] carried out an experimental study of CH4 adsorption to investigate the mechanism of shale gas adsorption—shale gas mainly consists of CH4. Although the results of these investigations show that porous solid adsorbents can have a high level of CH4 uptake, the selectivity of CH4 over N2 is important for the application of VAM abatement due to the high concentration of N2 in the VAM stream. Furthermore, adsorption/desorption processes usually have a higher energy requirement for regeneration of the adsorbents compared to absorption/desorption techniques, leading to increased energy consumption and operational costs. In addition, adsorption/desorption processes include more complex operation procedures and control systems compared to absorption/desorption techniques [15,16].
Hence, exploring other methods for point source capture of CH4 is essential. One such method is the use of ionic liquid (IL) solvents with high thermal stability, low vapor pressure, and tunable physicochemical properties, which are considered environmentally friendly alternatives to conventional organic solvents. Despite its importance, ILs have been primarily studied in recent times by several research groups worldwide for CO2 capture [17,18,19,20,21], and there is a general lack of interest in using ILs for CH4 capture. This lack of interest originates from three somewhat unfavorable perceptions, namely: (i) relatively high viscosities of ILs compared with other solvents [22,23,24], (ii) low solubility of gaseous forms of hydrocarbons, including CH4, in ILs [25,26,27], and (iii) high synthesis costs.
However, it has been well established in the literature that the high viscosity of ILs can be adjusted either by operating at higher temperatures [28,29] or by properly selecting its constituent anion and cation [30,31,32]. The high cost can be managed by cyclic operation through the regeneration of ILs as part of the CH4 removal process that is aided greatly by the very low pressure and, consequently, loss of the IL. This approach, which has been studied for over 20 years [19,33], relies on increasing the operating temperature and reducing the operating pressure of the process. Hydrocarbon solubility can be improved by using ILs with long alkyl chains in their ion structures [25,27]. Experimental studies have proven that there is a remarkable capacity for 1-butyl-3-methylimidazolium bis(trifluoromethylsulfonyl)imide ([BMIM][TF2N]) to dissolve CH4 gas [34]. Chen et al. [34] determined the solubility of CH4, CO2, and nitrous oxide gases in various ILs and the solubility of [BMIM]+-based ILs and then [TF2N]−-based ILs were studied. The results showed that, unlike CO2 solubility in ILs, the cation has a more significant effect on CH4 solubility than the anion. Mortazavi-Manesh et al. [35] provided a thermodynamic method, a conductor-like screening model for realistic solvent (COSMO-RS), that is based on the molecular interactions such as van der Waals and hydrogen-bonding [36,37] for calculating CH4 solubility in various ILs. The solubility of CH4 in [BMIM][TF2N] is between 0.035 and 0.04 (mole fractions), which is greater than the solubility of CH4 in most of the other cation and anion pairs [35]. In addition to solubility, parameters such as viscosity, surface tension, and wetted surface area of packing must be considered when selecting the appropriate solvent for CH4 capture in terms of applicability. These parameters play an important role in the utilisation of solvents in the scrubber system. Low surface tension and viscosity of [BMIM][TF2N] compared to most other ILs lead to a greater packing wetted surface area, which can contribute to improving CH4 capture using the absorption technique [38,39,40,41,42,43,44].
Although [BMIM][TF2N] seems to be a suitable IL for CH4 capture, the presence and solubility of other gases (e.g., nitrogen (N2)) should also be considered in selecting a suitable IL for lean CH4 capture. Based on the Monte Carlo simulations, the solubility of CH4 is greater than N2 for [BMIM][TF2N], which makes it a favorable solvent for CH4 removal from lean CH4 sources such as VAM emissions [45].
Previous studies may need to be explored to learn more about the potential technologies, scalability and applicability of the technologies, using liquid absorbents like ILs, recyclability of the absorbent/adsorbents, and economic feasibility for capturing low-concentration CH4 from the VAM stream. This investigation is an attempt to narrow down these knowledge gaps and address some of them to advance the field of VAM abatement and adoption of effective mitigation strategies in the mining industry. To the best of our knowledge, the use of ILs for VAM abatement in a continuous absorption/desorption packed column system with random Raschig rings has not been extensively studied. For this purpose, a CH4 absorption packed column and an agitated desorption vessel were designed, developed, and tested in a continuous absorption/desorption process in the current study. Thus, this paper is the first comprehensive study on the absorption of low concentrations of CH4 from a simulated VAM stream using IL in a continuous absorption/desorption process. The experimental work investigated a wide range of controlling factors, including the type of IL, absorption temperature (303.15 to 363.15 K), liquid flow rate (0.1 to 0.5 L/min), gas flow rate (0.1 to 0.6 L/min), packing size (6 mm and 10 mm) of the absorption unit, and desorption temperature (353.15 to 433.15 K) and pressure (−0.005 to 0.02 MPa) of the desorption unit. Furthermore, mathematical modelling and optimisation were carried out to obtain the operating conditions that could maximise the CH4 removal efficiency.
2. Methodology and Technique
The broad objectives of this study were achieved through a comprehensive combination of experimental and modelling approaches. The experimental approach, including the description of the experimental apparatus and the materials used in this work, is presented below. Detailed explanations of the modelling techniques employed in this study are provided in Section 3.
2.1. Material
1-Butyl-3-methylimidazolium bis(trifluoromethylsulfonyl)imide ([BMIM][TF2N]) with a purity greater than 99% was purchased from the io.li.tec (Ionic Liquid Technologies, Heilbronn, Germany). The feed gas with a typical composition of VAM, including CH4:N2 = 1:99 (v/v), was purchased from Coregas, Yennora, Australia.
2.2. Experimental Setup
The schematic diagram of the experimental setup is shown in Figure 1. The setup consists of two central units: (i) the absorption unit and (ii) the desorption unit. The absorption unit is a packed column, where CH4 is removed from a simulated VAM stream by the IL under investigation, and the desorption unit is a regeneration vessel, where the rich IL is restored. In the absorption unit, the feed gas is introduced to the packed column from either the top or bottom of the column, based on the desired flow pattern (co-current or counter-current). The liquid enters the top of the column and is in contact with gas on the surface of the packing. Thus, the mass transfer between the liquid and gas phases is carried out inside the column. The rich IL leaves the column from the bottom and goes into the regeneration vessel, which is equipped with a heating coil and stirrer to recover the IL.
2.2.1. The Absorption Unit
The critical part of the absorption process is a packed column that is designed and made out of glass and its equipment size and experimental conditions are illustrated in Table 1. The experimental conditions are chosen based on the available lab-scale data from the literature [19,46], as well as consideration of some constraints faced during the experiments, which will be further discussed in the followings.
The absorption column was randomly packed with glass Raschig rings in two sizes to improve the gas and liquid contact area with a specific surface area and void fraction. Another cylindrical column surrounds this glass-made packed column to serve as a heat jacket, and their annular gap was filled with water, effectively constituting a water jacket, to achieve the desired absorption temperature (303.15–363.15 K). The temperature of the water jacket was controlled using an external thermostatic control unit (TXF200-18, LabGear, Washington, DC, USA) with a capacity of 18 L, a maximum flow rate of 22 L/min, and a temperature range of 273.15–473.15 K. This water bath circulates the water around the absorption column to maintain the absorption temperature during the process. Accordingly, the absorption temperature can be adjusted within the range of 303.15–363.15 K based on the experimental conditions.
The IL is pumped from the reservoir (regeneration vessel) into the absorption column using a gear pump (Ismatec gear pump MCP-Z, Cole-Parmer, Vernon Hills, IL, USA) with the speed range of 60–6000 rpm at a specific flow rate (in the 0.1–0.5 L/min range). It should be noted that this specific liquid flow range was chosen due to some constraints encountered during experiments, including the viscosity of IL, the height of the absorption column (pump head), and the high temperature of the IL exiting the regeneration vessel. Given this constraint, the optimal pump for the intended application was the selected gear pump capable of accommodating flow rates within this range. To ensure uniform dispersion of the liquid across the packing, a liquid distributor is used to distribute the liquid from the top. Prior to entering the absorption column, the temperature of the hot liquid outlet from the reservoir (regeneration vessel) is adjusted with a cooled water bath from Labec. This hot IL passes through a series of coils within the cooled water bath to maintain its temperature.
The setup was preheated and operated at the condition of interest for each experiment until the IL temperature stabilises, which typically takes approximately an hour. The absorption column is then ready to receive a mixture of CH4 and N2 at the desired flow rate, which is controlled by a mass flow controller from Bronkhorst. Within the scope of this project, the selected gas flow rate is between 0.1 and 0.6 L/min chosen based on the available lab-scale data from the literature [19,46]. Moreover, achieving a gas flow rate of less than 0.1 L/min proved to be difficult due to operational constraints. These constraints include the limited flow range of the available mass flow controller for CH4 in the laboratory-scale setup. In this setup, the feed gas can be contacted either co-currently or counter-currently with fresh IL on the packing surface. The temperature of the liquid inlet, liquid outlet, and inside the absorption column itself was measured and monitored by three K-type thermocouples. In this process, the treated gas leaves the absorber from the top or bottom of the absorption column, while the rich IL is collected in a reservoir (regeneration vessel) under the absorption column. The concentration of outlet CH4 from the absorption column was analysed with a gas chromatograph (Micro-GC 490, Agilent, Santa Clara, CA, USA). The CH4 concentration of the treated gas coming from the outlet of the absorption column was measured by Micro-GC once the experiment reached a steady-state condition. The absorption temperature was adjusted in the 303.15–363.15 K temperature range at atmospheric pressure. The absorption unit is shown in Figure 2.
2.2.2. The Desorption Unit
The desorption process is carried out continuously after each absorption cycle to provide fresh IL for the absorber (Figure 3). The central part of the desorption unit is a stainless-steel vessel located underneath the absorption column to recover the rich IL. When the rich IL leaves the absorption column and goes to the regeneration vessel, it is heated using a hot oil derived from an external heat source (Oil bath, TXF200-5, LabGear). The capacity of this oil bath is 5 L with a maximum flow rate of 22 L/min and a temperature range of 298.15–473.15 K. This oil bath circulates the water inside the coils within the desorption vessel to increase the rich IL temperature for desorption. The regeneration vessel is also equipped with a stirrer to achieve better heat transfer inside the vessel and to accelerate CH4 desorption from the rich IL. The regeneration vessel is also equipped with a vacuum pump to create a vacuum condition inside the vessel to remove the desorbed gas from the liquid phase. In other words, under normal process operation conditions, the vacuum pump continuously removes desorbed gas from the regeneration vessel to create negative pressure inside the vessel. The desorption temperature is controlled and adjusted using the temperature controller of the oil bath. The regeneration temperature can be adjusted between 353.15 and 433.15 K, and the pressure can be reduced to −0.02 MPa using a vacuum pump. In the desorption unit, the CH4-lean IL from the bottom of the regeneration vessel is pumped out of the vessel, and after cooling, it returns to the top of the absorption column. To cool down the liquid before returning to the absorption column, the hot liquid passes through a coiled tube submerged in a cooling water bath to reach the desired temperature for the absorption process. One thermocouple (K-Type) and one pressure transducer were installed on the vessel to monitor the operational parameter. To analyse the outlet gas from the stripper, its concentration was measured using a sample bag (7″ × 7″, Restek, Centre County, PA, USA) and Micro-GC (Micro-GC 490, Agilent).
2.3. Method of Calculating Removal Efficiency
In this section, the method of calculating the removal efficiencies of CH4 and N2 is explained. The CH4 and N2 removal efficiencies of the absorption unit are defined using the below equations. To measure N2 removal efficiency, the outlet gas from the regeneration vessel was analysed. In this method, the space above the liquid phase inside the regeneration vessel was calculated and the gas pressure inside the vessel was recorded at the end of the experiment using a pressure transducer. The number of moles of gas molecules desorbed from the liquid phase was calculated by the ideal gas law at the desorption temperature. It was assumed that the gas phase is an ideal gas due to the low pressure (<0.05 MPa) inside the vessel. After calculating the number of moles of the desorbed gas, the number of moles of N2 was calculated using the volumetric fraction of N2 in the gas phase measured by analysing the outlet gas from the vessel using Micro-GC [47]:
where and are the inlet and outlet volume fractions of CH4 (vol%) in the gas phase, respectively. is the number of moles of N2 desorbed from the liquid phase, is the inlet gas volumetric flow rate to the absorption column , is the volumetric fraction of N2 in the inlet gas to the absorption column (%), is the time of the experiment (min), is the density of N2 at the ambient temperature, and is the molecular weight of N2 .
2.4. Error Analysis of Experimental Results
In order to obtain the reliable results, repeatability analysis is carried out. The CH4 removal efficiency from the absorption column was measured three times and the results are presented in Table 2. Since the mean is represented in all experimental result graphs, the standard error is the appropriate measurement to calculate the error bars. Moreover, the small range of standard errors that is much lower than the CH4 removal efficiencies results in high precision and accuracy of the results. Therefore, based on the error analysis outcomes, it can be concluded that tests are repeatable, and the results are reliable.
3. Modelling
This section outlines the mathematical modelling of a packed bed column for investigating mass balance and mass transfer, with a focus on CH4 absorption in an IL. A rate-based model is employed, incorporating variations in gas and liquid flow rates along the column. The model assumes a two-film theory for the CH4-IL system and accounts for the diffusion of CH4 and N2 from the gas to the liquid phase. Assumptions include steady-state operation, physical absorption without chemical reactions [48], negligible heat effects, adiabatic conditions, and isothermal behaviour. Negligible axial dispersion, liquid evaporation and diffusion into the gas phase are considered, adopting an ideal mixture approach for gas and liquid phases. As shown in Figure 4, CH4 molecules diffuse to the liquid phase by passing across the interface between the gas and liquid phases.
When describing mass transfer between the gas and liquid phases, a series approach may be used [49,50]:
It is generally assumed that there is negligible resistance to mass transfer at the interface [49]. Moreover, the mass transfer resistance in the gas phase is negligible, and the overall mass transfer coefficient is calculated using the following equation [49,50,51,52,53]:
where the overall mass transfer coefficient , is demonstrative of each component including CH4, and N2, and are the local mass transfer coefficients in the liquid and gas phases , respectively, represents Henry’s constant of each component, and indicates the chemical reaction enhancement factor in the liquid phase, defined as the ratio of the mass flux in the presence of a chemical reaction to the mass flux of the physical absorption. When the diffusion is faster in comparison with the reaction, is equal to 1, which means that the physical mechanism is dominant. Since the absorption of CH4 in [BMIM][TF2N] is controlled by the physical mechanism [48], is close to 1. Thus, the overall mass transfer coefficient can be calculated by the following equation [46]:
in which is dimensionless Henry’s constant of component in the liquid. The mass transfer coefficient in the liquid side depends on some variables such as physical properties of the IL and gas phase and the packed bed characteristics which are correlated as follows [54]:
where is the Sherwood number [54]:
where is the molecular weight of component , is the equivalent linear dimension , and is the dynamic diffusivity of gas in the liquid phase defined as [54]:
where is the standard acceleration of velocity , is the IL density , is the IL viscosity , and is the kinematic diffusion coefficient of component absorbed in the imidazolium-based ILs calculated with the correlation developed by Morgan et al. [55] for imidazolium-based ILs:
where is the viscosity of solvent in and is the molar volume of component at the normal boiling point [56]. To model the mass transfer in the element shown in Figure 4, we have to drive the total and component mole balance in the z direction according to the following equations:
In Equations (11)–(14), , , , , , , , and z stand for the overall molar flux of the component across the gas to liquid interface (, wetted surface area of the packing (, total gas molar flow rate , total liquid molar flow rate , the cross-sectional area of the packed column , the gas molar fraction of component , the liquid molar fraction of component , and column axial direction, respectively. The wetted surface area of the packing is calculated based on Equation (15) [58]:
which is the wetted surface area of the packing , is the specific surface area of the packing , is the actual velocity of liquid , is the surface tension of IL (, is the critical surface tension of the IL for a particular packing material that is 61 for the glass packing material [59], and and are the Weber and Froude dimensionless numbers, respectively.
A set of one-dimensional ordinary differential equations (1D ODE) is then acquired by Equations (11)–(14). The set of 1D ODE is made up of 7 non-linear equations, which should be solved numerically. Therefore, the 7 equations are integrated simultaneously to calculate the axial profiles of total flow rates and compositions. To do so, the boundary conditions should be known. For a counter-current absorption column, the input information of the gas and liquid at the two ends is known, which leads to a two-point boundary value (2P-BV) problem. An efficient numerical method to solve a set of 2P-BV ODE, that is the shooting method is recommended [60,61].
Accordingly, the basis of the solution plan includes the Runge–Kutta methods (ode45 solver in programming platform, MATLAB R2021a) techniques and applying the shooting method. In a typical solution plan, the length of the column is divided into 200 differential elements, which assures numerical accuracy. The lower section of the column (gas entrance) is considered the starting point (z = 0), and for the unknown variables (total liquid flow rate and the compositions in the liquid stream), values are assumed as the initial condition. Using the known values of the gas stream and the assumed quantities of a liquid stream at the column starting point, an initial value problem is generated, which can be solved by the solver. The set of equations is then solved to determine the profiles and the output condition at the column upper section (z = Length). Then, the calculated results of the liquid stream (total flow rate and compositions) are compared with the real input values, which are already known. Providing that the calculated and real conditions are identical, the solution procedure is stopped. Otherwise, the initial guesses should be corrected. Therefore, a trial-and-error procedure is applied to determine the true guesses at the absorber input and then acquire the true profiles. An interpolant equation is applied to correct the initial guesses through the trial-and-error procedure. In Equation (18), m denotes the desired variable, and b and cal. stand for the guessed value of the variable at the inlet boundary (z = 0) and the calculated one at the upper section (z = Length) [57].
This procedure continues until the differences between the final amount of the calculated (mcal.) and real values (m) approach zero.
It is assumed that the IL that enters the column is fresh, so the concentration of CH4 and N2 in the liquid phase at the column inlet equals zero.
The flow chart of the method used in MATLAB is provided in Figure 5.
4. Results and Discussion
4.1. Model Validation
To validate the proposed model, the modelling and experimental results of [BMIM][TF2N] are compared in Table 3 at different liquid flow rates. This table indicates that the maximum and minimum relative errors for CH4 removal are −8.1% and 2.5%, respectively. Moreover, the maximum and minimum relative errors for N2 are 8.6% and 4.8%, respectively. Therefore, the maximum and minimum relative errors for N2 are greater than those of CH4. The reason is that the N2 removal efficiencies are much lower than CH4 removal efficiencies, so a small difference between experimental and modelling N2 removal efficiencies results in a more significant relative error compared to CH4. Based on the range of the relative errors of N2 and CH4 removal efficiencies presented in Table 3, it can be concluded that the modelling outcomes are in good agreement with the experimental results.
4.2. The Effect of Various ILs on CH4 Removal Efficiency
Given the absence of prior research on CH4 capture utilising ionic liquids within a continuous absorption/desorption framework, this study introduces a validated model based on experimental data from [BMIM][TF2N]. Subsequently, this model is employed to assess the efficacy of various ionic liquids for capturing CH4 from highly diluted streams.
After conducting an in-depth analysis of various ILs, including [BMIM][TF2N], [EMIM][BF4], [EMIM][TF2N], [HMIM][TF2N], [BMIM][PF6] and [BMIM][BF4], at different flow rates within the 0.1–0.5 L/min range, we have identified the best IL for CH4 removal efficiency. Our findings will help optimise the process and improve overall efficiency. These specific ILs were selected based on a thorough evaluation of their physical attributes, including parameters like Henry’s constant, wetted surface area, viscosity, and surface tension. These properties hold sway over the efficiency of the absorption process. For instance, Henry’s constant significantly influences how gas is absorbed into a liquid solvent. Meanwhile, surface tension and wetted surface area directly impact the extent of contact between gas and liquid phases. Furthermore, viscosity assumes a critical role in the absorption process, influencing aspects such as mass transfer rate, mixing and contact dynamics, pumping demands, and heat transfer.
The highest CH4 removal efficiency is observed for [BMIM][TF2N], while the lowest CH4 removal efficiency is seen in [BMIM][PF6]; see Figure 6.
The trend of CH4 removal efficiency obtained in this study is as follows: [BMIM][TF2N] > [EMIM][TF2N] > [HMIM][TF2N] > [EMIM][BF4] > [BMIM][BF4] > [BMI-M][PF6]. The rationale behind this can be explained by comparing the viscosity, surface tension, wetted surface area, and Henry’s constant of these ILs as depicted in Figure 7.
Based on the mathematical modelling, IL’s viscosity can have an impact on both the liquid side mass transfer coefficient and the wetted surface area of the packing. By decreasing the viscosity, both the Reynolds number and turbulence of the liquid phase increase, which in turn increases the liquid side mass transfer coefficient. This increase in Reynolds number also positively affects the wetted surface area of the packing. As shown in Figure 6 and Figure 7, reducing the IL’s viscosity can lead to an increase in CH4 removal efficiency. However, it is important to note that the CH4 removal efficiency of [EMIM][BF4] is lower than other studied ILs despite its low viscosity. This may be attributed to the effect of the IL’s surface tension on CH4 removal efficiency.
To increase the efficiency of CH4 removal, it is important to consider the surface tension of the IL. The surface tension refers to the liquid’s tendency to minimise its surface area. Lowering the surface tension of the IL increases the Weber number of the liquid phase, which results in a larger wetted surface area of the packing. The wetted surface area of the packing is crucial in improving the efficiency of CH4 removal as it allows for better contact between the gas and liquid phases. Research has shown that decreasing the surface tension of the IL leads to a rise in the CH4 removal efficiency, as demonstrated in Figure 6 and Figure 7. For instance, [EMIM][BF4], despite having low viscosity, has a lower CH4 removal efficiency than other ILs due to its high surface tension. On the other hand, [BMIM][TF2N] has been found to provide the most excellent CH4 removal efficiency compared to other ILs studied, owing to its low viscosity and surface tension. Therefore, it can be concluded that in order to achieve optimal CH4 removal efficiency, both the viscosity and surface tension of the IL should be low.
For optimal enhancement of CH4 removal efficiency, it is imperative that both the wetted surface area of the packing and CH4 solubility within the IL remain notably high. Given the careful consideration of these two pivotal parameters, [BMIM][TF2N] emerges as a promising solvent for application in the CH4 absorption process, facilitating efficient CH4 capture. Although the idea of the packed bed column is to increase the contact surface area between the gas and liquid phases by dispersing liquid on the surface of the packing, practically all of its surface cannot be wetted by liquid. Therefore, increasing the wetted surface area of the packing plays a significant role in improving the gas removal efficiency because the wetted surface area of the packing is the contact area between the gas and liquid phases. As discussed, the wetted surface area of the packing depends on both the viscosity and surface tension of the liquid phase, and both the IL’s viscosity and surface tension must be low to maximise the wetted surface area of the packing. The viscosity [38,39,40,41,42], surface tension [43], wetted surface area [58], and Henry’s constant [62,63,64,65,66] of different ILs is shown in Figure 7. As presented in Figure 7, the wetted surface area of [BMIM][TF2N] is greater than the other ILs studied, maximising the CH4 removal efficiency of this IL as shown in Figure 6. Although the wetted surface areas of all three [EMIM][TF2N], [BMIM][TF2N], and [HMIM][TF2N] are high, the CH4 removal efficiency of [BMIM][TF2N] is greater than the two other ILs as illustrated in Figure 6 and Figure 7. The reason can be explained by an investigation of the effect of Henry’s contestant of the ILs on the CH4 removal efficiency. Henry’s constant is a physical property that is demonstrative of gas solubility in the liquid phase, and it provides information about the equilibrium state of the gas-liquid system [67,68,69]. As can be seen in Figure 7, Henry’s constant (MPa) of [BMIM][TF2N] is lower than [EMIM][TF2N], and [HMIM][TF2N] results in the greater gas solubility of CH4 in [BMIM][TF2N] compared with the two other ILs. By increasing the CH4 solubility in the liquid phase, the overall mass transfer coefficient increases.
It is worth noting that while the adsorption of CH4 using solid adsorbents like zeolite, MOFs, and activated carbon has shown promising results [70,71,72,73], employing these adsorbents in a continuous adsorption/desorption process for separating CH4 from VAM streams (1 vol% CH4) has yet to be investigated.
4.3. The Effect of Packing Material on CH4 Removal Efficiency
It was found that the efficiency of CH4 removal varied depending on the packing material used. Glass packing was found to have the highest CH4 removal efficiency, followed by steel, carbon, ceramic, PVC, and paraffin (see Figure 8). The reason for this trend can be explained by the critical surface tension and wetted surface area of the packing materials [74]. As presented in Table 4, the wetted surface area of the packing increases with increasing the packing critical surface tension, improving the contact surface area between the gas and liquid phases [58,74]. Increasing the critical surface tension of the packing material can increase the wetted surface area , which improves the contact surface area between the gas and liquid phases. Glass packing had the highest critical surface tension and wetted surface area, which is why it had the greatest CH4 removal efficiency among the packing materials tested as shown in Figure 8.
Figure 9 analyses the efficiency of CH4 removal at different packing diameters. The data show that as the packing diameter increases, the efficiency of CH4 removal decreases. It should be noted that the liquid side mass transfer coefficient of CH4 decreases when the packing diameter decreases (see Table 5). The liquid side mass transfer coefficient is directly proportional to the Reynolds number of the liquid phase, which is dependent on the liquid’s actual velocity and the packing’s equivalent diameter. The actual velocity of the liquid that flows through packing with a 6 mm diameter that has a lower void fraction is greater than that of packing with a 10 mm diameter. On the other hand, the packing’s equivalent diameter for the 6 mm diameter option is smaller than that associated with a 10 mm diameter, thereby exerting a decreasing effect on the Reynolds number. As shown in Table 5, the liquid side mass transfer coefficient of CH4 for the packing diameter of 6 mm is less than that for 10 mm. This observation substantiates that when the packing diameter is decreased, the adverse impact of reducing the equivalent diameter outweighs the beneficial effect of augmenting the actual velocity of the liquid phase through the packing in terms of the Reynolds number. Consequently, this leads to a decrease in both the Reynolds number of the liquid phase and the mass transfer coefficient of CH4 on the liquid side.
In summary, the research indicates that packing with a larger diameter of 10 mm exhibits a higher mass transfer coefficient compared to smaller, 6 mm diameter packing. However, despite this advantage, 6 mm diameter packing achieves a higher mass transfer rate. This highlights that the contact area between the gas and liquid phases has a greater impact on the mass transfer rate than the mass transfer coefficient. This is particularly clear when examining the effect of packing diameter on the CH4 removal efficiency.
4.4. The Effect of Flow Pattern on CH4 Removal Efficiency
According to Figure 10, the CH4 removal efficiency is higher in the counter-current flow pattern as compared to the co-current flow pattern. The concentration difference between the gas and liquid phases remains steady along the packing in the counter-current mode, while it decreases from the entry point to the exit point in the co-current mode. Due to this, the average of the CH4 concentration difference is higher in the counter-current flow pattern, leading to a higher CH4 removal efficiency.
4.5. The Effect of Absorption Parameters on CH4 Removal Efficiency
Thorough investigation is conducted into the absorption process of CH4 in [BMIM][TF2N] utilising both experimental and modelling methods. The parameters that were found to have the most significant impact on the absorption process were temperature, as well as the flow rates of both gas and liquid. By carefully examining these factors, we were able to enhance the quality of our analysis and gain a better understanding of the process as a whole.
As shown in Figure 11, CH4 removal efficiency decreases with increasing temperature. To explain the reason, both the liquid side and overall mass transfer coefficients that are logarithmic averages between the start and the end of the column are calculated at different temperatures, and the results are presented in Table 6. The liquid side mass transfer coefficient of CH4 decreases by increasing the temperature. The reason is that the liquid side mass transfer coefficient is directly correlated with the Reynolds number. The Reynolds number is a dimensionless quantity to predict the order of liquid phase turbulence, which flows over the packing and is negatively correlated with the liquid phase viscosity. With increasing the temperature, the IL viscosity decreases, leading to an increase in the Reynolds number. Therefore, an increase in temperature has a positive effect on the liquid side mass transfer coefficients of CH4 and N2.
The overall mass transfer coefficient is directly correlated with the liquid side mass transfer coefficient. Thus, in terms of the liquid side mass transfer coefficient, an increase in temperature has a positive effect on the overall mass transfer coefficient. On the other hand, the overall mass transfer coefficient is negatively correlated with Henry’s coefficient. Henry’s coefficient is representative of the solubility of gas molecules in the liquid phase. Increasing the temperature increases the kinetic energy of the gas molecule absorbed in the liquid phase, which results in escaping the gas molecules from the liquid phase. Therefore, increasing the temperature decreases the solubility of gas molecules in the liquid phase. Based on Henry’s law, Henry’s coefficient is correlated negatively with the solubility of gas molecules in the liquid phase. Thus, by increasing the temperature, Henry’s coefficient increases. Since the overall mass transfer coefficient is negatively correlated with Henry’s coefficient, increasing the temperature has a negative effect on the overall mass transfer coefficient. As shown in Table 6, the overall mass transfer coefficient decreases by increasing the temperature. Therefore, it seems that the negative effect of increasing temperature on the overall mass transfer coefficient caused by Henry’s coefficient is greater than the positive impact of increasing the liquid side mass transfer coefficient on the overall mass transfer coefficient due to an increase in Reynold’s number by increasing the temperature. Thus, the overall mass transfer coefficient of CH4 decreases with increasing temperature. Lowering the overall mass transfer coefficient reduces the rate of mass transfer of CH4 from the gas phase to the liquid phase. Therefore, as presented in Figure 11, the removal efficiency of CH4 decreases by increasing temperature.
The removal efficiency of CH4 at different gas flow rates is presented in Figure 12. As illustrated in this figure, the CH4 removal efficiency decreases when gas flow rate increases. Moreover, the CH4 removal efficiency approaches the minimum value by increasing the gas flow rate. As shown in Figure 12, by increasing the gas flow rate, the removal efficiency of CH4 may decrease due to a decrease in the gas’s residence time in the packing and contact time with the liquid phase. Although increasing the gas flow rate can reduce mass transfer resistance in the gas phase, the negative effect of decreasing the gas residence time in the absorption column on gas component mass transfer between the two phases is more significant. As a result, the CH4 mass transfer rate all over the packing decreases, reducing the removal efficiency of CH4. It is important to note that the overall mass transfer coefficient is a function of the liquid side mass transfer coefficient, and increasing the gas flow rate does not affect this coefficient [46].
In Figure 13, it is observed that increasing the liquid flow rate enhances the removal efficiency of CH4 and N2. It is found that both overall and liquid side mass transfer coefficients are directly related to the Reynolds number, which increases with the fluid velocity over the packing (Table 7). Therefore, by increasing the liquid flow rate, the Reynolds number increases, resulting in the enhancement of both overall and liquid side mass transfer coefficients, and ultimately, the removal efficiency of CH4 and N2.
Furthermore, it is shown in Figure 13 that the CH4 removal efficiency is greater compared to N2. The reason can be explained by comparing the liquid side and overall mass transfer coefficients of N2 and CH4 presented in Table 6 at different liquid flow rates. As shown in the table, the liquid side mass transfer coefficient of CH4 is greater than that of N2. The mass transfer coefficient is negatively correlated with the gas molecular weight, and the molecular weight of CH4 is lower than N2 which reduces the mass transfer coefficient of N2 in comparison with CH4. Although the N2 mass diffusivity coefficient is higher than that of CH4, the negative effect of gas molecular weight is greater than the positive effect of the mass diffusivity coefficient on mass transfer coefficient. The reason is that the mass transfer coefficient is correlated with the root square of the mass diffusivity coefficient, which reduces its effect on the mass transfer coefficient compared to that of molecular weight. Furthermore, Henry’s coefficient of N2 in [BMIM][TF2N] is higher than CH4 [75,76] which leads to the more significant overall mass transfer coefficient of CH4 because it exhibits a negative correlation with Henry’s constant. Thus, the more significant overall mass transfer coefficient of CH4 than N2 results in greater CH4 removal efficiency than N2.
To conclude, while N2 concentration in the VAM stream is predominant, the absorption of CH4 using [BMIM][TF2N] from the same stream demonstrates a significantly greater removal efficiency for CH4 compared to N2. Consequently, utilising this specific IL in the absorption procedure provides an advantageous avenue for separating CH4 from the VAM stream. This not only aids in mitigating greenhouse gas emissions originating from mining activities but also enhances the overall safety of the mine sites.
4.6. Effect of Desorption Parameters on CH4 Removal Efficiency
Based on the data presented in Figure 14, increasing the desorption temperature can have a positive impact on the CH4 removal efficiency of the absorption unit for the counter-current flow pattern, because higher temperatures improve the regeneration efficiency of the rich solvent, facilitating gas stripping from the liquid phase. By increasing the kinetic energy of the gas molecules in the liquid phase, the tendency of the gas molecules to leave the liquid phase is improved, resulting in more effective regeneration of the IL. As the desorption temperature increases, the slope of the CH4 removal efficiency profile diminishes, suggesting that beyond a certain temperature threshold, the regeneration of the IL occurs effectively, enabling the introduction of fresh IL into the absorption column. However, it is important to note that elevating the desorption temperature above 403.15 K has minimal impact on the CH4 removal efficiency.
Lowering the desorption pressure improves the CH4 removal efficiency, as shown in Figure 15. This is because the lower the partial pressure of the gas, the lower its solubility in the liquid phase, facilitating its removal from the liquid phase. The vacuum pump is used to lower the partial pressure of absorbed gas in the regeneration vessel, which improves the regeneration efficiency of the solvent, resulting in higher CH4 removal efficiency. However, reducing the pressure inside the vessel has a much smaller positive effect on removal efficiency than other parameters such as increasing desorption temperature or liquid flow rate and decreasing packing size. This is due to the significant dimensions of the regeneration vessel, leading to a reduction in gas pressure within the enclosure. As the vacuum pressure inside the vessel decreases, the slope of the CH4 removal efficiency profile also diminishes. At a vacuum pressure of −0.01 MPa, a significant portion of the desorbed gas is extracted from the vessel, and further diminishing the vessel’s vacuum pressure has a limited impact on enhancing the desorption performance and CH4 removal efficiency.
Based on Figure 16, we can conclude that increasing the desorption temperature in the CH4 absorption packed column and the desorption vessel using [BMIM][TF2N] in a continuous absorption/desorption process results in an increase in the CH4 concentration of the outlet gas from the vessel. This is due to an increase in the kinetic energy of gas molecules to escape from the liquid phase. However, the rate of increasing outlet CH4 concentration from the vessel decreases by increasing the desorption temperature, and at temperatures above 403.15 K, increasing the desorption temperature does not significantly affect the outlet CH4 concentration from the regeneration vessel. This finding suggests that the IL is efficiently regenerated at the desorption temperature of 403.15 K and above, and the outlet CH4 concentration from the regeneration vessel reaches an almost constant value.
At the desorption temperature of 403.15 K, the outlet concentration of CH4 from the vessel is approximately 4%, surpassing the initial CH4 inlet concentration to the absorption column, which was 1 vol%. This observation validates the capability of this process to enhance the concentration of CH4 within the IL solvent effectively.
It is important to highlight that this research marks the inaugural investigation into utilising absorption and desorption techniques, incorporating a packed column and an agitated vessel employing [BMIM][TF2N] as the solvent. The primary focus of this study was capturing CH4 from a simulated VAM stream, characterised by its highly diluted CH4 content. The findings of this research affirm the viability of this process, providing the mining industry with a safe and efficient means to mitigate CH4 emissions from their operations. Furthermore, this separation process demonstrates the advantage of operating at ambient temperatures.
While it is true that adsorption processes can also operate at ambient temperatures, comparing the effectiveness of the proposed CH4 capturing and concentrating process with adsorption techniques found in existing literature presents several challenges. This is primarily because most of the studies in the literature involve gas streams with high CH4 concentrations [12,77]. As a result, there is a scarcity of research that specifically addresses CH4 capture from extremely diluted gas streams using either adsorption or absorption methods.
It is important to highlight that the mechanism behind CH4 absorption using [BMIM][TF2N] involves physical interactions [48]. These interactions contribute to a reduction in the energy requirement of the regeneration process, thereby allowing the proposed process to effectively compete with adsorption techniques in terms of the energy required for regeneration. This distinction is noteworthy and adds to the uniqueness of the proposed process.
In summary, while both adsorption and absorption processes can operate at ambient temperatures, comparing the proposed method’s ability to capture and concentrate CH4, and the adsorption techniques outlined in the literature is complicated due to the differences in CH4 concentration in the gas streams studied. Furthermore, research focused on CH4 capture from highly diluted gas streams using these processes remains limited. Additionally, the distinctive mechanism of CH4 absorption using [BMIM][TF2N], characterised by its impact on desorption efficiency, positions the proposed process as a competitive alternative to adsorption methods in terms of energy-efficient regeneration.
5. Optimisation
Optimisation of the process helps to determine the best operation of the system in terms of productivity and/or separation efficiency. Hence, developing a rigorous optimisation algorithm to determine the optimal conditions, in which the maximum production rate of the desired product and/or separation efficiency is managed, is currently of great interest. Depending on the degree of non-linearity and initial values, a majority of the gradient-based optimisation methods are potentially trapped in the local optima. Hence, they do not guarantee finding the global optima. The GA, which is a simulation of natural evolution, is considered a powerful method among the stochastic optimisation methods [78,79]. This method is efficient in global search in both constrained and unconstrained cases.
Figure 17 shows a graphical representation of the GA. The process involves creating a random initial population, testing the fitness function, employing genetic operators such as selection, crossover, and mutation, and achieving the criteria to stop the search. This method does not depend on the initial guess and function derivatives, making it possible to use information from other regions without becoming stuck in local optima. By finding better fitness function values in other regions of the solution domain, the population is forced to move away from the local optima. For more information on the basics of the GA, such as gene, chromosome, population, selection, and crossover, refer to other sources [78].
After conducting a thorough analysis and testing, it has been determined that the best way to manage the absorption systems for the removal of CH4 is by employing the GA. The developed model was utilised to determine the optimum conditions of the absorber, which included acquiring the optimum gas flow rate (0.1–0.6 L/min), liquid flow rate (0.1–0.5 L/min), absorption temperature (303.15–363.15 K), and packing diameter through the use of the GA. This strategy aimed to maximise CH4 removal efficiency and ensure a successful project outcome. The optimisation procedure by the GA was carried out using the optimisation toolbox of the MATLAB package, and the details of this process can be found in Table 8.
After performing the necessary calculations using the given procedure, the CH4 removal efficiency was determined using Equation (1). To achieve maximum efficiency, we defined an objective to minimise using the equation provided, which is equivalent to maximising the CH4 removal efficiency.
The results of Table 9 show that the optimisation procedure was successful in achieving a high CH4 removal efficiency with an inlet VAM concentration of 1 vol% and a packing diameter of 6 mm. This confirms that a lower packing diameter provides better results in terms of CH4 removal. The implemented GA optimisation procedure has provided valuable insights that can be used to further improve the efficiency of the process. These findings can be used to optimise the design and operation of VAM abatement systems, leading to more sustainable and environmentally friendly industrial processes.
6. Conclusions
In this study, the developed model has been used to compare the efficacy of various ionic liquids, namely [BMIM][TF2N], [EMIM][TF2N], [HMIM][TF2N], [EMIM][BF4], [BMIM][BF4], and [BMIM][PF6], in the process of removing CH4 from VAM. The results showed that [BMIM][TF2N] exhibits the highest CH4 removal efficiency among the tested ILs, due to its lower Henry’s constant. Additionally, the impact of packing material on the effectiveness of CH4 removal was examined, with glass demonstrating the best efficiency. This is explained by the fact that glass packing has a larger critical surface tension and wetted surface area than the other substances under investigation. In the experimental section, the continuous absorption–desorption process using [BMIM][TF2N] was investigated to separate CH4 from ventilation air with a low concentration of CH4 (1 vol%). The effects of different operating parameters (liquid flow rate, gas flow rate, absorption temperature, desorption temperature, packing diameter, and desorption pressure) on CH4 removal efficiency were evaluated. The packing size has a significant impact on CH4 removal efficiency, which improves up to 43% by decreasing the Raschig ring packing size from 10 mm to 6 mm with specific surface areas of 156 and 400 m2/m3, respectively. The impact of the aforementioned factors on CH4 removal efficiency has been evaluated in terms of the mass transfer coefficient, and the optimisation technique (GA) has been applied to obtain the optimum operating condition of the absorption process to maximise the CH4 removal efficiency. According to the optimisation results, the following parameters can be used to achieve a CH4 removal efficiency of 23.8%: a gas flow rate of 0.1 L/min, a liquid flow rate of 0.5 L/min, a packing diameter of 6 mm, and adsorption and desorption temperatures of 303.15 and 403.15 K, respectively. Additionally, the experimental results indicated that ILs could concentrate CH4 in the simulated VAM stream by approximately four times. It is important to note that the CH4 removal efficiency was determined to be 3.5-fold greater than that of N2. Thus, while N2 concentration in the VAM stream is predominant, the absorption of CH4 using this IL from the same stream demonstrates a significantly greater removal efficiency for CH4 compared to N2. Moreover, CH4 absorption using [BMIM][TF2N] relies on physical interactions, which reduces the amount of energy needed for regeneration. The results confirm the effectiveness of this method for reducing CH4 emissions from various industrial sources and concentrating VAM through a safe and energy-efficient process in VAM abatement facilities.
Future endeavors in this field could focus on using hybrid systems or multi-column to better manage the large volume of the VAM stream and achieve a higher removal efficiency. Moreover, investigation on expanding this work to the pilot scale and eventually scaling up for industrial applications could play an important role in addressing CH4 emissions and moving towards a greener future.
Author Contributions
Methodology, H.R.R.; Validation, H.R.R.; Formal analysis, H.R.R.; Investigation, H.R.R.; Data curation, H.R.R.; Writing—original draft, H.R.R.; Writing—review & editing, J.Z. and B.M.; Supervision, J.Z. and B.M. All authors have read and agreed to the published version of the manuscript.
Funding
This research received no external funding.
Data Availability Statement
Data are contained within the article.
Conflicts of Interest
The authors declare no conflict of interest.
References
- Stocker, T. Climate Change 2013: The Physical Science Basis: Working Group I Contribution to the Fifth Assessment Report of the Intergovernmental Panel on Climate Change; Cambridge University Press: Cambridge, UK, 2014. [Google Scholar]
- Intergovernmental Panel on Climate Change. Climate change 2007: The physical science basis. Agenda 2007, 6, 333. [Google Scholar]
- Karacan, C.Ö.; Ruiz, F.A.; Cotè, M.; Phipps, S. Coal mine methane: A review of capture and utilization practices with benefits to mining safety and to greenhouse gas reduction. Int. J. Coal Geol. 2011, 86, 121–156. [Google Scholar] [CrossRef]
- Kim, H.-S.; Mora-Sero, I.; Gonzalez-Pedro, V.; Fabregat-Santiago, F.; Juarez-Perez, E.J.; Park, N.-G.; Bisquert, J. Mechanism of carrier accumulation in perovskite thin-absorber solar cells. Nat. Commun. 2013, 4, 2242. [Google Scholar] [CrossRef] [PubMed]
- You, C.; Xu, X. Utilization of ventilation air methane as a supplementary fuel at a circulating fluidized bed combustion boiler. Environ. Sci. Technol. 2008, 42, 2590–2593. [Google Scholar] [CrossRef] [PubMed]
- Warmuzinski, K. Harnessing methane emissions from coal mining. Process Saf. Environ. Prot. 2008, 86, 315–320. [Google Scholar] [CrossRef]
- Setiawan, A.; Kennedy, E.M.; Stockenhuber, M. Development of Combustion Technology for Methane Emitted from Coal-Mine Ventilation Air Systems. Energy Technol. 2017, 5, 521–538. [Google Scholar] [CrossRef]
- Su, S.; Beath, A.; Guo, H.; Mallett, C. An assessment of mine methane mitigation and utilisation technologies. Prog. Energy Combust. Sci. 2005, 31, 123–170. [Google Scholar] [CrossRef]
- Nadaraju, F.; Maddocks, A.; Zanganeh, J.; Moghtaderi, B. Simulation of power and cooling generation via heat recovery from a ventilation air methane abatement unit. Fuel 2019, 249, 27–35. [Google Scholar] [CrossRef]
- Yin, F.; Nie, B.; Wu, J.; Yang, Y.; Wei, Y.; Zhu, T. Combustion Characteristics of Ventilation Air Methane Blending with Dimethyl Ether in a Thermal Reverse Flow Reactor. Energy Fuels 2022, 37, 547–559. [Google Scholar] [CrossRef]
- Hinde, P.; Mitchell, I.; Riddell, M. COMET TM–A New Ventilation Air Methane (VAM) Abatement Technology. Johns. Matthey Technol. Rev. 2016, 60, 211–221. [Google Scholar] [CrossRef]
- Wang, Q.; Yu, Y.; Li, Y.; Min, X.; Zhang, J.; Sun, T. Methane separation and capture from nitrogen rich gases by selective adsorption in microporous materials: A review. Sep. Purif. Technol. 2022, 283, 120206. [Google Scholar] [CrossRef]
- Korman, K.J.; Decker, G.E.; Dworzak, M.R.; Deegan, M.M.; Antonio, A.M.; Taggart, G.A.; Bloch, E.D. Using low-pressure methane adsorption isotherms for higher-throughput screening of methane storage materials. ACS Appl. Mater. Interfaces 2020, 12, 40318–40327. [Google Scholar] [CrossRef]
- Chen, L.; Zuo, L.; Jiang, Z.; Jiang, S.; Liu, K.; Tan, J.; Zhang, L. Mechanisms of shale gas adsorption: Evidence from thermodynamics and kinetics study of methane adsorption on shale. Chem. Eng. J. 2019, 361, 559–570. [Google Scholar] [CrossRef]
- Gilassi, S.; Taghavi, S.M.; Rodrigue, D.; Kaliaguine, S. Techno-Economic Analysis of a Hybrid System for Flue-Gas Separation: Combining Membrane and Enzymatic-Absorption Processes. Chem. Eng. Process. Process Intensif. 2021, 159, 108222. [Google Scholar] [CrossRef]
- Zhao, Q.; Leonhardt, E.; MacConnell, C.; Frear, C.; Chen, S. Purification Technologies for Biogas Generated by Anaerobic Digestion; Compressed Biomethane; CSANR: Wenatchee, WA, USA, 2010; Volume 24. [Google Scholar]
- Zhang, L.-L.; Wang, J.-X.; Xiang, Y.; Zeng, X.-F.; Chen, J.-F. Absorption of carbon dioxide with ionic liquid in a rotating packed bed contactor: Mass transfer study. Ind. Eng. Chem. Res. 2011, 50, 6957–6964. [Google Scholar] [CrossRef]
- Zhao, Z.; Dong, H.; Zhang, X. The research progress of CO2 capture with ionic liquids. Chin. J. Chem. Eng. 2012, 20, 120–129. [Google Scholar] [CrossRef]
- Zareiekordshouli, F.; Lashanizadehgan, A.; Darvishi, P. Study on the use of an imidazolium-based acetate ionic liquid for CO2 capture from flue gas in absorber/stripper packed columns: Experimental and modeling. Int. J. Greenh. Gas Control. 2018, 70, 178–192. [Google Scholar] [CrossRef]
- Amiri, N.; Benyounes, H.; Lounis, Z.; Shen, W. Design of absorption process for CO2 capture using cyano based anion ionic liquid. Chem. Eng. Res. Des. 2021, 169, 239–249. [Google Scholar] [CrossRef]
- Huang, Z.; Karami, D.; Mahinpey, N. Study on the efficiency of multiple amino groups in ionic liquids on their sorbents performance for low-temperature CO2 capture. Chem. Eng. Res. Des. 2021, 167, 198–206. [Google Scholar] [CrossRef]
- Ghandi, K. A review of ionic liquids, their limits and applications. Green Sustain. Chem. 2014, 2014, 43349. [Google Scholar] [CrossRef]
- Mallakpour, S.; Dinari, M. Ionic liquids as green solvents: Progress and prospects. In Green Solvents II: Properties and Applications of Ionic Liquids; Springer: Dordrecht, The Netherlands, 2012; pp. 1–32. [Google Scholar]
- Villazón-León, V.; Bonilla-Petriciolet, A.; Tapia-Picazo, J.; Segovia-Hernández, J.; Corazza, M. A review of group contribution models to calculate thermodynamic properties of ionic liquids for process systems engineering. Chem. Eng. Res. Des. 2022, 185, 458–480. [Google Scholar] [CrossRef]
- Karadas, F.; Atilhan, M.; Aparicio, S. Review on the use of ionic liquids (ILs) as alternative fluids for CO2 capture and natural gas sweetening. Energy Fuels 2010, 24, 5817–5828. [Google Scholar] [CrossRef]
- Dharaskar Swapnil, A. Ionic liquids (a review): The green solvents for petroleum and hydrocarbon industries. Res. J. Chem. Sci. ISSN 2012, 2231, 606X. [Google Scholar]
- Althuluth, M.A. Natural Gas Sweetening Using Ionic Liquids. Ph.D. Thesis, Eindhoven University of Technology, Eindhoven, The Netherlands, 2014. [Google Scholar]
- Jiang, S.; Hu, Y.; Wang, Y.; Wang, X. Viscosity of typical room-temperature ionic liquids: A critical review. J. Phys. Chem. Ref. Data 2019, 48, 033101. [Google Scholar] [CrossRef]
- Okoturo, O.; VanderNoot, T. Temperature dependence of viscosity for room temperature ionic liquids. J. Electroanal. Chem. 2004, 568, 167–181. [Google Scholar] [CrossRef]
- Wishart, J.F. Energy applications of ionic liquids. Energy Environ. Sci. 2009, 2, 956–961. [Google Scholar] [CrossRef]
- Kilaru, P.K.; Scovazzo, P. Correlations of low-pressure carbon dioxide and hydrocarbon solubilities in imidazolium-, phosphonium-, and ammonium-based room-temperature ionic liquids. Part 2. Using activation energy of viscosity. Ind. Eng. Chem. Res. 2008, 47, 910–919. [Google Scholar] [CrossRef]
- Ramdin, M. CO2 Capture with Ionic Liquids: Experiments and Molecular Simulations. Ph.D. Thesis, Delft University of Technology, Delft, The Netherlands, 2015. [Google Scholar]
- Sohaib, Q.; Vadillo, J.M.; Gómez-Coma, L.; Albo, J.; Druon-Bocquet, S.; Irabien, A.; Sanchez-Marcano, J. CO2 capture with room temperature ionic liquids; coupled absorption/desorption and single module absorption in membrane contactor. Chem. Eng. Sci. 2020, 223, 115719. [Google Scholar] [CrossRef]
- Chen, Y.; Mutelet, F.; Jaubert, J.-N. Solubility of carbon dioxide, nitrous oxide and methane in ionic liquids at pressures close to atmospheric. Fluid Phase Equilibria 2014, 372, 26–33. [Google Scholar] [CrossRef]
- Mortazavi-Manesh, S.; Satyro, M.A.; Marriott, R.A. Screening ionic liquids as candidates for separation of acid gases: Solubility of hydrogen sulfide, methane, and ethane. AIChE J. 2013, 59, 2993–3005. [Google Scholar] [CrossRef]
- Klamt, A. COSMO-RS: From Quantum Chemistry to Fluid Phase Thermodynamics and Drug Design; Elsevier: Amsterdam, The Netherlands, 2005. [Google Scholar]
- Kim, J.; Maiti, A.; Lin, L.-C.; Stolaroff, J.K.; Smit, B.; Aines, R.D. New materials for methane capture from dilute and medium-concentration sources. Nat. Commun. 2013, 4, 1694. [Google Scholar] [CrossRef]
- Song, D.; Chen, J. Densities and viscosities for ionic liquids mixtures containing [eOHmim][BF4],[bmim][BF4] and [bpy][BF4]. J. Chem. Thermodyn. 2014, 77, 137–143. [Google Scholar] [CrossRef]
- Zafarani-Moattar, M.T.; Majdan-Cegincara, R. Viscosity, density, speed of sound, and refractive index of binary mixtures of organic solvent+ ionic liquid, 1-butyl-3-methylimidazolium hexafluorophosphate at 298.15 K. J. Chem. Eng. Data 2007, 52, 2359–2364. [Google Scholar] [CrossRef]
- Ahosseini, A.; Scurto, A.M. Viscosity of imidazolium-based ionic liquids at elevated pressures: Cation and anion effects. Int. J. Thermophys. 2008, 29, 1222–1243. [Google Scholar] [CrossRef]
- Rilo, E.; Vila, J.; Pico, J.; García-Garabal, S.; Segade, L.; Varela, L.M.; Cabeza, O. Electrical conductivity and viscosity of aqueous binary mixtures of 1-alkyl-3-methyl imidazolium tetrafluoroborate at four temperatures. J. Chem. Eng. Data 2010, 55, 639–644. [Google Scholar] [CrossRef]
- Harris, K.R.; Kanakubo, M.; Woolf, L.A. Temperature and pressure dependence of the viscosity of the ionic liquids 1-hexyl-3-methylimidazolium hexafluorophosphate and 1-butyl-3-methylimidazolium bis (trifluoromethylsulfonyl) imide. J. Chem. Eng. Data 2007, 52, 1080–1085. [Google Scholar] [CrossRef]
- Gharagheizi, F.; Ilani-Kashkouli, P.; Mohammadi, A.H. Group contribution model for estimation of surface tension of ionic liquids. Chem. Eng. Sci. 2012, 78, 204–208. [Google Scholar] [CrossRef]
- Rahimpour, H.R.; Zanganeh, J.; Moghtaderi, B. Abatement of Greenhouse Gas Emissions from Ventilation Air Methane (VAM) Using Ionic Liquids: A Review of Experimental Methods and Modelling Approaches. Processes 2023, 11, 1496. [Google Scholar] [CrossRef]
- Ramdin, M.; Balaji, S.P.; Vicent-Luna, J.M.; Gutiérrez-Sevillano, J.J.; Calero, S.; De Loos, T.W.; Vlugt, T.J. Solubility of the precombustion gases CO2, CH4, CO, H2, N2, and H2S in the ionic liquid [bmim][Tf2N] from Monte Carlo simulations. J. Phys. Chem. C 2014, 118, 23599–23604. [Google Scholar] [CrossRef]
- Krupiczka, R.; Rotkegel, A.; Ziobrowski, Z. Comparative study of CO2 absorption in packed column using imidazolium based ionic liquids and MEA solution. Sep. Purif. Technol. 2015, 149, 228–236. [Google Scholar] [CrossRef]
- Ziobrowski, Z.; Krupiczka, R.; Rotkegel, A. Carbon dioxide absorption in a packed column using imidazolium based ionic liquids and MEA solution. Int. J. Greenh. Gas Control 2016, 47, 8–16. [Google Scholar] [CrossRef]
- He, R.; Peng, K.; Wu, Q.; Li, L.; Wang, X.; Zhou, G.; Yang, Z. Molecular dynamics simulations of structures, dynamics, competitive interaction mechanisms for CH4, CO2, and SO2 in ionic liquid mixtures of [Cnmim][Nf2T] and [Cnmim][BF4]. Fluid Phase Equilibria 2022, 554, 113342. [Google Scholar] [CrossRef]
- Zareie-kordshouli, F.; Lashani-zadehgan, A.; Darvishi, P. Comparative evaluation of CO2 capture from flue gas by [Emim][Ac] ionic liquid, aqueous potassium carbonate (without activator) and MEA solutions in a packed column. Int. J. Greenh. Gas Control 2016, 52, 305–318. [Google Scholar] [CrossRef]
- Gómez-Coma, L.; Garea, A.; Irabien, A. Non-dispersive absorption of CO2 in [emim][EtSO4] and [emim][Ac]: Temperature influence. Sep. Purif. Technol. 2014, 132, 120–125. [Google Scholar] [CrossRef]
- Luis, P.; Garea, A.; Irabien, A. Zero solvent emission process for sulfur dioxide recovery using a membrane contactor and ionic liquids. J. Membr. Sci. 2009, 330, 80–89. [Google Scholar] [CrossRef]
- Yang, D.; Barbero, R.S.; Devlin, D.J.; Cussler, E.; Colling, C.W.; Carrera, M.E. Hollow fibers as structured packing for olefin/paraffin separations. J. Membr. Sci. 2006, 279, 61–69. [Google Scholar] [CrossRef]
- Aroonwilas, A.; Tontiwachwuthikul, P. Mass transfer coefficients and correlation for CO2 absorption into 2-amino-2-methyl-1-propanol (AMP) using structured packing. Ind. Eng. Chem. Res. 1998, 37, 569–575. [Google Scholar] [CrossRef]
- Hobler, T. Mass Transfer and Absorbers: International Series of Monographs in Chemical Engineering; Elsevier: Amsterdam, The Netherlands, 2013; Volume 6. [Google Scholar]
- Morgan, D.; Ferguson, L.; Scovazzo, P. Diffusivities of gases in room-temperature ionic liquids: Data and correlations obtained using a lag-time technique. Ind. Eng. Chem. Res. 2005, 44, 4815–4823. [Google Scholar] [CrossRef]
- Maloka, I.E. Generalized liquid molar volume at the normal boiling point correlation. Pet. Sci. Technol. 2005, 23, 133–136. [Google Scholar] [CrossRef]
- Afkhamipour, M.; Mofarahi, M. Comparison of rate-based and equilibrium-stage models of a packed column for post-combustion CO2 capture using 2-amino-2-methyl-1-propanol (AMP) solution. Int. J. Greenh. Gas Control 2013, 15, 186–199. [Google Scholar] [CrossRef]
- Onda, K.; Takeuchi, H.; Okumoto, Y. Mass transfer coefficients between gas and liquid phases in packed columns. J. Chem. Eng. Jpn. 1968, 1, 56–62. [Google Scholar] [CrossRef]
- Chen, Y.-S.; Lin, F.-Y.; Lin, C.-C.; Tai, C.Y.-D.; Liu, H.-S. Packing characteristics for mass transfer in a rotating packed bed. Ind. Eng. Chem. Res. 2006, 45, 6846–6853. [Google Scholar] [CrossRef]
- Law, V.J. Numerical Methods for Chemical Engineers Using Excel, VBA, and MATLAB; CRC Press: Boca Raton, FL, USA, 2013. [Google Scholar]
- Yang, W.Y.; Cao, W.; Kim, J.; Park, K.W.; Park, H.-H.; Joung, J.; Ro, J.-S.; Lee, H.L.; Hong, C.-H.; Im, T. Applied Numerical Methods Using MATLAB; John Wiley & Sons: Hoboken, NJ, USA, 2020. [Google Scholar]
- Anderson, J.L.; Dixon, J.K.; Brennecke, J.F. Solubility of CO2, CH4, C2H6, C2H4, O2, and N2 in 1-Hexyl-3-methylpyridinium Bis (trifluoromethylsulfonyl) imide: Comparison to Other Ionic Liquids. Acc. Chem. Res. 2007, 40, 1208–1216. [Google Scholar] [CrossRef] [PubMed]
- Jacquemin, J.; Gomes, M.F.C.; Husson, P.; Majer, V. Solubility of carbon dioxide, ethane, methane, oxygen, nitrogen, hydrogen, argon, and carbon monoxide in 1-butyl-3-methylimidazolium tetrafluoroborate between temperatures 283 K and 343 K and at pressures close to atmospheric. J. Chem. Thermodyn. 2006, 38, 490–502. [Google Scholar] [CrossRef]
- Finotello, A.; Bara, J.E.; Camper, D.; Noble, R.D. Room-temperature ionic liquids: Temperature dependence of gas solubility selectivity. Ind. Eng. Chem. Res. 2008, 47, 3453–3459. [Google Scholar] [CrossRef]
- Jacquemin, J.; Husson, P.; Majer, V.; Gomes, M.F.C. Low-pressure solubilities and thermodynamics of solvation of eight gases in 1-butyl-3-methylimidazolium hexafluorophosphate. Fluid Phase Equilibria 2006, 240, 87–95. [Google Scholar] [CrossRef]
- ACARP. Selective Absorption of Methane by Ionic Liquids. 2023. Available online: https://www.acarp.com.au/abstracts.aspx?repId=C27008 (accessed on 19 January 2024).
- Nirmalakhandan, N.N.; Speece, R.E. QSAR model for predicting Henry’s constant. Environ. Sci. Technol. 1988, 22, 1349–1357. [Google Scholar] [CrossRef]
- Zhu, X.; Suidan, M.T.; Pruden, A.; Yang, C.; Alonso, C.; Kim, B.J.; Kim, B.R. Effect of substrate Henry’s constant on biofilter performance. J. Air Waste Manag. Assoc. 2004, 54, 409–418. [Google Scholar] [CrossRef] [PubMed]
- Ji, X.; Ma, Y.; Fu, T.; Zhu, C.; Wang, D. Experimental investigation of the liquid volumetric mass transfer coefficient for upward gas-liquid two-phase flow in rectangular microchannels. Braz. J. Chem. Eng. 2010, 27, 573–582. [Google Scholar] [CrossRef]
- Ursueguía, D.; Díaz, E.; Vega, A.; Ordóñez, S. Methane separation from diluted mixtures by fixed bed adsorption using MOFs: Model validation and parametric studies. Sep. Purif. Technol. 2020, 251, 117374. [Google Scholar] [CrossRef]
- Qu, D.; Yang, Y.; Lu, K.; Yang, L.; Li, P.; Yu, J.; Ribeiro, A.M.; Rodrigues, A.E. Microstructure effect of carbon materials on the low-concentration methane adsorption separation from its mixture with nitrogen. Adsorption 2018, 24, 357–369. [Google Scholar] [CrossRef]
- Anna, H.R.S.; Barreto, A.G., Jr.; Tavares, F.W.; do Nascimento, J.F. Methane/nitrogen separation through pressure swing adsorption process from nitrogen-rich streams. Chem. Eng. Process. Process Intensif. 2016, 103, 70–79. [Google Scholar] [CrossRef]
- Yang, Z.; Hussain, M.Z.; Marín, P.; Jia, Q.; Wang, N.; Ordóñez, S.; Zhu, Y.; Xia, Y. Enrichment of low concentration methane: An overview of ventilation air methane. J. Mater. Chem. A 2022, 10, 6397–6413. [Google Scholar] [CrossRef]
- Han, M.-W.; Choi, D.-K.; Lee, W.K. Effect of shape and wettability of packing materials on the efficiency of packed column. Korean J. Chem. Eng. 1985, 2, 25–31. [Google Scholar] [CrossRef]
- Raeissi, S.; Peters, C. High pressure phase behaviour of methane in 1-butyl-3-methylimidazolium bis (trifluoromethylsulfonyl) imide. Fluid Phase Equilibria 2010, 294, 67–71. [Google Scholar] [CrossRef]
- Carlisle, T.K.; Bara, J.E.; Gabriel, C.J.; Noble, R.D.; Gin, D.L. Interpretation of CO2 solubility and selectivity in nitrile-functionalized room-temperature ionic liquids using a group contribution approach. Ind. Eng. Chem. Res. 2008, 47, 7005–7012. [Google Scholar] [CrossRef]
- Wu, Y.; Yuan, D.; Zeng, S.; Yang, L.; Dong, X.; Zhang, Q.; Xu, Y.; Liu, Z. Significant enhancement in CH4/N2 separation with amine-modified zeolite Y. Fuel 2021, 301, 121077. [Google Scholar] [CrossRef]
- Goldberg, D.E. Cenetic Algorithms in Search. Optimization, Machine Learning; Addison-Wesley Longman Publishing Co., Inc.: Boston, MA, USA, 1989. [Google Scholar]
- Storn, R.; Price, K. Differential evolution–A simple and efficient heuristic for global optimization over continuous spaces. J. Glob. Optim. 1997, 11, 341–359. [Google Scholar] [CrossRef]
Figure 1.
A schematic diagram of the continuous absorption and desorption process. 1—pump, 2—cooled water bath, 3—stripper, 4—vacuum pump, 5—gas cylinder, 6—mass flow controller, 7—heating jacket, 8—packed bed, 9—packing support, 10—liquid distributor, 11—valve, 12—Micro-GC, 13—heater, 14—flow indicator, 15—thermocouple, and 16—pressure transducer.

Figure 2.
The absorption unit.

Figure 3.
The desorption unit.

Figure 4.
The schematic diagram of mass transfer between gas and liquid phases in the packed column.
Figure 4.
The schematic diagram of mass transfer between gas and liquid phases in the packed column.

Figure 5.
Flow chart of the method used in MATLAB.

Figure 6.
Modelling results of liquid flow rate effect on the CH4 removal efficiency of different ILs. T = 303.15 K, gas flow = 0.1 L/min, dp = 6 mm, and counter-current pattern.
Figure 6.
Modelling results of liquid flow rate effect on the CH4 removal efficiency of different ILs. T = 303.15 K, gas flow = 0.1 L/min, dp = 6 mm, and counter-current pattern.

Figure 7.
The viscosity, surface tension, wetted surface area, and Henry’s constant of different ILs at T = 303.15 K.
Figure 7.
The viscosity, surface tension, wetted surface area, and Henry’s constant of different ILs at T = 303.15 K.

Figure 8.
Modelling results of the packing material effect on CH4 removal efficiency. T = 303.15 K, gas flow = 0.1 L/min, and counter-current pattern.
Figure 8.
Modelling results of the packing material effect on CH4 removal efficiency. T = 303.15 K, gas flow = 0.1 L/min, and counter-current pattern.

Figure 9.
Modelling and experimental results of packing diameter effect on CH4 removal efficiency. T = 303.15 K, gas flow = 0.1 L/min, and counter-current pattern.
Figure 9.
Modelling and experimental results of packing diameter effect on CH4 removal efficiency. T = 303.15 K, gas flow = 0.1 L/min, and counter-current pattern.

Figure 10.
Modelling results of flow pattern effect on CH4 removal efficiency. T = 303.15 K, gas flow = 0.1 L/min, liquid flow = 0.1 L/min, and dp = 10 mm.
Figure 10.
Modelling results of flow pattern effect on CH4 removal efficiency. T = 303.15 K, gas flow = 0.1 L/min, liquid flow = 0.1 L/min, and dp = 10 mm.

Figure 11.
Modelling and experimental results of temperature effect on CH4 removal efficiency. gas flow = 0.1 L/min, liquid flow = 0.1 L/min, dp = 10 mm, and counter-current pattern.
Figure 11.
Modelling and experimental results of temperature effect on CH4 removal efficiency. gas flow = 0.1 L/min, liquid flow = 0.1 L/min, dp = 10 mm, and counter-current pattern.

Figure 12.
Modelling and experimental results of gas flow rate effect on CH4 removal efficiency. T = 303.15 K, liquid flow = 0.1 L/min, dp = 10 mm, and counter-current pattern.
Figure 12.
Modelling and experimental results of gas flow rate effect on CH4 removal efficiency. T = 303.15 K, liquid flow = 0.1 L/min, dp = 10 mm, and counter-current pattern.

Figure 13.
Modelling and experimental results of liquid flow rate effect on CH4 removal efficiency. T = 303.15 K, gas flow = 0.1 L/min, dp = 10 mm, and counter-current pattern.
Figure 13.
Modelling and experimental results of liquid flow rate effect on CH4 removal efficiency. T = 303.15 K, gas flow = 0.1 L/min, dp = 10 mm, and counter-current pattern.

Figure 14.
Effect of desorption temperature on the CH4 removal efficiency of the absorption unit at a liquid flow rate of 0.5 L/min, a packing diameter of 6 mm and a vacuum pressure of −0.01 MPa in the desorption unit.
Figure 14.
Effect of desorption temperature on the CH4 removal efficiency of the absorption unit at a liquid flow rate of 0.5 L/min, a packing diameter of 6 mm and a vacuum pressure of −0.01 MPa in the desorption unit.

Figure 15.
Effect of desorption pressure on CH4 removal efficiency at a desorption temperature of 403.15 K with a packing size of 6 mm, and gas flow and liquid flow rates of 0.1 L/min and 0.1 L/min, respectively.
Figure 15.
Effect of desorption pressure on CH4 removal efficiency at a desorption temperature of 403.15 K with a packing size of 6 mm, and gas flow and liquid flow rates of 0.1 L/min and 0.1 L/min, respectively.

Figure 16.
Average outlet CH4 concentration from the stripper at different temperatures. Tabsorption = 303.15 K, gas flow = 0.1 L/min, liquid flow = 0.1 L/min, dp = 6 mm, PDesorption = −0.01 MPa, and counter-current pattern.
Figure 16.
Average outlet CH4 concentration from the stripper at different temperatures. Tabsorption = 303.15 K, gas flow = 0.1 L/min, liquid flow = 0.1 L/min, dp = 6 mm, PDesorption = −0.01 MPa, and counter-current pattern.

Figure 17.
A general procedure of the genetic algorithm.


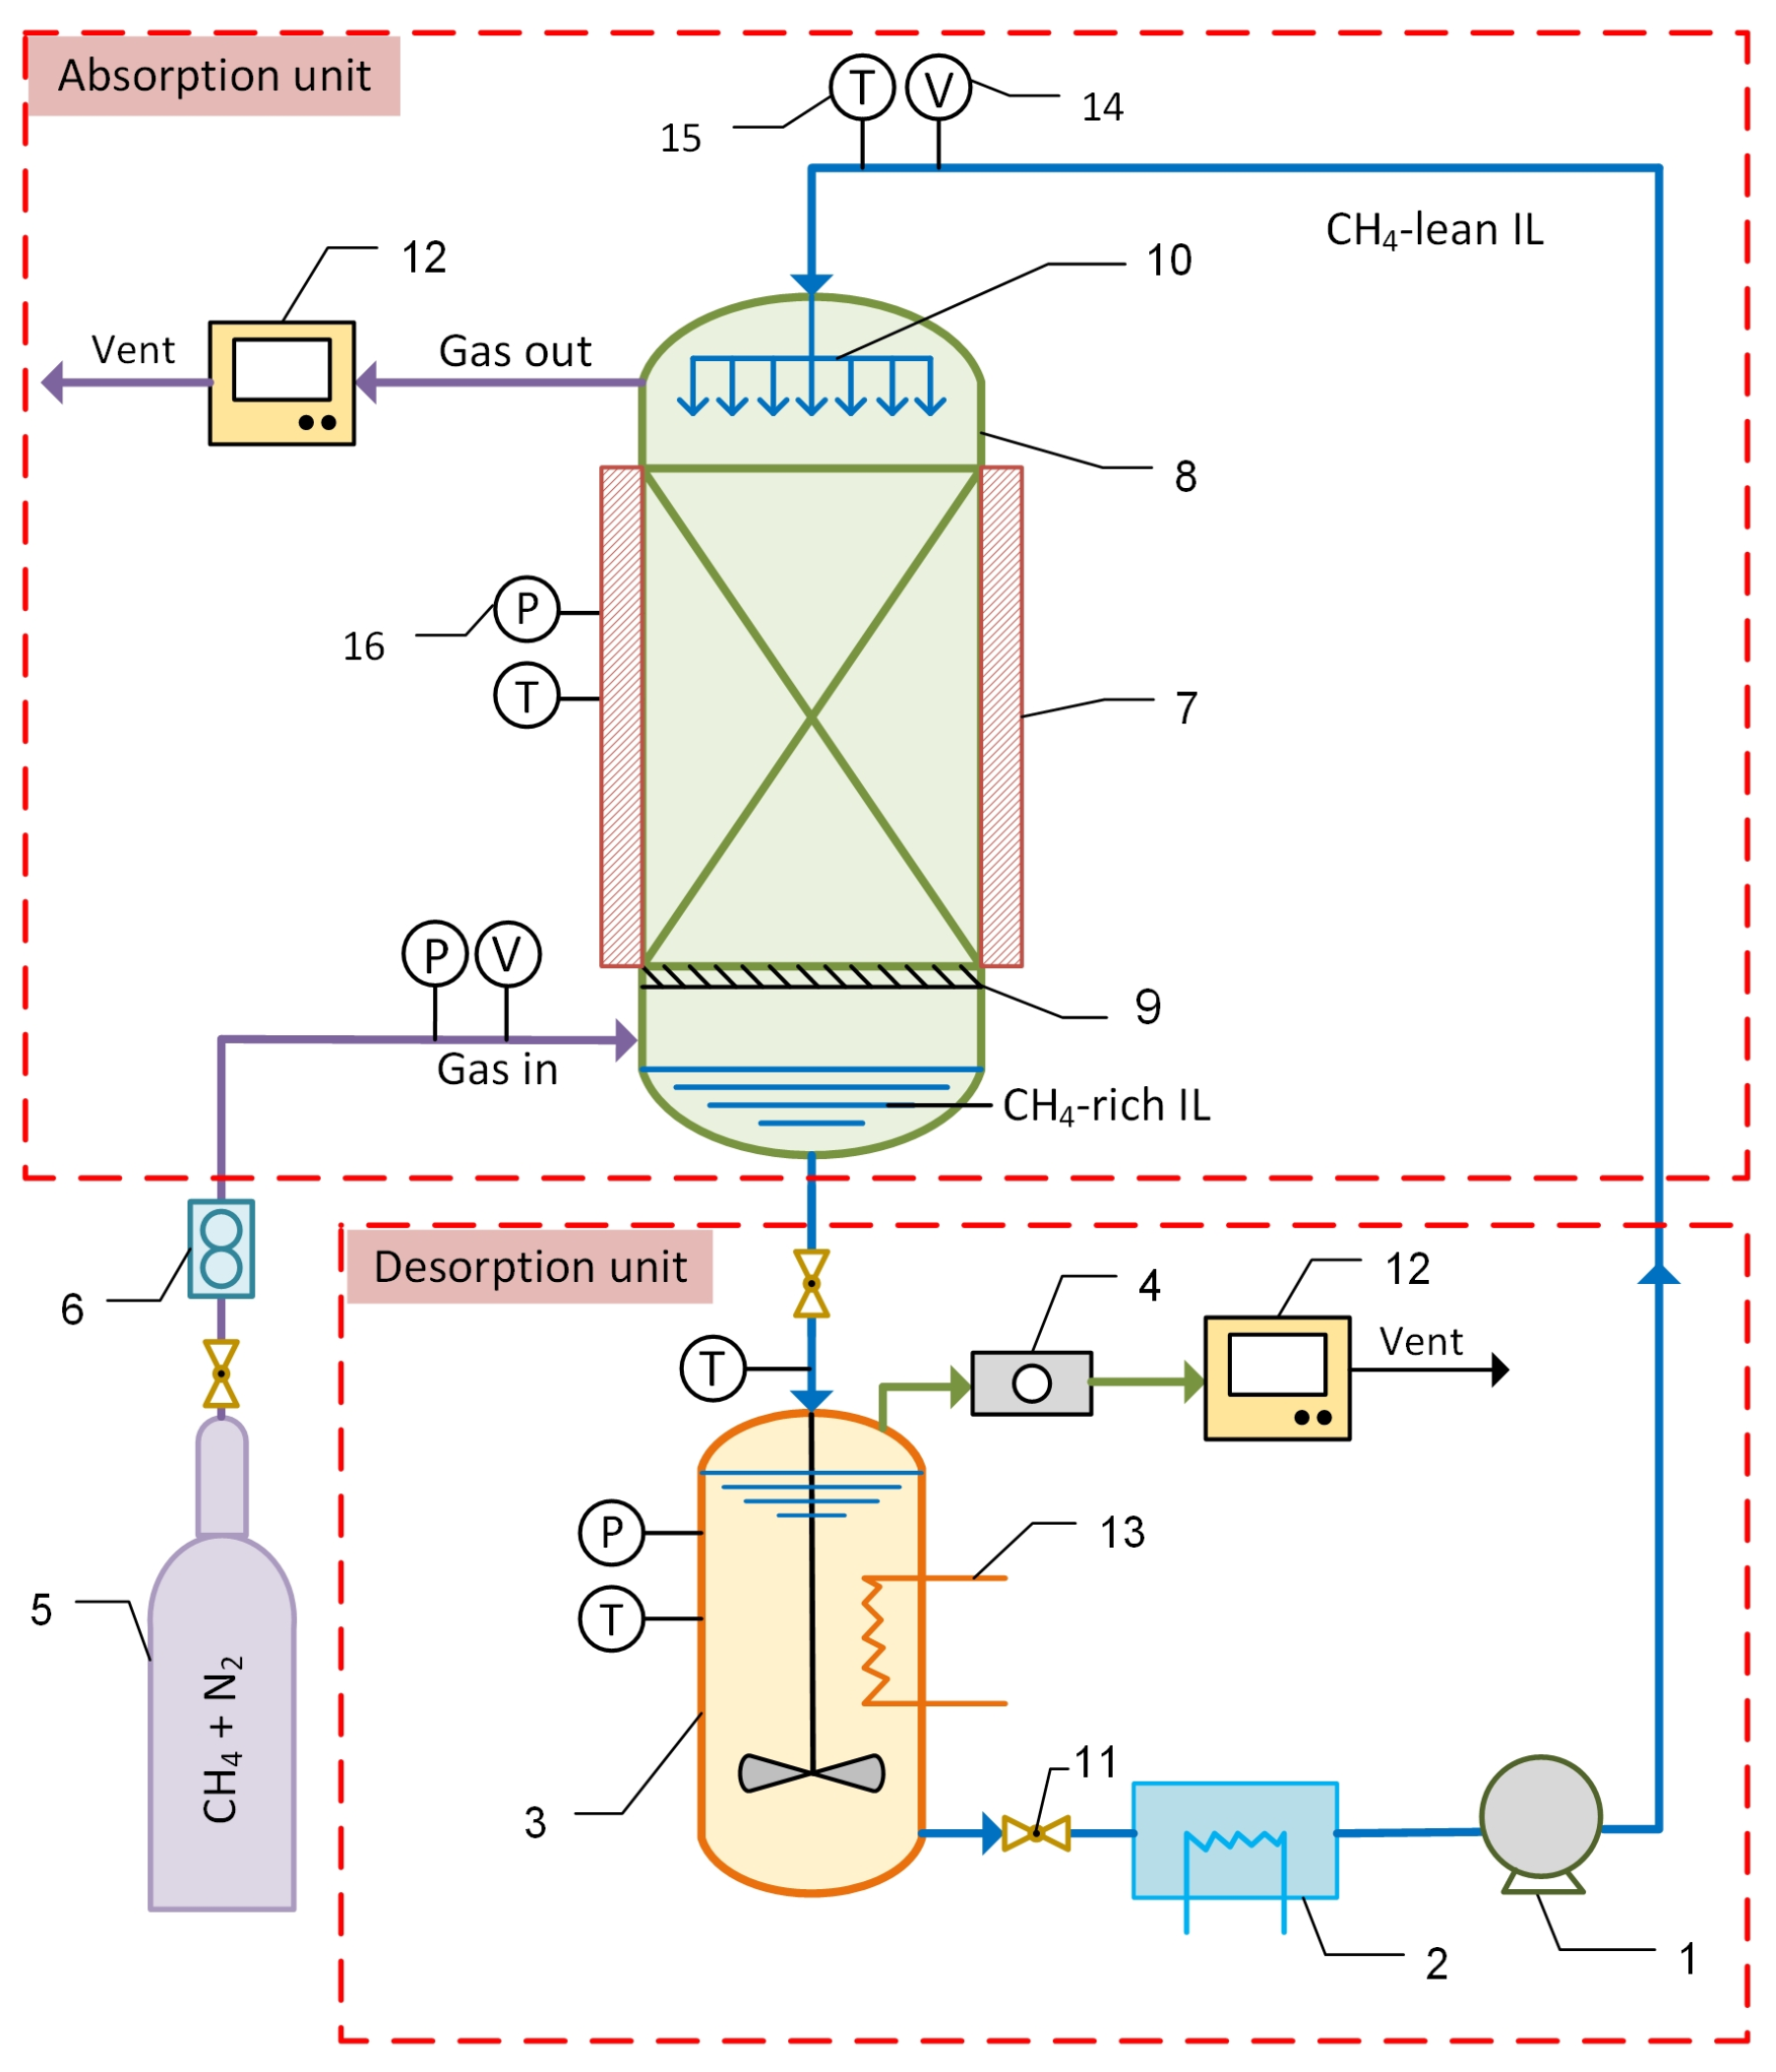
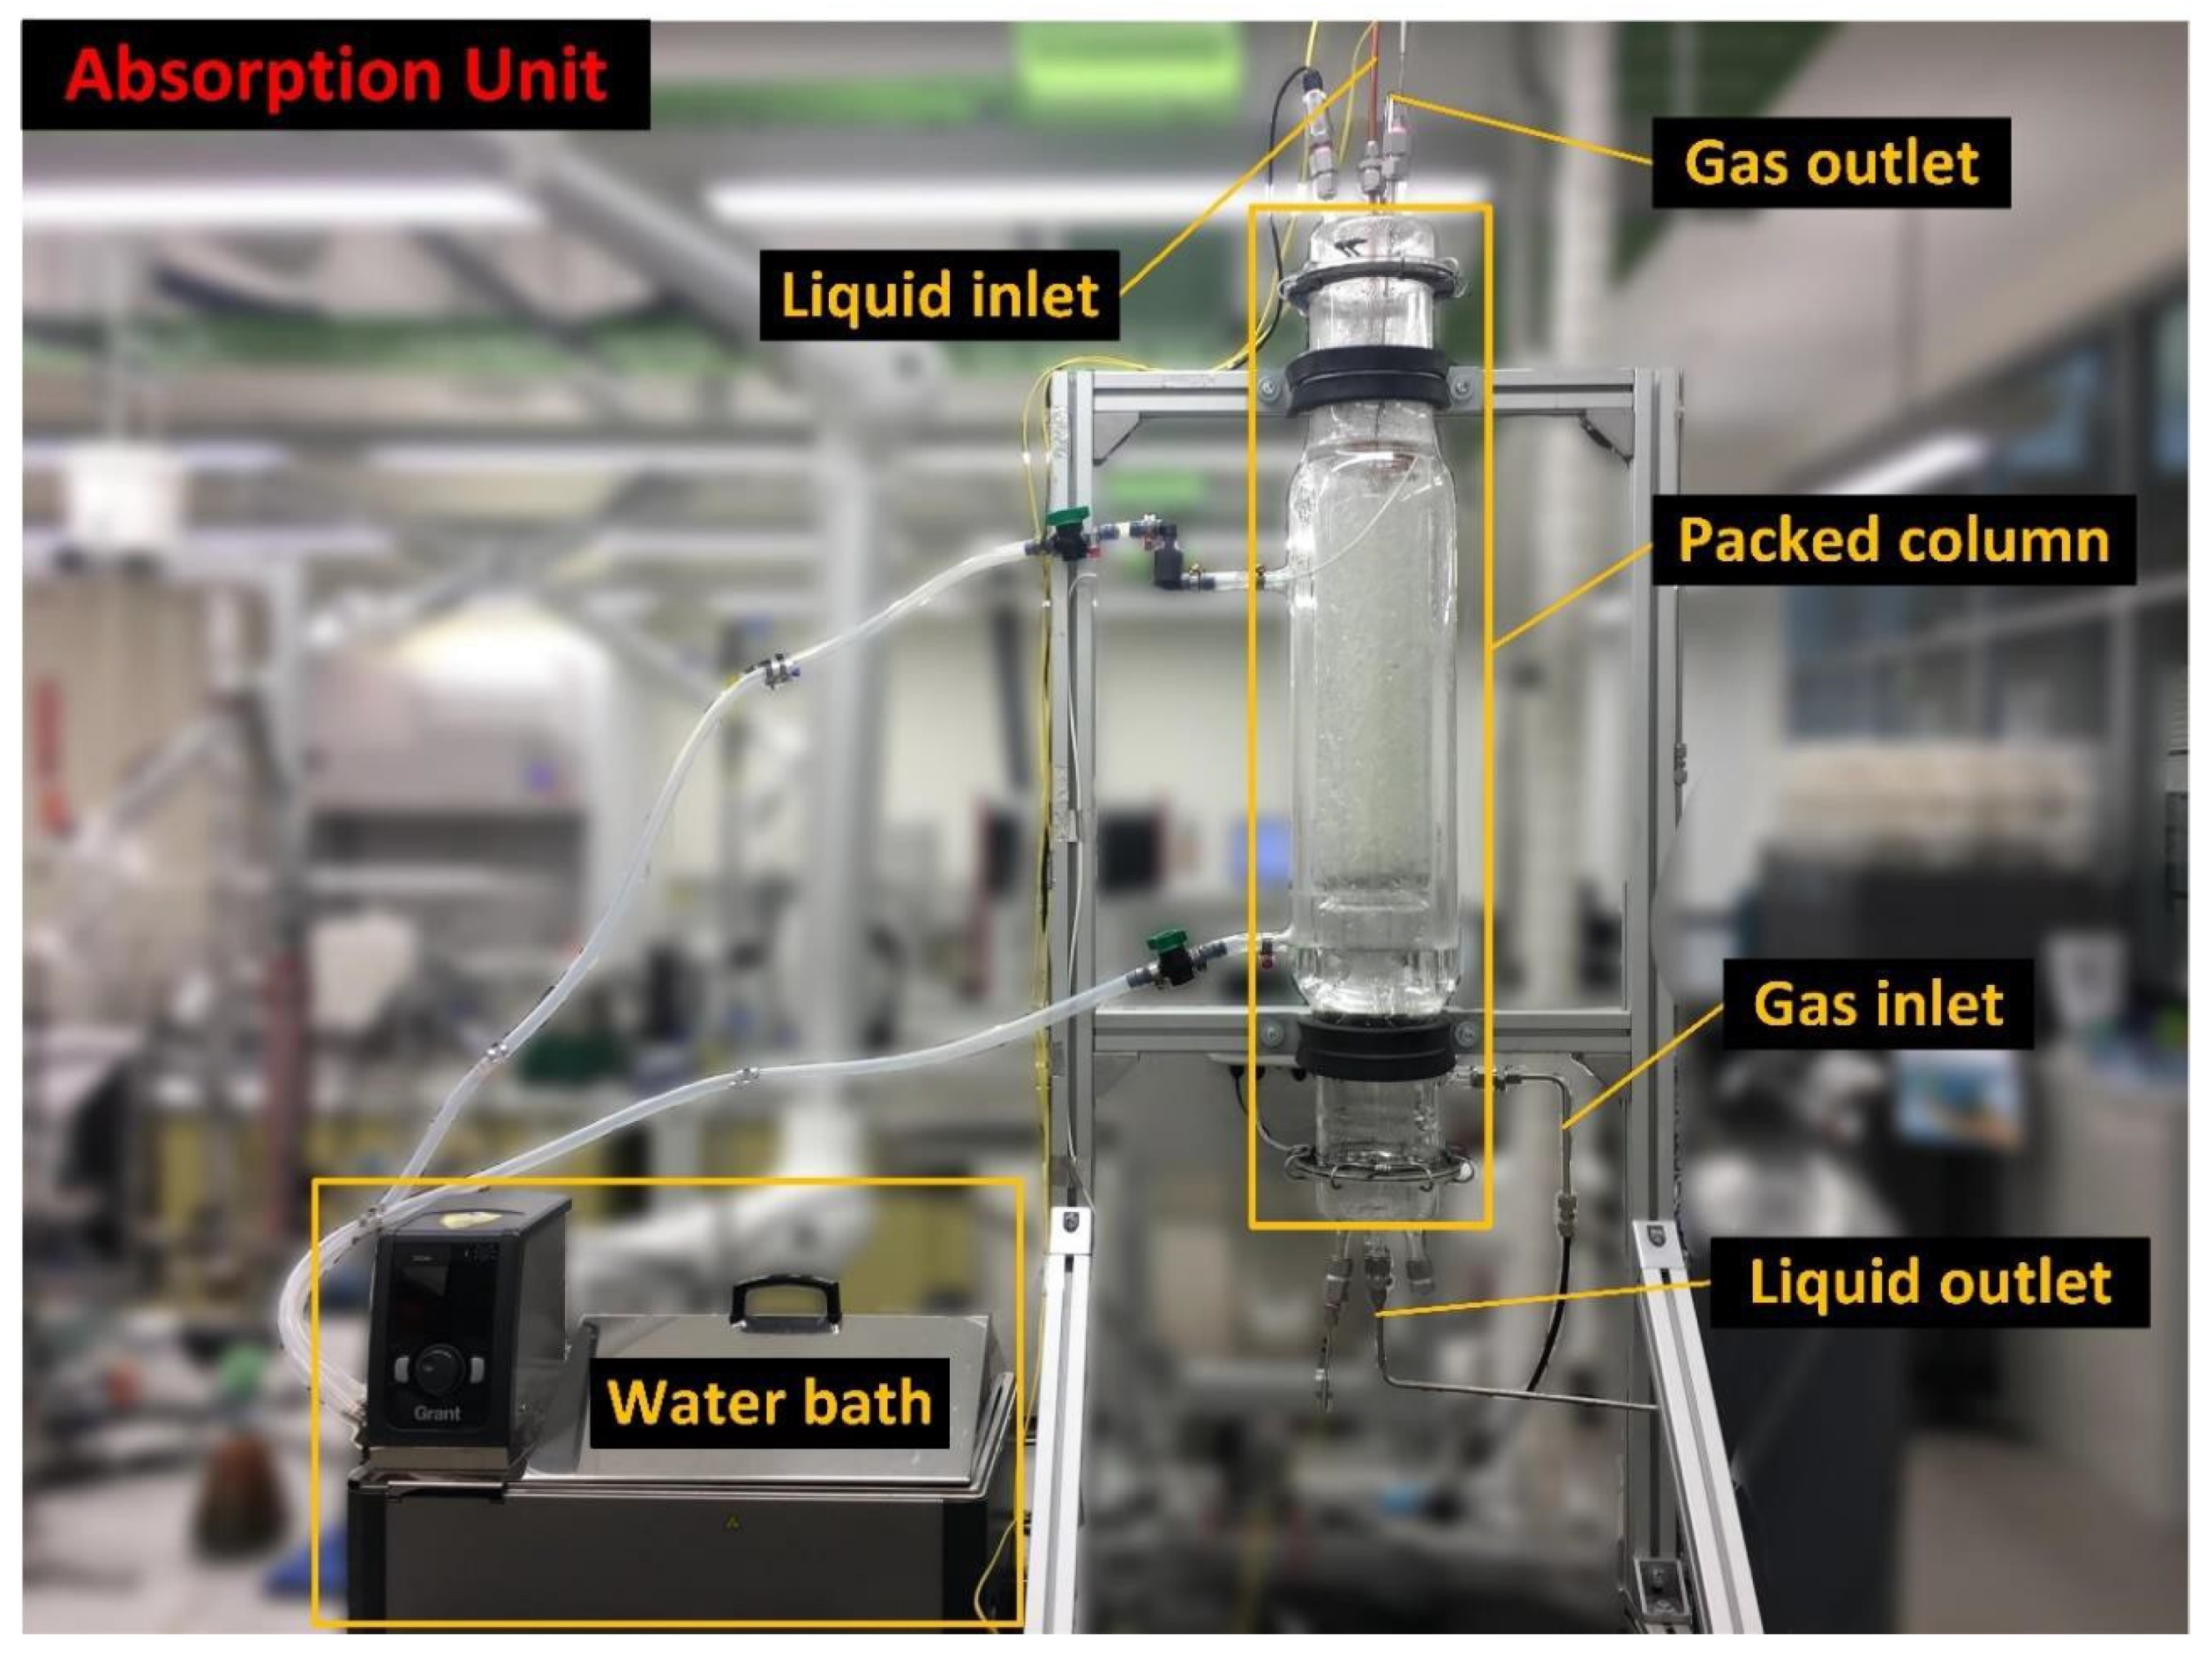
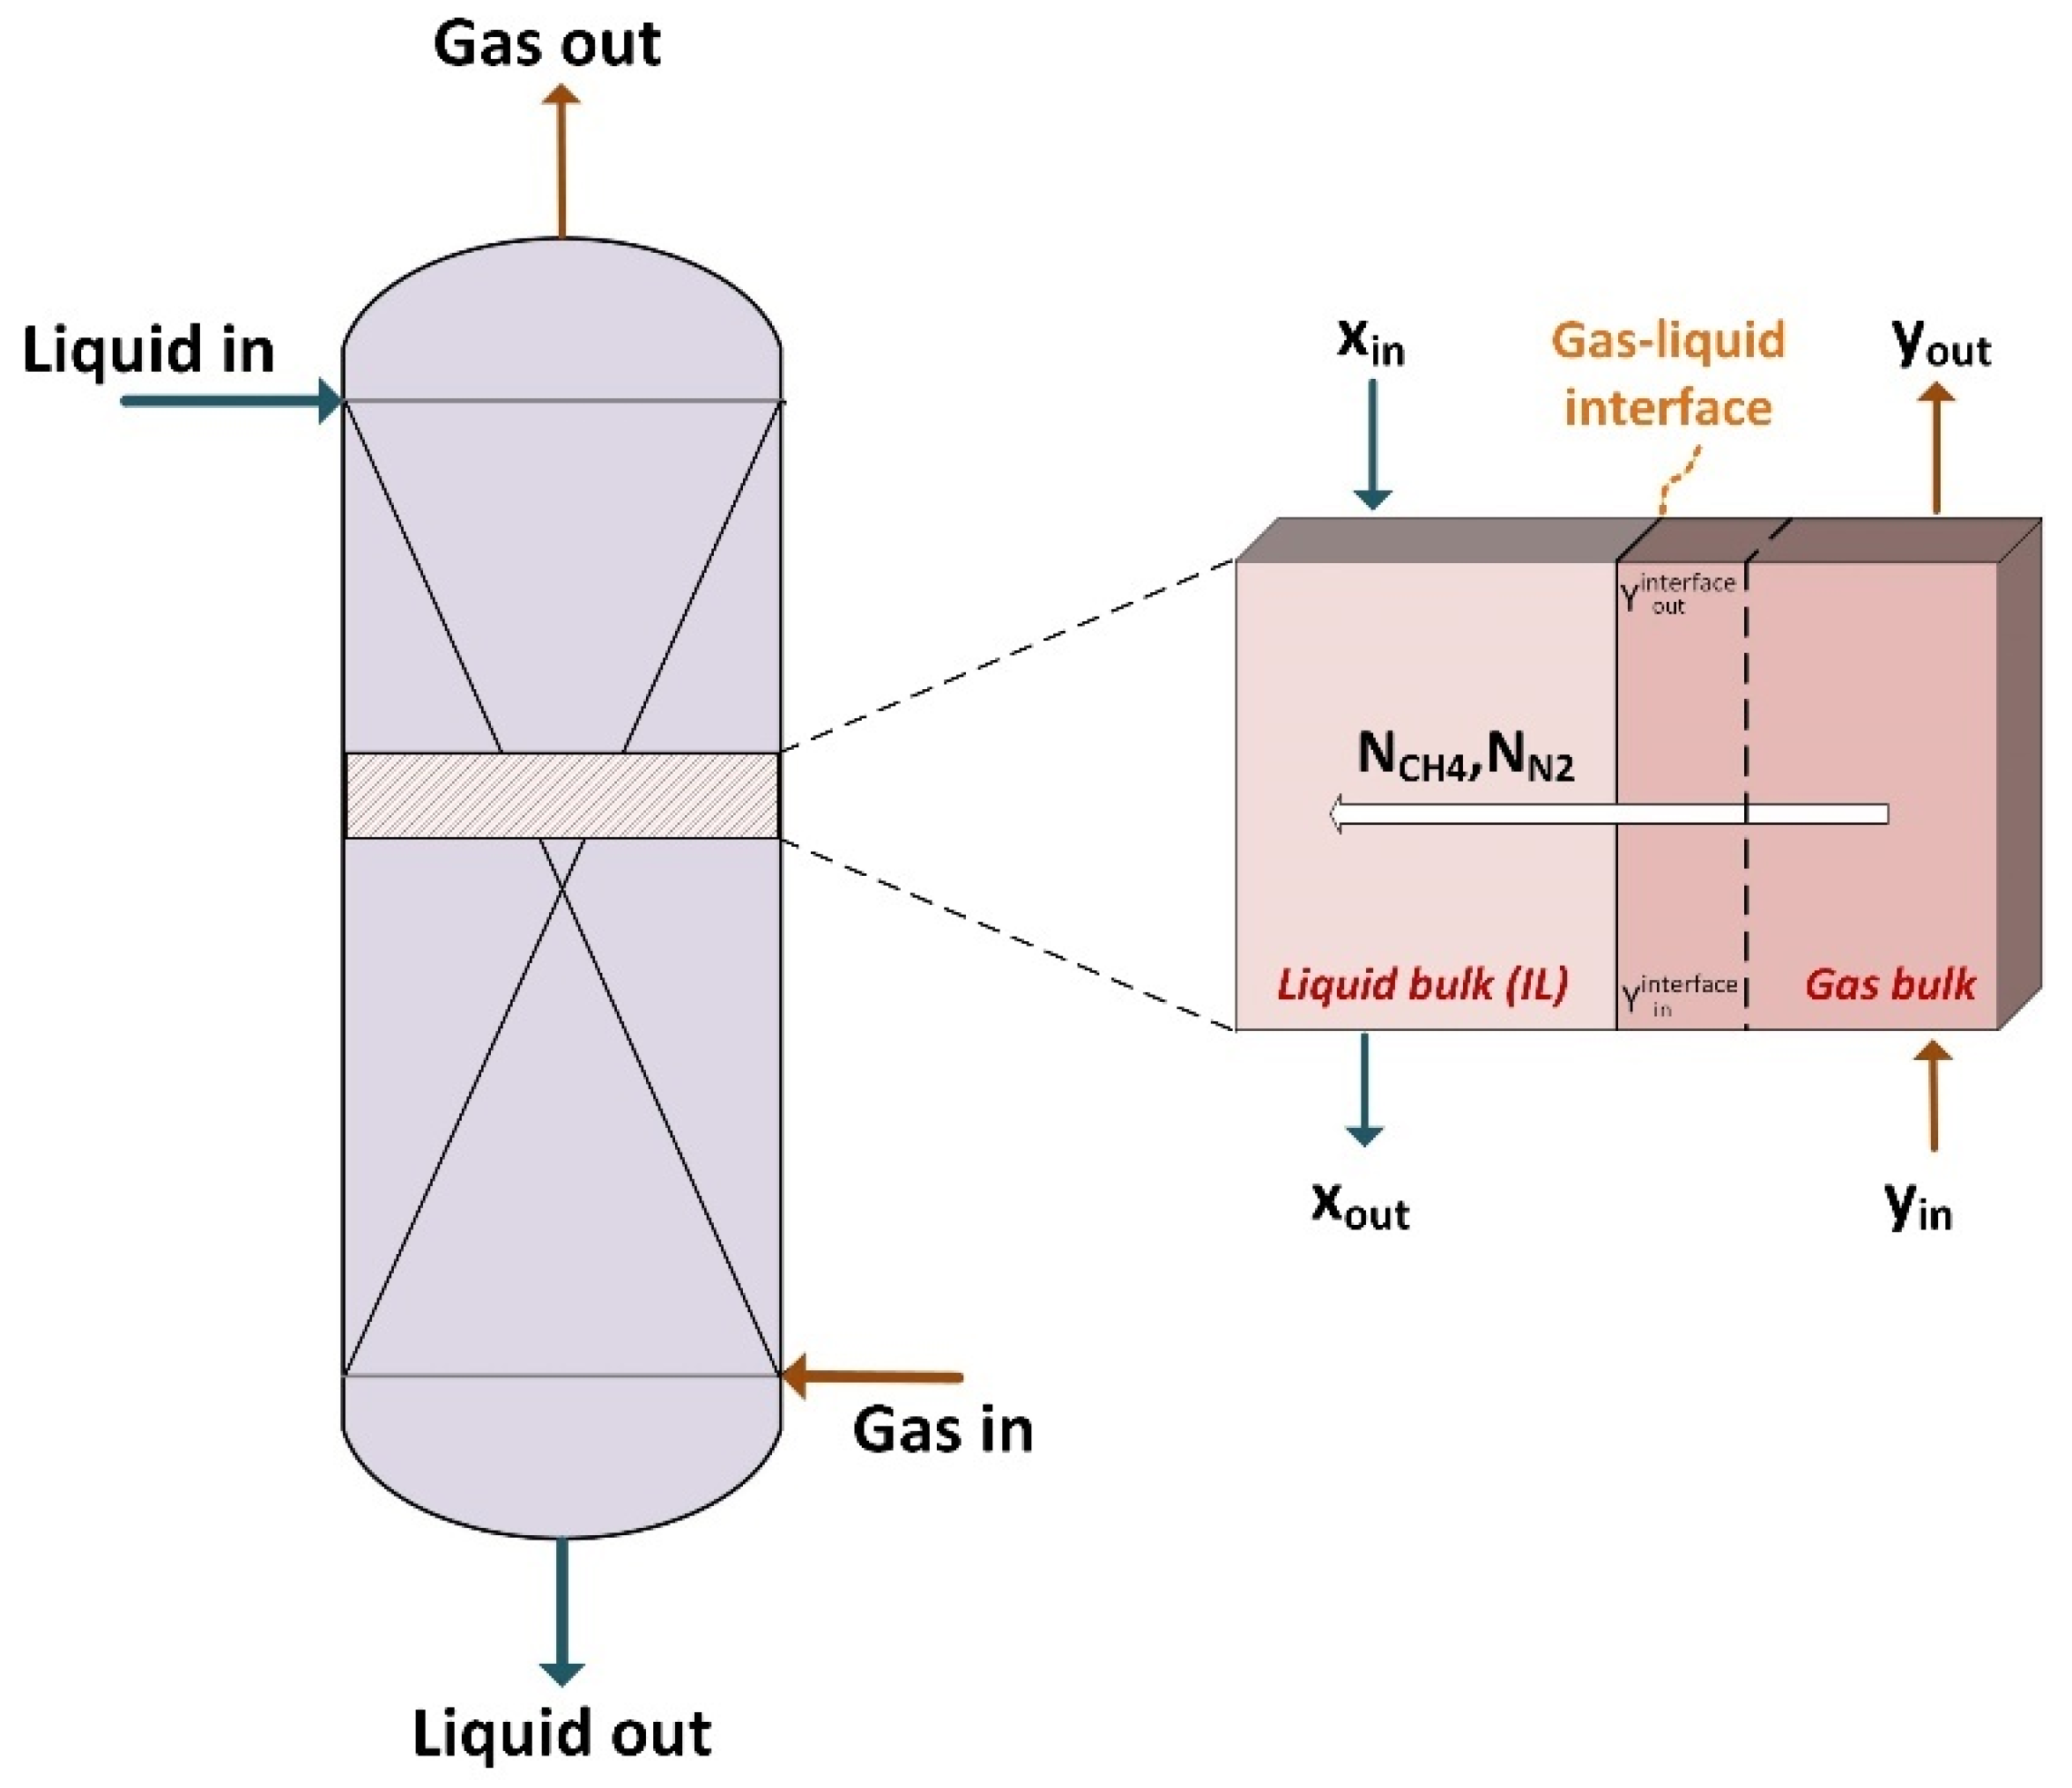
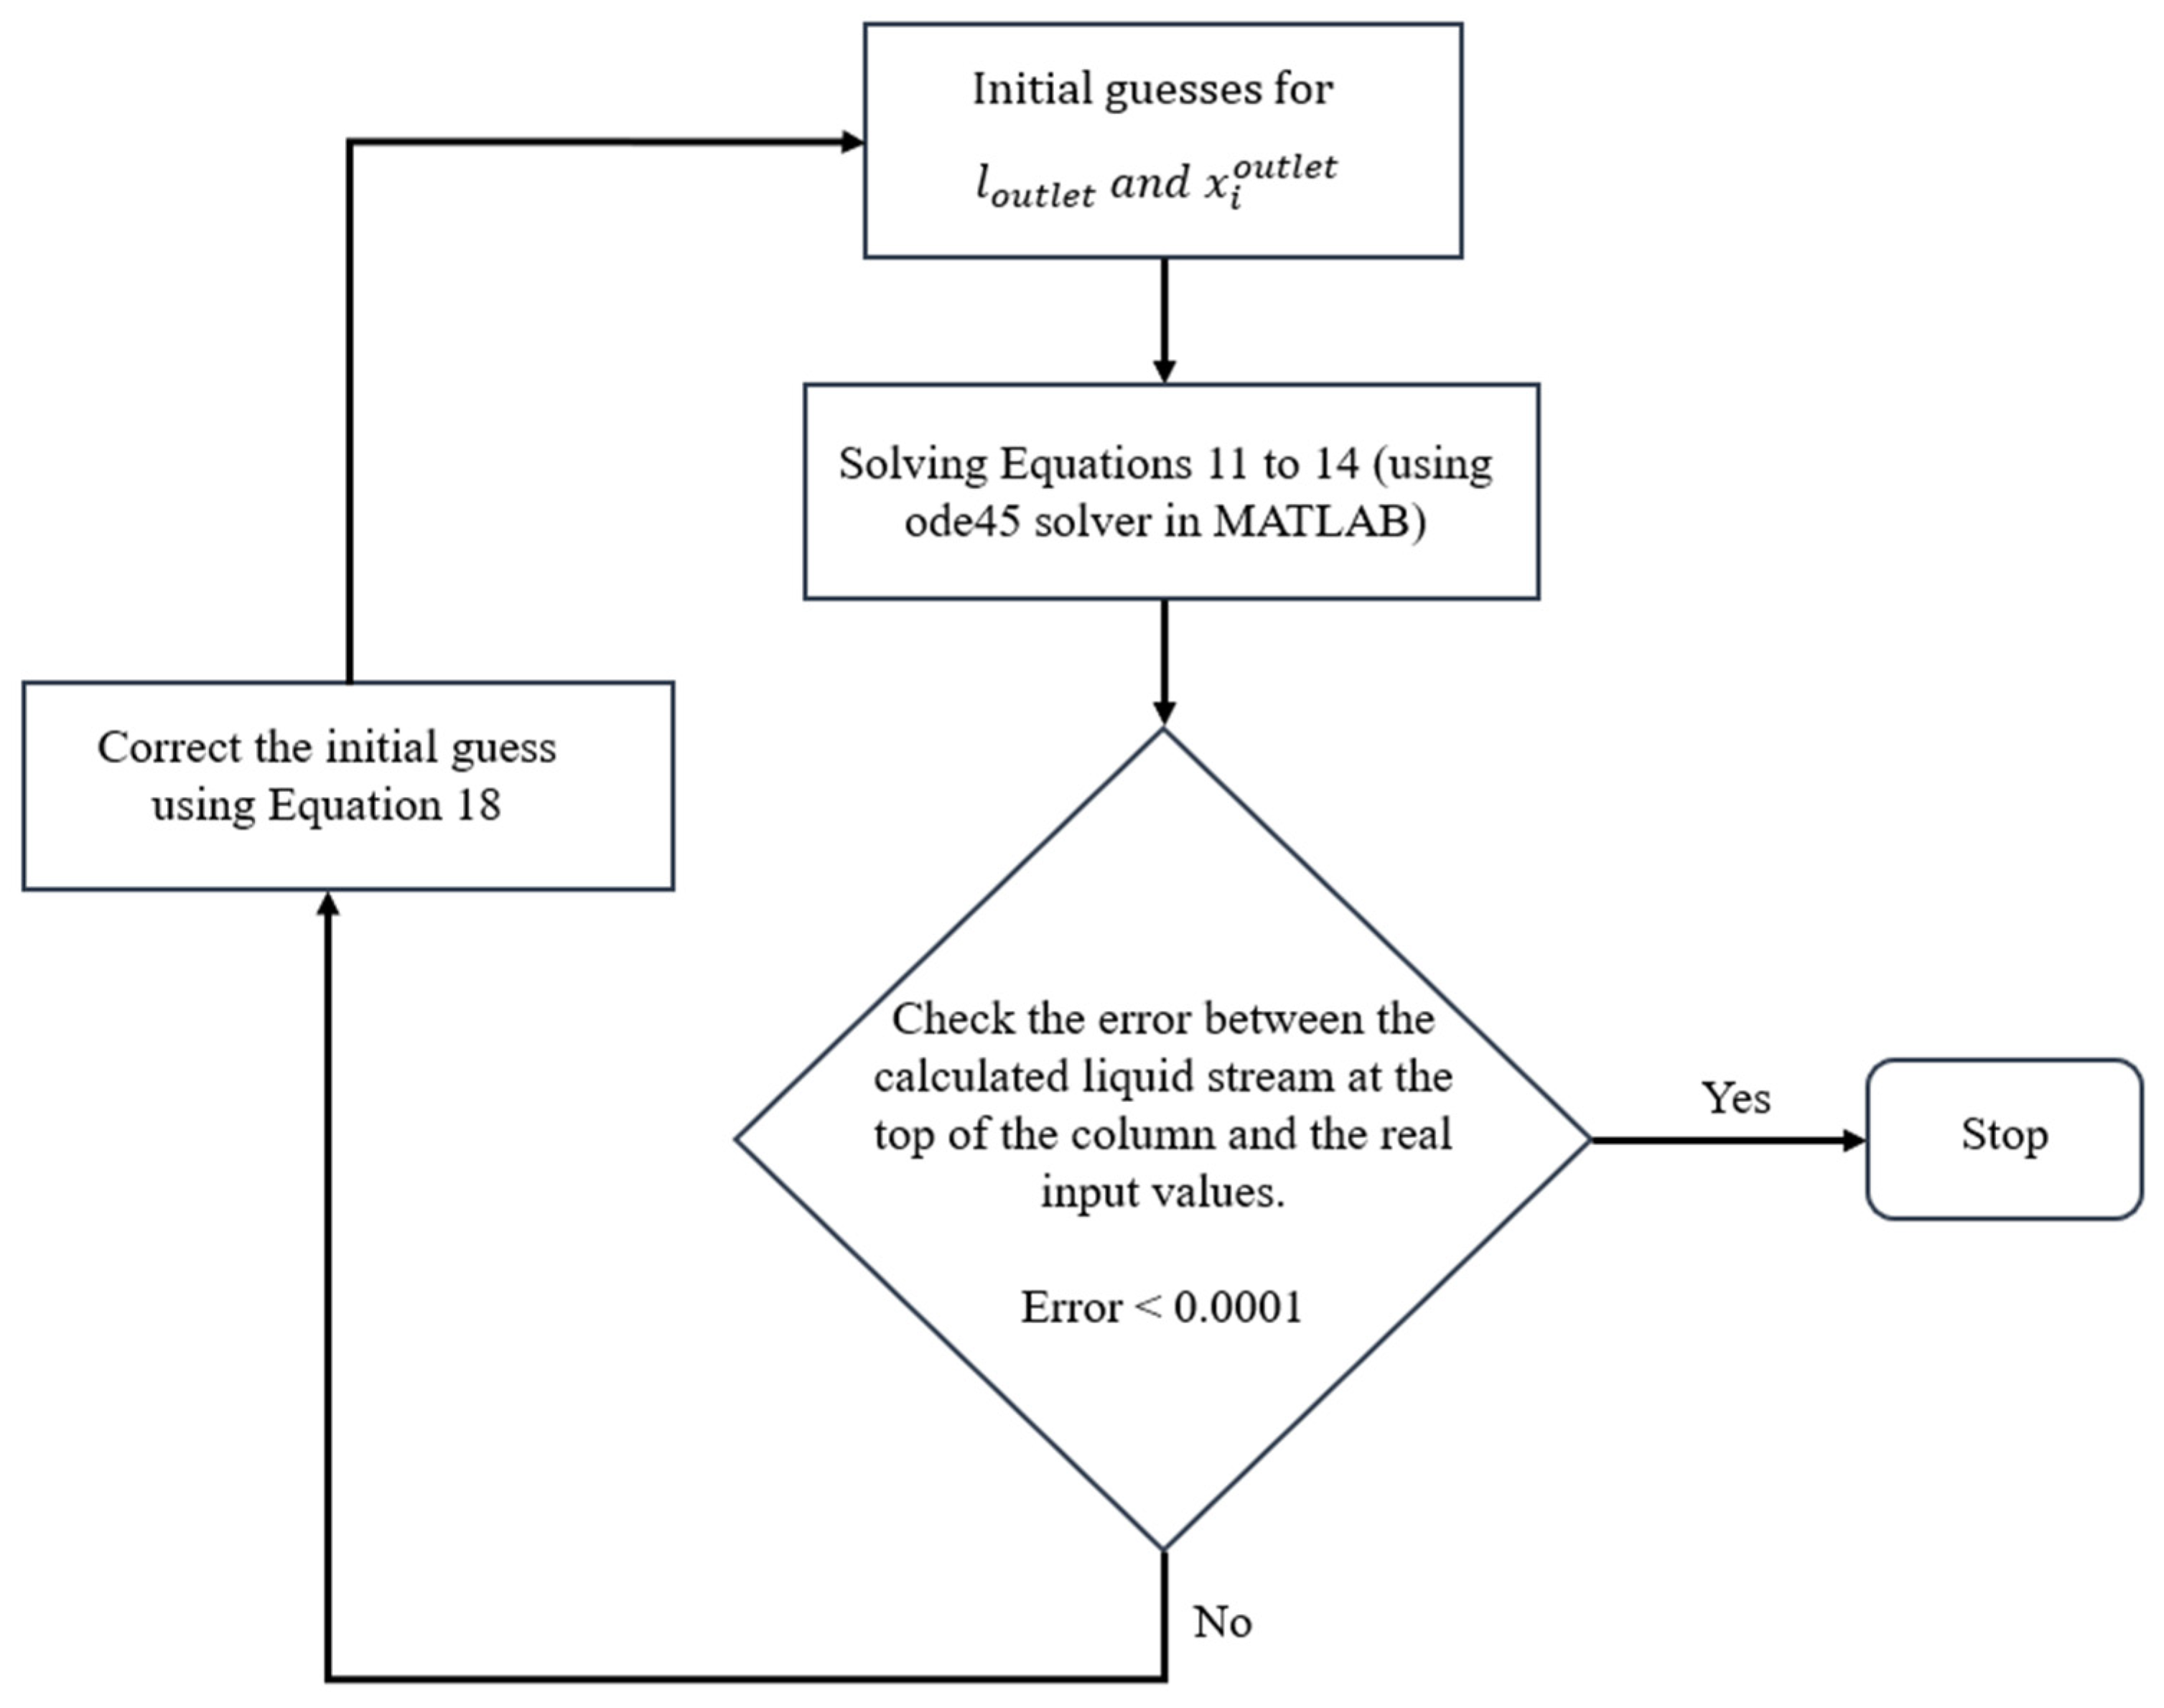
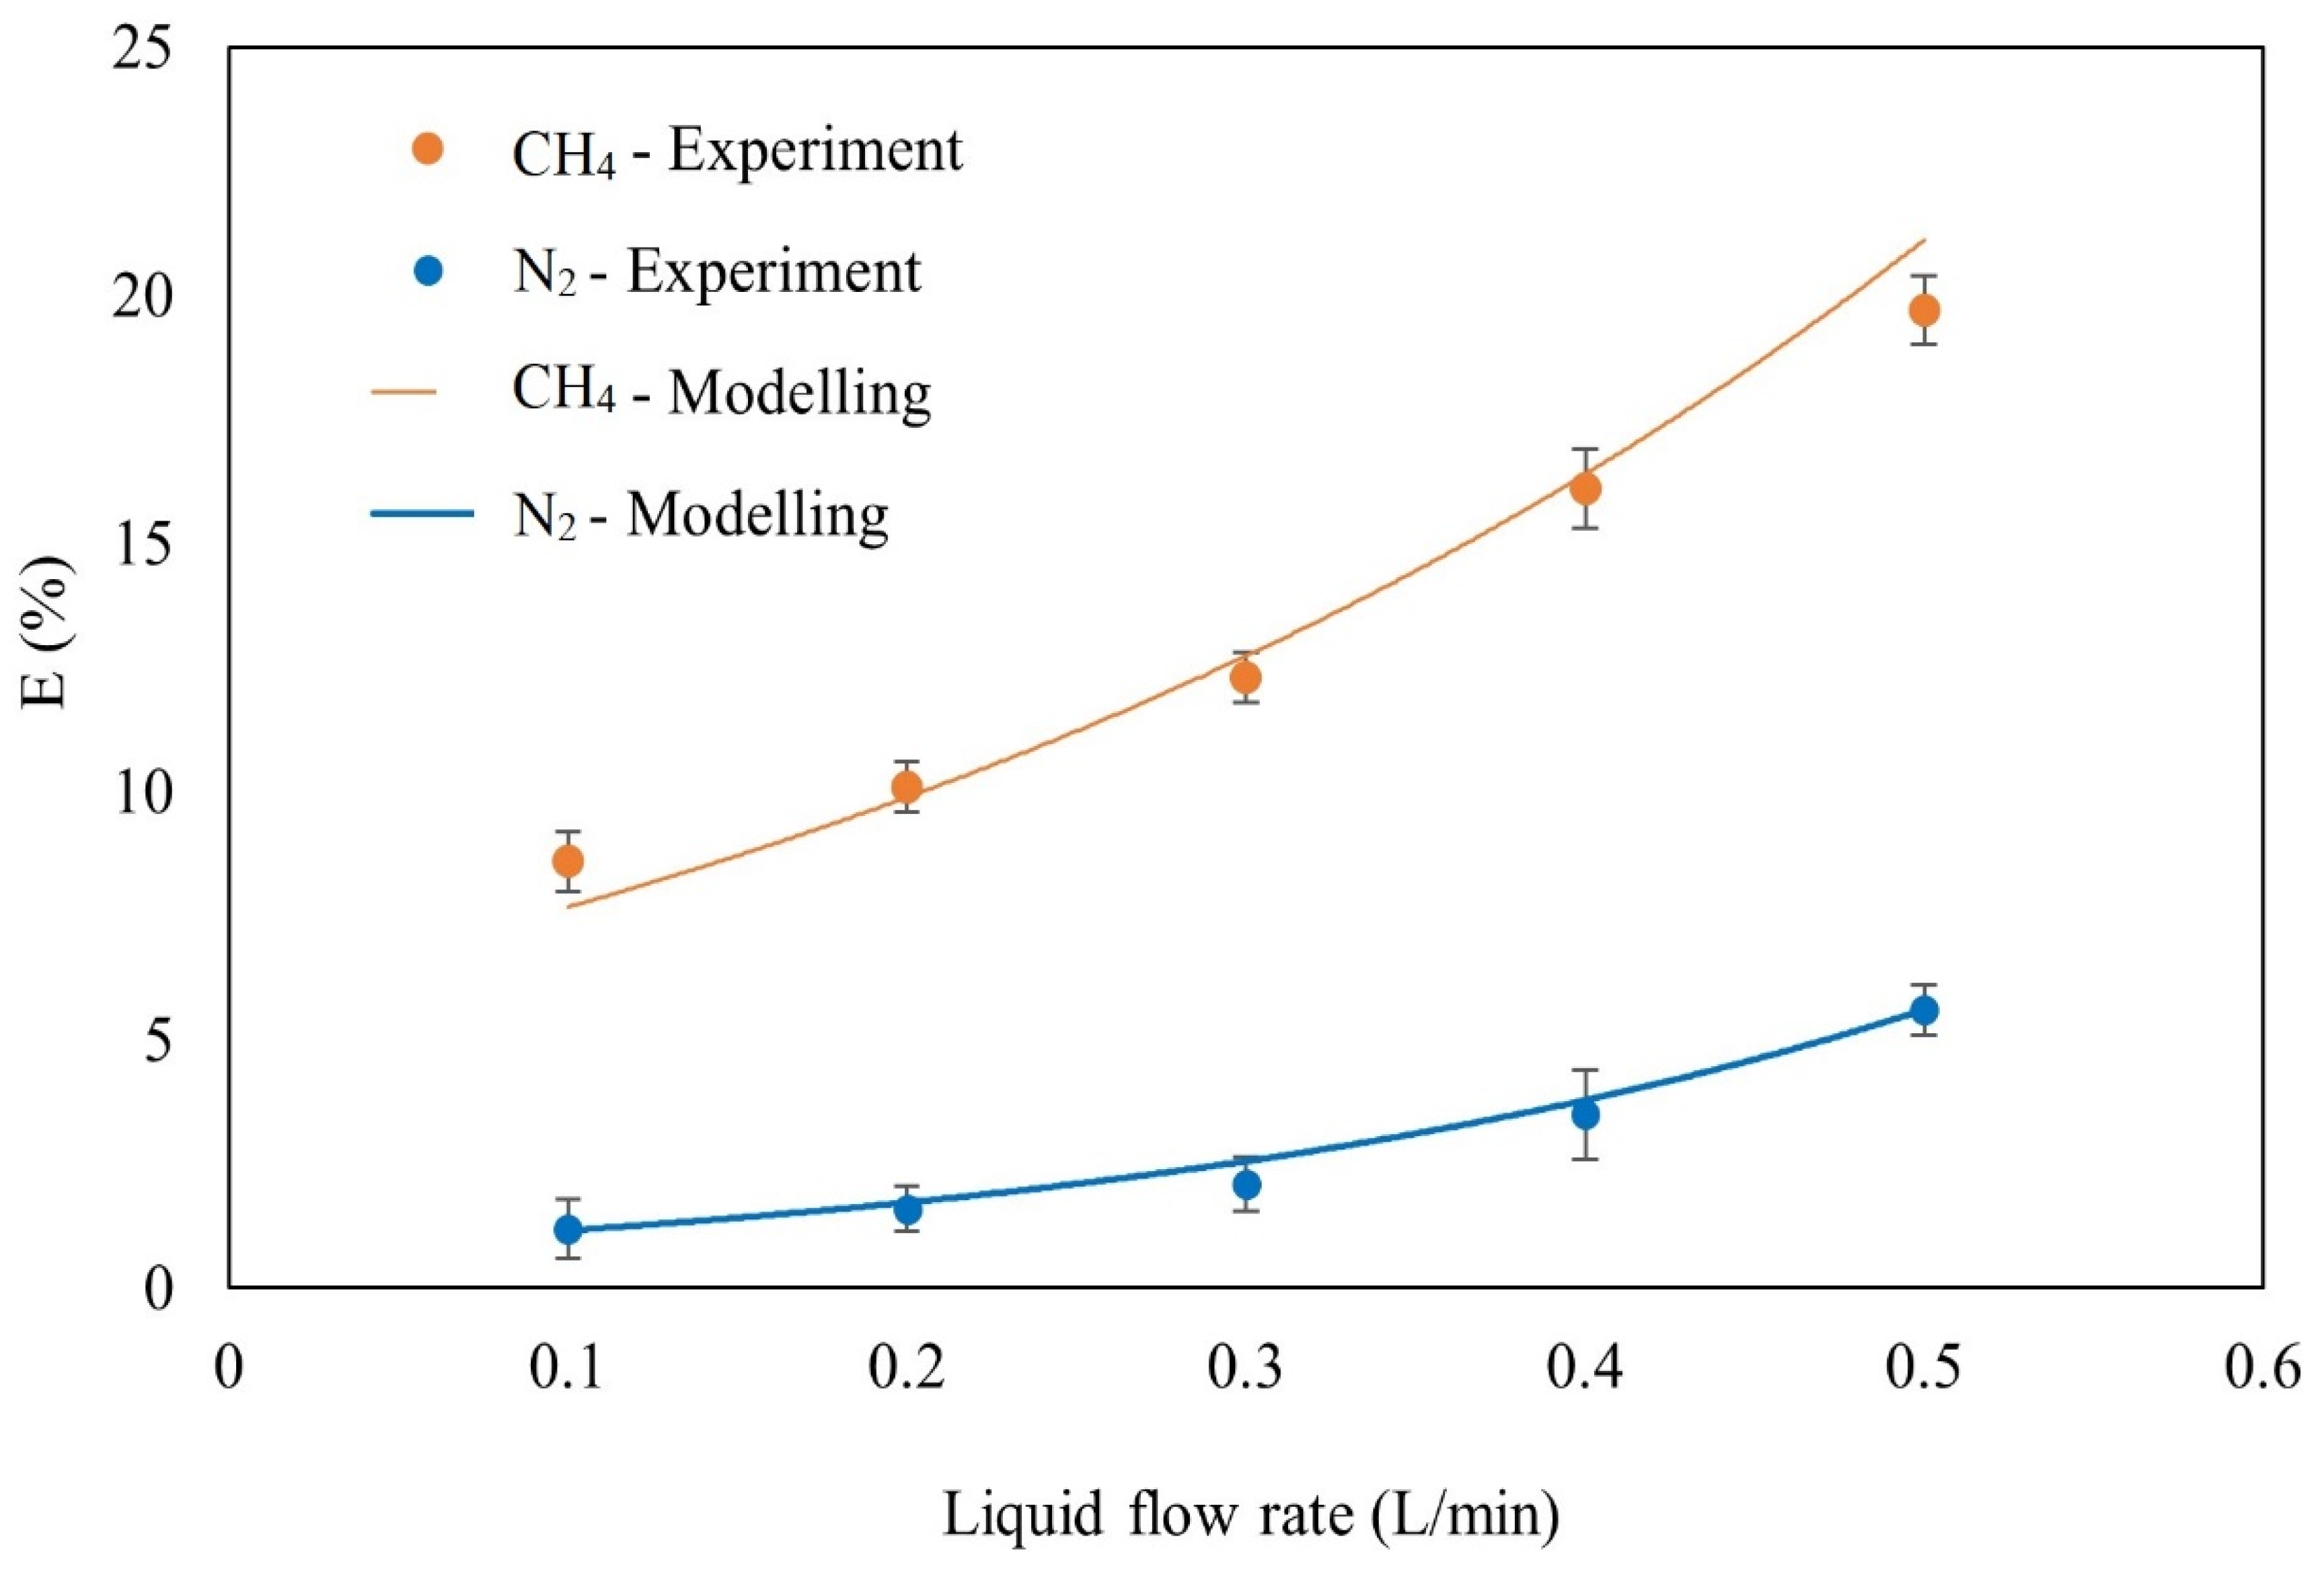
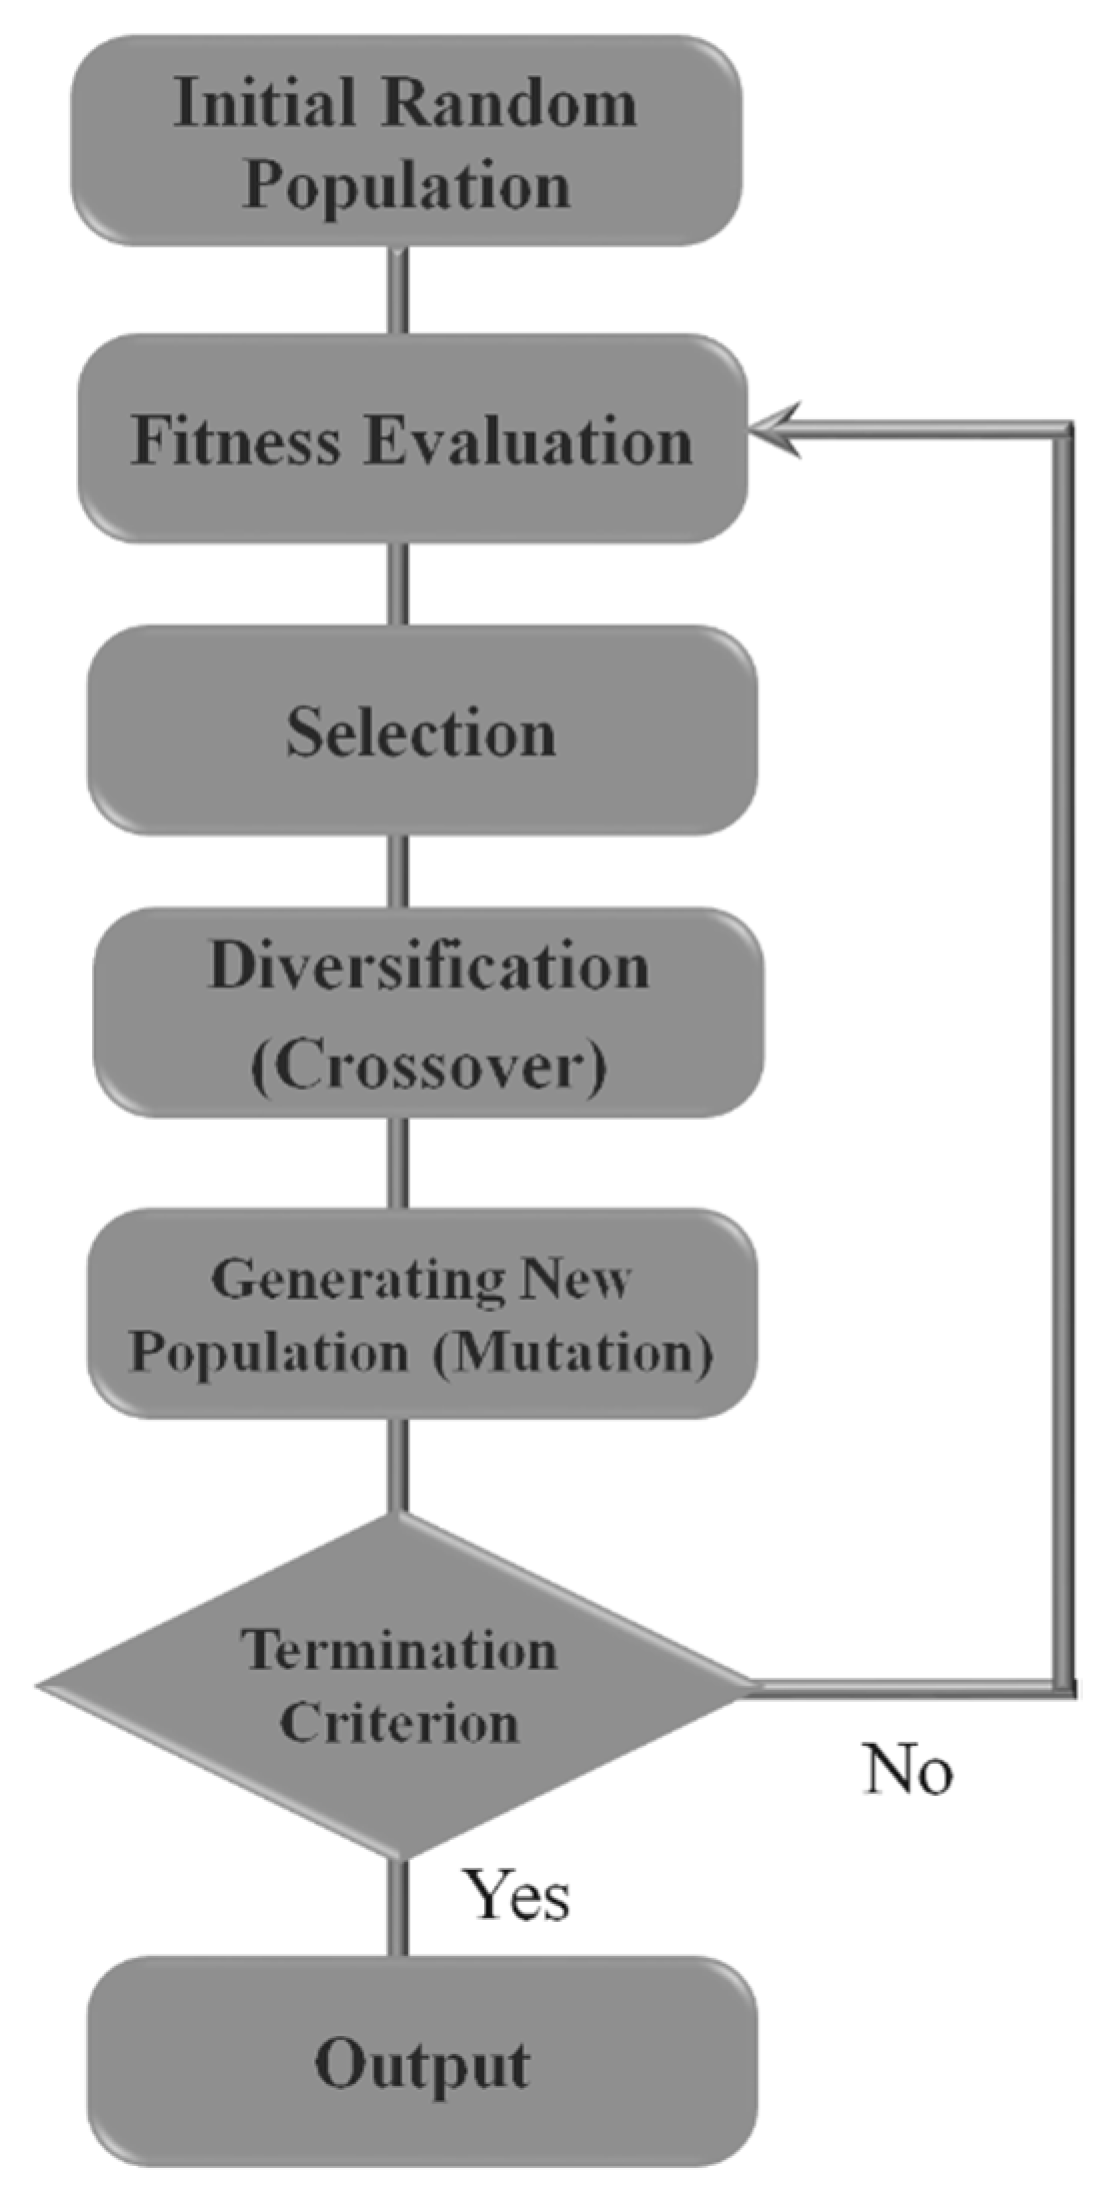
Table 1.
Experimental conditions for CH4 absorption by IL in a packed column.
| Experimental Parameter | Experimental Condition | ||
| Feed CH4 concentration (vol%) | 1 | ||
| Gas composition | CH4, N2 | ||
| Absorbent (IL) | [BMIM][TF2N] | ||
| Absorption temperature (K) | 303.15–363.15 | ||
| Desorption temperature (K) | 353.15–433.15 | ||
| Liquid flow rate (L/min) | 0.1–0.5 | ||
| Gas flow rate (L/min) | 0.1–0.6 | ||
| Absorption pressure | Atmospheric pressure | ||
| Desorption pressure (MPa) | −0.005–−0.02 | ||
| Packing type | Raschig rings | ||
| Packed bed length (m) | 0.4 | ||
| Glass tube height (m) | 0.8 | ||
| Inner diameter of glass tube (m) | 0.11 | ||
| Packing Properties | |||
| Packing surface area (m2/m3) | Packing void fraction | ||
| Packing size (mm) | 6 | 156 | 0.6 |
| 10 | 400 | 0.74 | |
Table 2.
The results of error analysis at T = 303.15 K, gas flow = 0.1 L/min, dp = 6 mm, (Cin)CH4 = 1 vol%, and counter-current pattern.
Table 2.
The results of error analysis at T = 303.15 K, gas flow = 0.1 L/min, dp = 6 mm, (Cin)CH4 = 1 vol%, and counter-current pattern.
| Liquid Flow Rate (L/min) | ECH4 (Exp. 1) (%) | ECH4 (Exp. 2) (%) | ECH4 (Exp. 3) (%) | Average (%) | Standard Deviation (%) | Standard Error (%) |
|---|---|---|---|---|---|---|
| 0.5 | 23.51 | 21.93 | 24.89 | 23.43 | 1.22 | 0.71 |
| 0.4 | 19.35 | 17.44 | 22.01 | 19.59 | 1.86 | 1.07 |
| 0.3 | 15.87 | 17.73 | 14.53 | 16.04 | 1.31 | 0.75 |
| 0.1 | 13.79 | 15.22 | 11.63 | 13.53 | 1.48 | 0.85 |
Table 3.
Relative errors between the mathematical model and the experimental results at different liquid flow rates, T = 303.15 K, gas flow = 0.1 L/min, dp = 10 mm, and counter-current pattern.
Table 3.
Relative errors between the mathematical model and the experimental results at different liquid flow rates, T = 303.15 K, gas flow = 0.1 L/min, dp = 10 mm, and counter-current pattern.
| Liquid Flow Rate (L/min) | ECH4 Relative Error (%) | EN2 Relative Error (%) |
|---|---|---|
| 0.1 | −8.1 | −8.3 |
| 0.3 | 4.9 | 4.8 |
| 0.4 | 2.5 | 8.6 |
| 0.5 | 4.6 | −5.3 |
Table 4.
Critical surface tension and wetted surface area of different packing materials at T = 303.15 K and a liquid flow rate of 0.5 L/min for a packing size of 6 mm.
Table 4.
Critical surface tension and wetted surface area of different packing materials at T = 303.15 K and a liquid flow rate of 0.5 L/min for a packing size of 6 mm.
| Packing Material | σc (N/m) | aw (m2/m3) |
|---|---|---|
| Glass | 0.073 | 245.00 |
| Steel | 0.071 | 243.74 |
| Carbon | 0.060 | 232.69 |
| Ceramic | 0.061 | 223.31 |
| PVC | 0.040 | 163.98 |
| Paraffin | 0.020 | 80.00 |
Table 5.
The effect of liquid flow rate and packing diameter on the liquid side mass transfer coefficient of CH4 and CH4 mass transfer rate at T = 303.15 K, gas flow = 0.1 L/min, and counter-current pattern.
Table 5.
The effect of liquid flow rate and packing diameter on the liquid side mass transfer coefficient of CH4 and CH4 mass transfer rate at T = 303.15 K, gas flow = 0.1 L/min, and counter-current pattern.
| Liquid Flow Rate (L/min) | Packing Diameter (mm) | klCH4 × 104 (mol/m2s) | CH4 Mass Transfer Rate All over the Packing × 107 (mol/s) |
|---|---|---|---|
| Packing diameter of 10 mm | |||
| 0.5 | 10 | 1.37 | 1.13 |
| 0.4 | 10 | 1.08 | 0.90 |
| 0.3 | 10 | 0.81 | 0.72 |
| 0.1 | 10 | 0.34 | 0.42 |
| Packing diameter of 6 mm | |||
| 0.5 | 6 | 0.77 | 1.34 |
| 0.4 | 6 | 0.70 | 1.11 |
| 0.3 | 6 | 0.52 | 0.95 |
| 0.1 | 6 | 0.26 | 0.72 |
Table 6.
The effect of temperature on the liquid side and overall mass transfer coefficients of CH4 at gas flow = 0.1 L/min, liquid flow = 0.1 L/min, dp = 10 mm, and counter-current pattern.
Table 6.
The effect of temperature on the liquid side and overall mass transfer coefficients of CH4 at gas flow = 0.1 L/min, liquid flow = 0.1 L/min, dp = 10 mm, and counter-current pattern.
| T (K) | klCH4 × 104 (mol/m2s) | Kov.CH4 × 105 (mol/m2s) |
|---|---|---|
| 303.15 | 0.34 | 1.11 |
| 323.15 | 0.63 | 0.92 |
| 343.15 | 1.15 | 0.61 |
| 363.15 | 2.89 | 0.46 |
Table 7.
The effect of liquid flow rate on the liquid side and overall mass transfer coefficients of CH4 and N2 at gas flow = 0.1 L/min, T = 303.15 K, dp = 10 mm, and counter-current pattern.
Table 7.
The effect of liquid flow rate on the liquid side and overall mass transfer coefficients of CH4 and N2 at gas flow = 0.1 L/min, T = 303.15 K, dp = 10 mm, and counter-current pattern.
| Liquid Flow Rate | ||||
|---|---|---|---|---|
| 0.5 | 1.37 | 4.52 | 6.47 | 1.01 |
| 0.4 | 1.08 | 3.56 | 4.66 | 0.73 |
| 0.3 | 0.81 | 2.67 | 2.76 | 0.43 |
| 0.1 | 0.34 | 1.11 | 1.35 | 0.21 |
Table 8.
The details of the genetic algorithm utilised.
| Parameter | Quantity/Description | |
|---|---|---|
| Solver | Genetic algorithm | |
| Bonds | Lower | [0.1 0.1 303.15] |
| Upper | [0.6 0.5 363.15] | |
| Population | Size | 50 |
| Selection | Selection function | Stochastic uniform |
| Reproduction | Elite count | Default (0.05 × population size) |
| Crossover function | Default (0.8) | |
| Mutation | Mutation function | Constraint dependent |
| Crossover | Crossover function | Constraint dependent |
| Migration | Direction | Forward |
| Fraction | Default (0.2) | |
| Interval | Default (20) | |
| Stopping criteria | Generations | Default (100 × number of variables) |
| Time limit | Default (inf) | |
| Fitness limit | Default (inf) | |
| Stall generations | Default (50) | |
| Stall time limit | Default (inf) | |
| Function tolerance | Default (1 × 10⁻⁶) | |
Table 9.
Decision variables in the optimisation procedure and the optimum value acquired.
| Variable | Range | Optimum Value |
|---|---|---|
| D = 6 mm | ||
| Gas flow rate | 0.1–0.6 (L/min) | 0.10 ≈ 0.1 (L/min) |
| Liquid flow rate | 0.1–0.5 (L/min) | 0.49 ≈ 0.5 (L/min) |
| Absorption temperature | 303–363 (K) | 303.4 (K) |
| OF | Mean | 76.19 |
| Iterations | - | 52 |
| - | 23.80 |
Disclaimer/Publisher’s Note: The statements, opinions and data contained in all publications are solely those of the individual author(s) and contributor(s) and not of MDPI and/or the editor(s). MDPI and/or the editor(s) disclaim responsibility for any injury to people or property resulting from any ideas, methods, instructions or products referred to in the content. |
© 2024 by the authors. Licensee MDPI, Basel, Switzerland. This article is an open access article distributed under the terms and conditions of the Creative Commons Attribution (CC BY) license (https://creativecommons.org/licenses/by/4.0/).
Share and Cite
MDPI and ACS Style
Rahimpour, H.R.; Zanganeh, J.; Moghtaderi, B. Point Source Capture of Methane Using Ionic Liquids in Packed Bed Absorbers/Strippers: Experimental and Modelling. Processes 2024, 12, 596. https://doi.org/10.3390/pr12030596
AMA Style
Rahimpour HR, Zanganeh J, Moghtaderi B. Point Source Capture of Methane Using Ionic Liquids in Packed Bed Absorbers/Strippers: Experimental and Modelling. Processes. 2024; 12(3):596. https://doi.org/10.3390/pr12030596
Chicago/Turabian StyleRahimpour, Hamid Reza, Jafar Zanganeh, and Behdad Moghtaderi. 2024. "Point Source Capture of Methane Using Ionic Liquids in Packed Bed Absorbers/Strippers: Experimental and Modelling" Processes 12, no. 3: 596. https://doi.org/10.3390/pr12030596
Note that from the first issue of 2016, this journal uses article numbers instead of page numbers. See further details here.