
Research and Optimization of Operating Parameters of a Rotor Classifier for Calcined Petroleum Coke
College of Materials Science and Engineering, Nanjing Tech University, Nanjing 211816, China
*
Author to whom correspondence should be addressed.
Processes 2024, 12(3), 603; https://doi.org/10.3390/pr12030603
Submission received: 29 February 2024
/
Revised: 11 March 2024
/
Accepted: 14 March 2024
/
Published: 18 March 2024
(This article belongs to the Section Particle Processes)
Abstract
:This article explores the impact of operating parameters on the classification efficiency of a rotor classifier. Based on the experimental data of calcined petroleum coke classification, a single-factor experimental analysis is conducted to find the relationship between operating parameters and classification performance. The cut size becomes progressively smaller as the rotor speed and feeding speed increase, and progressively larger as the inlet air volume increases. Newton’s classification efficiency and classification accuracy decreased with the increase in feeding speed. The range analysis of the orthogonal experiment shows that the rotor speed and inlet air volume have significant effects on the classification performance, but the effect of feed speed is relatively weak. In addition, the optimal combination of operating parameters is obtained by optimizing the operating parameters. Newton’s classification efficiency under this combination is estimated, and the estimated value is 82%. The verification experiment reveals that the Newton’s classification efficiency is 83.5%, which is close to the estimated value. Meanwhile, the classification accuracy is 0.626. This study provides theoretical guidance for the industrial production of calcined petroleum coke and accumulates basic experimental data for the development of air classifiers.
1. Introduction
Calcined petroleum coke is obtained by calcining petroleum coke at high temperatures under the condition of 1250 °C to 1350 °C. Because of its low cost, high carbon content, and easy graphitization, calcined petroleum coke finds extensive applications in various fundamental materials, such as electrolytic aluminum, carbon additive, and lithium-ion battery anode material. In particular, it has a very wide prospect in the application of lithium-ion battery anode materials [1,2]. The calcined petroleum coke has high product quality requirements in the production of the anode materials, such as narrow particle size distribution, neat morphology, and proper particle size. The average particle size of the petroleum coke is about 18 μm, so as to maximize the reversible de-embedding of the lithium ions when the first discharge-specific capacity reaches the maximum [3,4,5].
Particle size classification, as an important operating unit in the process industry, has stringent process requirements in food processing, mineral processing, new energy, and chemical industries. Nowadays, a third-generation dynamic air classifier, namely the turbo air classifier, is the mainstream equipment for particle size classification [6,7,8]. In recent years, most scholars have worked on researching and optimizing the structure of air classifiers with great success [9,10,11,12,13]. When the classifier structure parameters are determined, the classification performance can be improved by optimizing the operating parameters. With the rapid development of computational fluid dynamics, some scholars have conducted numerical simulation studies on the operating parameters of air classifiers using FLUENT software. The simulation results showed that when the rotor speed was too high, fine powder returned to the classifying area, thus reducing the classification performance; the particle size distribution of the fine powder group will be mixed with some coarse powder when the rotor speed is too low [14,15]. There is a corresponding matching relationship between the inlet air speed and the rotor speed. When the inlet air speed and rotor outer edge tangential speed are the same or similar, the inter-blade vortex intensity is weakened and the flow field is stable. Meanwhile, a narrow range of the cut size and high classification accuracy can be obtained [16,17,18]. The classification effect of less dense particles was better for the same operating parameters through the numerical simulation study [19].
The movement of particles during the actual classification process is complex, and interactions between particles, such as collisions, agglomeration, and interaction forces, may cause discrepancies between the simulation and experimental results. To predict the operating parameters affecting the classification performance, and to obtain more reliable empirical formulas, some researchers have conducted a large number of material experiments [20,21,22,23,24]. For example, dolomite classification experiments showed that for the VSK air classifier, inlet air speed and rotor speed have a significant effect on the cut size, while the feed rate has no significant effect [22]. Experiments on the classification of fluid catalytic cracking catalysts presented that the rotor speed and primary airflow of the new horizontal classifier had a strong influence on the cut size, while the classification accuracy was significantly affected by each operating parameter. The classification accuracy of the new horizontal classifier reached 1.55 [23]. Based on classification experiments of fly ash and cement clinker, for the LNJ-36A airflow classifier, the best classification effect is achieved when the ratio of secondary air volume to main air volume is kept at 0.168 [24].
Aiming at the problems of uneven material dispersion and serious wear of guide vanes, some scholars researched and designed a new rotor classifier and carried out numerical simulation and optimization of the internal structure [25,26,27]. To date, although many studies have been carried out to optimize the operating parameters, the results presented showed that there are differences in the optimum operating parameters for different classifiers and materials, and few studies have been reported on the calcined petroleum coke classification experiments. Hence, it is necessary to conduct experimental studies on the calcined petroleum coke classification using a rotor classifier.
At present, no experimental research report has been found on the optimal operating parameter decomposition of calcined petroleum coke. In order to better apply and develop calcined petroleum coke in the field of new energy, it is necessary to conduct experimental research on this.
This study aimed to investigate the influence of operating parameters on the classification performance by the calcined petroleum coke classification experiments. Then, a classification orthogonal experiment was designed, and the optimal operating parameter combination for the rotor classifier of the calcined petroleum coke classification was obtained through the range analysis of the classification performance index. The evaluation value corresponding to the optimal operating parameter combination was calculated, and the material experiment verified that the evaluation value was close to the experimental value. This study is a significant guide for practical industrial production applications.
2. Structure and Working Principle
The rotor classifier brings the raw material into the classifier through the downward air inlet, as shown in Figure 1a. Compared with the traditional air classifier, this equipment eliminates the spreading disc and air guide blade device, which reduces the dust concentration in the powder classification area, improves the wear and tear situation, and reduces its operation and maintenance costs. Meanwhile, the rotor rotation load of the classifier is reduced, and the power of its supporting drive motor is reduced.
The classification principle of the rotor classifier is as follows: the raw material is first pre-dispersed by a static disperser, and then enters the high-efficiency rotor classifier with airflow, as shown in Figure 1b. When the raw material enters the cone guide area, some coarser particles lose kinetic energy due to the sudden increase in channel cross-sectional area and the inertial effect of hitting the inverted cone, then are collected as a coarse powder group down along the cylinder wall. The remaining particles then enter the classifying area with the airflow, and the particles rotate rapidly with the airflow driven by the rotor cage. In the meantime, the particles in the classifying area are affected by gravity, air drag force, and centrifugal force. Coarse particles are subjected to a centrifugal force greater than the air drag force. Hence, they are thrown away from the rotor cage and hit the cylinder wall, losing kinetic energy and falling by gravity, then are collected into the coarse powder group. The centrifugal force on fine particles is less than the air drag force, hence they leave the classifier with the airflow through the blades and are collected in a cyclone and bag collector as the fine powder group.
3. Experiment
3.1. Raw Material and Experimental Setup
3.1.1. Raw Material
In this study, the calcined petroleum coke is used as the raw material for the experiment of the rotor classifier, and about 1 kg of the raw material was fed into the rotor classifier in each experiment. The raw material was analyzed with the Bettersize 2000 laser particle sizer (Dandong Baite Instrument Co., Ltd., Dandong, China), as shown in Figure 2.
3.1.2. Experimental Device
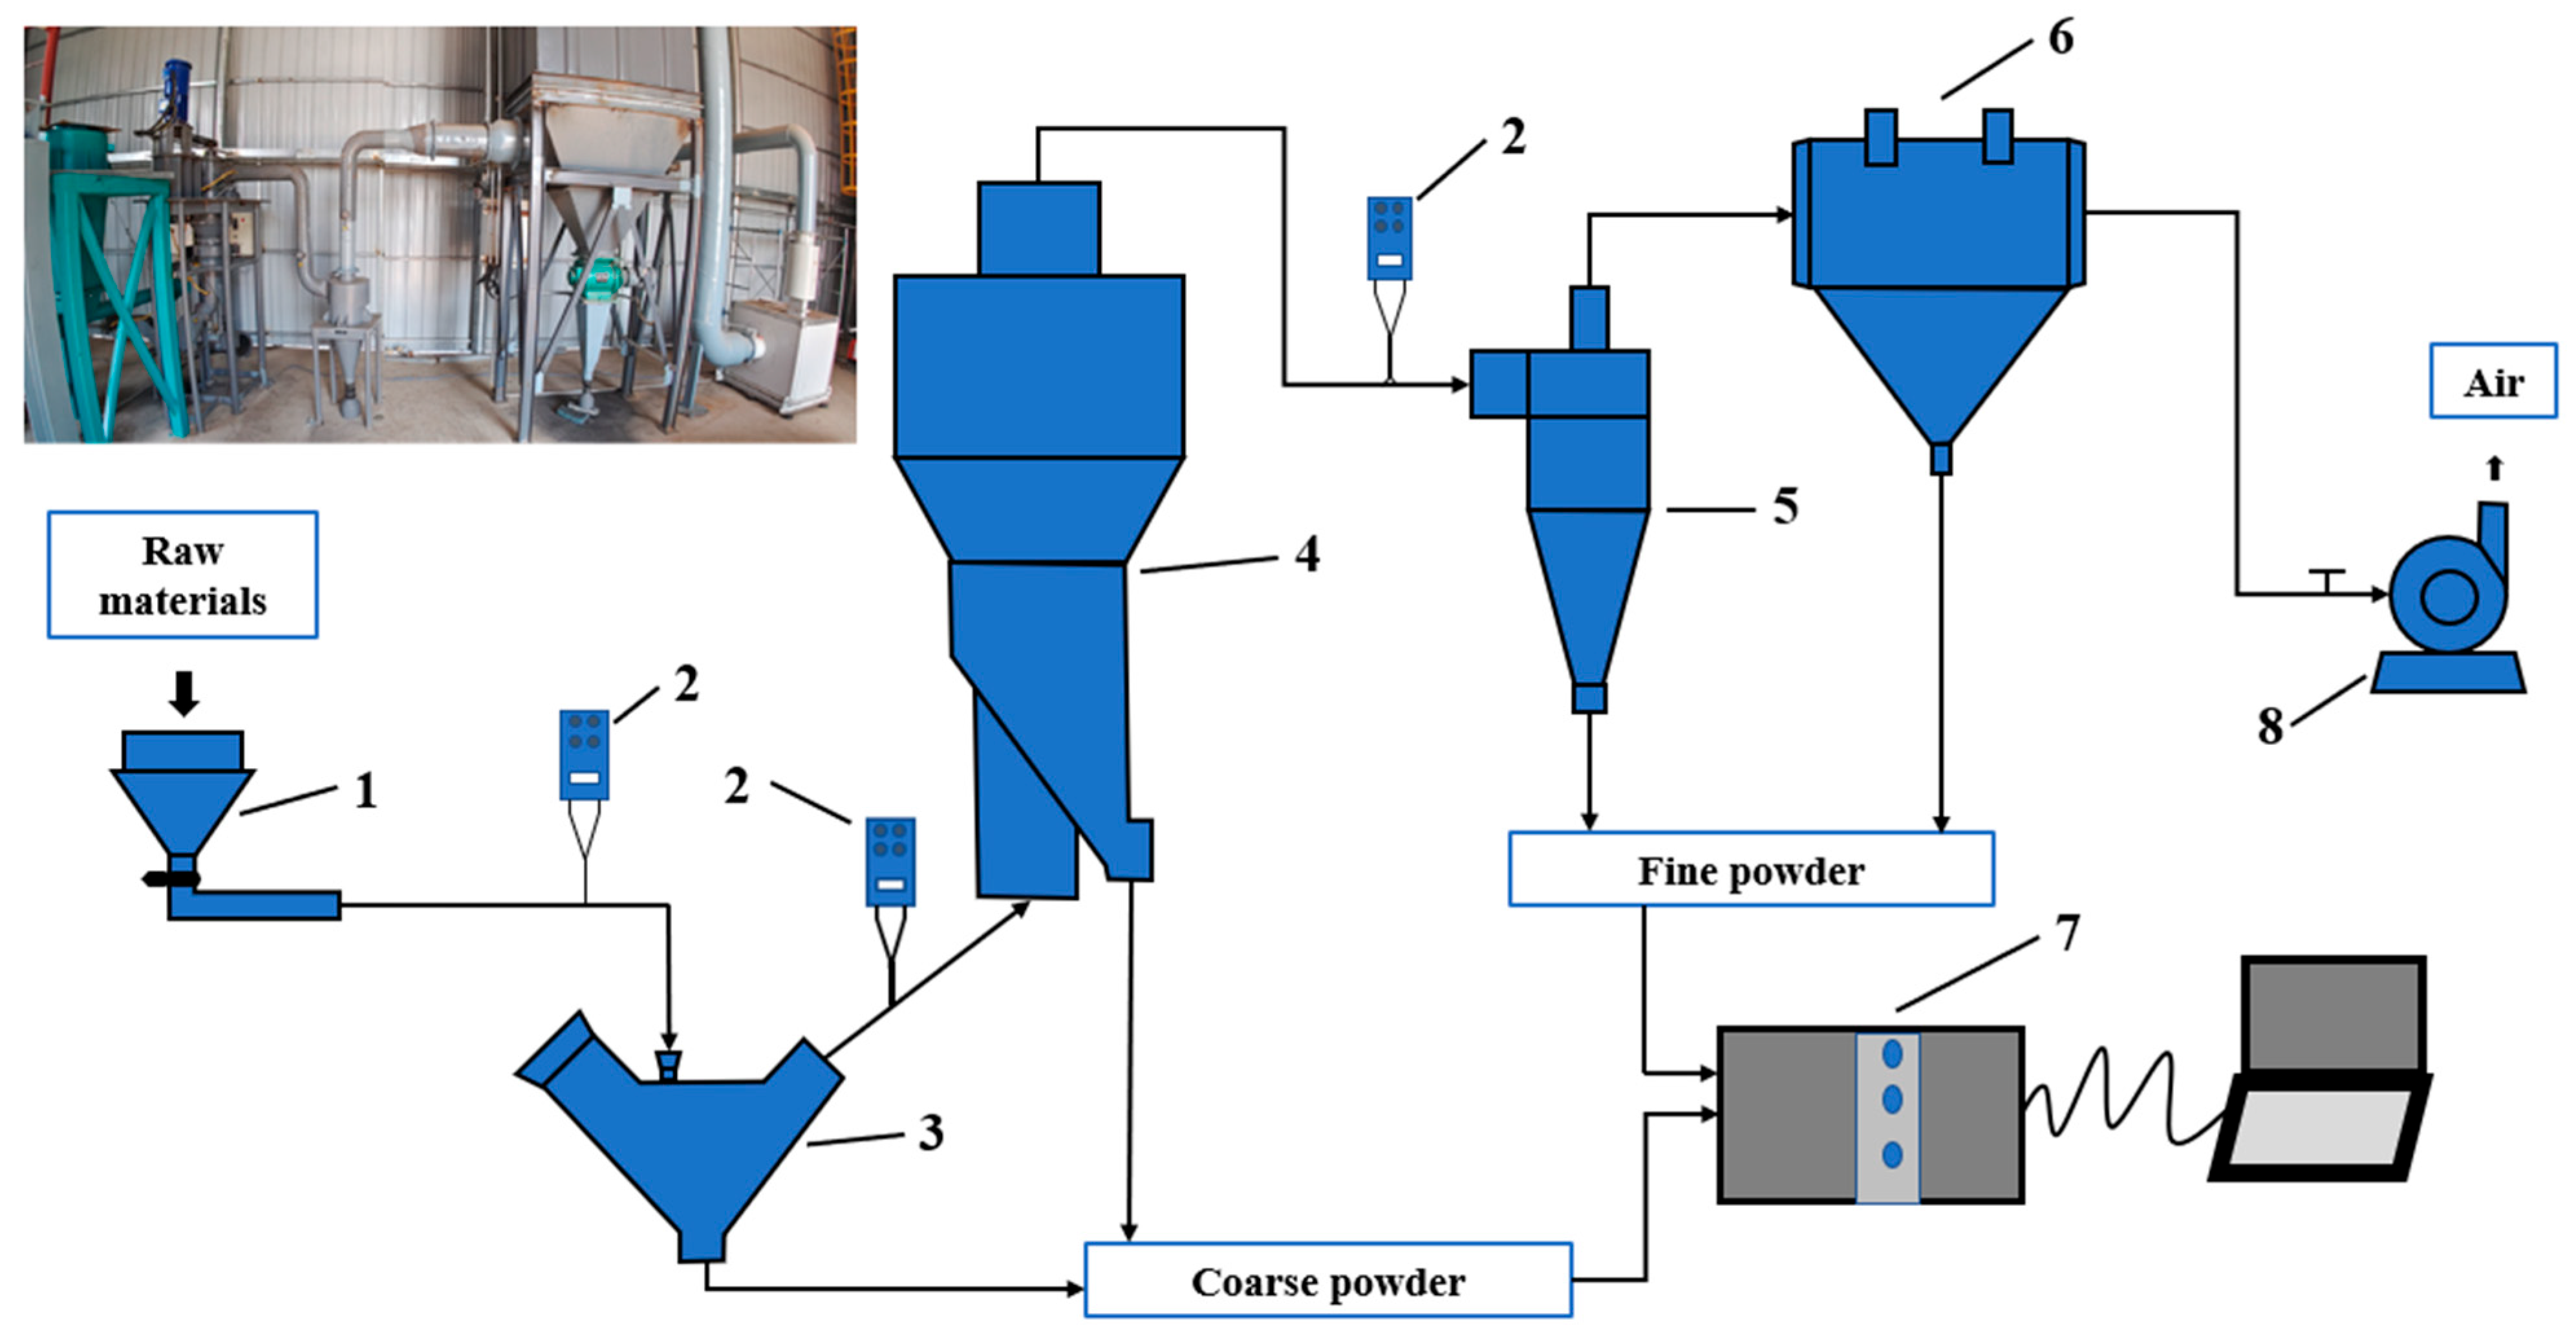
Figure 3 shows that the experimental classification system consists of the screw feeder, static disperser, rotor classifier, cyclone collector, bag filter, induced draft fan, and control system. System equipment parameters include the single tube spiral feeder with feed rates of 10 kg·h−1 to 200 kg·h−1 and the dynamic classifier with speeds of 200 rpm to 1450 rpm (Table 1). The induced draft fan provides negative pressure for the system. The calcined petroleum coke to be classified is fed into the static disperser by the screw feeder for pre-dispersion, and the pre-dispersion material is sucked into each classifier in turn due to the negative pressure. After classification, coarse particles are collected by the static disperser and the rotor classifier, and fine particles are collected by the cyclone collector and the bag filter. The collected samples were analyzed using a Bettersize 2000 model laser particle size distribution instrument.
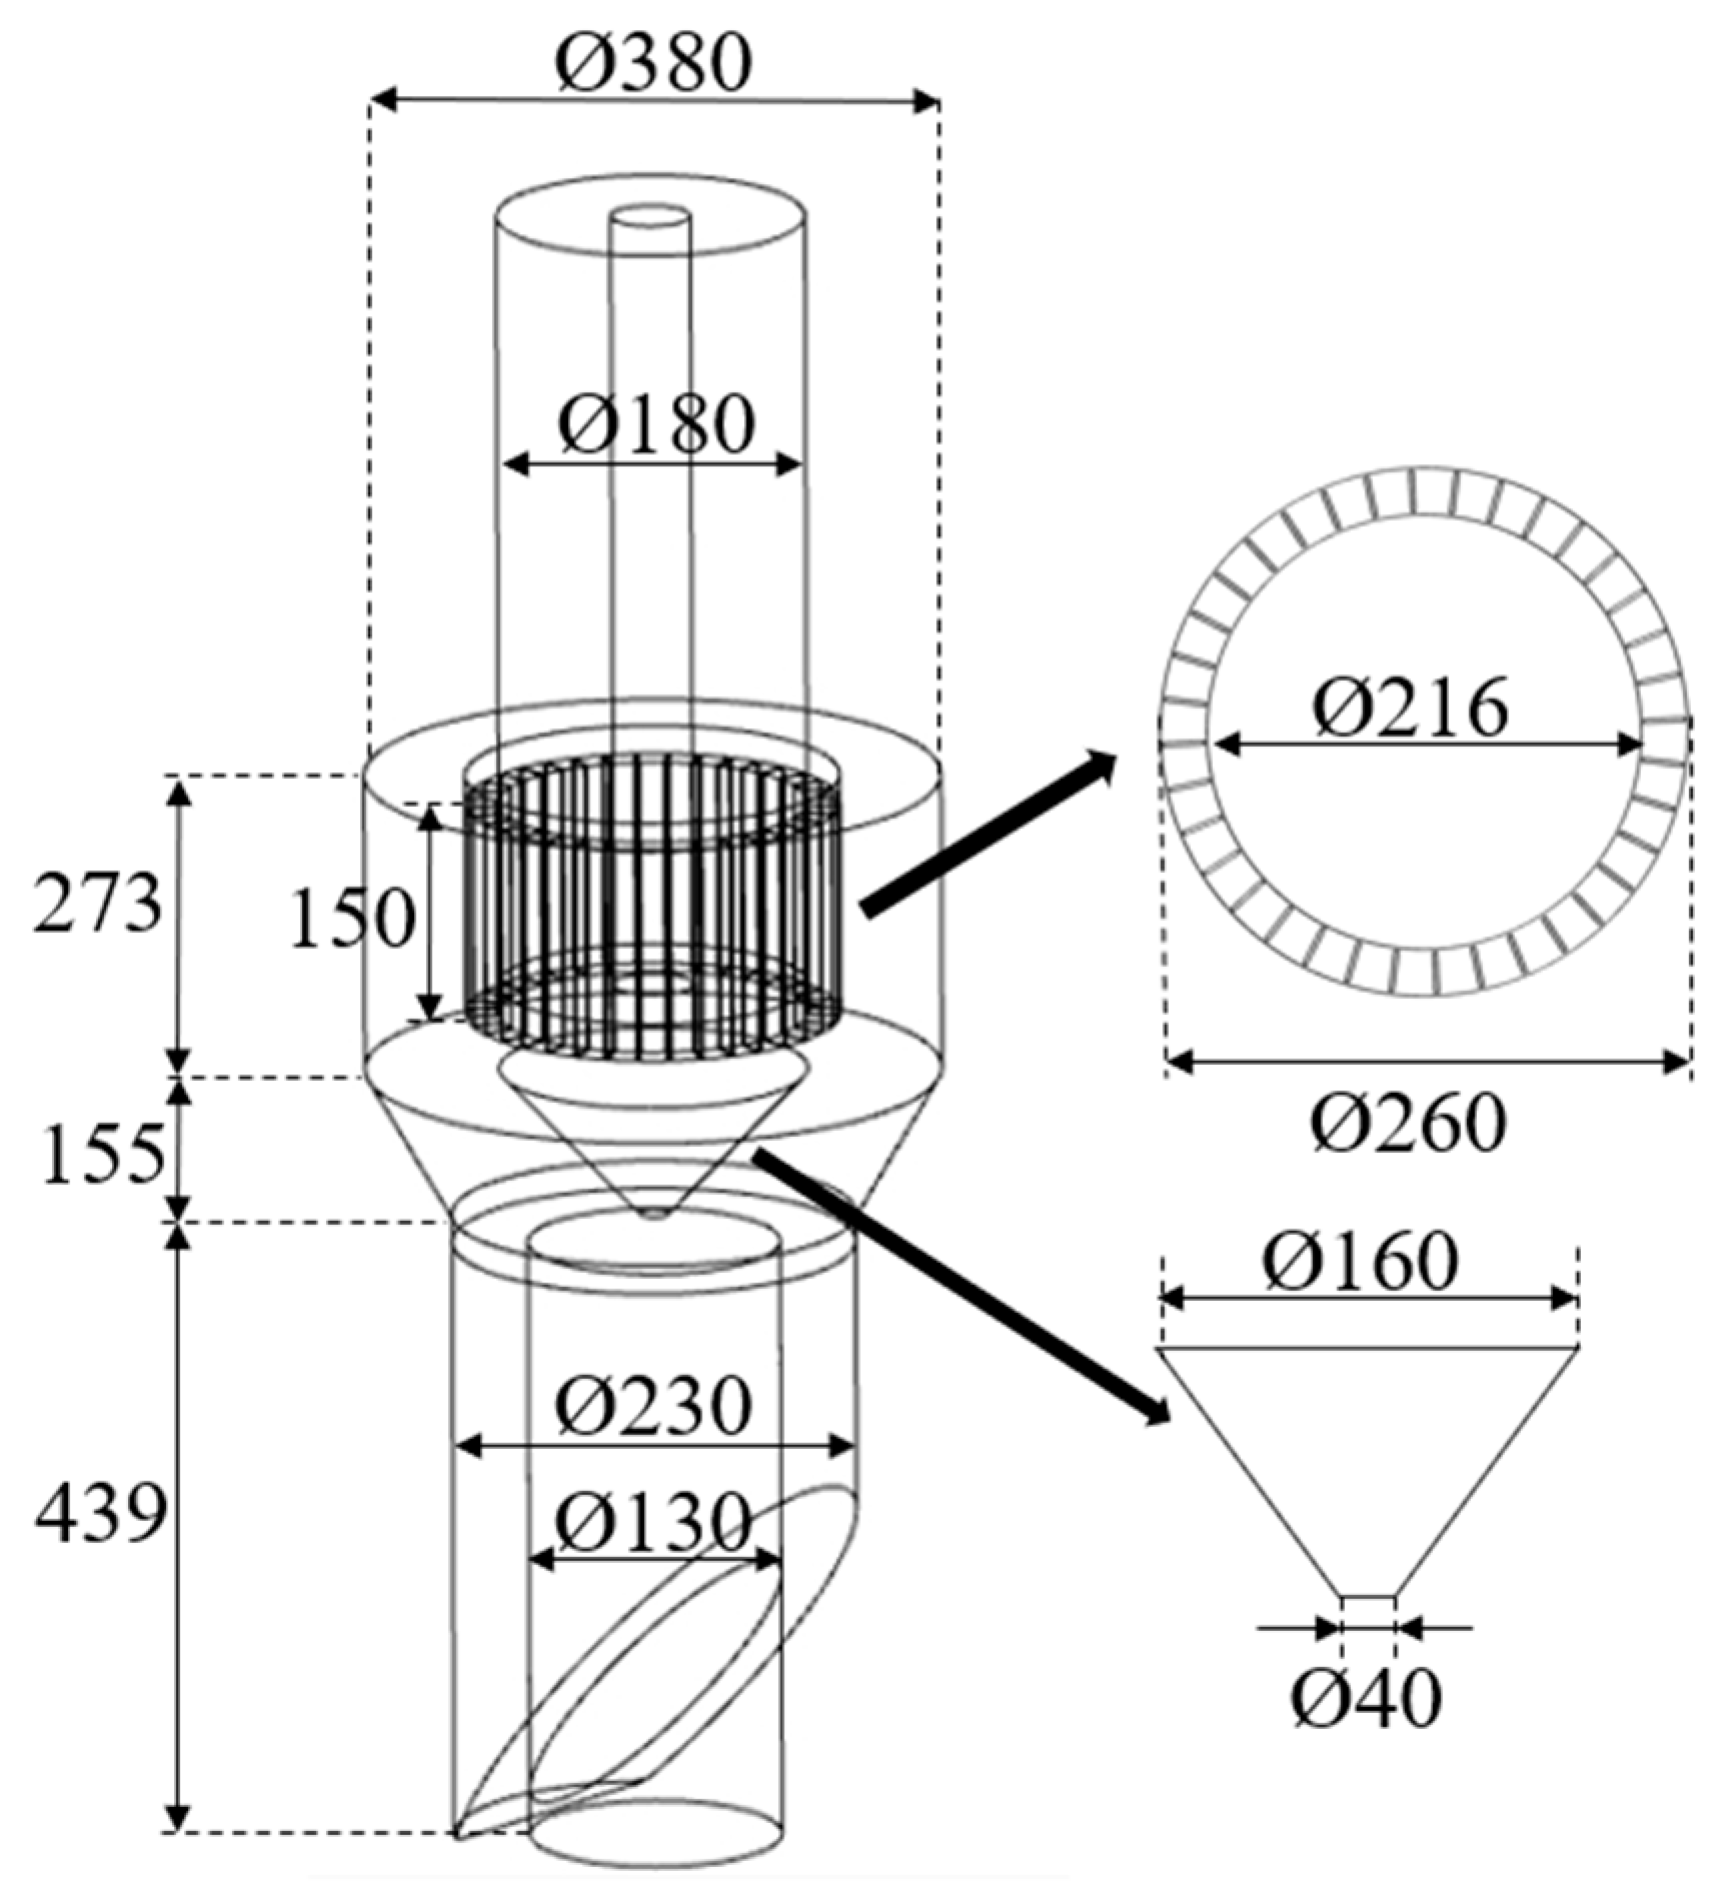
The rotor classifier is as shown in Figure 4. In total, 36 blades with a height of 150 mm, a length of 20 mm, and a thickness of 2 mm are uniformly distributed along the circumference of the rotor cage.
3.2. The Classification Performance Index
3.2.1. Newton’s Classification Efficiency (ηN)
Newton’s classification efficiency () is an accurate indicator of classification performance, which comprehensively examines the degree of separation of the coarse and fine powder particles [28]. The mathematical expression is:
where is the coarse powder recovery rate and is the fine powder recovery rate.
The coarse powder recovery rate meant the ratio of the mass of coarse particles in the coarse powder group to the mass of coarse particles in the raw material; the fine powder recovery rate also becomes the efficiency of powder selection, namely the ratio of the mass of fine particles in the fine powder group to the mass of fine particles in the raw material.
3.2.2. Cut Size (dc)
Cut size () reflects the fineness of the classified product. A particle size in the raw material equal to has a recovery rate of 50%, namely, the probability of a particle being classified into a fine powder group is the same as being classified into a coarse powder group. The cut size is numerically equal to the particle size corresponding to 50% in the partial classification efficiency (Tromp) curve [29].
3.2.3. Classification Accuracy (K)
Classification accuracy (K) reflects the clarity of particle classification, and its characteristic parameters can be obtained from the partial classification efficiency curve, with the steeper curve indicating better classification accuracy [6]. The mathematical expression is:
where and are the particle sizes corresponding to the partial classification efficiencies equal to 25% and 75%, respectively.
Ideally, the values of and are equal, and the K value is 1. The steeper the efficiency curve of some classifications, the closer the K value is to 1. When the K value is larger, the accuracy is higher and closer to the ideal state.
4. Experimental Results and Analysis
Due to the small number of particles larger than 100 μm in the raw materials, the coarse powder of the static classifier and the rotor classifier can be uniformly processed. The coarse powder collected in the static classifier selector is not measured, only weighed. The following results are all based on data analysis using coarse powder and fine powder.
4.1. Effect of the Operating Parameters on the Classification Performance
4.1.1. Effect of the Rotor Speed
To investigate the impact of the rotor speed on the classification performance, five sets of experiments with different rotor speeds (600 rpm, 800 rpm, 1000 rpm, 1200 rpm, and 1400 rpm) were designed. The feeding speed was kept constant at 0.985 kg·min−1 and the inlet air volume was kept constant at 600 m3·h−1.
The gradually decreases as the rotor speed increases, as shown in Table 2. The reason may be that an increase in rotor speed strengthens the centrifugal force field near the rotor cage. Some smaller particles are subjected to larger centrifugal forces, and cannot pass through the blades, resulting in a decrease in the size of the particles entering the fine powder group. Because particle impact probability against the blades increases at higher rotation speed, they are propelled to the wall.
An increase in the rotor speed with a constant inlet air volume leads to an increase in and a decrease in , as shown in Figure 5. Since the radial velocity of the gas is governed by the inlet air volume, under the condition of a constant inlet air volume, the tangential velocity of gas increases with the increase in rotor speed. When the tangential velocity of the gas is much greater than the radial velocity, it increases the probability of particles entering the coarse powder group. The combined effect of and leads to an increase and then a decrease in .
K decreases when the rotor speed is either too low or too high, and the optimal speed is 1000 rpm, as shown in Figure 6. Considering this, it can be concluded that a suboptimal rotor speed will reduce the classification effect. Hence, with a constant inlet air volume, there is a reasonable rotor speed to match it to make the best classification effect.
Through the analysis of the classification performance indexes at different rotor speeds, it is found that an increase in rotor speed will increase the classification effect, but too high a rotor speed will reduce the classification effect. This is mainly because the centrifugal force field increases with the rotor speed, which provides sufficient centrifugal force for particle classification; however, when the centrifugal force field is too large, it will lead to uneven distribution of the flow field inside the classifier.
4.1.2. Effect of the Inlet Air Volume
In order to study the impact of the inlet air volume on the performance of the classifier, five sets of experiments with different inlet air volumes (400 m3·h−1, 500 m3·h−1, 600 m3·h−1, 700 m3·h−1, and 800 m3·h−1) were designed. The feeding speed was kept constant at 0.985 kg·min−1, and the rotor speed was kept constant at 1000 rpm.
With a constant rotor speed, an increase in the inlet air volume leads to a decrease in and an increase in , as shown in Table 3. The reason is that the tangential velocity of the gas is governed by the rotor speed. With a constant rotor speed, the radial velocity of the gas increases with the inlet air volume much faster than the tangential velocity of the gas, thus increasing the chances of the particles entering the fine powder group [23]. Due to the joint effect of and , first increases and then decreases, and reaches the maximum at the inlet air volume of 500 m3·h−1.
The partial classification efficiency curves for the different inlet air volumes are illustrated gradually increases as the inlet air volume increases, as shown in Figure 7. It may be that the increase in the inlet air volume will increase the air drag force of the airflow on the particles within the classifying chamber, making it easier for some particles that should have entered the coarse powder group to pass through the blades into the fine powder group, hence increasing the particle size distribution within the fine powder group. Meanwhile, with the increase in the inlet air volume, K increases firstly and then decreases, and is highest at the inlet air volume of 500 m3·h−1. It may be that with the increase in the inlet air volume at the beginning, the classification force field is enhanced, which makes the particles fully dispersed. Reduce the agglomeration, collision, and other interactions between particles, thereby enabling more precise classification of particles. Nevertheless, when the inlet air volume continues to increase, the air drag force on the particles increases, resulting in a shortened residence time in the classification area. Therefore, the probability of coarse particles entering the fine powder group increases, and the grading effect decreases. Hence, with a constant rotor speed, there is a reasonable inlet air volume to match with it to make the best classification effect.
Through the analysis of classification performance indexes under different inlet air volumes, it is found that the increase in inlet air volume will increase the classification effect, but an excessive inlet air volume will reduce the classification effect. This is mainly because the drag force of the gas on the particles increases with the increase in the inlet air volume, which provides enough radial force for particle classification, but when the radial force is too large, it will lead to uneven distribution of the flow field inside the classifier.
4.1.3. Effect of the Feed Rate
In order to study the impact of the feed speed on the classification performance, five sets of experiments with different feed rates (0.685 kg·min−1, 0.985 kg·min−1, 1.350 kg·min−1, 1.680 kg·min−1, and 2.000 kg·min−1) were designed. The inlet air volume was kept constant at 600 m3·h−1 and the rotor speed was kept constant at 1000 rpm.
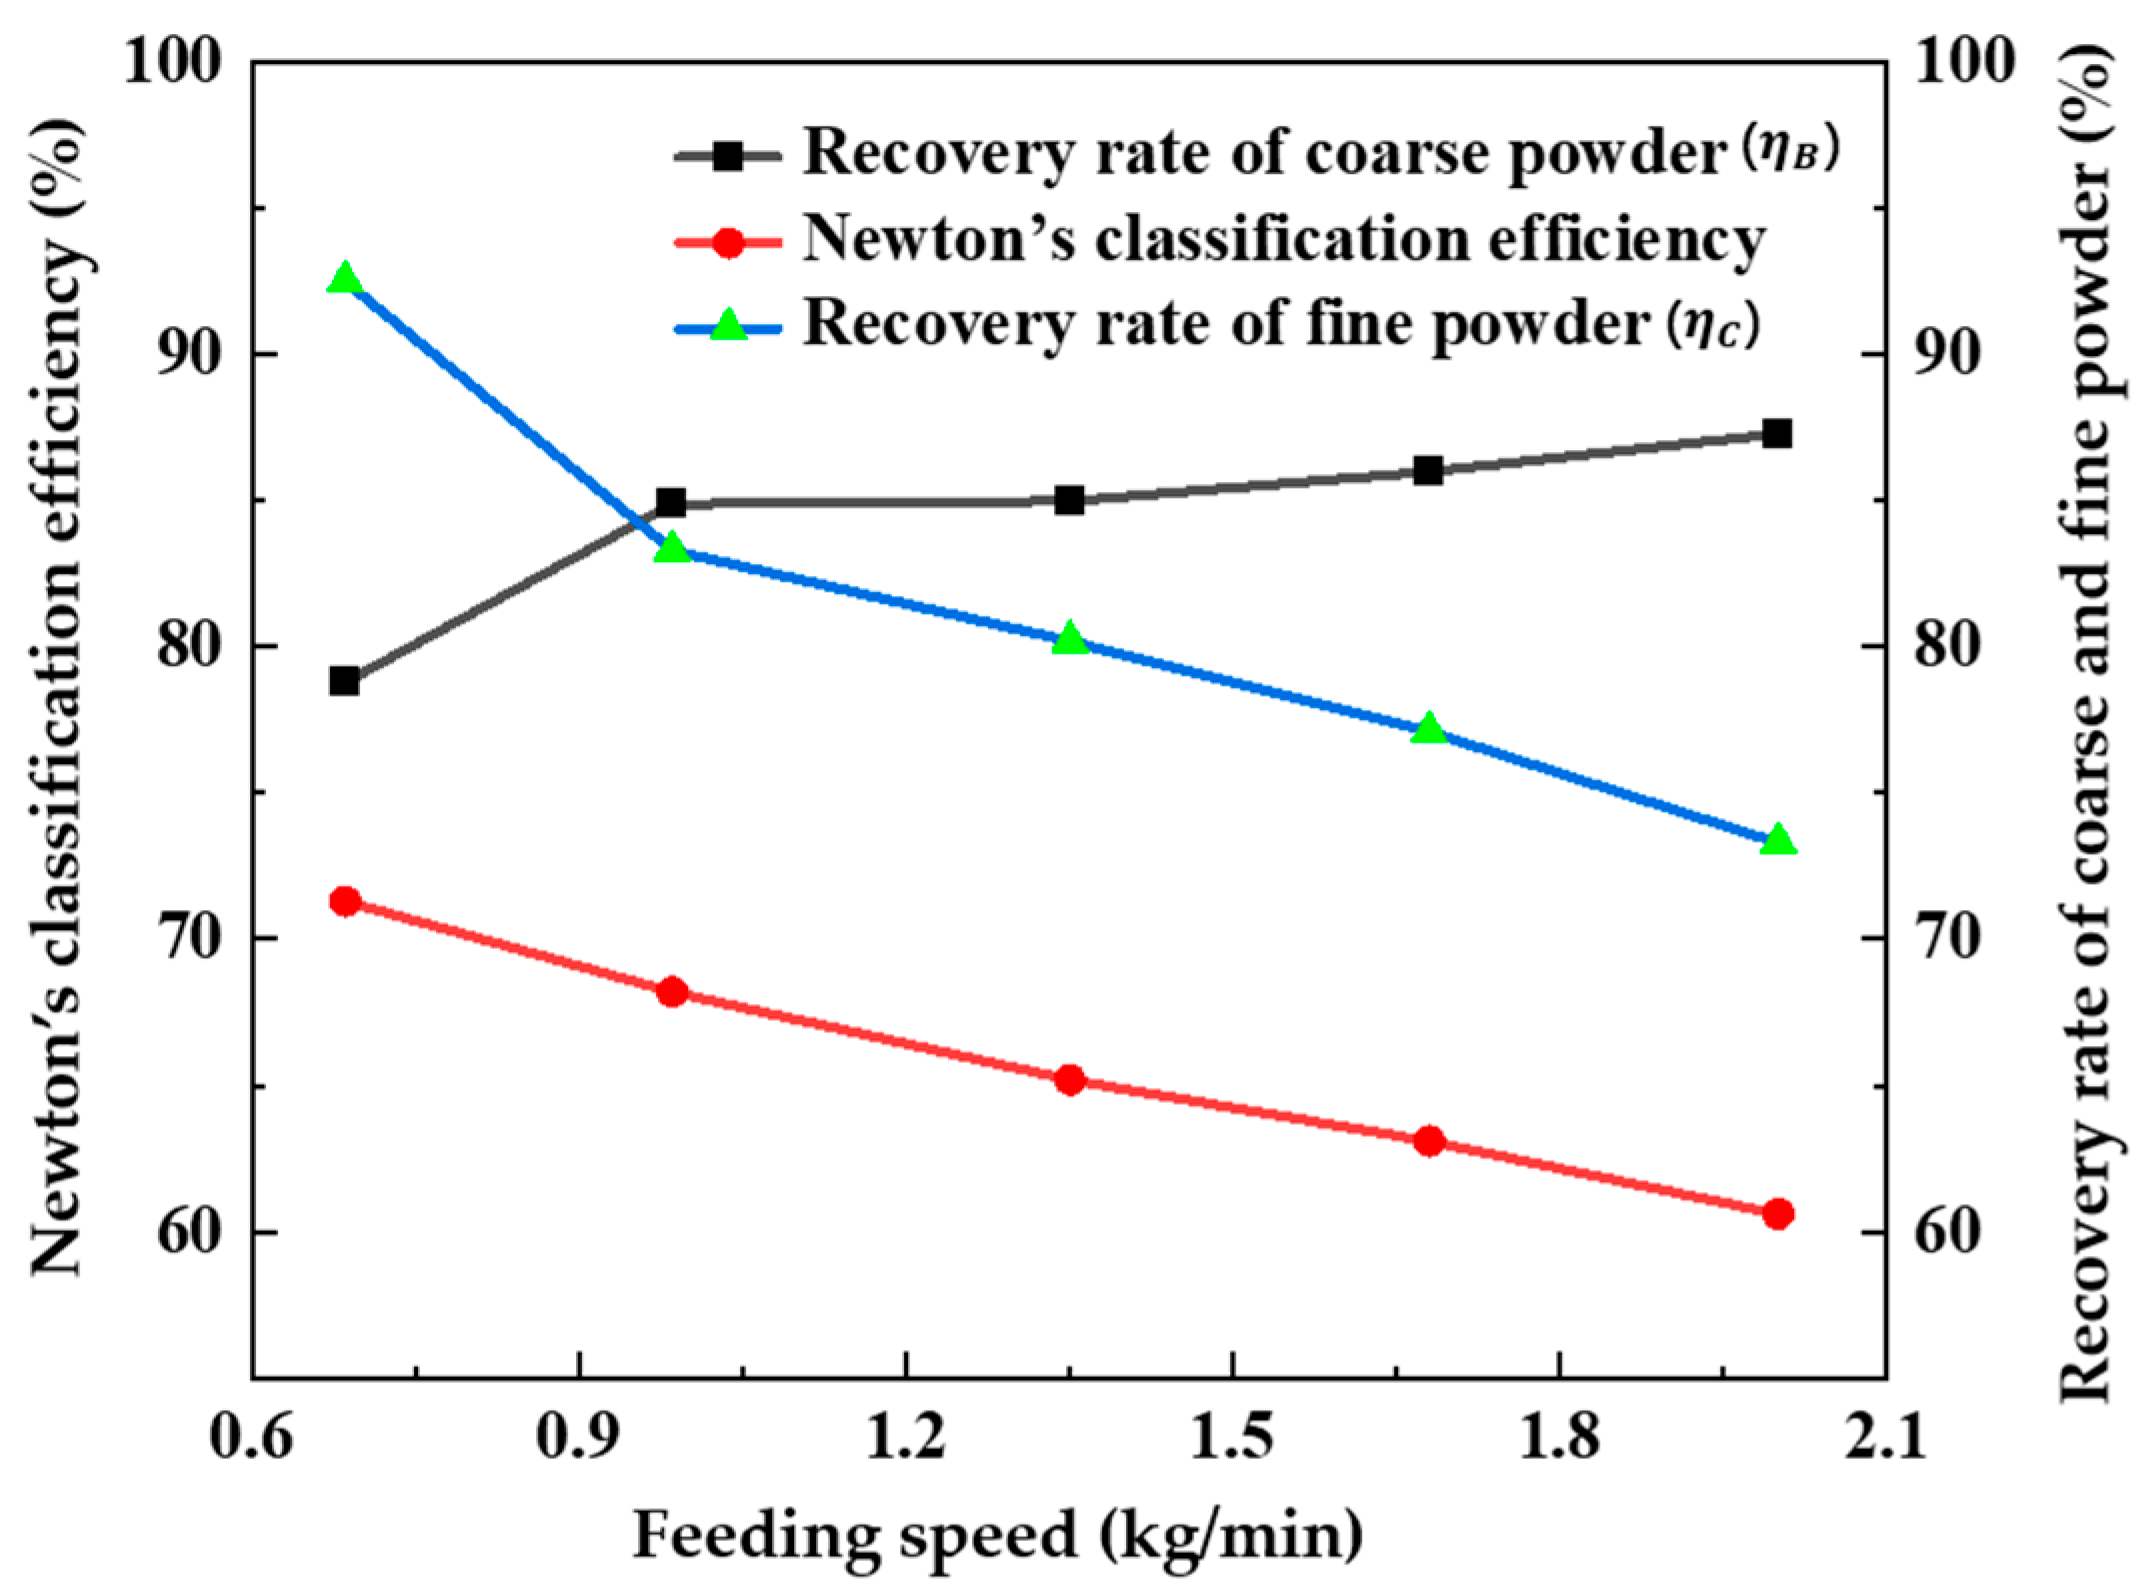
The increase in the feeding speed leads to an increase in , and a decrease in , and K, as shown in Figure 8 and Table 4. The reason may be that the increase in feeding speed increases the particle concentration in the classifying chamber and aggravates the agglomeration of the particles, interaction forces, and mutual collisions. Hence, the chance of the particles being selected as the coarse powder group increases, which leads to the reduction of the particle size in the fine powder group and the mixing of fine particles in the coarse powder group. The combined effect of and leads to a gradual decrease in .
4.2. Orthogonal Experiment
4.2.1. Orthogonal Experimental Range Analysis
To study the optimum working conditions of the rotor classifier for calcined petroleum coke classification, the internal relations among the parameters were discussed and the optimum combination of operating parameters was determined by the orthogonal experiment of three factors and three levels. The three factors in this paper are: (A) rotor speed (n) in rpm, (B) inlet air volume, Q m3·h−1, and (C) feeding speed, f kg·min−1, as shown in Table 5.
Based on the orthogonal experiment for the classification of calcined petroleum coke, calculated the value of , K, and , as shown in Table 6.
An orthogonal experimental range analysis based on the principles of mathematical statistics, using Newton’s classification efficiency () as an example, as shown in Table 7 [21].
The calculation results illustrate that for , > > , which means that factor A is the main influence factor, followed by factor B, and factor C has the least influence. For K, > > , hence factor B is the main influence, factor A is second and factor C has the least influence. For , , and are much larger than , indicating that factors A and B are the main influencing factors and factor C is less influential, as shown in Table 8 [21].
According to the results of the orthogonal experiment, it can be known that for , the best operating parameters combination for the rotor classifier is A2B2C1; for K, the best operating parameters combination is A2B1C1; for , the best operating parameters combination is A3B1C2, considering that this experimental equipment is a pilot scale with a small classifying chamber. When the rotor speed is too high, it will lead to the rebound of particles and reduce K. Meanwhile, according to the above study on the effect of inlet air volume on classification performance, too small inlet air volume will reduce the classification effect. Hence, we choose the operating parameters combination A2B2C1 as the best operating combination of this classifier for calcined petroleum coke classification.
4.2.2. Estimation and Validation of Indicators for Orthogonal Experimental Results
The classification performance index for the best operating parameters combination A2B2C1 can be estimated. First, the average value of the experimental results of in the orthogonal experiment of calcined petroleum coke classification was calculated, which the value of is 0.657. Then, calculated the deviation between the target values of each corresponding level factor and the average value. Finally, calculated of the optimal combination A2B2C1.
where is the deviation of the target value of factor A from at the Level 2; is the deviation of the target value of factor B from at the Level 2; is the deviation of the target value of factor C from at the Level 1; : Estimated value of for the combination A2B2C1.
The estimated value of = 0.829) for the combination A2B2C1 was compared with the experimental value of for nine sets of orthogonal experiments (Table 6). And the estimated value was greater than the experimental value for any of the sets of orthogonal experiments, so the combination A2B2C1 could be used as the best operating parameters combination.
The optimum operating parameters combination A2B2C1 was used for the classification experiment with calcined petroleum coke as the raw material. The experimental result illustrated that = 83.5%, K = 0.626, and = 52.3 μm. The experimental value of ( = 83.5%) is close to the estimated value ( = 82.9%).
The correlation between the cumulative particle distribution of the fine powder product during the validation test and the product standard of the factory, that the fine powder product meets the actual production requirements of the factory, as shown in Table 9.
In summary, the result of the orthogonal experiment for calcined petroleum coke classification indicates that the estimated value of at the optimal operating parameters combination is similar to the actual experimental value, and the result of the verification experiment illustrates that it conforms to the requirements of factory production. Therefore, the result of the orthogonal experiment is desirable, namely, the best operating parameters combination of the rotor classifier for calcined petroleum coke classification is A2B2C1, where the rotor speed is 1000 rpm, the inlet air volume is 500 m3·h−1, and the feeding speed is 0.685 kg·min−1. Meanwhile, = 83.5%, K = 0.626, and = 52.3 μm.
5. Conclusions
This research investigated the influence of operating parameters on the classification efficiency of a rotor classifier by calcined petroleum coke classification experiments. In the meantime, the operating parameters were optimized by range analysis of classification performance indices. The conclusions are as follows:
- When the inlet air volume and feeding speed are determined, a too high rotor speed can cause a rapid decline in the classification performance due to uneven flow field distribution. The best classification results are achieved at a rotor speed of 1000 rpm.
- The classification performance is negatively affected by an excessively high or low inlet air volume at a determined rotor and feeding speed, while the maximum Newton’s classification efficiency is achieved at an inlet air volume of 500 m3·h−1.
- With the increase in the feeding speed, the classification performance decreased gradually. It is not feasible to simply increase the feeding speed to pursue yield in actual production and application, but a reasonable combination of operating parameters should be considered.
- Given an operating parameter (rotor speed or inlet air volume), there is always a corresponding rotor speed or inlet air volume that makes for the best classification of the calcined petroleum coke in a rotor classifier. Hence, the particle classification process is not only influenced by the strength of the flow field inside the classifier but also by the stability of the flow field and other comprehensive factors.
- The optimum operating parameters combination of calcined petroleum coke classification was obtained by considering the Newton’s classification efficiency and classification accuracy comprehensively, namely, rotor speed is 1000 rpm, inlet air volume is 500 m3·h−1, and feeding speed is 0.685 kg·min−1. In the meantime, the maximum Newton’s classification efficiency (ηN = 83.5%) and the highest classification accuracy (K = 0.626) are obtained.
- The secondary air, as one of the operating parameters, has not been investigated in this paper, and a later study could be devoted to the effect of the secondary air on the classification flow field and classification performance.
Author Contributions
Y.F. provided the design idea of the new classifier and supervised the research. J.P. was responsible for the analysis of experimental results, writing, and editing the manuscript. C.H. and Z.Z. was responsible for making modifications. All authors have read and agreed to the published version of the manuscript.
Funding
This work was supported by the Priority Academic Program Development of Jiangsu Higher Education Institutions (PAPD).
Data Availability Statement
Data are contained within the article.
Conflicts of Interest
The authors declared no potential conflicts of interest with respect to the research, authorship, and/or publication of this article.
References
- Edwards, L. The History and Future Challenges of Calcined Petroleum Coke Production and Use in Aluminum Smelting. Jom 2015, 67, 308–321. [Google Scholar] [CrossRef]
- Qu, Z.; Liu, Y. Market analysis and prediction of calcined coke. Light Met. 2015, 1–3. [Google Scholar] [CrossRef]
- Altun, O. Air classification performances of the components within the varied feed blends. Powder Technol. 2022, 399, 117092. [Google Scholar] [CrossRef]
- Chen, J.T.; Zhou, H.H.; Chang, W.B.; Ci, Y.X. Effect of particle size on lithium intercalation performance of graphite anode. Acta Phys.-Chim. Sin. 2003, 19, 278–282. [Google Scholar]
- Eswaraiah, C.; Angadi, S.I.; Mishra, B.K. Mechanism of particle separation and analysis of fish-hook phenomenon in a circulating air classifier. Powder Technol. 2012, 218, 57–63. [Google Scholar] [CrossRef]
- Karunakumari, L.; Eswaraiah, C.; Jayanti, S.; Narayanan, S.S. Experimental and numerical study of a rotating wheel air classifier. Aiche J. 2005, 51, 776–790. [Google Scholar] [CrossRef]
- Shapiro, M.; Galperin, V. Air classification of solid particles: A review. Chem. Eng. Process.-Process Intensif. 2005, 44, 279–285. [Google Scholar] [CrossRef]
- Xie, R.; Wang, X.; Xie, J.; Sun, X. Application status and development trend of ultra-micro pulverization technology. China Powder Technol. 2009, 15, 64–67. [Google Scholar]
- Guizani, R.; Mhiri, H.; Bournot, P. Effects of the geometry of fine powder outlet on pressure drop and separation performances for dynamic separators. Powder Technol. 2017, 314, 599–607. [Google Scholar] [CrossRef]
- Liu, R.; Liu, J.; Yu, Y. Effects of axial inclined guide vanes on a turbo air classifier. Powder Technol. 2015, 280, 1–9. [Google Scholar] [CrossRef]
- Yu, Y.; Kong, X.; Ren, C.; Liu, J. Effect of the rotor cage chassis on inner flow field of a turbo air classifierEinfluss des Kafiglaufergehauses auf das innere Stromungsfeld von einem Turbowindsichter. Mater. Werkst. 2021, 52, 772–780. [Google Scholar] [CrossRef]
- Betz, M.; Gleiss, M.; Nirschl, H. Effects of Flow Baffles on Flow Profile, Pressure Drop and Classification Performance in Classifiers. Processes 2021, 9, 1213. [Google Scholar] [CrossRef]
- Ren, W.; Liu, J.; Yu, Y. Design of a rotor cage with non-radial arc blades for turbo air classifiers. Powder Technol. 2016, 292, 46–53. [Google Scholar] [CrossRef]
- Dang, D.; Wang, K. Effect of classifying wheel speed on particle size distribution. China Powder Technol. 2016, 22, 82–85. [Google Scholar]
- Gao, L.; Yu, Y.; Liu, J. Influence of the rotating speed of the vortex air classifier on its classification accuracy. J. Chem. Eng. 2012, 63, 1056–1062. [Google Scholar]
- Feng, Y.; Liu, J.; Liu, S. Effects of operating parameters on flow field in a turbo air classifier. Miner. Eng. 2008, 21, 598–604. [Google Scholar] [CrossRef]
- Guo, L.; Liu, J.; Liu, S. Flow Field Characteristics of the Rotor Cage in Turbo Air Classifiers. Chin. J. Mech. Eng. 2009, 22, 426–432. [Google Scholar] [CrossRef]
- Liu, R.; Liu, J.; Yu, Y. Study of matching inlet air velocity and rotating cage speed in vortex air classifier. Chem. Eng. 2015, 43, 41–45. [Google Scholar]
- Zeng, Y.; Zhang, S.; Zhou, Y.; Li, M. Numerical Simulation of a Flow Field in a Turbo Air Classifier and Optimization of the Process Parameters. Processes 2020, 8, 237. [Google Scholar] [CrossRef]
- Denmud, N.; Baite, K.; Plookphol, T.; Janudom, S. Effects of Operating Parameters on the Cut Size of Turbo Air Classifier for Particle Size Classification of SAC305 Lead-Free Solder Powder. Processes 2019, 7, 427. [Google Scholar] [CrossRef]
- Yu, Y.; Ren, W.; Gao, L.; Liu, J. Analysis and optimization of process parameters affecting classification performances indices of the turbo air classifier. Mater. Werkst. 2015, 46, 970–977. [Google Scholar] [CrossRef]
- Kundu, T.; Das, S.K.; Tripathy, S.K.; Angadi, S.I. Performance evaluation of the VSK separator for treating mineral fines. Miner. Eng. 2021, 167, 106883. [Google Scholar] [CrossRef]
- Sun, Z.; Liang, L.; Liu, C.; Zhu, Y.; Zhang, L.; Yang, G. CFD simulation and performance optimization of a new horizontal turbo air classifier. Adv. Powder Technol. 2021, 32, 977–986. [Google Scholar] [CrossRef]
- Zeng, C.; Liu, C.; Chen, H. Effect of secondary air volume on the classification performance of LNJ-36A airflow classifier. Chem. Prog. 2015, 34, 3859–3863. [Google Scholar]
- Jia, F.; Mou, X.; Fang, Y.; Chen, C. A New Rotor-Type Dynamic Classifier: Structural Optimization and Industrial Applications. Processes 2021, 9, 1033. [Google Scholar] [CrossRef]
- Mou, X.; Jia, F.; Fang, Y.; Chen, C. CFD-Based Structural Optimization of Rotor Cage for High-Efficiency Rotor Classifier. Processes 2021, 9, 1148. [Google Scholar] [CrossRef]
- Li, Q.; Mou, X.; Fang, Y. Effects of a Guide Cone on the Flow Field and Performance of a New Dynamic Air Classifier. Processes 2022, 10, 874. [Google Scholar] [CrossRef]
- Yang, L.; Sun, Z.; Yang, X.; Sun, G.; Zhou, Y. Study on the classification performance of a horizontal wheel type FCC catalyst classifier. J. Pet. (Pet. Process.) 2019, 35, 66–72. [Google Scholar]
- Fang, Y.; Li, Z.; Kong, W. tudy on the optimal working condition of high-efficiency rotor type powder separator. J. Beijing Univ. Technol. 2010, 30, 1488–1491. [Google Scholar]
Figure 1.
Three-dimensional structure view (a) and working principle (b) of the rotor classifier: 1—air and material inlet, 2—coarse powder outlet, 3—cone area, 4—guide cone, 5—classifying chamber, 6—rotor cage, 7—air and fine powder outlet, 8—transmission shaft.
Figure 1.
Three-dimensional structure view (a) and working principle (b) of the rotor classifier: 1—air and material inlet, 2—coarse powder outlet, 3—cone area, 4—guide cone, 5—classifying chamber, 6—rotor cage, 7—air and fine powder outlet, 8—transmission shaft.
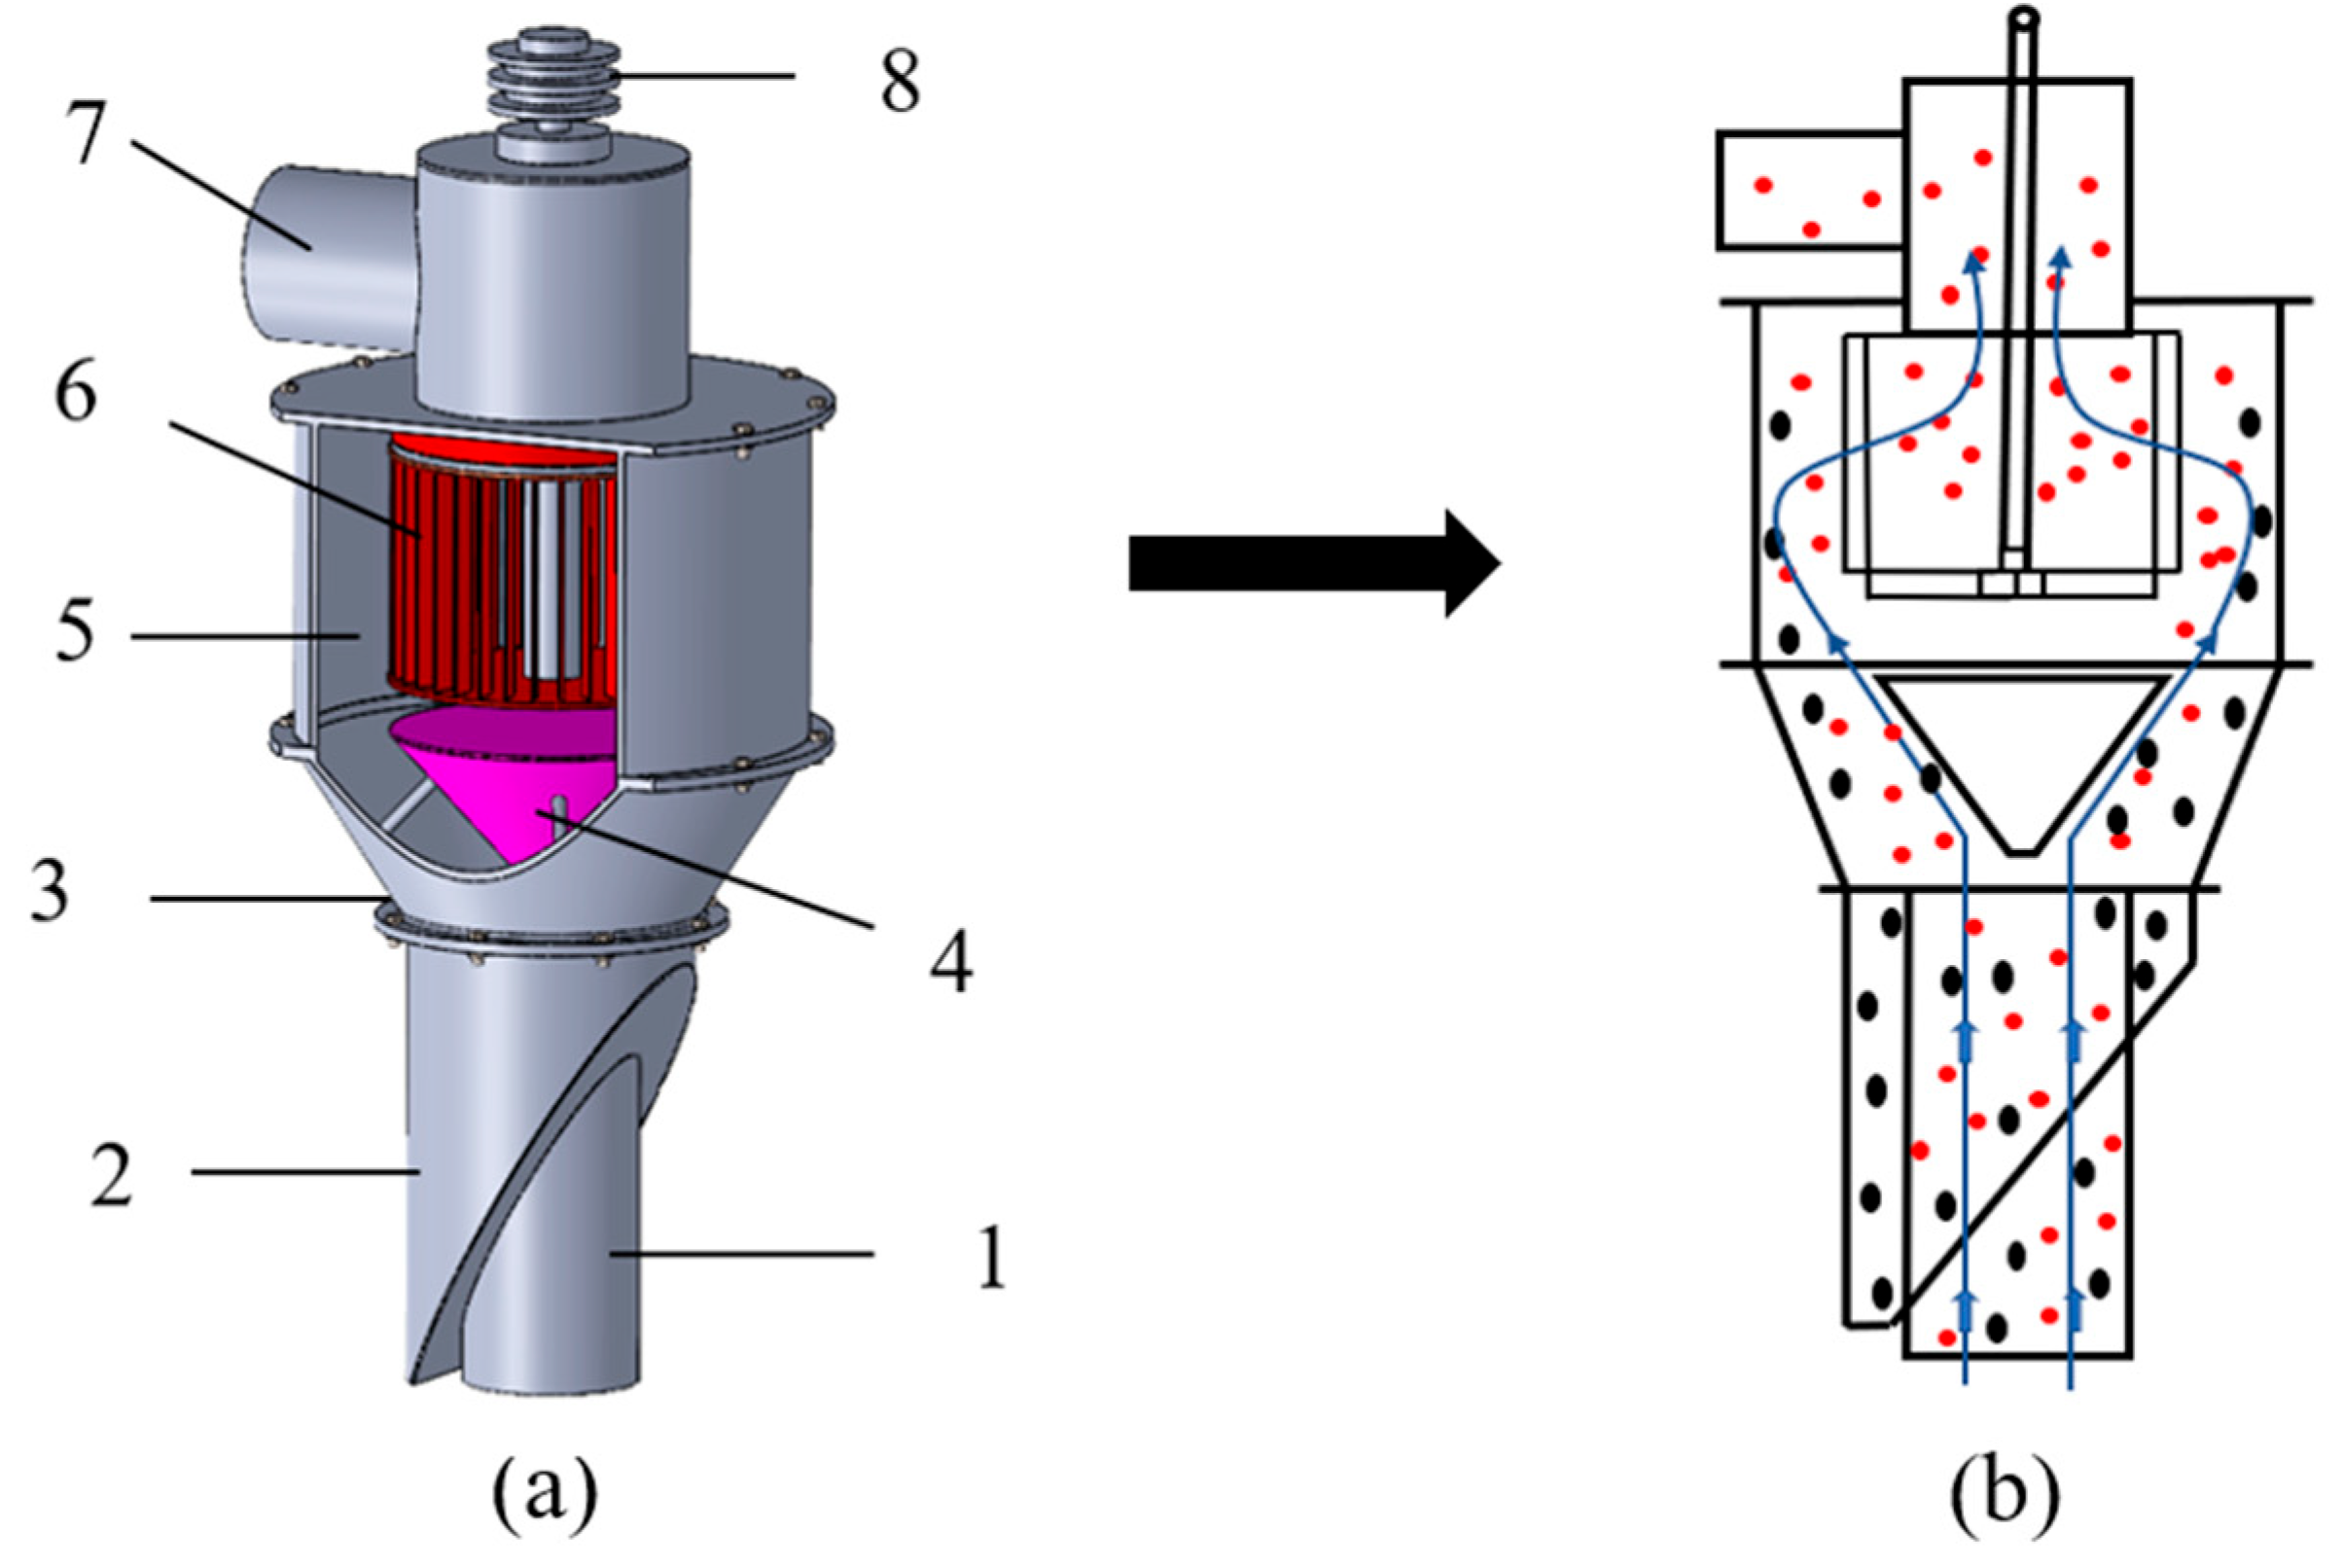
Figure 2.
Particle size distribution of the raw material.
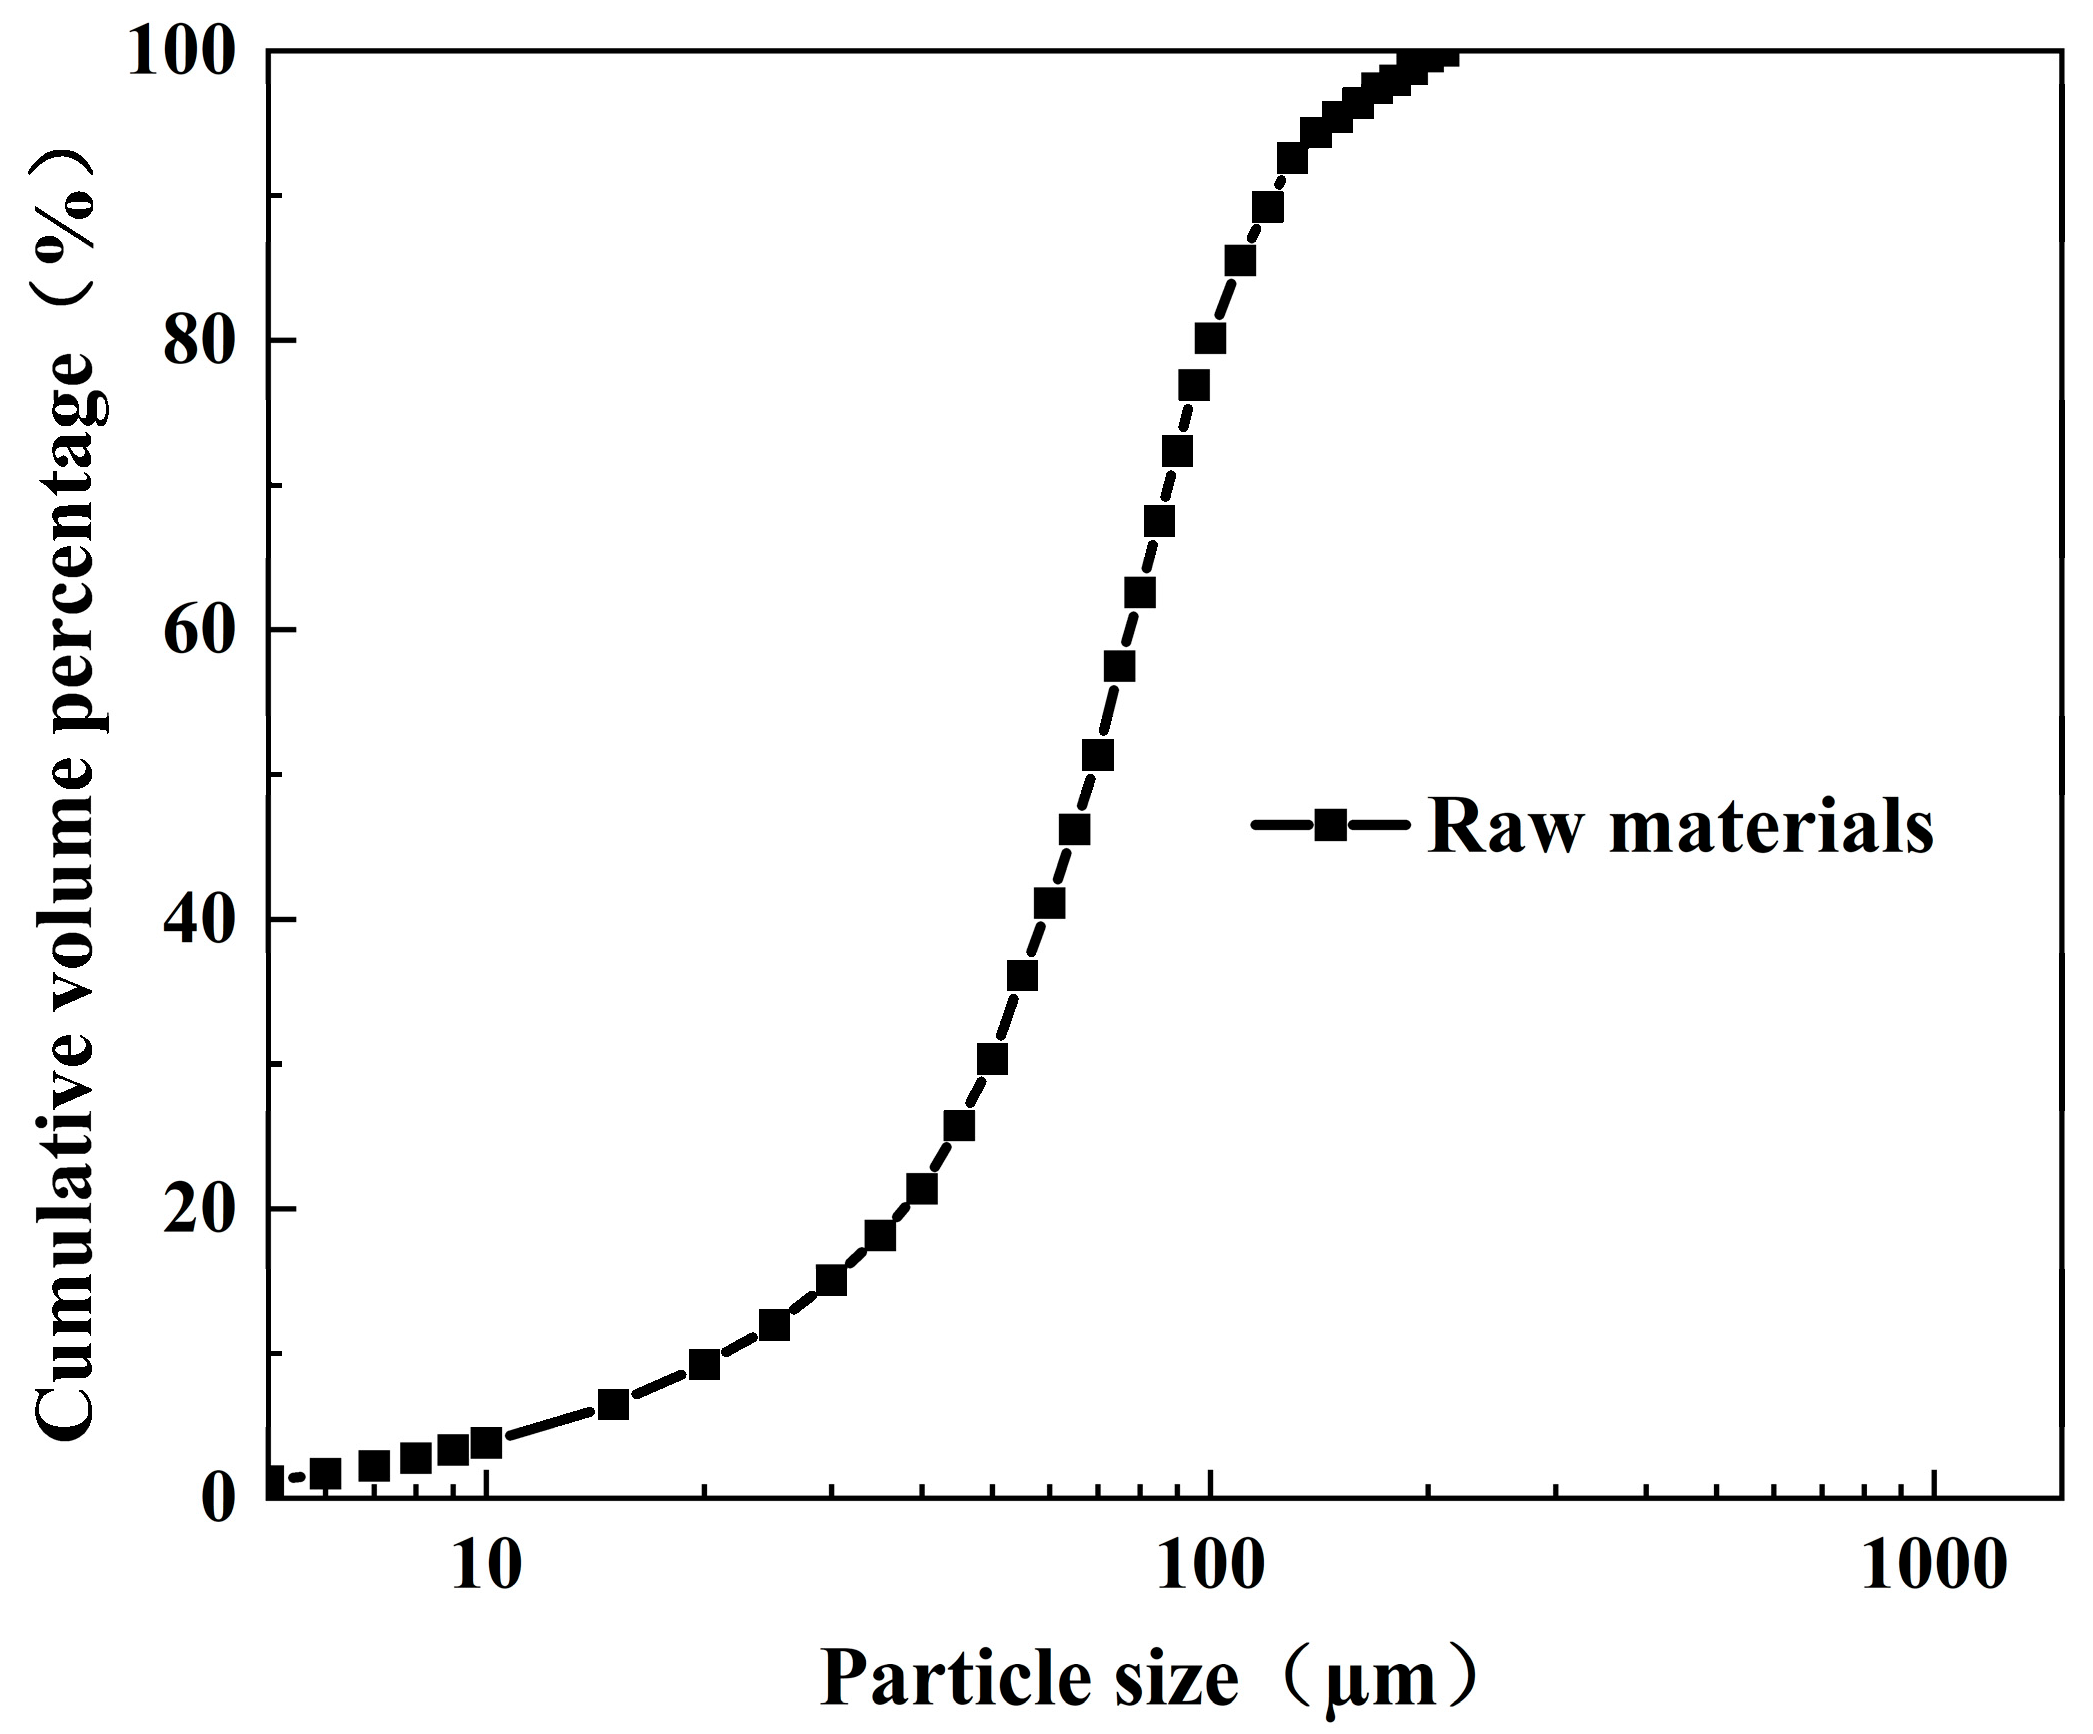
Figure 3.
The classification experimental system: 1—screw feeder, 2—pitot tube, 3—the static classifier, 4—the rotor classifier, 5—cyclone, 6—bag filter, 7—Bettersize2000, 8—induced draft fan.
Figure 3.
The classification experimental system: 1—screw feeder, 2—pitot tube, 3—the static classifier, 4—the rotor classifier, 5—cyclone, 6—bag filter, 7—Bettersize2000, 8—induced draft fan.

Figure 4.
Dimensional diagram of the rotor classifier (mm).

Figure 5.
Newton’s classification efficiency and recovery rate of the coarse and fine powder of different rotor speed.
Figure 5.
Newton’s classification efficiency and recovery rate of the coarse and fine powder of different rotor speed.
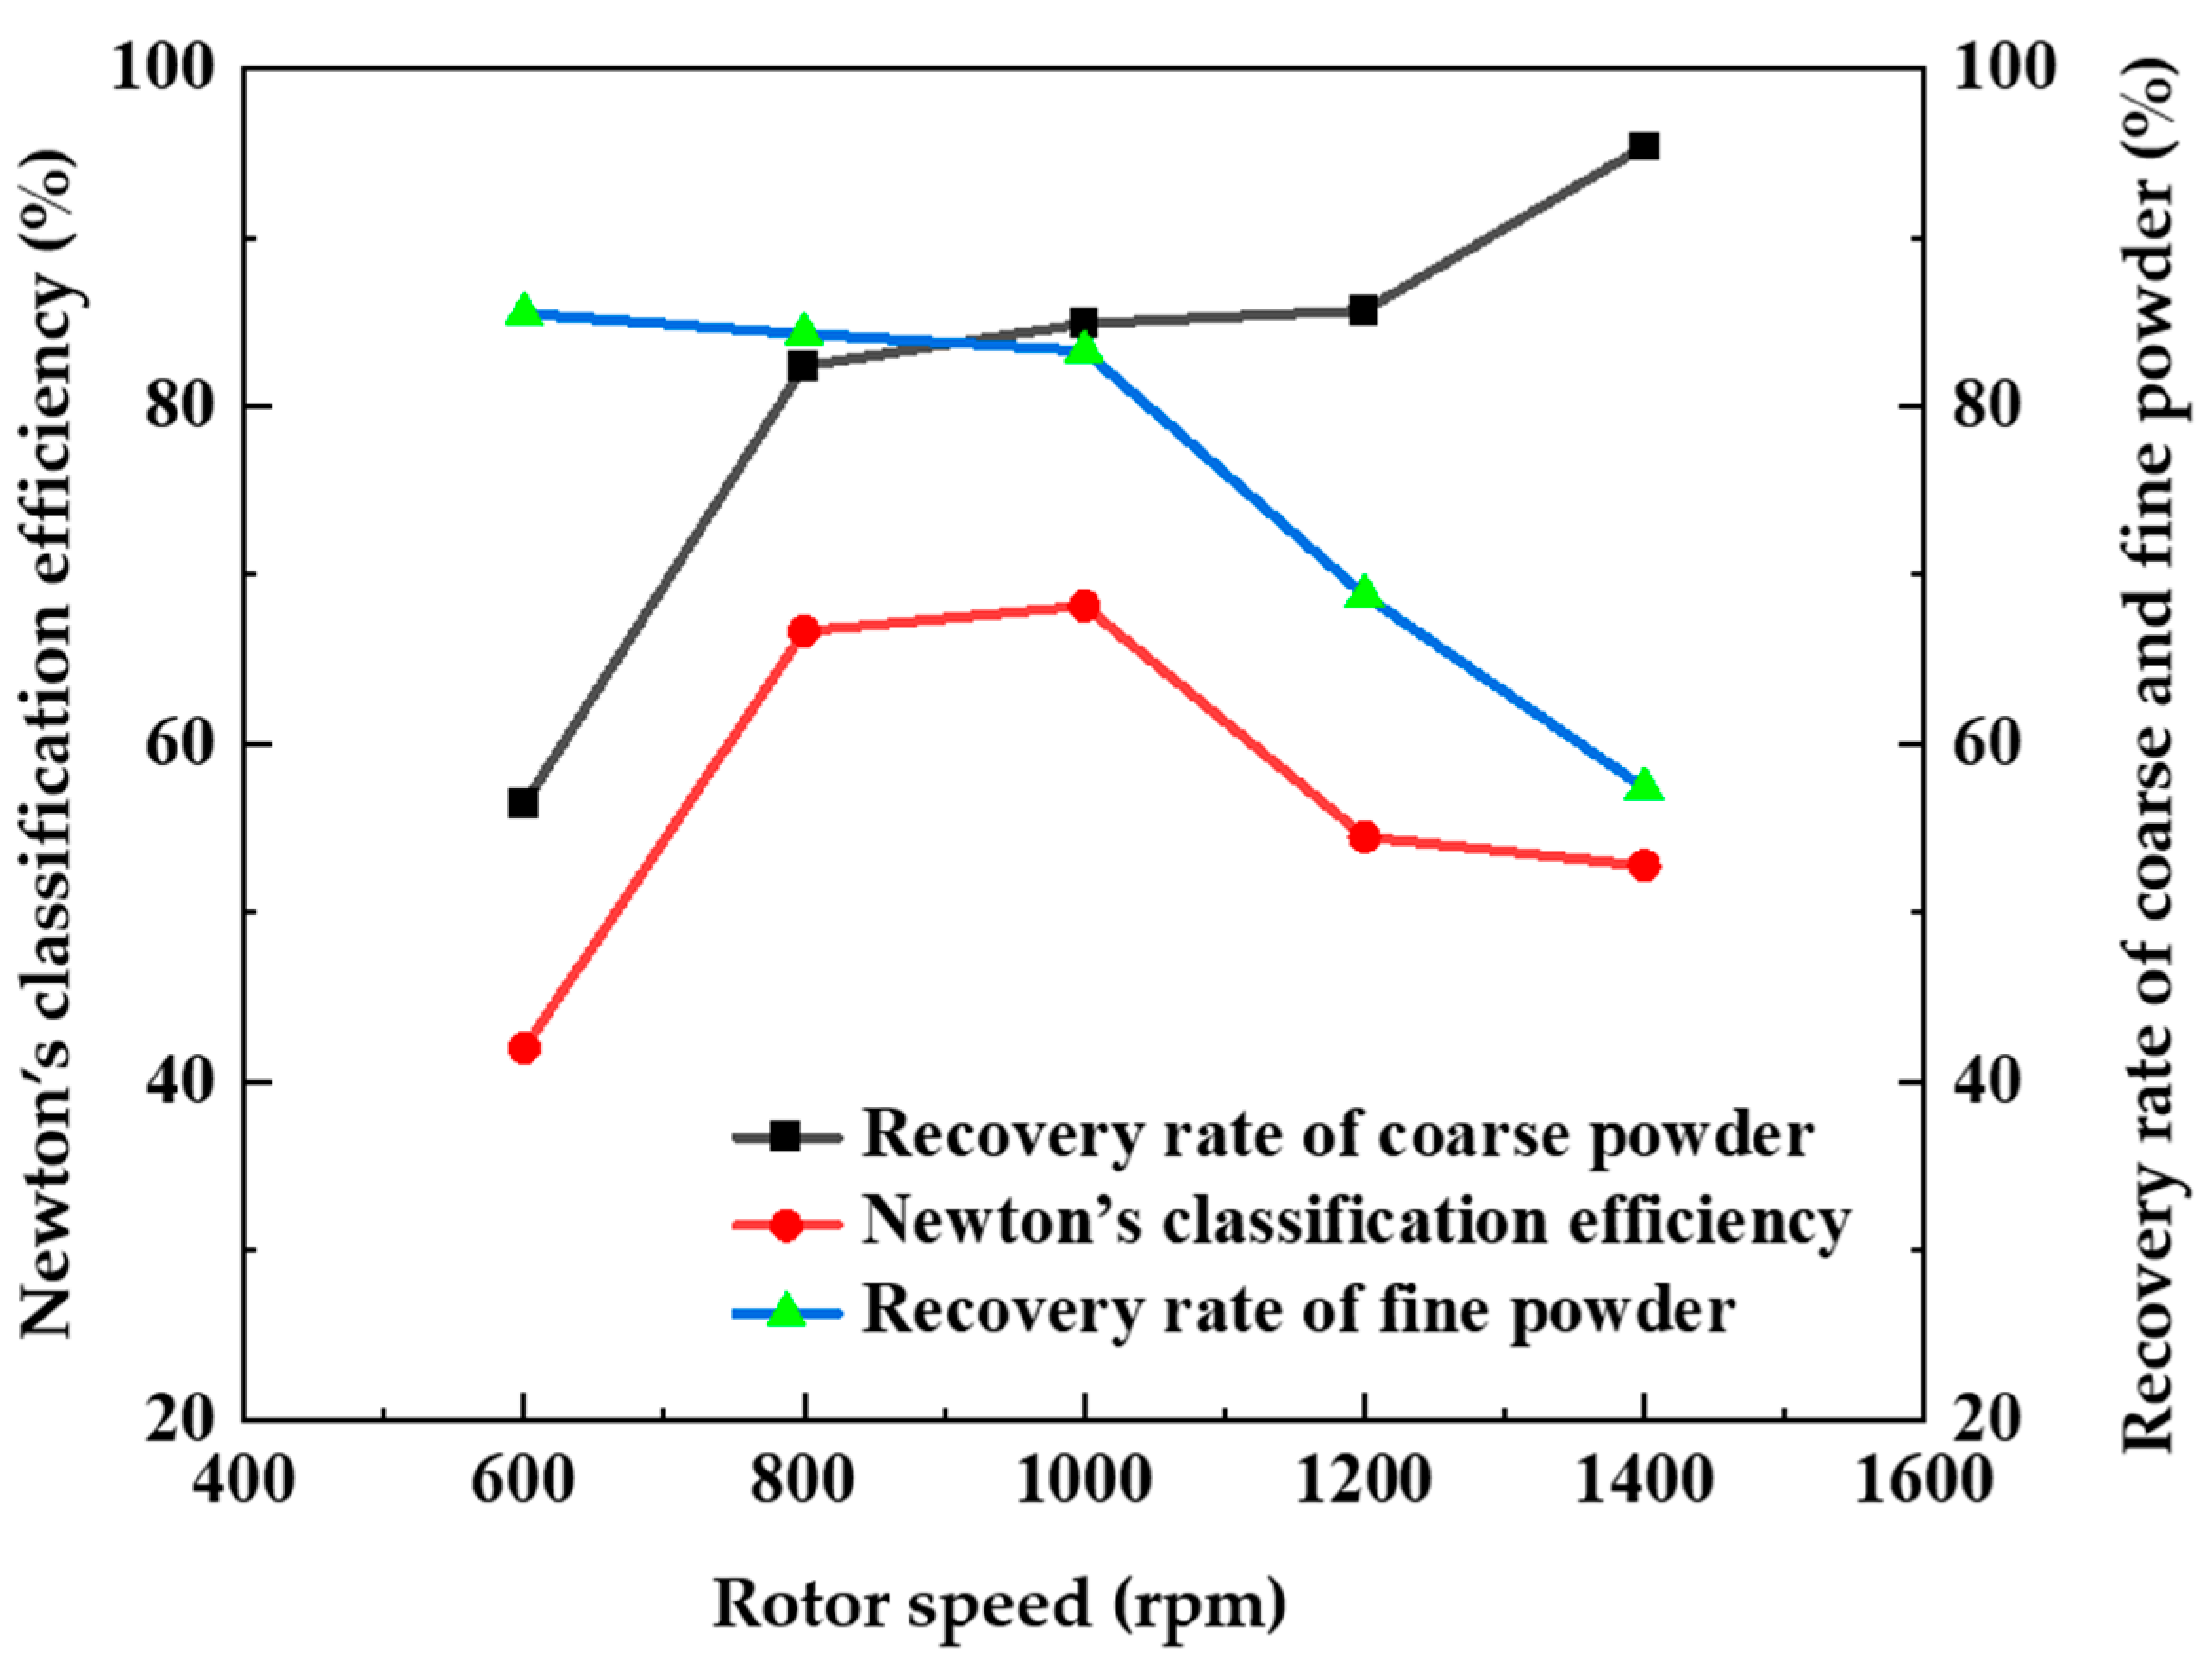
Figure 6.
Classification accuracy of different rotor speeds.
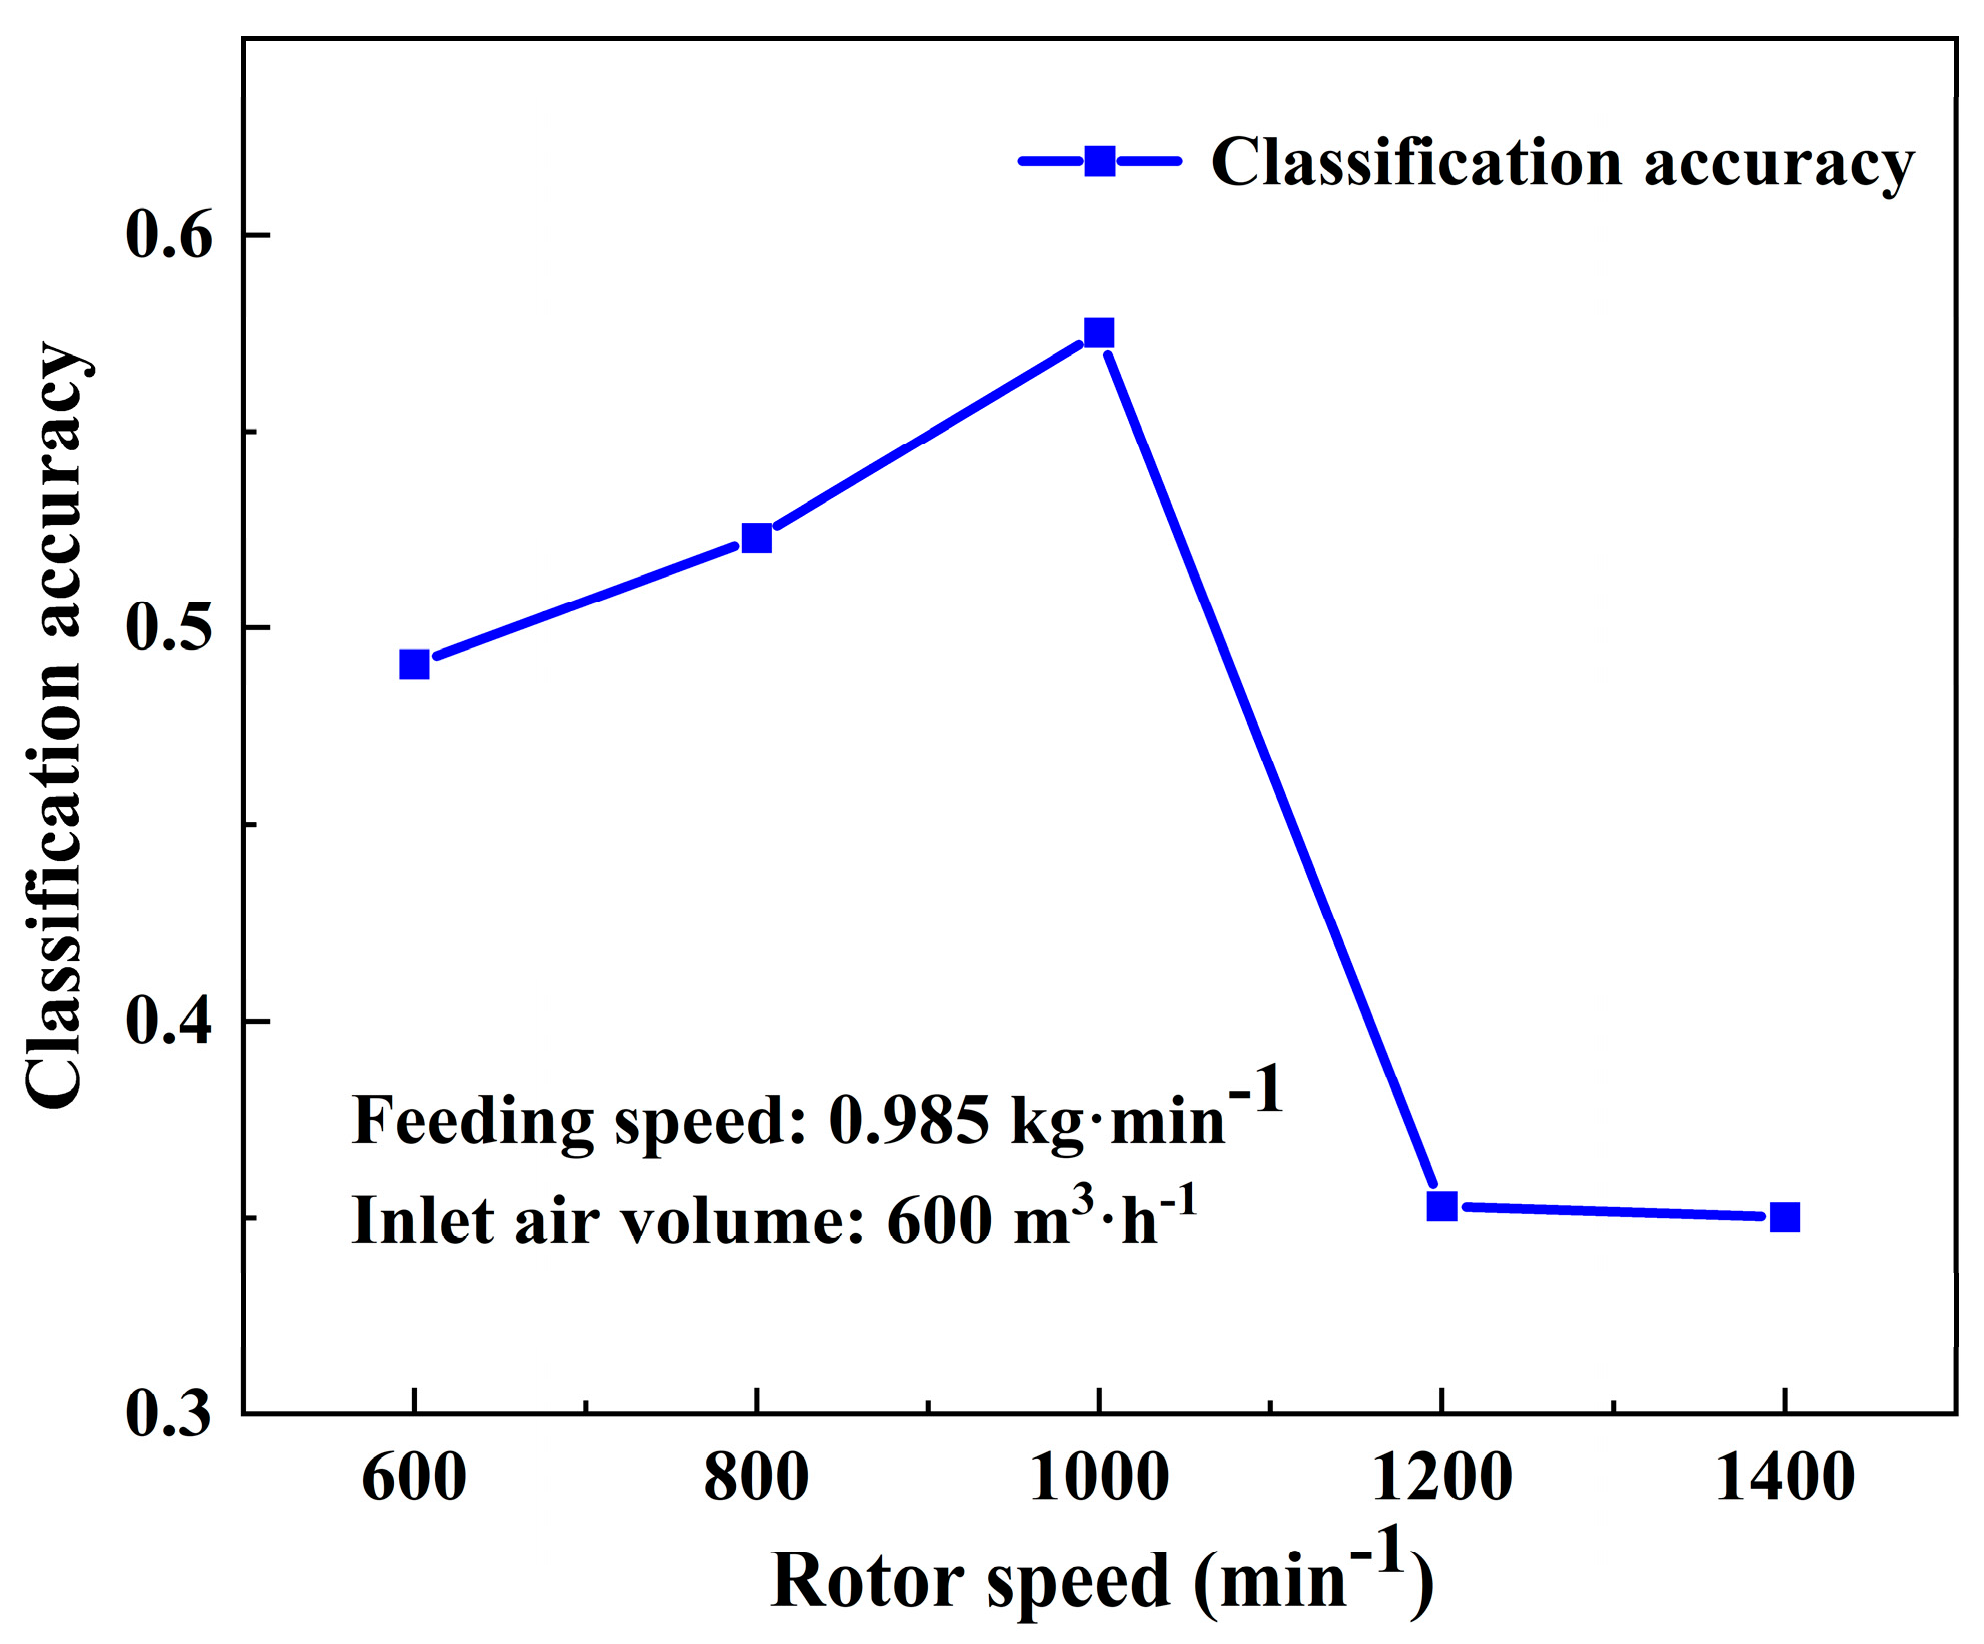
Figure 7.
Partial classification efficiency curves of different inlet air volumes.
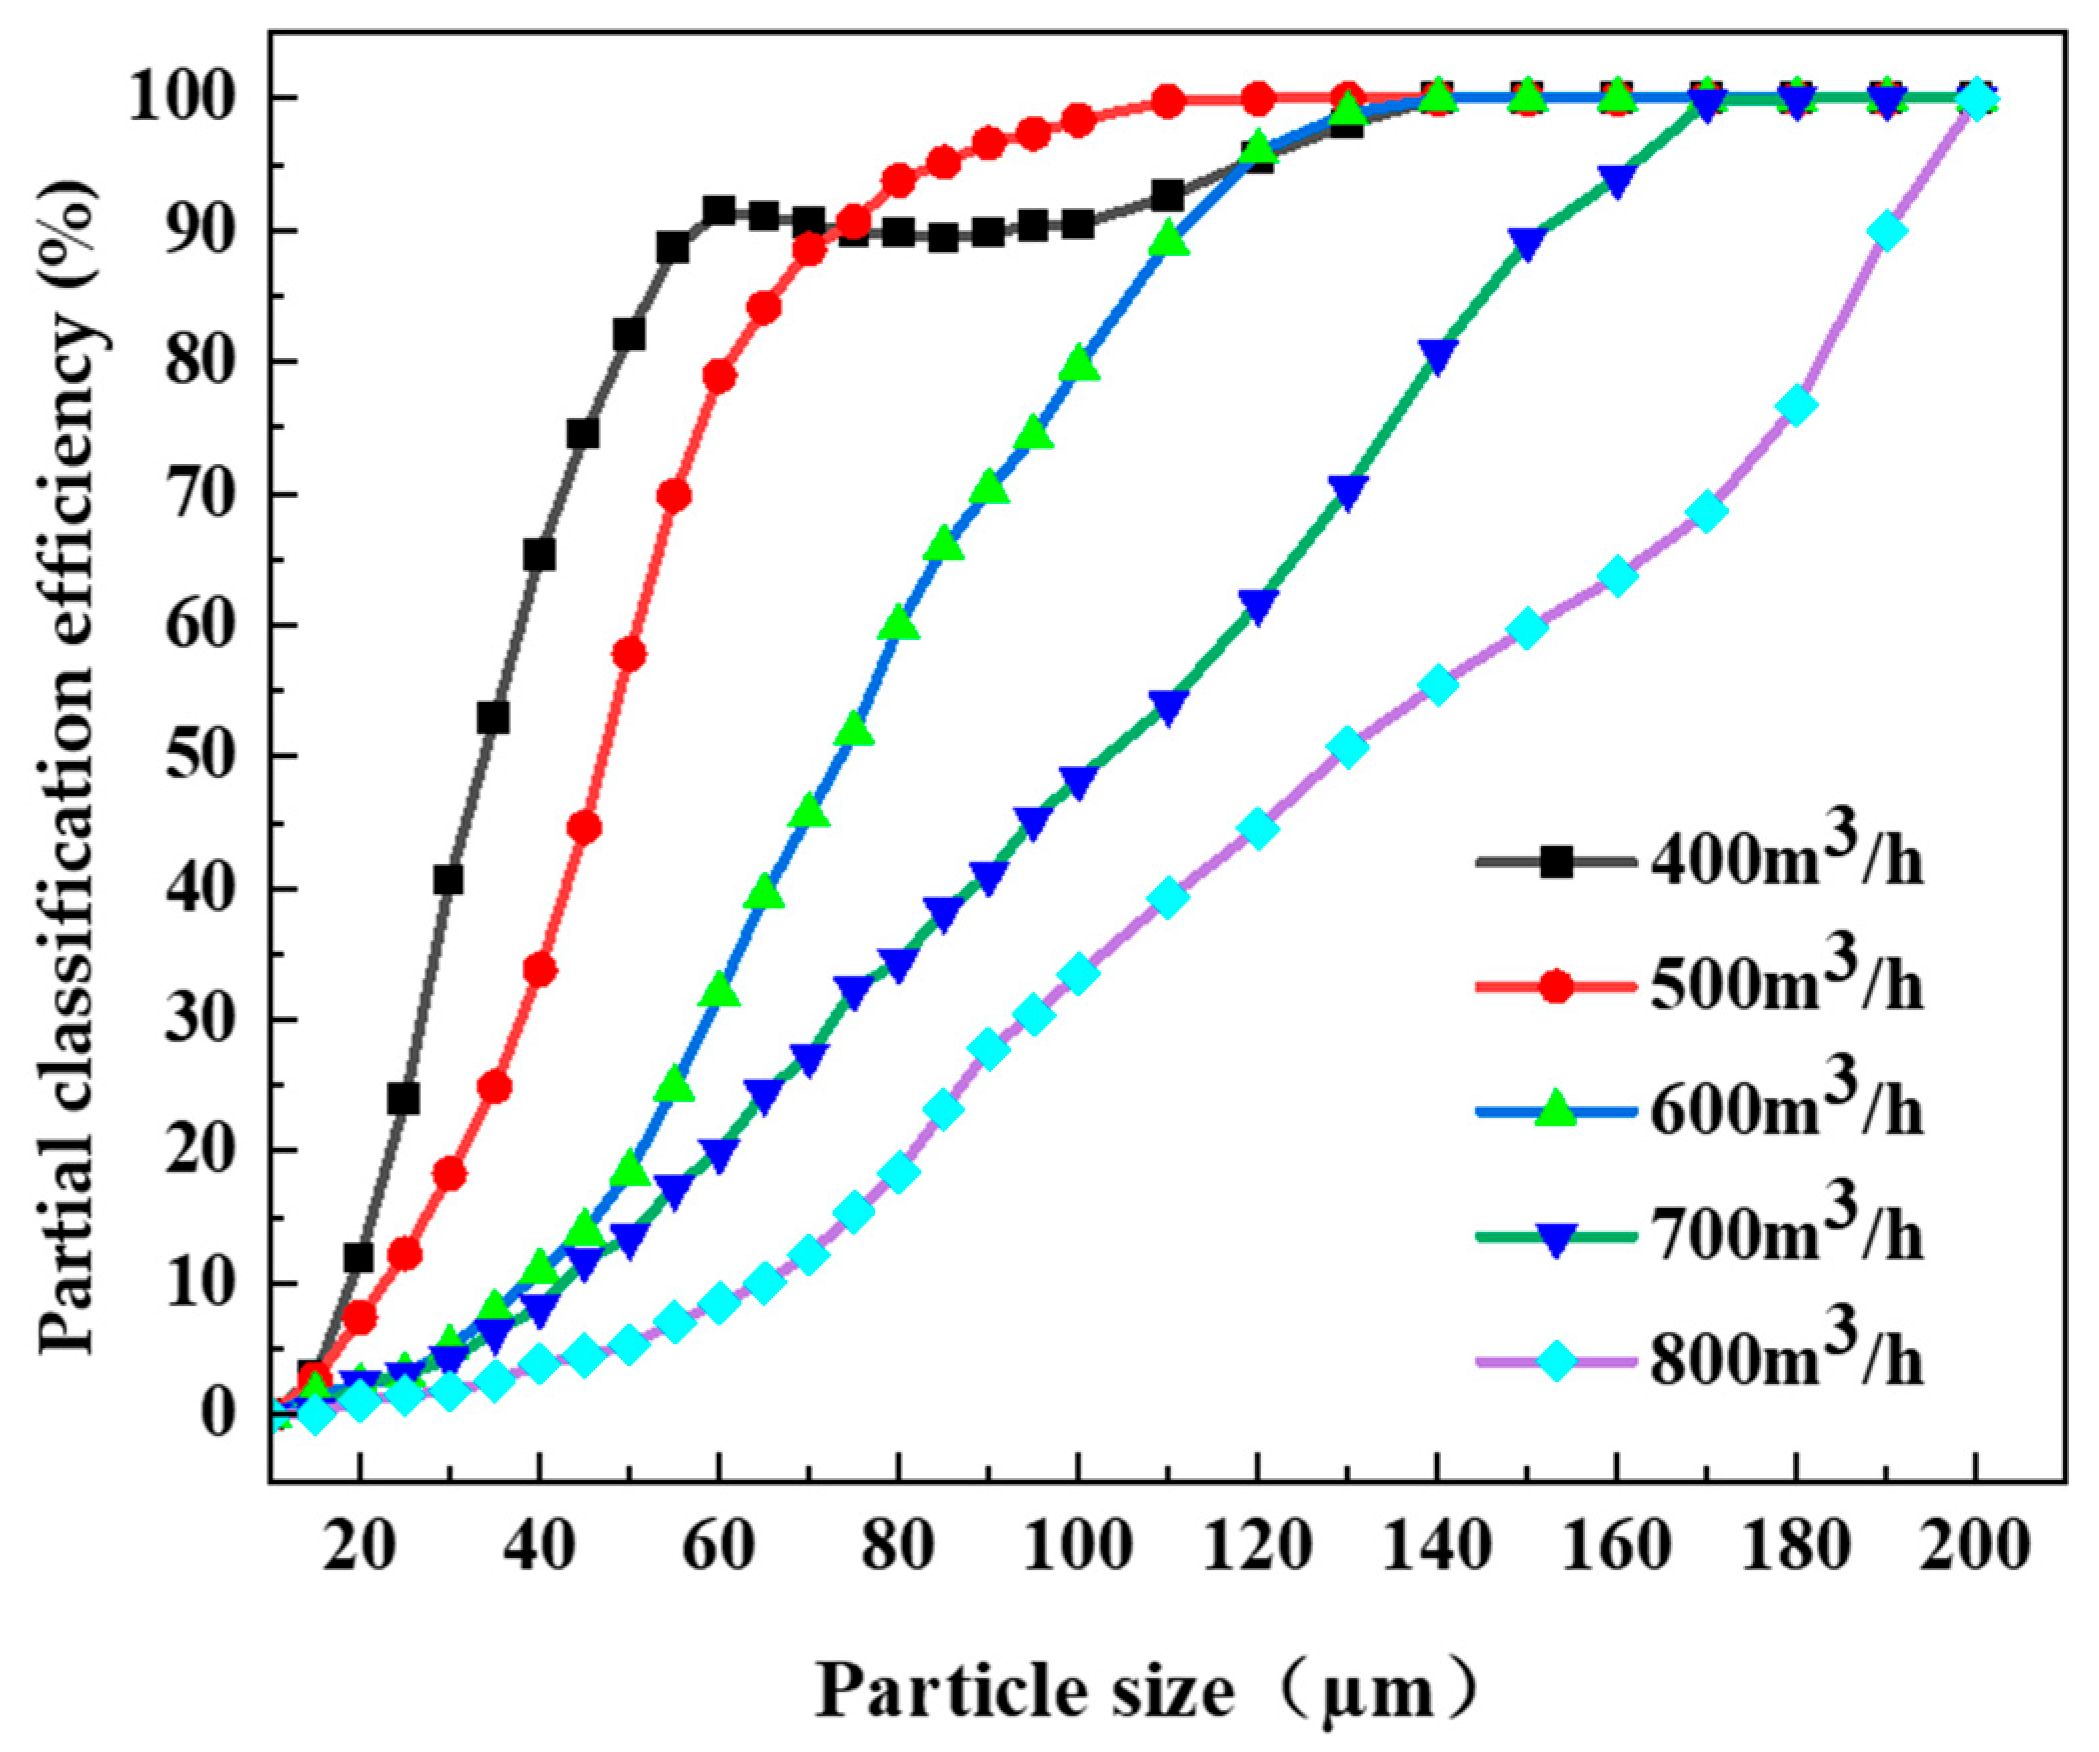
Figure 8.
Newton’s classification efficiency and recovery rate of the coarse and fine powder of different feeding speeds.
Figure 8.
Newton’s classification efficiency and recovery rate of the coarse and fine powder of different feeding speeds.

Table 1.
The classification system equipment list.
| No. | Name of Equipment | Specification Type (Manufacturer, Location) | Technical Parameters | Note |
|---|---|---|---|---|
| 01 | Raw material silo | φ600 (Green Energy Co., Ltd., Hangzhou, China) | Effective volume 0.2 m3 | |
| 02 | Single tube screw feeder | LX-φ122*1200 (Green Energy Co., Ltd., Hangzhou, China) | Feed rate 10~200 kg·h−1 Reduction motor power 1.1 kW | Inverter speed control |
| 03 | Static disperser | FS-15 (Powder Research Institute Of Nanjing Tech University, Nanjing, China) | ||
| 04 | Rotor classifier | ZF-15 (Powder Research Institute Of Nanjing Tech University, Nanjing, China) | Treatment air volume 300~1200 m3·h−1 Rotor speed 200~1450 rpm Motor power 2.2 kW | Inverter speed control |
| 05 | Cyclone dust collector | φ300 (Powder Research Institute Of Nanjing Tech University, Nanjing, China) | ||
| 06 | Bag filter dust collector | HMC-32A (Zhejiang Lantian Dust Exclusion Equipment Co., Ltd., Haining, China) | Filter area 24 m2 | |
| 07 | Centrifugal fan | 9-19 (Huashide Shandong Fan Co., Ltd., Shandong, China) | Air volume 300~2200 m3·h−1 Full pressure 6870~5680 Pa Motor power 11 kW | Damper adjustment |
Table 2.
Cut size of different rotor speeds.
| Rotor Speed (rpm) | (μm) |
|---|---|
| 600 | 134.6 |
| 800 | 88.3 |
| 1000 | 73.6 |
| 1200 | 65.4 |
| 1400 | 44 |
Table 3.
Experimental data of different inlet air volumes.
| Inlet Air Volume (m3·h−1) | (%) | (%) | (%) |
|---|---|---|---|
| 400 | 79.4 | 90.9 | 70.3 |
| 500 | 87.9 | 89.9 | 76.8 |
| 600 | 83.3 | 84.9 | 68.2 |
| 700 | 90.0 | 62.5 | 52.5 |
| 800 | 94.3 | 51.4 | 45.7 |
Table 4.
Cut size of different feeding speeds.
| Feeding Speed (kg·min−1) | (μm) | K |
|---|---|---|
| 0.685 | 85.7 | 0.604 |
| 0.985 | 73.6 | 0.575 |
| 1.350 | 72.0 | 0.509 |
| 1.680 | 51.7 | 0.463 |
| 2.000 | 49.4 | 0.457 |
Table 5.
Operating parameters and their levels.
| Operating Parameters | Level 1 | Level 2 | Level 3 |
|---|---|---|---|
| A: n (rpm) | 800 | 1000 | 1200 |
| B: Q (m3·h−1) | 400 | 500 | 600 |
| C: f (kg·min−1) | 0.685 | 0.985 | 1.350 |
Table 6.
L9(33) orthogonal experiment for calcined petroleum coke and classification performance indices.
Table 6.
L9(33) orthogonal experiment for calcined petroleum coke and classification performance indices.
| No. | Process Parameters | Classification Performance Indices | ||||
|---|---|---|---|---|---|---|
| n (rpm) | Q (m3·h−1) | f (kg·min−1) | K | |||
| 1 | A1 | B1 | C1 | ) | 0.511 | 61.5 |
| 2 | A1 | B2 | C2 | ) | 0.554 | 74.9 |
| 3 | A1 | B3 | C3 | ) | 0.456 | 103 |
| 4 | A2 | B1 | C2 | ) | 0.562 | 33.8 |
| 5 | A2 | B2 | C3 | ) | 0.482 | 46.1 |
| 6 | A2 | B3 | C1 | ) | 0.604 | 85.7 |
| 7 | A3 | B1 | C3 | ) | 0.630 | 26.2 |
| 8 | A3 | B2 | C1 | ) | 0.309 | 35.7 |
| 9 | A3 | B3 | C2 | ) | 0.387 | 65.4 |
Table 7.
L9(33) orthogonal experimental results and its range analysis.
| A | B | C | |
|---|---|---|---|
| 3 | 3 | 3 | |
| max {} − min {} | max {} − min {} | max {} − min {} | |
j: the number of factors {A, B, C}. : the experimental values of . : the sum of the experimental values of the Level 1 for factor j. : the sum of the experimental values of the Level 2 for factor j. : the sum of the experimental values of the Level 3 for factor j. : the frequency of occurrence of the same level for factor j. /: the average value of the experimental values of the Level 1 for factor j. /: the average value of the experimental values of the Level 2 for factor j. /: the average value of the experimental values of the Level 3 for factor j. : the range of factor j, can be calculated as max {, ,} − min {, ,}.
Table 8.
Range analysis of classification performance indices.
| K | |||||||||
|---|---|---|---|---|---|---|---|---|---|
| A | B | C | A | B | C | A | B | C | |
| 2.08 | 1.86 | 2.11 | 1.52 | 1.68 | 1.56 | 239.4 | 121.5 | 190.2 | |
| 2.15 | 2.17 | 1.98 | 1.65 | 1.49 | 1.47 | 165.6 | 164.0 | 174.1 | |
| 1.68 | 1.89 | 1.82 | 1.41 | 1.41 | 1.55 | 134.6 | 254.1 | 175.3 | |
| 3 | 3 | 3 | 3 | 3 | 3 | 3 | 3 | 3 | |
| 0.693 | 0.620 | 0.703 | 0.507 | 0.560 | 0.520 | 79.800 | 40.500 | 63.400 | |
| 0.717 | 0.723 | 0.660 | 0.550 | 0.497 | 0.490 | 55.200 | 54.667 | 58.033 | |
| 0.560 | 0.630 | 0.607 | 0.470 | 0.470 | 0.517 | 44.867 | 84.700 | 58.433 | |
| 0.157 | 0.103 | 0.096 | 0.080 | 0.090 | 0.030 | 34.924 | 44.200 | 5.367 | |
Table 9.
Correlation between the cumulative particle distribution of the fine powder product and the factory product standard.
Table 9.
Correlation between the cumulative particle distribution of the fine powder product and the factory product standard.
| Particle Size Distribution | Product Standard (μm) | Fine Powder Product (μm) |
|---|---|---|
| 7.0 ± 2.0 | 8.314 | |
| 19.0 ± 1.0 | 18.686 | |
| 38.0 ± 3.0 | 39.043 | |
| ≤60 | 58.795 |
: particle diameter at 10% penetration (μm); : particle diameter at 50% penetration (μm); : particle diameter at 90% penetration (μm); : particle diameter at 99% penetration (μm).
Disclaimer/Publisher’s Note: The statements, opinions and data contained in all publications are solely those of the individual author(s) and contributor(s) and not of MDPI and/or the editor(s). MDPI and/or the editor(s) disclaim responsibility for any injury to people or property resulting from any ideas, methods, instructions or products referred to in the content. |
© 2024 by the authors. Licensee MDPI, Basel, Switzerland. This article is an open access article distributed under the terms and conditions of the Creative Commons Attribution (CC BY) license (https://creativecommons.org/licenses/by/4.0/).
Share and Cite
MDPI and ACS Style
Peng, J.; Hui, C.; Zhao, Z.; Fang, Y. Research and Optimization of Operating Parameters of a Rotor Classifier for Calcined Petroleum Coke. Processes 2024, 12, 603. https://doi.org/10.3390/pr12030603
AMA Style
Peng J, Hui C, Zhao Z, Fang Y. Research and Optimization of Operating Parameters of a Rotor Classifier for Calcined Petroleum Coke. Processes. 2024; 12(3):603. https://doi.org/10.3390/pr12030603
Chicago/Turabian StylePeng, Jiaxiang, Chenxi Hui, Ziwei Zhao, and Ying Fang. 2024. "Research and Optimization of Operating Parameters of a Rotor Classifier for Calcined Petroleum Coke" Processes 12, no. 3: 603. https://doi.org/10.3390/pr12030603
Note that from the first issue of 2016, this journal uses article numbers instead of page numbers. See further details here.